Article

Synthesis of Activated Biochar from the Bark of Moringa oleifera for Adsorption of the Drug Metronidazole Present in Aqueous Medium

by
Caio Henrique da Silva
1,*,
Thiago Peixoto de Araújo
1,
Alexandre Teixeira de Souza
2,
Mara Heloisa Neves Olsen Scaliante
1 and
Wardleison Martins Moreira
3
1
Department of Chemical Engineering, State University of Maringa, Maringá 87020-900, Paraná, Brazil
2
Department of Engineering, Adamantina University Center, Adamantina 17800-000, São Paulo, Brazil
3
CERES—Chemical Engineering and Renewable Resources for Sustainability, Department of Chemical Engineering, University of Coimbra, Rua Sílvio Lima, 3030-790 Coimbra, Portugal
*
Author to whom correspondence should be addressed.
Processes 2024, 12(3), 560; https://doi.org/10.3390/pr12030560
Submission received: 7 February 2024 / Revised: 9 March 2024 / Accepted: 11 March 2024 / Published: 13 March 2024
(This article belongs to the Special Issue Separation Processes for Environmental Preservation)

Abstract

:
Moringa oleifera seeds, in particular, have been used for water and wastewater treatment due to their ability to remove many pollutants. Therefore, the present work aims to produce bioadsorbent materials by pyrolysis using biomass from the seed shell of Moringa oleifera to remove the drug Metronidazole present in an aqueous medium. The biochars produced were activated with phosphoric acid (H3PO4) and potassium hydroxide (KOH) to compare the material’s modifications and adsorption mechanisms with the biochar in nature (BCM). The biochars were characterized by Point-of-zero charges (pHpzc), Scanning Electron Microscopy (SEM), X-ray Diffractometry (XRD), Fourier transform infrared spectroscopy (FTIR), and Raman spectroscopy. The studies showed that the adsorption behavior varied with the pH of the solution. The adsorption study verified that the activated biochars presented better results, so in the kinetic study, the adsorption behavior occurred rapidly in the initial minutes until stabilizing within 3–4 h, better fitting the Elovich model. Isotherm models were tested, where the experimental data were adjusted to the Sips model, with an adsorption capacity of 18 mg g−1 for acid-activated biochar (BCH3PO4) and KOH-activated biochar (BCKOH) with 366.49 mg g−1. The results showed that biochars, especially BCKOH, become viable for production because they are a low-cost material and highly effective in removing drugs.

1. Introduction

The industrial sector has developed rapidly in recent years, improving people’s conditions and quality of life. However, industrial development has also caused some environmental problems. With the rapid increase in the types and levels of pollutants, water resources are getting worse.
Due to urbanization, the pharmaceutical industry has been expanding in the generation of its products, especially antibiotics, and one of the consequences of this expansion is an increase in waste generation. With the growing demand to meet human needs, drugs have significantly increased production scale, where new resources are managed to discover new drugs and also for more efficient production [1].
Emerging contaminants (CEs) constitute a group of chemical pollutants that pose potential threats to human health and the environment. They are highly complex organic compounds, typically found in water. CEs commonly originate from pharmaceuticals, personal care products, endocrine-disrupting chemicals, antibiotics, persistent organic pollutants, disinfection by-products, and other industrial chemicals [2]. These contaminants persist in the environment and endure for an extended period. ECs are in a continual state of circulation, migration, and transformation within environmental mediums. Despite their relatively low concentrations in water, the potential environmental and human health impact arises as these ECs can accumulate in organisms and subsequently affect the food chain [3].
Metronidazole (MNZ) is an effective medication for treating infections caused by parasites and anaerobic bacteria, including Helicobacter pylori, Giardia lamblia, and Trichomonas vaginalis [4,5]. MNZ in water has a high pollutant potential, causing carcinogenic and mutagenic effects [5], and is included in the National Toxicology Program (NTP) carcinogenic list [6].
A cost-effective and efficient method for eliminating contaminants is adsorption, a process that occurs on the surface and/or within a substance where adsorbates (molecules, ions, atoms) attach to a substrate through chemical or physical interactions [7]. Numerous adsorbent materials are available, and those derived from biomass exhibit particularly promising outcomes.
Biochar, produced through the pyrolysis of various biomass sources, serves dual roles as both a heat- and energy-generating fuel and an adsorbent [8,9]. Abundant and cost-effective raw materials, primarily sourced from animal origins and plant residues like seeds, seed husks, bagasse, organic waste, and grains from agricultural production, contribute to its production [10,11]. Biochar is characterized by a high carbon content, followed by hydrogen and nitrogen, and contains notable concentrations of potassium, sodium, magnesium, and calcium in smaller amounts. The material typically features a substantial specific surface area and a high content of surface functional groups [12,13,14]. Physicochemical properties, such as specific surface area and surface functional group content, vary depending on the type of biomass employed [14,15].
Moringa oleifera, originating from India, is a versatile plant known for its resilience to diverse climate conditions. Besides being rich in protein, its seeds are recognized as a potential natural coagulant. Additionally, the oil extracted from Moringa oleifera seeds finds application in nutrition, cosmetics manufacturing, and bioenergy. Recent studies have underscored its relevance in biodiesel production [16,17,18,19]. With this, there is a growing demand and opportunity for large-scale cultivation. In Brazil, it is cultivated on a large scale in the Northeast region due to its tropical climate.
Considering the difficulties in treating water to obtain potable water, where various contaminants are present in the aqueous medium, especially pharmaceuticals, activated carbon has excellent adsorption properties compared to natural carbon. Moringa oleifera, due to its various uses and large-scale production of fruits, in particular the use of Moringa oleifera seed husks, which are treated as waste in commercial use, becomes economically and environmentally viable to study in the development of bioadsorbents. Therefore, this work aims to produce activated biochar through pyrolysis using Moringa oleifera seed husk biomass to remove the pharmaceutical Metronidazole from the aqueous medium.

2. Materials and Methods

2.1. Raw Material

The seeds of Moringa oleifera were kindly provided by a private company in the Northwest of Paraná—Brazil. The seeds were shelled, and only the shell was used, as they are usually discarded and become waste, making it of great economic and environmental interest. The M. oleifera shells were dried in an oven with air circulation at 65 °C for 24 h to be used as raw material for the pyrolysis module. Due to their relatively small size, the shells were subjected to pyrolysis tests.

2.2. Preparation of the Biochar

Pyrolysis tests are based on a pre-established methodology. The pyrolytic unit used is composed of a fixed stainless steel bed reactor with a gas inlet and outlet (4 cm in diameter × 50 cm high) heated by a double-broken tubular furnace (Sanchis, power 3 kW, 220 V, maximum operating temperature of 1200 °C). Three factors (temperature, heating rate, and residence time) were investigated to evaluate their influence on biochar production. Thus, the experimental design was according to the 2³ factorial with 3 independent factors executed by the Statistica 6.0 software. For the assay, 26 g of M. oleifera seed shells were used, maintaining a constant flow of N2 of 150 mL min−1 throughout the process. The biochars produced in nine different treatments were analyzed by the Statistica software using the results of thermal and mass yield as factors to define only one treatment that could be activated and proceed with the adsorption experiments. The method ANOVA, estimated effects, predicted values and desirability were used for statistical analysis.

2.3. Elementary Biochar Analysis

Elemental analysis was performed at the Analytical Center of the University of São Paulo for the biochar samples from Moringa oleifera seed shells using a CHN Analyzer Series II—Perkin Elmer (Waltham, MA, USA) at a combustion temperature of 925 °C to determine the percentage of carbon, hydrogen, and nitrogen content in the samples.

2.4. Preparation of the Activated Biochar by H3PO4

In this methodology adapted from [20], phosphoric acid H3PO4 (85% Synth) was used to activate the biochar (BCM) chemically. For the impregnation of biochar (BCM) with H3PO4, a ratio of 1:2 (m/v) was used. Thus, 33 g of biochar was mixed with 66 mL of H3PO4 in a stirrer for 4 h, and 200 mL of deionized water was added to facilitate stirring. Then, the material was taken to a drying oven (Quimis-Q317M, Diadema, Brazil) and dried at 105 °C for 24 h. Subsequently, the particles were subjected to the pyrolysis process at a final temperature of 550 °C and held for 60 min, with a slow heating rate of 5 °C min−1 and a constant flow of nitrogen of 150 mL min−1.

2.5. Preparation of the Activated Biochar by KOH

Potassium hydroxide KOH (85% Synth) was used to activate the biochar (BCM) chemically. Thus, a proportion ratio of 1:4 (m/m) was used to impregnate the biochar with KOH. Since the KOH did not have a purity of 100% for this mixture, an addition based on mathematical calculations was made. Thus, 35 g of biochar was mixed with 165 g of KOH in a heated shaker at 210 °C for 3 h, adding 200 mL of deionized water to facilitate mixing. The material was then dried in an oven (Quimis) at 105 °C for 24 h. Afterward, the particles were subjected to pyrolysis at a final temperature of 850 °C and held for 60 min, with a slow heating rate of 5 °C min−1 and a constant nitrogen flow of 150 mL min−1 [21]. The activated biochars were washed with 7 L of deionized water to remove impurities and then submitted to the drying process in a greenhouse at 105 °C for 24 h. The dry biochars underwent the grinding process and were sifted at a fraction smaller than 0.5 mm.

2.6. Characterization

The produced and activated biochars were characterized according to the methodology described in Table 1, just below.

2.7. Adsorption Experiments

Metronidazole (MNZ) solutions were prepared at a concentration of approximately 50 mg L−1 and 250 mg L−1 by dissolving Metronidazole obtained from a compounding pharmacy in sachets with high purity (>99%) with Milli-Q 18.2 MΩ.cm pure water. The concentrations of Metronidazole were measured using a UV-VIS DR500 spectrophotometer from HACH (London, UK) at a wavelength of 320 nm. A calibration curve was constructed for the measurements.
The batch adsorption experiments were conducted in duplicate. Separately, 25 mg of BCM, BCH3PO4, and BCKOH were added to plastic containers with 30 mL of metronidazole solution, with concentrations of approximately 50 mg L−1 and 250 mg L−1. The solution was allowed to interact with the adsorbent for 24 h under agitation in an MA-420 shaker incubator at 150 rpm and a temperature of approximately (25 ± 2 °C). After 24 h, the experiments were filtered through a membrane (cellulose ester 0.45 µm) to separate the adsorbent from the MNZ solution. The concentration of MNZ was determined by UV-VIS absorption spectroscopy.

2.8. Study of the Influence of pH on Adsorption Tests

In order to evaluate the influence of pH, solutions of 50 and 250 mg L−1 of Metronidazole (MNZ) were prepared and adjusted to pH values ranging from 2 to 12. Tests were carried out at each pre-established pH value of 2, 4, 6, 6.7 (natural pH), 8, 10, and 12. For this purpose, each test included 25 mg of BCH3PO4 and BCKOH, and 30 mL of metronidazole solution at the adjusted pH was added.

2.9. Adsorption Kinetics

For the kinetic studies, the mass of the adsorbent used, the solution’s volume, the natural pH of the solution, constant stirring at 150 rpm, and the ambient temperature of 25 °C (±2 °C) were kept constant. Points were collected at different times for reading.
Activated biochar with BCH3PO4 was subjected to kinetic tests with 3 concentrations of metronidazole solution (30, 45, and 60 mg L−1) to evaluate whether it had the exact kinetic model fit. Activated biochar with KOH also followed the same criterion for three different concentrations of metronidazole solution (150, 250, and 350 mg L−1). The models were fitted to the pseudo-first-order model (Equation (1)), pseudo-second-order model (Equation (2)), Elovich model (Equation (3)), and intra-particle diffusion model (Equation (4)) using OriginPro 2019b software for obtaining graphs and statistical analysis.
q t = qe ( 1 - e - k 1 t )
qt = k 2 qe 2   t 1 + k 2   qe   t
qt = 1 B ln   ( 1 + ABt )
qt = k D   t 0.5 + C
where:
  • qt = amount of adsorbed adsorbate (mg g−1) at time t (min).
  • qe = equilibrium and the maximum adsorption capacities (mg g−1).
  • k1 = adsorption rate constant (min−1).
  • k2 = adsorption rate constant (g mg−1 min−1).
  • A = initial adsorption rate (mg g−1 min−1).
  • Β = adsorption constant (mg g−1).
  • kD = intraparticle diffusion coefficient (mg g−1 min−0.5).
  • C = constant (mg g−1).

2.10. Adsorption Isotherms

The adsorption isotherm using BCH3PO4 and BCKOH was obtained at a room temperature of 25 °C. The experiments maintained the adsorbent mass at 25 mg, the solution volume at 30 mL, and the natural pH of the solution. Metronidazole concentrations of (2, 5, 10, 15, 30, 45, 65, 85, 110, and 140 mg L−1) were used for this biochar. For biochar activated with KOH, Metronidazole concentrations of (50, 100, 150, 200, 250, 300, 400, 500, 600, 700, and 800 mg L−1) were used. For this study, Langmuir (Equation (5)), Freundlich (Equation (6)), and Sips (Equation (7)) models were evaluated.
qe = q max   KlCe 1 + KlCe
qe = Kf   Ce 1 / n
qe = q max   ( Ks   Ce ) 1 + ( Ks   Ce ) n n
where:
  • qmax = maximum adsorption capacity, mg g−1.
  • qe = amount of adsorbate concentration in the solid phase in equilibrium, mg g−1.
  • Ce = amount of adsorbate concentration in the liquid phase, mg L−1.
  • Kl = equilibrium constant, affinity between adsorbate and adsorbent, L mg−1.
  • Kf = Freundlich constant relates the adsorption capacity and number of adsorption sites, L mg−1.
  • n = that relates the intensity of the adsorption process (affinity between adsorbent and adsorbate).
  • Ks = Sips constant, with the adsorption energy, L mg−1.

2.11. Recuperation Studies

For the biochar recovery studies, 50 mg of BCH3PO4 and BCKOH were weighed and subjected to batch adsorption process with MNZ solution at concentrations of 50 mg L−1 and 250 mg L−1, respectively, using a temperature of 25 °C (±2) and an agitation speed of 150 rpm in a shaker for approximately 5 h. The samples were filtered for solution reading, and the biochars containing the adsorbed adsorbate were subjected to a thermal process at 450 °C, with a heating rate of 10 °C min−1 and a residence time of 20 min in a Muffle Furnace (Quimis).

3. Results and Discussion

3.1. Immediate Analysis and Elemental Analysis

The yields of the produced biochars ranged from 30.76% to 38.07%, where temperature was the determining factor. At lower temperatures, there is a more remarkable preservation of biomass, where carbonization occurs, unlike at higher temperatures, which increase biomass decomposition. The central points of the parameters are defined as (0), values below the central points as (−1), and values above the central points as (1), the data are presented in Table 2.
The biochar showed a carbon content ranging from 72.97% to 78.39%, as described in Table 1, where a higher carbon content improves the initial formation of biochar pores [23]. This was expected, as according to González-García (2018) [23], the presence of high amounts of C, O, and H is linked to the composition of the three primary structural polymers found in most lignocellulosic precursors: cellulose, hemicellulose, and lignin. Additionally, there are minor non-structural components such as proteins, chlorophylls, ashes, waxes, tannins (in the case of wood), and pectin (in most fibers). In the present work, the carbon contents were above those reported by Santos Bispo et al. (2021) [24], who worked with the pyrolysis of M. oleifera pods with a carbon content of 41.18%.

3.2. Statistical Evaluation of the Biochars Produced under Different Investigated Factors

The data was evaluated by analysis of variance (ANOVA) and the coefficient of determination for yield and carbon content, described in Table 3 and Table 4.
For yield analysis, ANOVA showed that only temperature is the determining factor (p < 0.05) for biomass degradation, where these data have a coefficient of determination of 91.7%. Thus, this mathematical model is reliable in explaining the behavior of the obtained data.
Regarding carbon content, temperature is the crucial factor for the change in % of carbon in biochar, with a p-value of 0.025 and a coefficient of determination factor of 95.3%. The studied factors, such as temperature, time, and heating rate, were related, but none of these relationships significantly influenced carbon content or yield.
Therefore, to choose the ideal condition for biochar production that yields a material with high yield and carbon content, Figure 1 describes the desirability of the experiment.
The desirability factor described in the graph to be adopted in the production of BCM was to use a temperature of 600 °C, a heating rate of 15 °C min−1, and a residence time of 60 min. With these desirability data, BCM was produced and activated to proceed with adsorption and characterization tests.

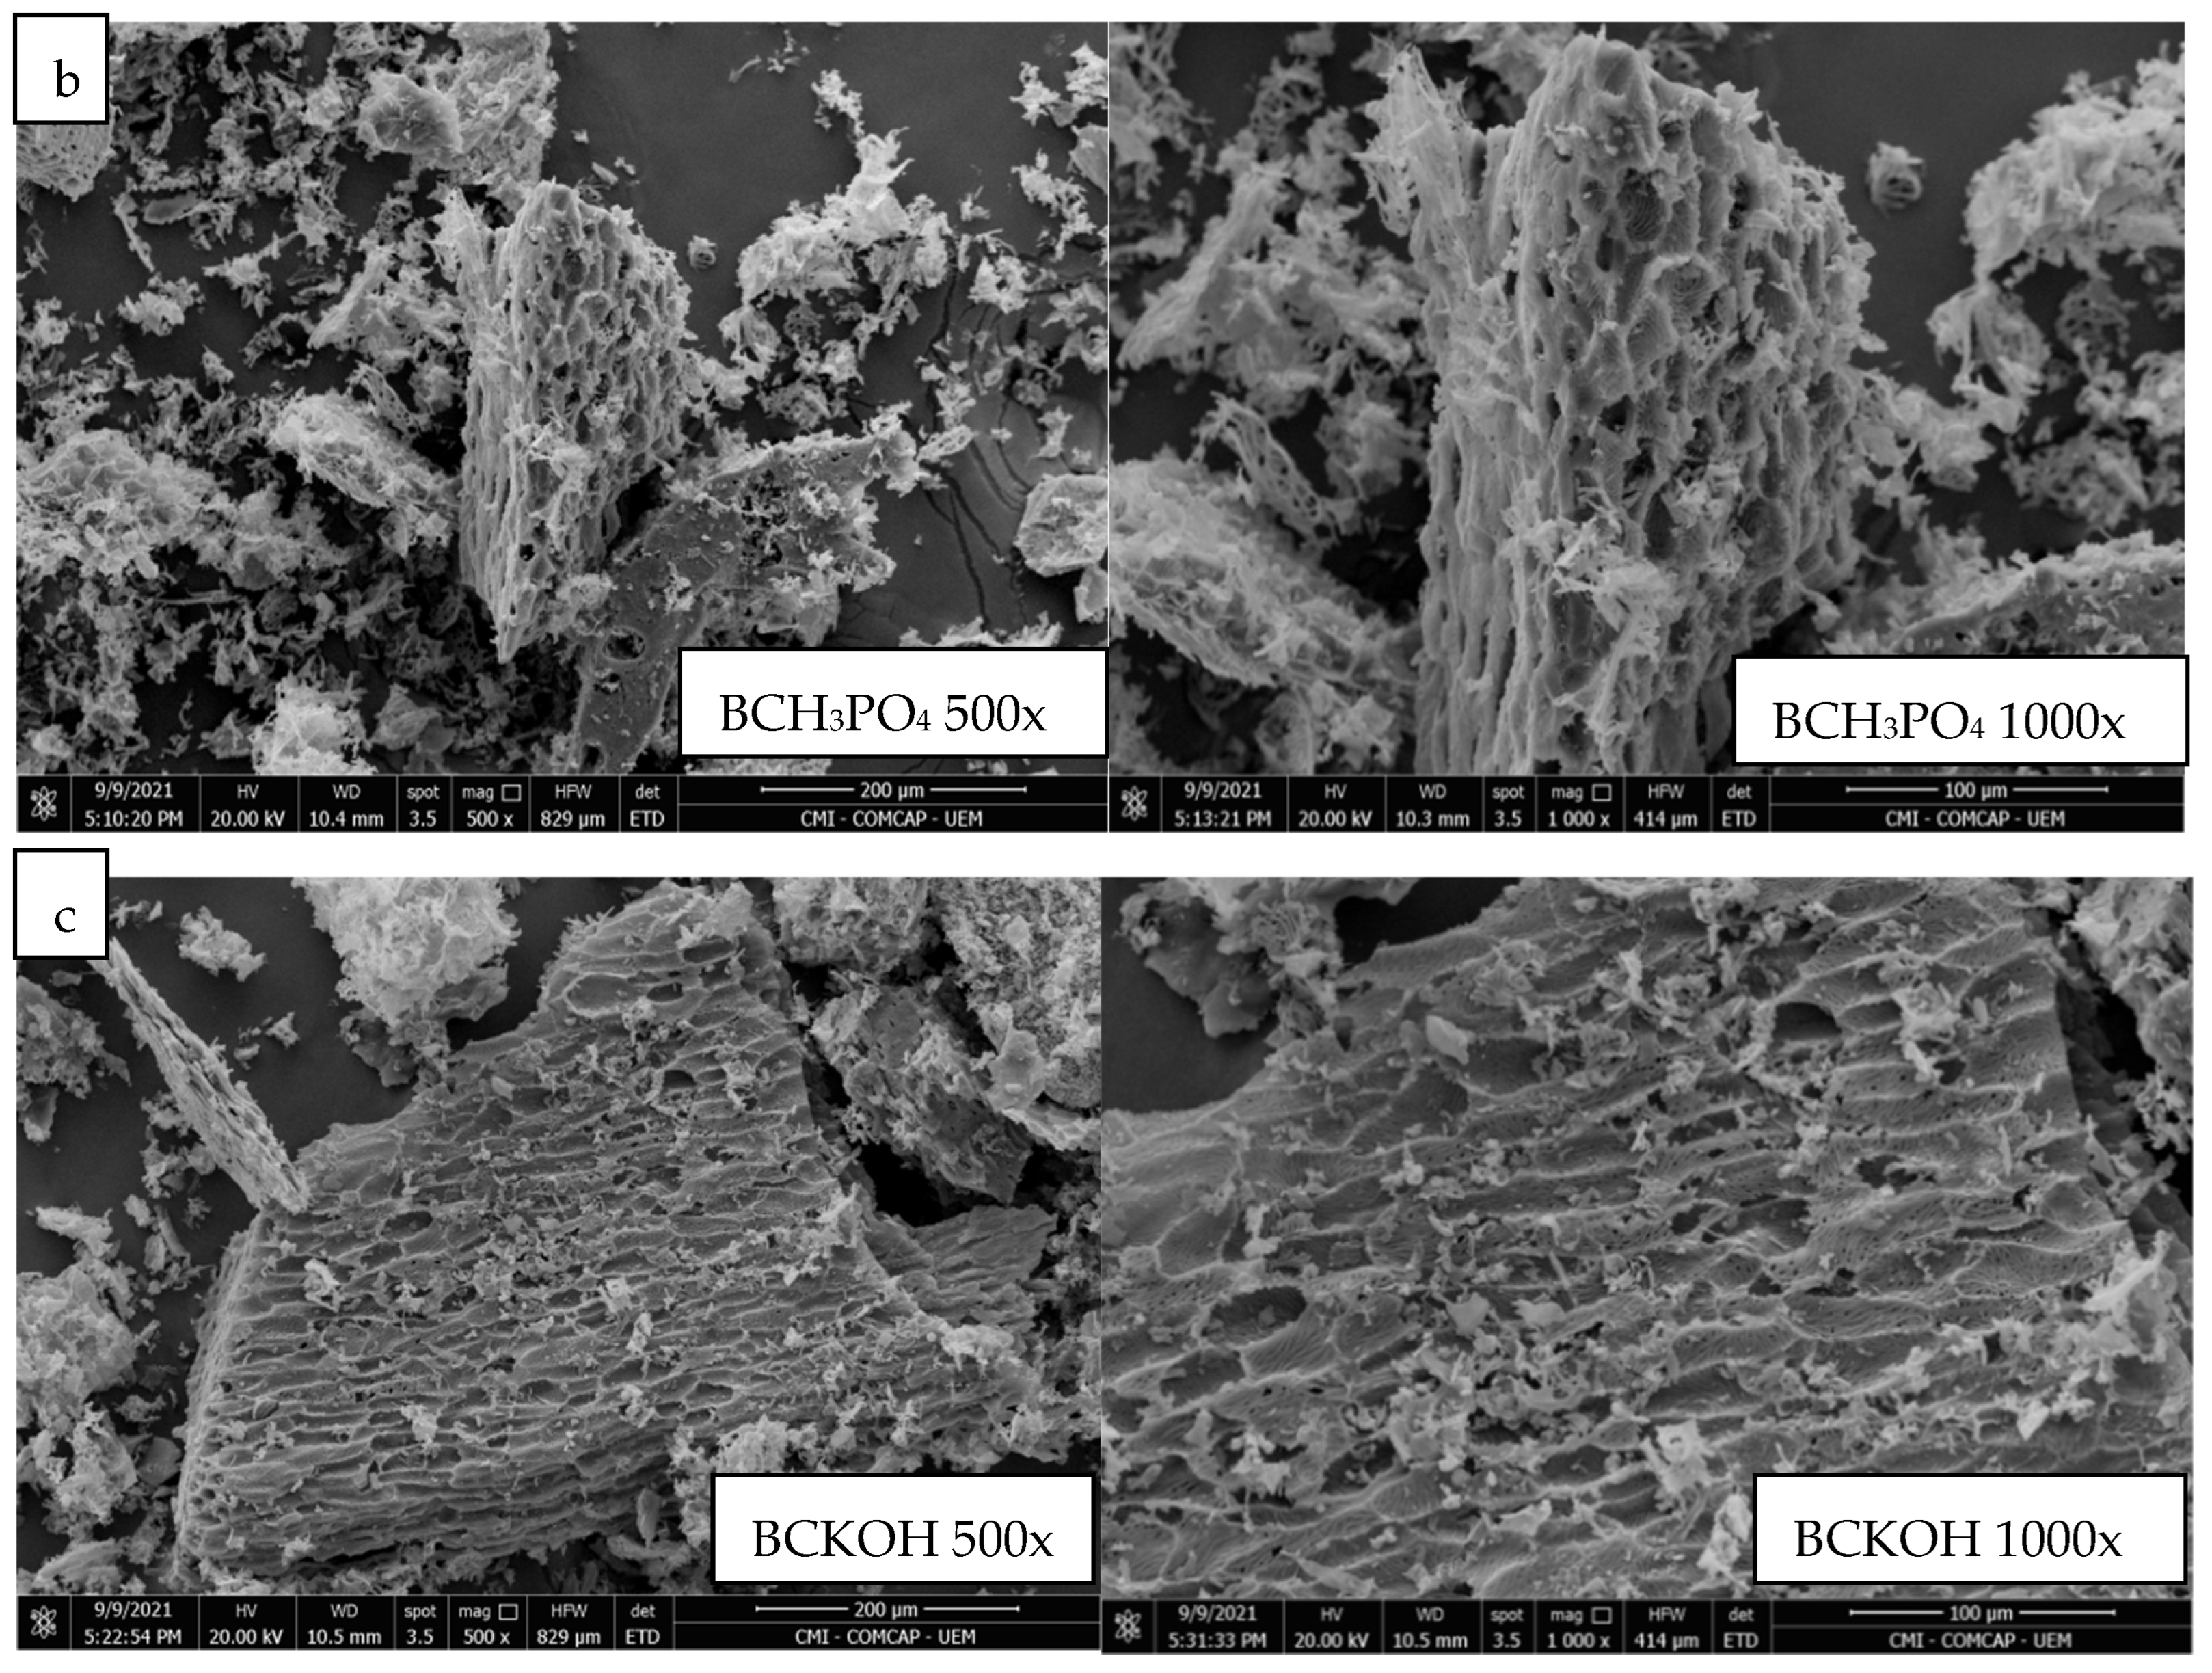
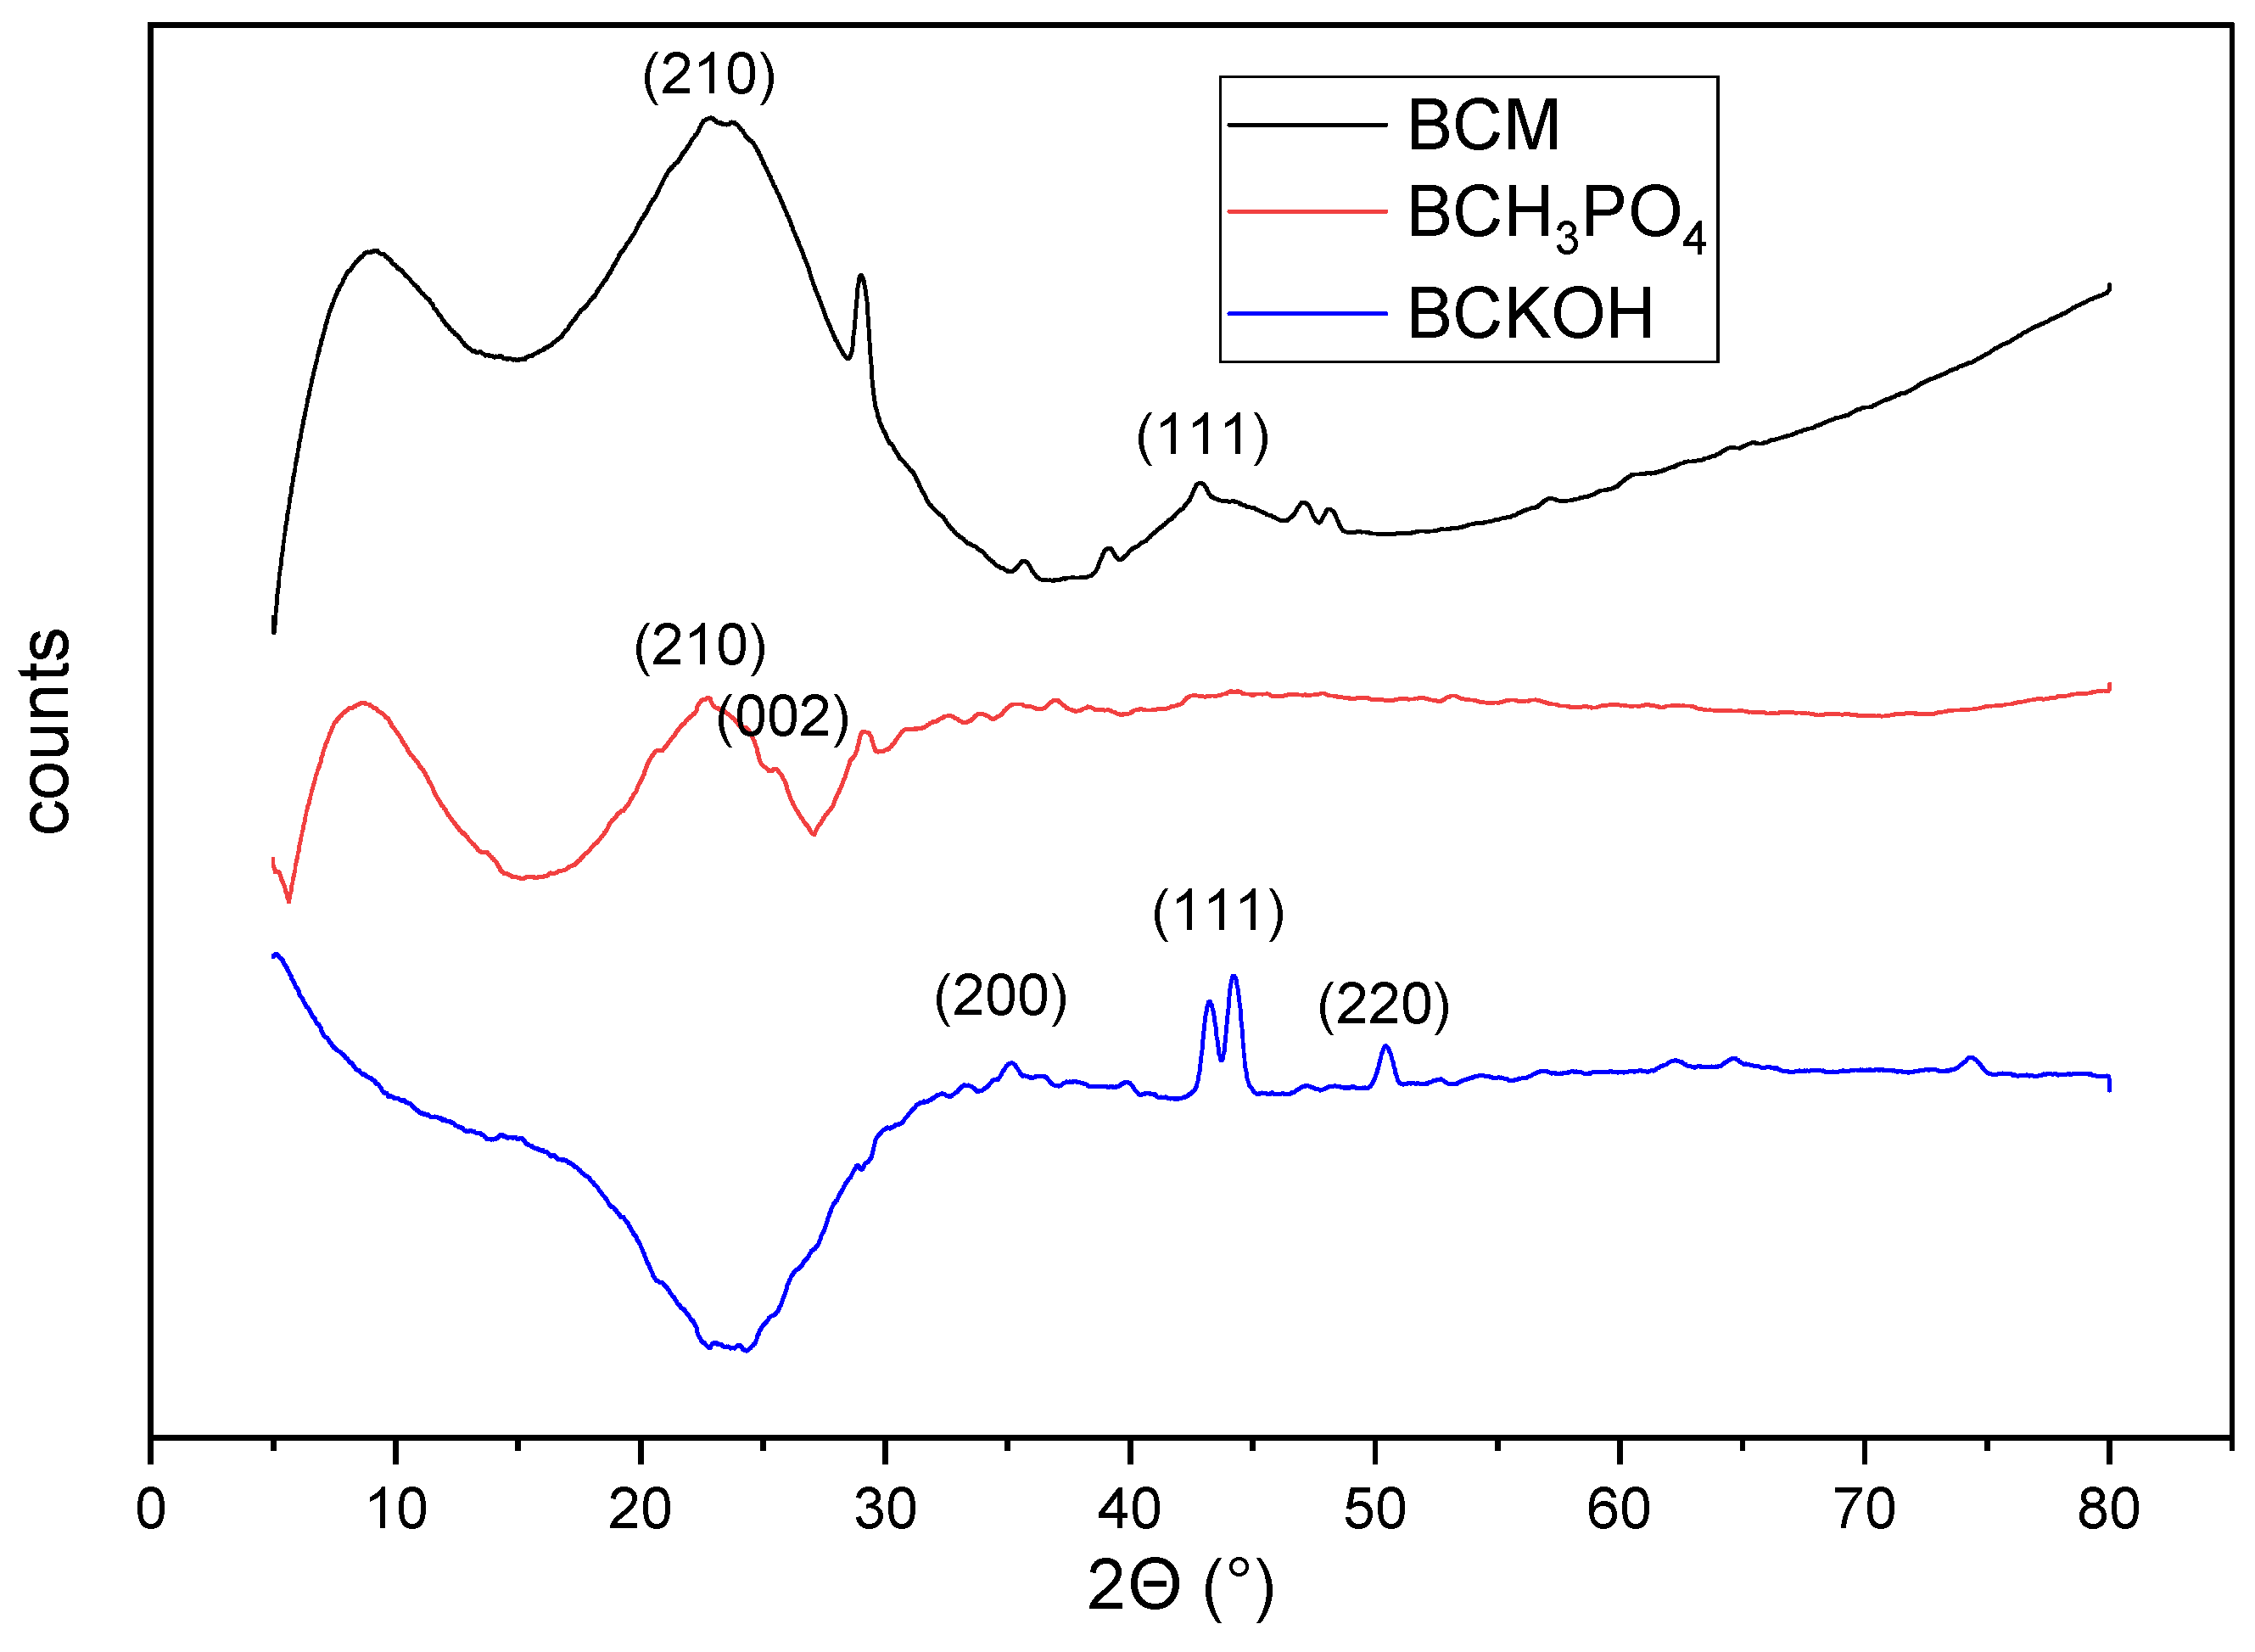
3.3. Characterization of the Biochars

The pHpzc is the point at which the surface load of the adsorbent is zero, where for pH values below the zero load potential, the material will behave positively, and for pH values above the zero load potential, the material will have negative surface loads [25]. Below, in Figure 2, is presented the pHpzc analysis.
As presented, the pHpzc for BCM was 7.75 and 7.2 for the H3PO4-activated one. For BCKOH, the pHpzc did not have a significant change and was close to 7.76. Herath et al. (2021) [26] produced activated biochar with KOH and obtained a PZC value of approximately 7.2, suggesting that neither cations nor anions would be repelled by acidic or alkaline pH. It is also observed that there was a decrease in the PZC with acid activation, as expected and in agreement with [27]. De Araújo et al. (2021) [28] highlight that PZC equal to or close to neutrality would facilitate adsorption mechanisms, where there would be a broader range of contaminants.
In Figure 3, to describe the morphology of the material, a magnification of 500× and 1000× was used, where the images presented demonstrate the difference between the BCM and the activated materials. In Figure 3a, the biochar presents a few pores that are not homogeneous, while after activation in Figure 3b, it presents well-structured and segmented pores. This is due to the activation process, which has the potential to release some components, causing the material to form pores. Dos Santos Bispo et al. (2021) [24] observed a slightly porous modification of the M. oleifera biochar material after activation with H3PO4 compared to the non-activated material.
Similarly to BCH3PO4, image C shows an increase in pore amount with chemical activation, and there was a more homogeneous distribution of pores throughout the activated biochar. It should be noted that the chemical activator KOH is more aggressive, resulting in the decomposition of lignocellulosic compounds. X-ray diffractometry (XRD) for the biochars studied is presented in Figure 4.
The studied biochars presented amorphous characteristics with few well-defined peaks, and one of the reasons is the indication that M. oleifera has a high protein content [29]. BCM and BCH3PO4 presented similar peaks at 22° (plane 210), which, according to the X’Pert HighScore database, indicate the formation of hydrocarbons. In studies of the pyrolysis of rubberwood sawdust, peaks at 22° are characteristic of the crystalline structure of cellulose [30]. De Souza dos Santos et al. (2020) [31], producing biochar based on Syagrus coronata, presented well-defined peaks in the 22–23° region.
The 43–44° region corresponds to the graphite plane (111), with carbon atoms with disordered rings characteristic of amorphous carbon-based materials Paunovic et al. (2019) [32] Previous studies using lignocellulosic materials recorded similar values to this work [33].
The (002) plane at 25° formed Triphosphorus pentanitride (P3N5) from activation using H3PO4, and in BCKOH, the (200–220) planes indicated the presence of potassium compound.
The TGA and DTG curves are presented in Figure 5 to discover the material’s behavior through temperature variation.
The seed bark of M. oleifera exhibited a mass loss pattern (12%) within the temperature range of 20–200 °C, primarily attributed to the evaporation of moisture and other volatile elements. Subsequently, between 200 and 300 °C, a substantial mass loss of approximately 90% occurred, mainly associated with the volatilization of lignocellulosic compounds [34]. The DTG curve reached its peak at 260 °C during this stage, indicating the decomposition of hemicellulose within this temperature range [35]. Within the temperature interval of 340–500 °C, the Biochar Material (BCM) displayed an 84% mass loss, and the DTG curve exhibited three peaks at 382, 411, and 464 °C. The first peak corresponds to cellulose decomposition (315–400 °C), while the second and third peaks are situated in a “passive pyrolysis zone”, attributed to the decomposition of chemically bound CO2 and lignin [36]. Lignin stands out as one of the most thermally stable compounds, with some studies suggesting its decomposition can occur at elevated temperatures, reaching up to 1000 °C [36,37]. Activated biochars, as depicted in Figure 5c,d, exhibited analogous patterns in the TG and DTG curves, revealing two distinct decomposition stages. The initial stage, encompassing the temperature range of 20 °C to 100 °C, is associated with water evaporation, resulting in a mass loss ranging from 5 to 16%, respectively. Subsequently, the material demonstrated thermal stability up to around 480 °C, underscoring that activation led to significant degradation of components up to this temperature. The second decomposition stage unfolds between 480 °C and 700 °C for BCH3PO4 and 480 °C and 600 °C for BCKOH, with mass losses of 70% and 55%, respectively. The TG curve for the acid-activated biochar peaked at 550 °C, indicative of the decomposition of lignocellulosic materials and residual organic groups present on the carbon surface [24].
Table 5 shows the N2 adsorption/desorption results, where according to the activation of the natural biochar, the specific surface area (SBET) increased for BCH3PO4 (21.37 m2g−1). The low area may be attributed to the activation process, which should be attributed to the formation of heteroatoms blocking the biochar pores [38]. Activation with KOH mainly contributed to the increase in area (SBET) with 1135.14 m2g−1 and a high pore volume (Vp = 0.61 cm3g−1) because the chemical activator KOH is more aggressive, blocking the pores in the degradation of lignocellulosic compounds. The FTIR spectra of M. oleifera biochar, chemically activated and shortly after the adsorption process, are presented in Figure 6 and Figure 7.
The peaks observed at 3450 cm−1 signify the existence of hydroxyl groups (OH), which can be attributed to both the presence of water in the sample and the stretching vibrations of hydroxyl groups found in fatty acids, protein structures, and lignin [39,40]. The bands at 2922 and 2852 cm−1 arise from aliphatic C-H and CH2 vibrations, characteristic of fatty acids [40]. The peak at 1625 cm−1 corresponds to C=O stretching vibrations, associated with the presence of hemicellulose and lignin structures [41]. The peak at 1454 cm−1 reflects the angular deformation of hydrocarbons (CH2), present in carbohydrates such as hemicellulose and cellulose [42,43]. Spectra at 1163 cm−1 represent stretching vibrations of phenolic groups within the sample, while those at 1114 and 1060 cm−1 indicate the formation of polysaccharide carbohydrates from other smaller sugars found in M. oleifera [44,45]. The band at 896 cm−1 corresponds to typical C-H vibrations in the cellulose structure [46].
After the chemical activation of BCM, there were changes in the intensity of peaks in some bands. In BCH3PO4, a band at 1745 cm−1 appeared, representing stretching vibrations of carbonyl groups C=O associated with fatty acids, characteristic of lignocellulosic compounds [40,47]. The band at 1558 cm−1 may be related to the secondary amine group [41]. As discussed in the thermogravimetric analysis, changes in peak intensity and alterations may be related to the decomposition of lignocellulosic compounds during activation. After adsorption, BCH3PO4 showed few significant changes in bands, with only a decrease in peak intensity in the 1060–1163 cm−1 region, highlighting that adsorption may be occurring in a small part through a chemical process.
In BCKOH, after activation, some bands shifted while others disappeared, as observed in the study by Luo et al. (2018) [48] using KOH-modified biochar. TGA and DTG, discussed in the previous section, highlight the decomposition of lignin- and hemicellulose-based compounds. The hydroxyl group (OH) band shifted to 3350 cm−1, and the peak at 1699 cm−1 represents stretching vibrations of C=O associated with carboxylic and amide groups [49]. After adsorption, the peaks at 1425 cm−1 and 1458 cm−1 correspond to C-C aromatic ring compounds of lignin [46,50]. There were few modifications, mainly in peak intensity, after adsorption of BCKOH, indicating that no new groups were formed but some disappeared, and adsorption may be occurring mainly through chemical interactions between the adsorbate and the adsorbent.
Below Figure 8, the Raman spectra for biochars were evaluated to demonstrate graphitization levels.
The examined biochars exhibited two distinctive peaks: the D band, positioned at 1330 cm−1, and the G band, approximately at 1580 cm−1. The D band is associated with the disarray of carbon C=C bonds between aromatic rings containing at least 6 rings, while the G band represents the vibration of graphite, alkene C=C structures, and aromatic rings [51,52,53]. The ratio (R) between the intensities of the D and G bands (ID/IG), as detailed in Table 6, serves as a measure to assess the graphitic degree in amorphous carbons.
The intensities of both the D and G bands in the activated biochars notably decreased, indicating some impairment to the carbon structure of BCM during the activation process [53,54]. The ratio (R) for BCKOH (0.93) was the highest compared to others, signifying an augmentation in the structure of defective aromatic rings [55].

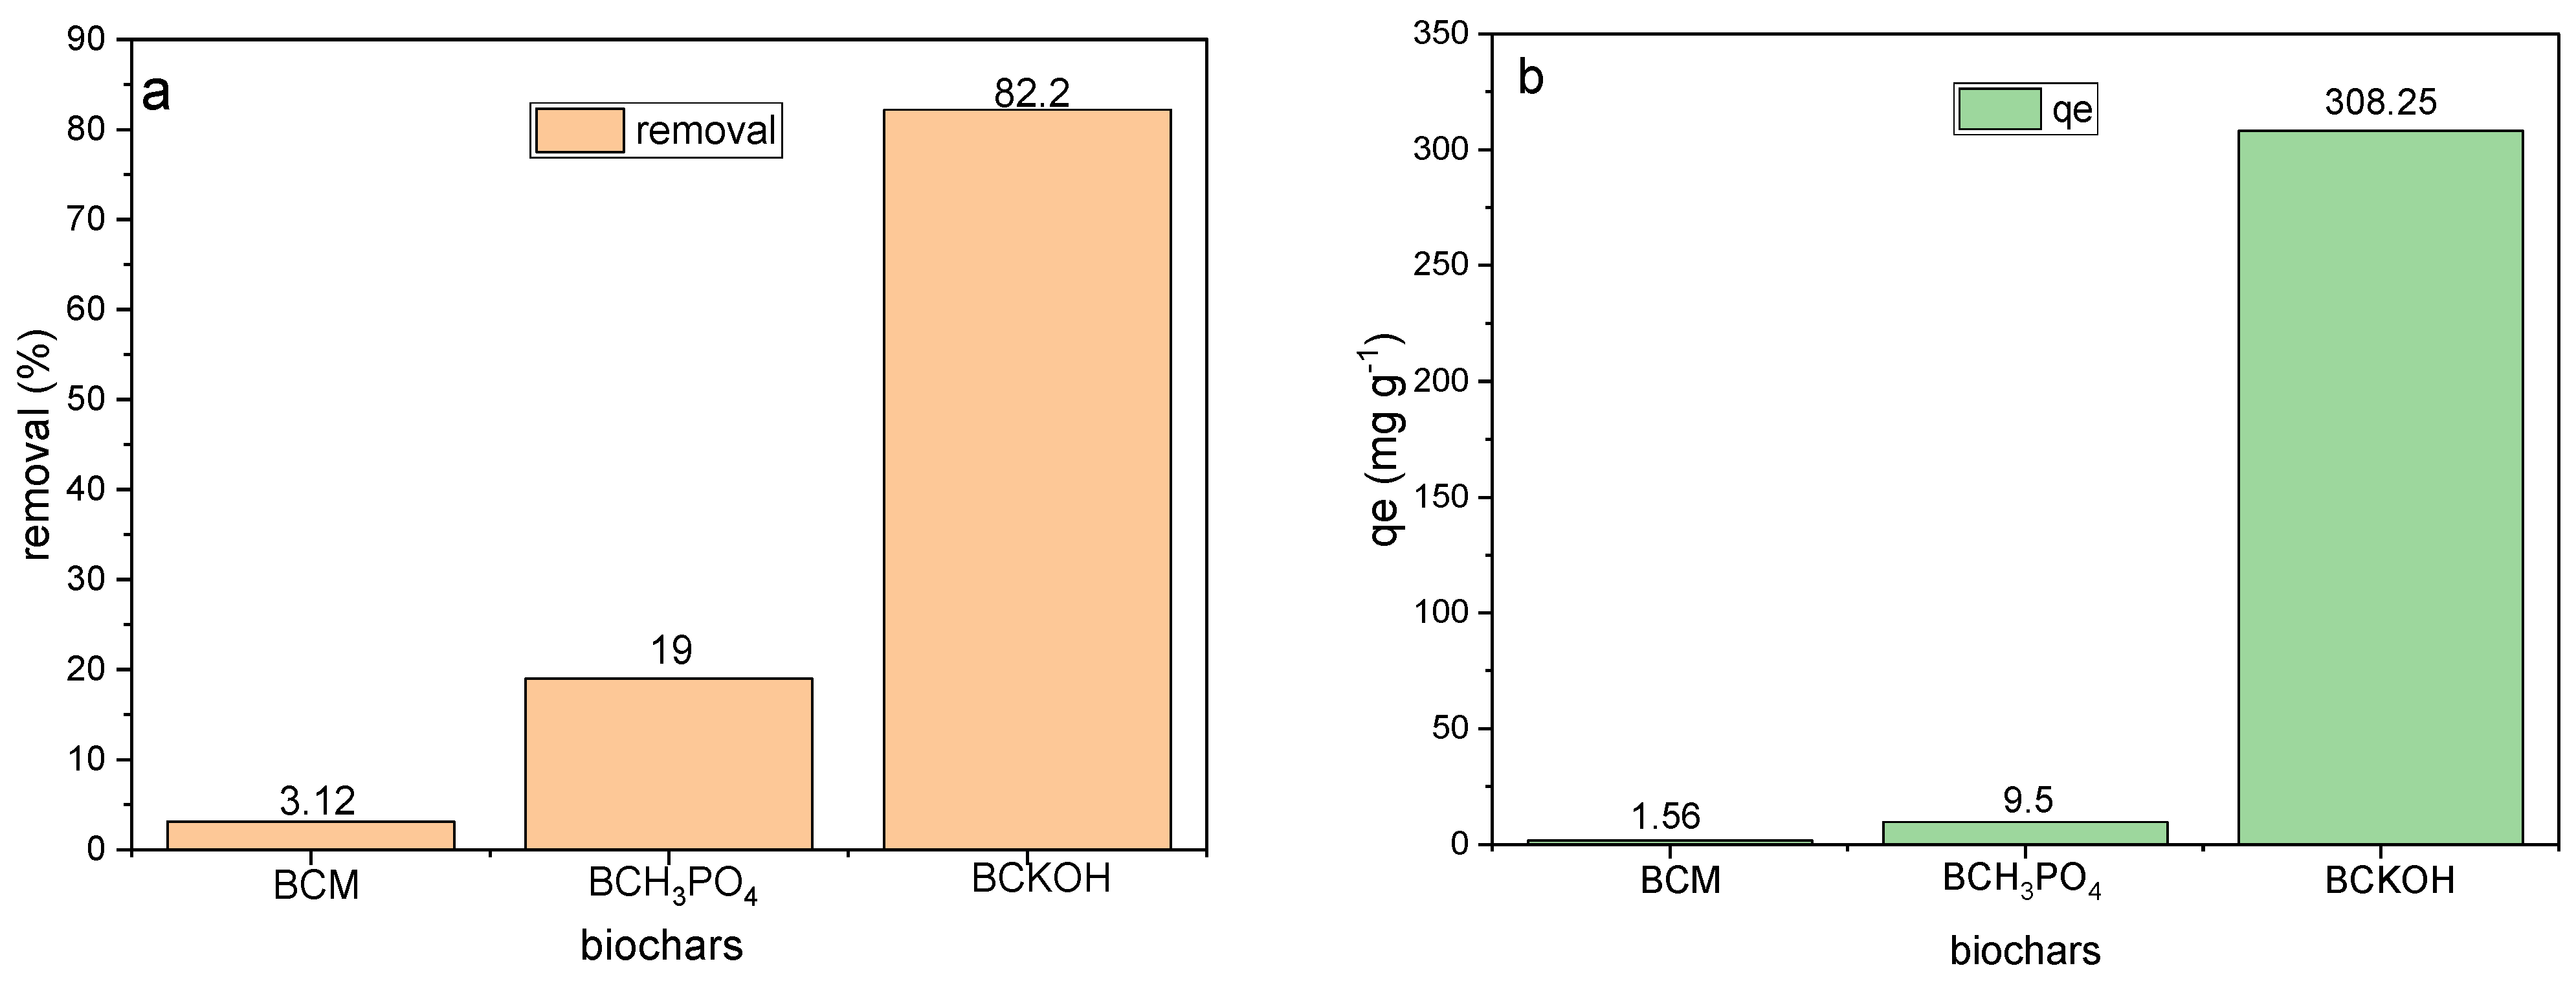
3.4. Adsorption Experiments

Figure 9 below shows the tests carried out with the contaminant MNZ on the BCM and the activated biochars BCH3PO4 and BCKOH. Before activation, the biochar had a removal rate of 3.12% and an adsorption capacity of 1.56 mg g−1. After activation, these values increased to 19% and 9.5 mg g−1 for BCH3PO4 and 82.2% and 308.25 mg g−1 for BCKOH, respectively.
González-García (2018) [23] states that chemical agents help to develop porosity by dehydrating and degrading the biomass structure. It is essential to mention that the ratio between the chemical agent and the precursor determines the pore size distribution and surface area. During activation using phosphoric acid, the volume of micropores is modified according to the acid concentration. High acid concentration inhibits the development of microporosity and promotes the formation of meso- and macropores, which facilitate the adsorption of numerous drug molecules [56]. KOH has excellent potential for pore formation in biochar and degrading some functional groups [23,57].

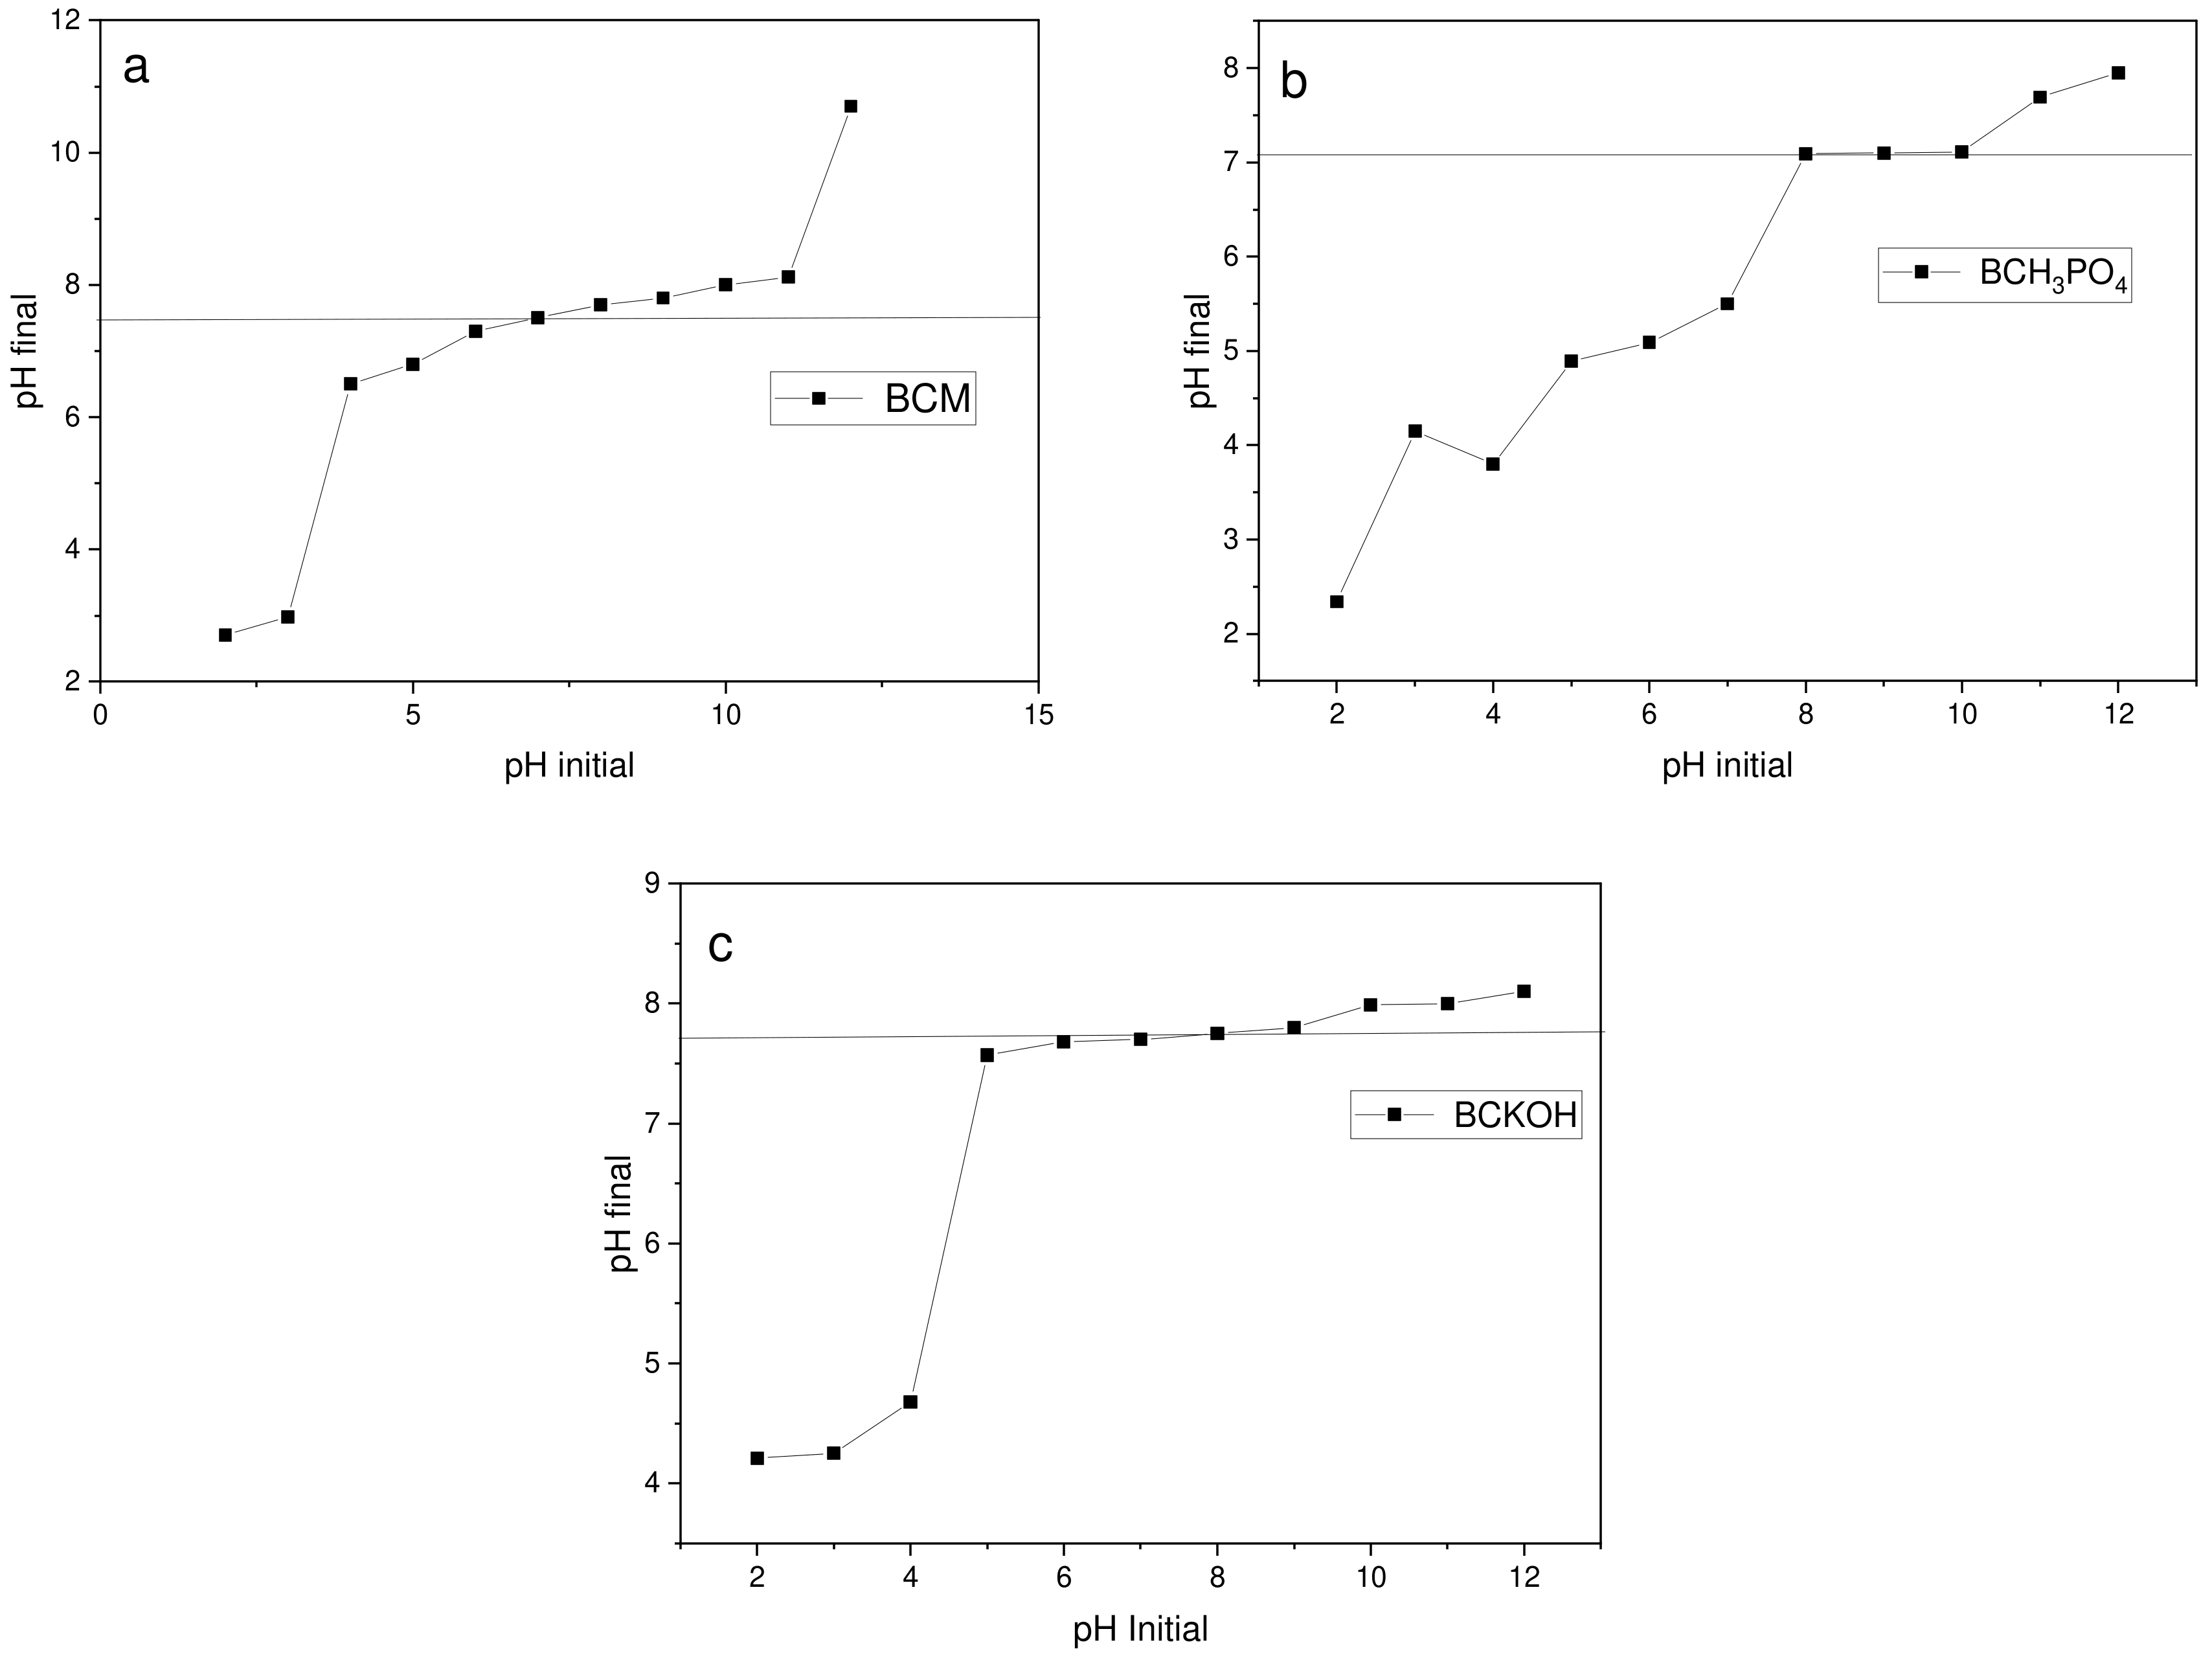
3.5. Adsorption Studies at Different pH

The tests previously conducted highlighted that the BCM did not show interesting adsorption results for Metronidazole. Therefore, the subsequent tests will only focus on the activated biochars. Figure 10 shows tests conducted with a metronidazole solution at different pH values ranging from 2 to 12, with the midpoint being the natural pH of the solution.
The pH directly influences the adsorption process, with BCH3PO4 showing higher efficiencies under acidic conditions (pH < 6), with its optimal condition being slightly above 16 mg g−1 at pH 4. MNZ is an acid-character drug with a pKa of around 2.58. Therefore, when pH > pKa, ion loss from MNZ occurs, resulting in a negative charge. With H+ ions present in the solution, the electrostatic interaction with the drug MNZ increases. According to Aarab et al. (2020) [58], the highest efficiency values for MNZ adsorption were obtained around pH 4 and 6.2, similar to this work.
For BCKOH, higher adsorption yields were obtained at alkaline pH, with the highest rate at pH 12, with the adsorption capacity close to 320 mg g−1. One of the main factors would be the high concentration of OH- ions that would have an electrostatic bond with the H+ ions of the drug. Carrales-Alvarado et al. (2020) [59] adsorbing MNZ on graphene-based materials showed better efficiencies at alkaline pH, where one of the hypotheses is that by considerably increasing the pH, there is a decrease in the solubility of aromatic compounds, promoting hydrophobic interactions.

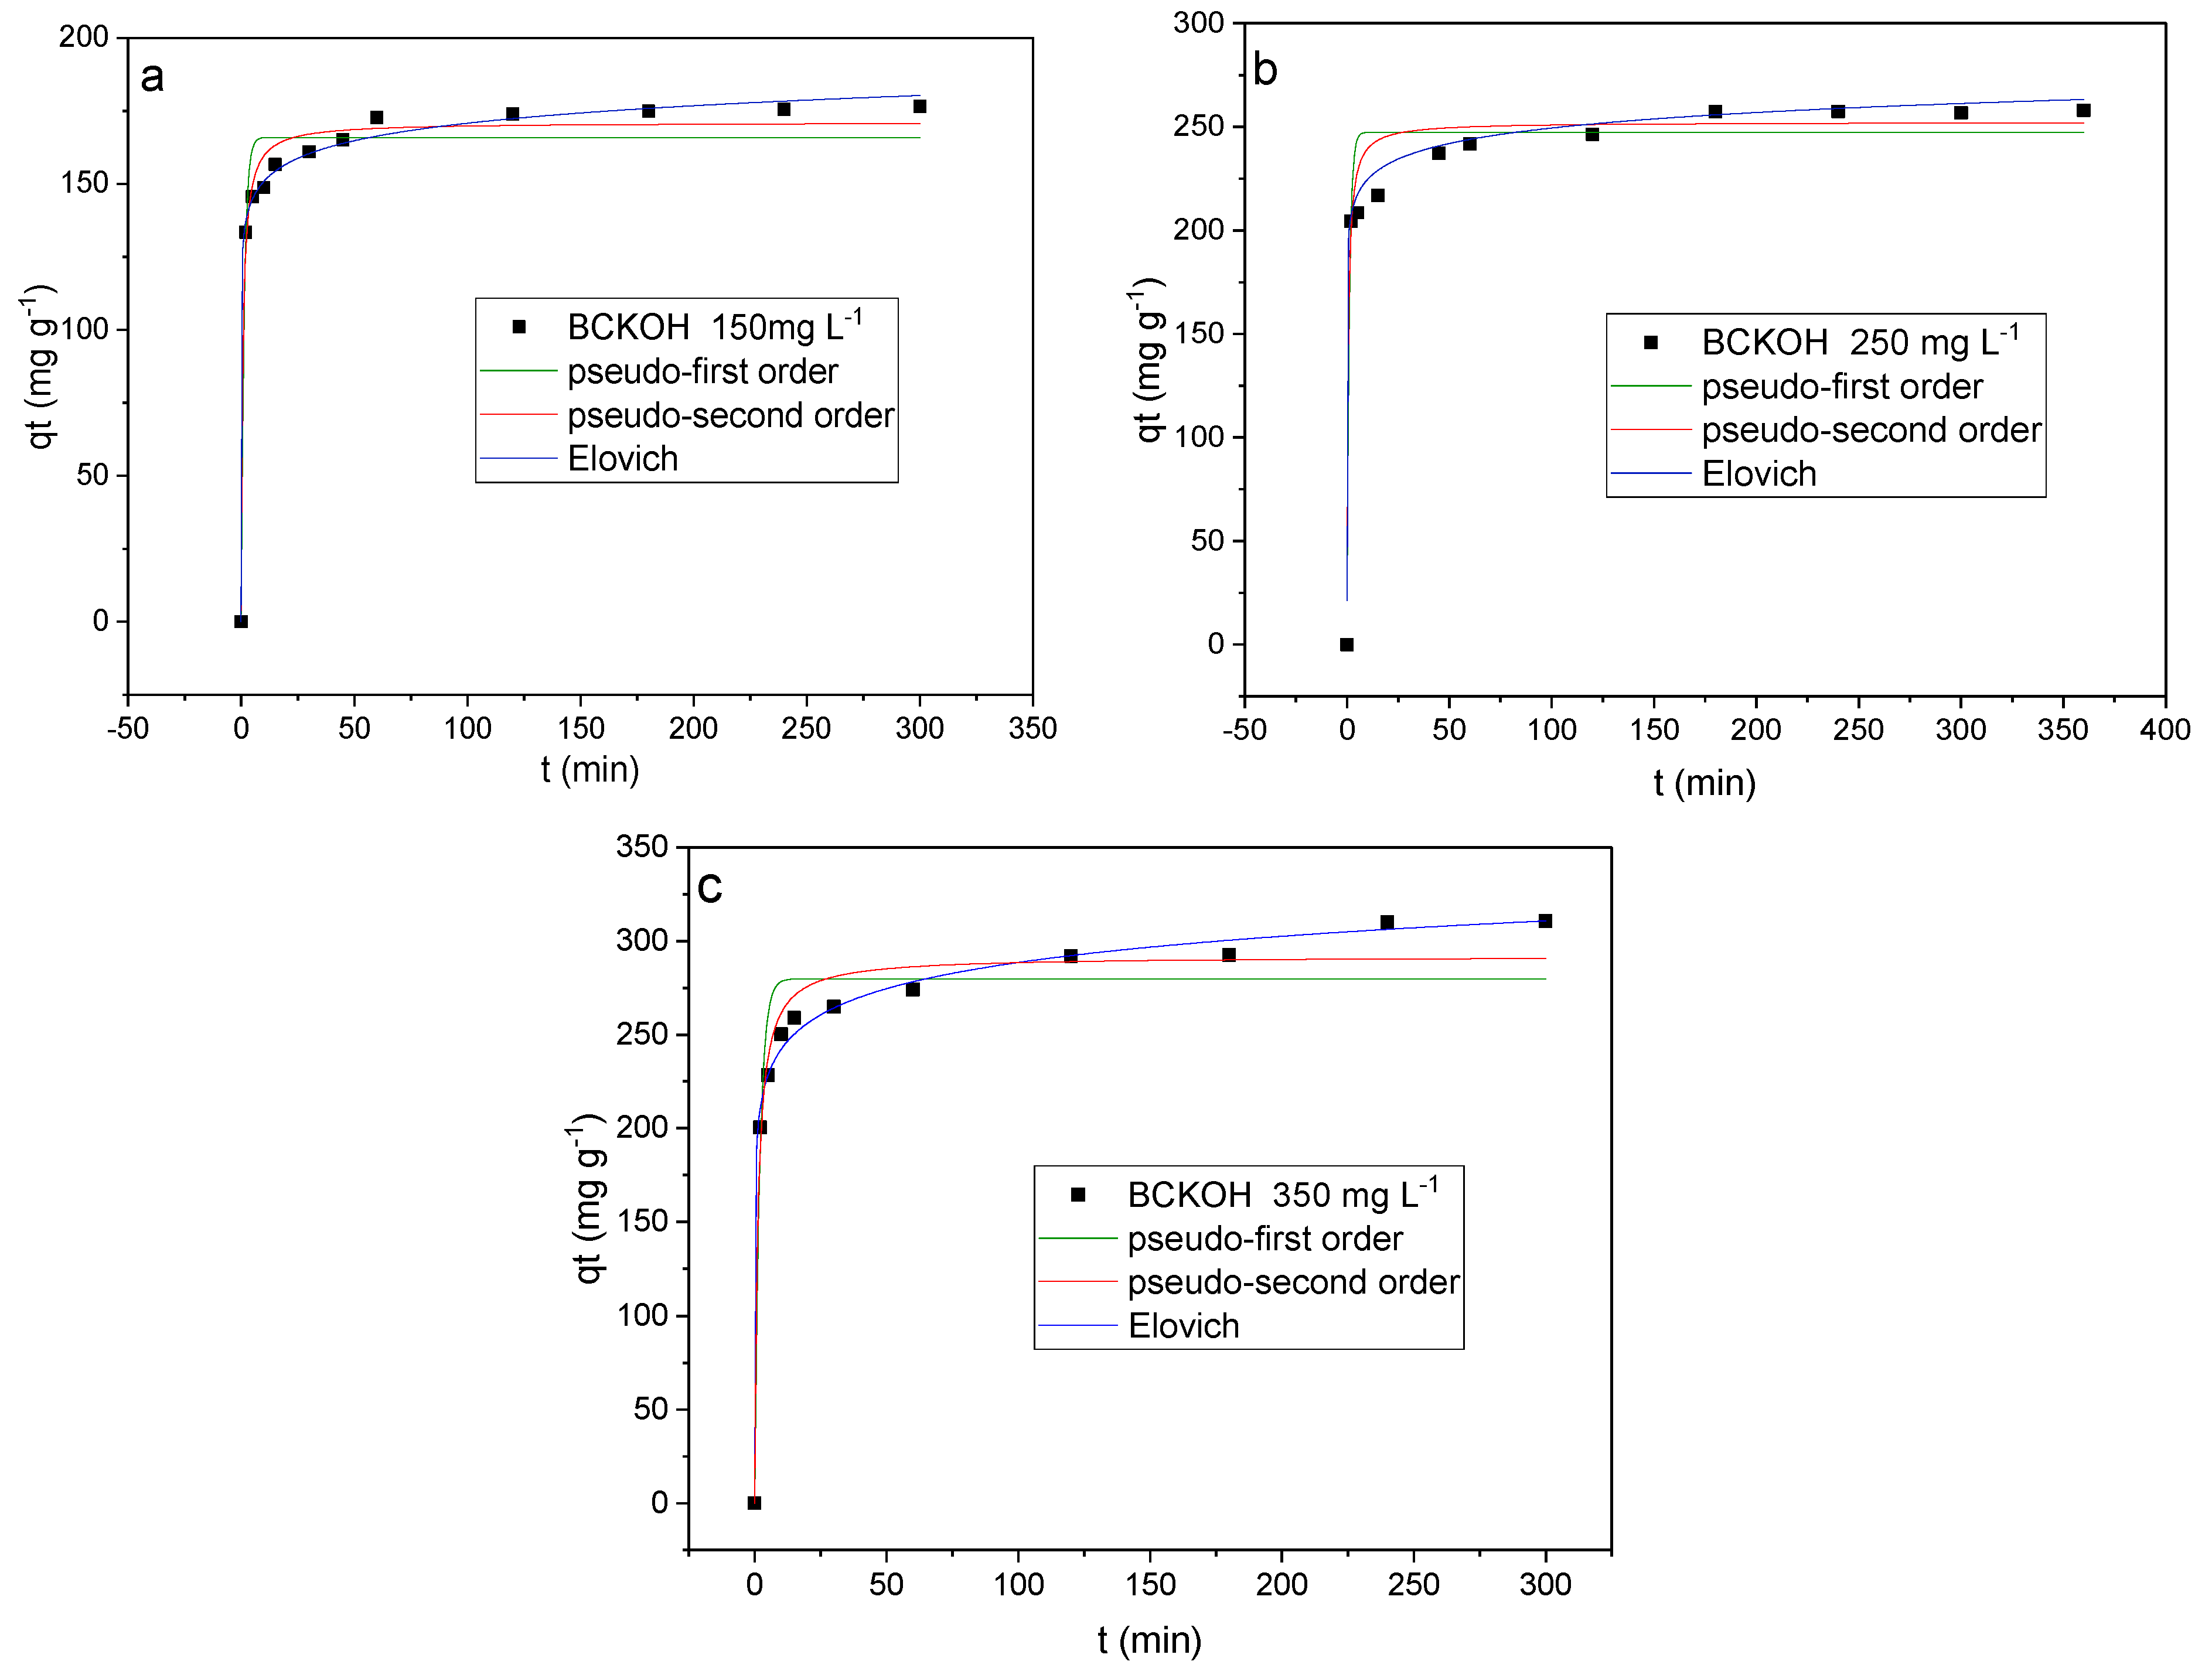
3.6. Adsorption Kinetics

Kinetic studies are extremely important for the commercial use of adsorbents to discover adsorption capacity and time. The kinetic models of BCH3PO4 are presented below in Figure 11.
The adjustments of the 3 kinetics with different concentrations highlight that most adsorption occurs rapidly in the first 45 min, followed by a decrease in the adsorption process. This behavior may be attributed to site saturation, reaching equilibrium at around 180 min. The adsorption capacity changed according to the concentration; in Figure 11a, it reached 88 mg g−1, in Figure 11b, 8 mg g−1, and in Figure 11c, it can be observed that the adsorption capacity remained close despite changes in the concentrations. Aarab et al. (2020) [58], using a polyaniline-polypyrrole copolymer for MNZ adsorption, achieved an equilibrium phase at 300 min [60]. In their study using activated carbonized M. oleifera with an acid agent (HCl), they had an ideal phosphate adsorption time of 40 min. The kinetic parameters according to which the model was adjusted are described in Table 7.
The model that best fits the kinetic data was the Elovich model, with R² ranging from 0.987 to 0.993 as the concentration of the contaminant increased. The Elovich equation assumes that surface systems are energetically heterogeneous, where adsorption occurs through chemical processes. The crucial effect of energy heterogeneity on surface adsorption equilibrium in gas/solid systems [61]. In their study, Habibi et al. (2018) [62] found that the pseudo-second-order model best fits the kinetic data for MNZ adsorption with an R² of 0.999. However, the Elovich model also showed a significant R² of 0.973, indicating that adsorption mainly occurs through chemisorption. The FTIR spectra also indicated this phenomenon.
The kinetic studies at different concentrations did not show significant interference in the behavior of the curve adjustments as the contaminant concentration increased. In the first 45 min, adsorption occurred very quickly, and until 180 min, adsorption was slow until reaching the stability phase. After the final adsorption phase, the adsorption capacity reached 176.54 mg g−1 for Figure 12a, 83 mg g−1 for Figure 12b, and 38 mg g−1 for Figure 12c. Thus highlighting that the increase in the adsorption capacity did not alter the kinetic behavior. Araujo et al. (2018) [63], adsorbing diclofenac on M. oleifera-based adsorbents, observed that the adsorption process occurred rapidly in the initial stages and stabilized close to 1080 min. Viotti et al. (2019) [27], in their studies with M. oleifera for diclofenac adsorption, obtained fast adsorption in up to 6 h and a stabilization period of close to 27 h. Kariim et al. (2020) [64] observed fast kinetics, approximately 40 min, until stabilization for MNZ adsorption using a carbon nanotube-based adsorbent. Thus, the study with BCKOH showed that the adsorption of MNZ is favorable compared to BCH3PO4.
Kinetic models at different concentrations of BCKOH are shown in the figure below.
According to Table 7, the adopted kinetic models were pseudo-first order, pseudo-second order, and Elovich. The data fit well to the models, even with the variation in MNZ concentration, but the model with the best fit R² independent of the concentrations used was Elovich, with R² ranging from 0.995 to 0.998, assuming that chemisorption might be occurring. Xavier et al. (2021) [65], using sugarcane bagasse biomass for dye adsorption, obtained good fits in the kinetic studies, with the Elovich model fitting best to the experimental data. According to FTIR spectra and kinetic data, the process was adjusted to a chemisorption process.
The data were adjusted for the Weber and Morris (1962) [66] intraparticle diffusion model (qt vs. t0.5) presented in Figure 13, where it was possible to identify the stages of adsorption that may be occurring by the process.
It is noticed that intraparticle diffusion is not the limiting step of the adsorption process and that other processes are involved. The first is external surface adsorption or the instant adsorption phase. The second is the gradual adsorption phase, where intraparticle diffusion is limited, and the third is the final equilibrium phase, where intraparticle diffusion begins to slow down due to the low solute concentration in the solution and the lower number of available adsorption sites [67,68]. The diffusion parameters are described just below in Table 8.

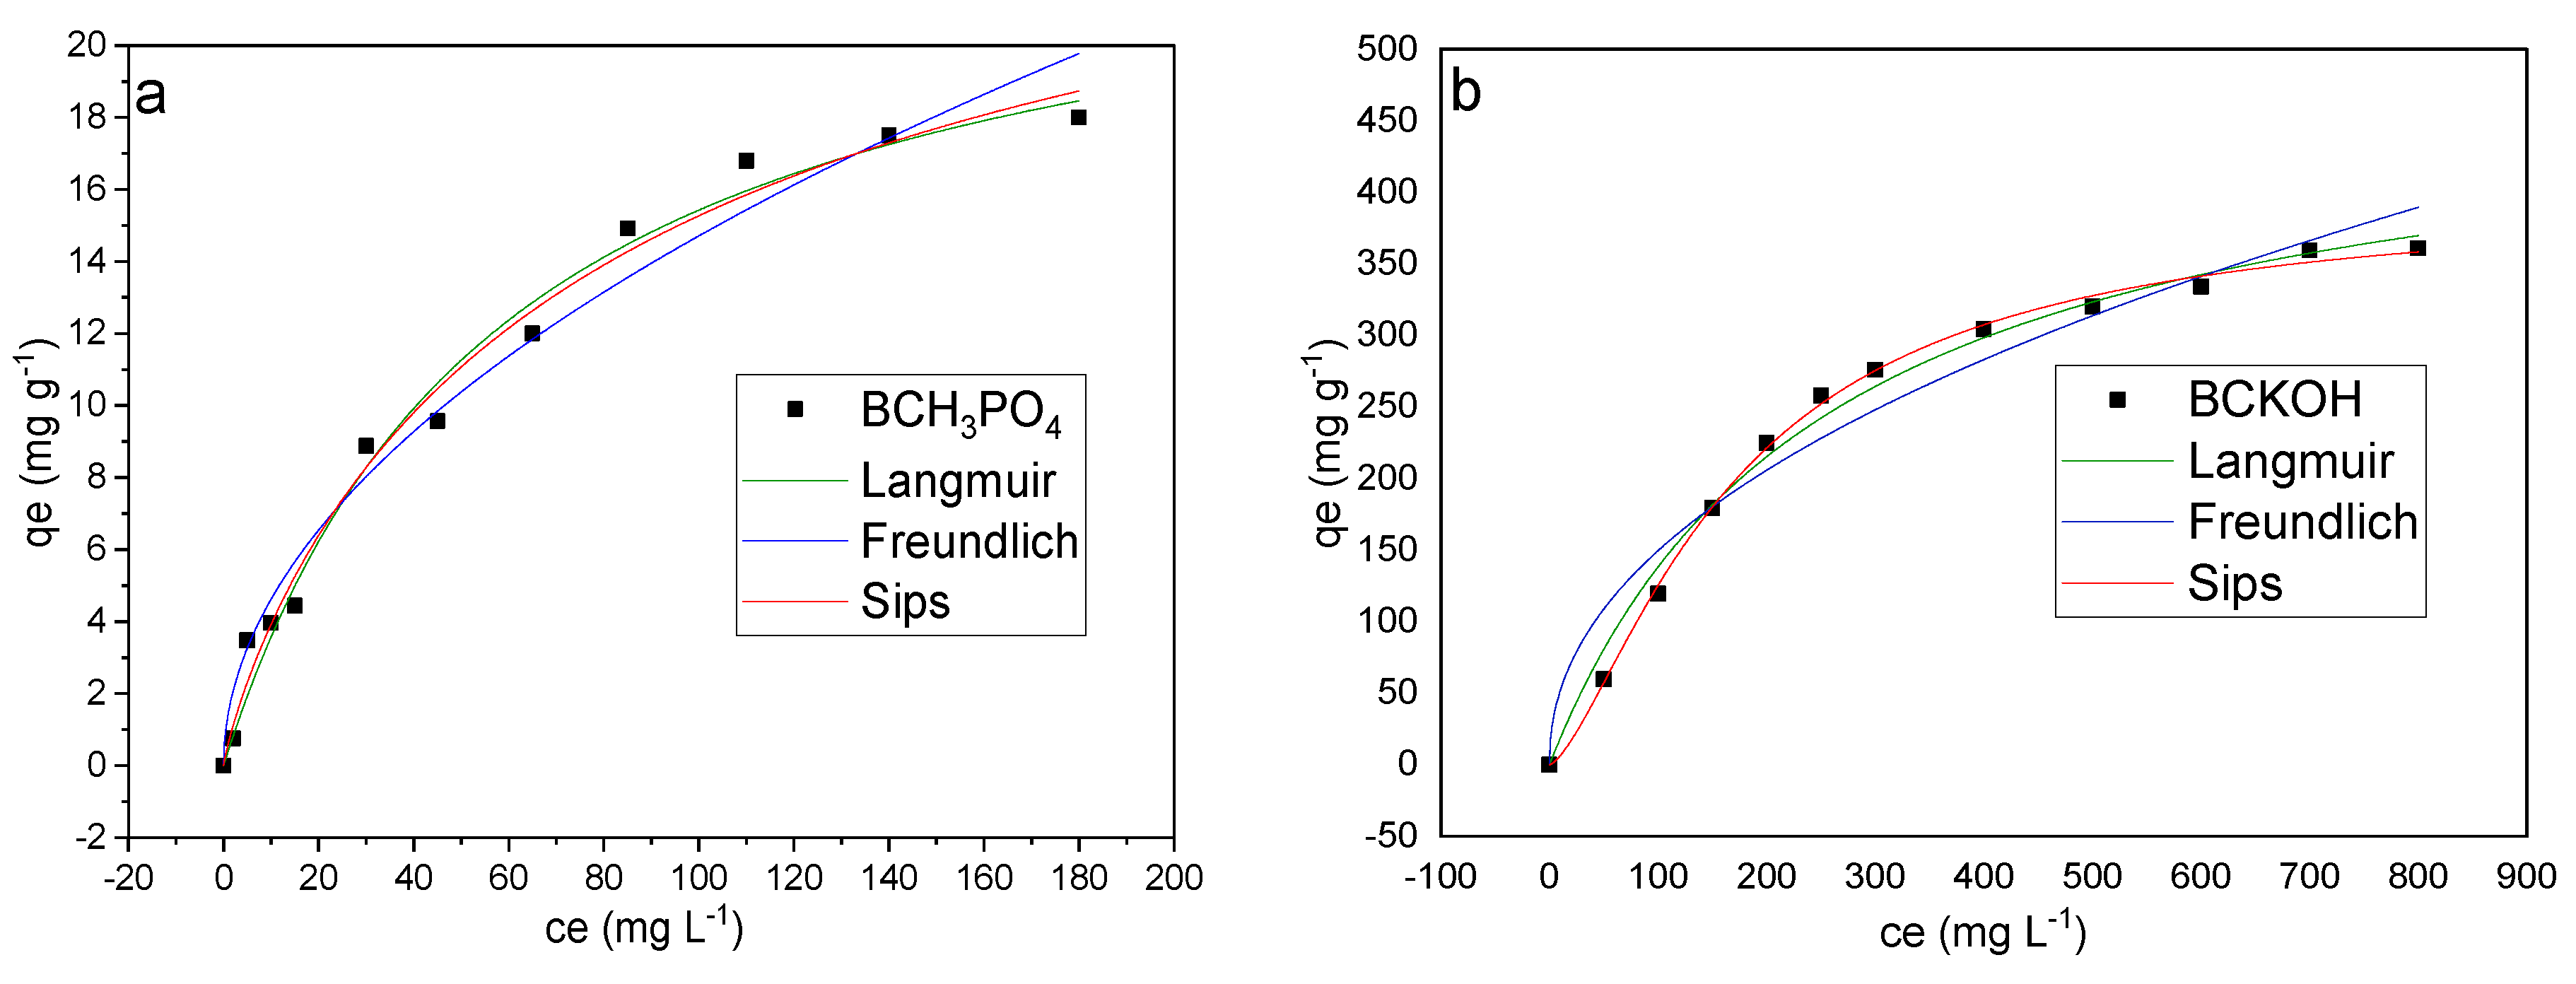
3.7. Adsorption Isotherms

Through the adsorption isotherm, it is possible to establish the equilibrium relationship between the concentration of adsorbate present in the fluid phase and the concentration of adsorbate present in the adsorbent at a given temperature. The isotherm describes the maximum adsorption capacity of the adsorbate in a wide variety of components. Figure 14 shows the isotherm.
The concentration effect directly contributes to the adsorption in BCH3PO4, where with an increase in concentration, the adsorption capacity of MNZ increased to 18 mg g−1. This is because the sites were not saturating at low adsorbate concentrations. In their study on MNZ adsorption, Aarab et al. (2020) [58] obtained a maximum adsorption capacity of 63.84 mg g−1, and higher MNZ concentrations improved the mass transfer matrix force.
Similarly, the adsorption capacity of BCKOH also increases with the concentration of MNZ, where at an initial concentration of 700 mg L−1, the adsorption capacity reaches 366.49 mg g−1.
The adsorption mechanisms through isotherms indicate that the mechanism is favorable, as it is possible to adsorb a quantity of adsorbate at low concentrations in solution due to a high attractive force on the adsorbent surface [69].
In Table 9, the data for BCH3PO4 and BCKOH were fitted to models, and all three models had a satisfactory R². However, the Sips model was the best fit, with R² of 0.988 and 0.998, respectively. The Sips isotherm originates from the inherent characteristics of Langmuir and Freundlich isotherms in their limiting behaviors. This model is applicable to specific adsorption scenarios without interactions between adsorbate and adsorbent, making it a suitable model for heterogeneous adsorption. As it converges to a low value, the Sips isotherm essentially simplifies to the Freundlich isotherm, and at high values, it anticipates the attributes of Langmuir’s monolayer sorption [70]. The three models’ fittings are R² above 0.97, so heterogeneous adsorption sites could be distributed on the biochar surface [71].
Using clay-impregnated nanoparticles for MNZ adsorption, Kalhori et al. (2017) [72] fitted the isotherm to the Sips model with an R² coefficient of 0.99 and a maximum sorption capacity of 10.52 mg g−1, a value lower than that determined in the present study for BCH3PO4 of 28.64 mg g−1.
The Sips isotherm was the one that best fitted the experimental data for BCKOH with an R² of 0.998, and the maximum adsorption capacity was 396.17 mg g−1. Ahmed and Theydan (2013) [73] used KOH-activated siris seeds and obtained results with values lower than this study, with a maximum adsorption capacity of MNZ of up to 196.31 mg g−1. Carrales-Alvarado et al. (2014) [74] studied different activated biochars and obtained a maximum adsorption capacity of 249.2 mg g−1 at natural pH.

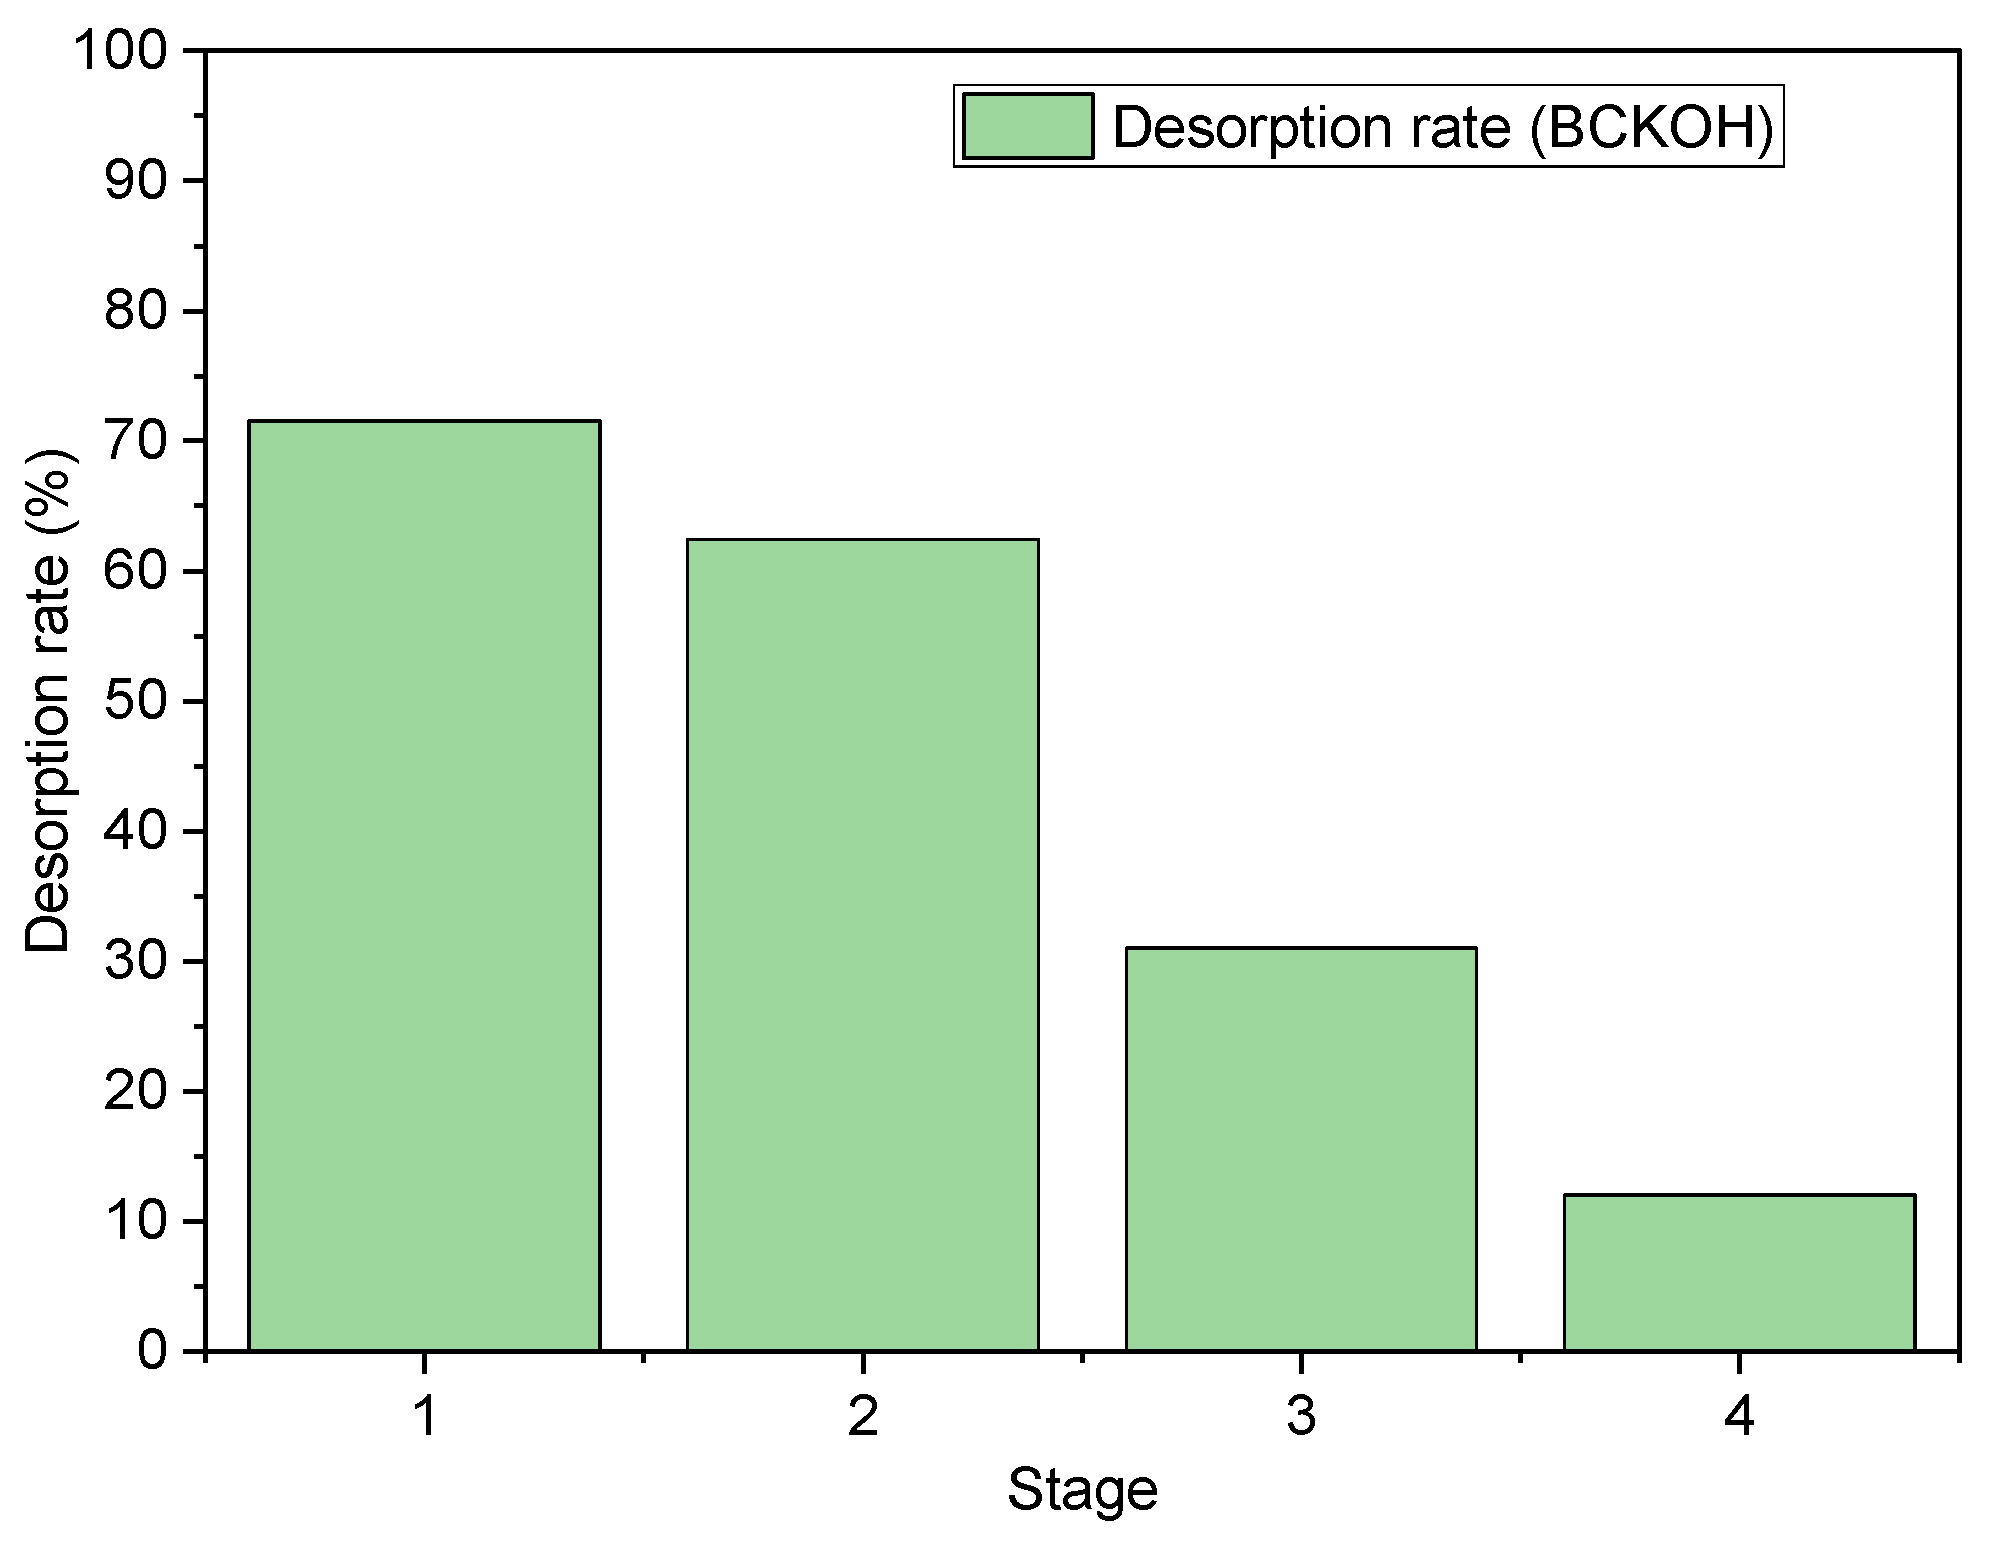
3.8. Recuperation Studies

Recuperation studies conducted on the activated biochars are described in four stages in Figure 15 and Figure 16.
BCH3PO4, in its first stage, achieved a desorption rate of 100% of MNZ, and the stages were repeated until the fourth stage, reaching approximately 40% desorption, where the biochar was becoming saturated. BCKOH had good results in the first two stages, with 72% and 63% desorption rates, respectively. After that, there was a loss of desorption efficiency in the last stages, reaching up to 12%. Ma et al. (2015) [75], to remove mercury from soil, subjected it to thermal treatment, where at higher temperatures of 700 °C, they achieved a removal efficiency of 99.5%. In order to remove polycyclic aromatic hydrocarbons (PAHs) by thermal desorption, Bulmău et al. (2014) [76] obtained better results at 650 °C with 96% removal. Thermal desorption has been used for some time to remove contaminants, but in terms of pharmaceuticals, there are few studies.

4. Conclusions

In this work, biochar was produced based on Moringa oleifera seed husk, and the adsorption mechanisms of the as-received, H3PO4, and KOH-activated biochars were analyzed, investigating their chemical and physical characteristics. The following conclusions were reached:
  • The biochar had a high carbon content, making it a favorable material for use as an adsorbent.
  • The pH of the studied biochars was close to neutral, facilitating their use for various contaminants.
  • TGA and DTG demonstrated that activated biochars have thermal stability.
  • The FTIR spectra indicated the presence of lignin- and cellulose-based compounds in the biochar before activation, and after adsorption, the formation and displacement of functional groups were observed, indicating the possibility of chemisorption.
  • Adsorption tests showed that activation with H3PO4 and KOH improved the adsorption characteristics of Metronidazole.
  • In the kinetic study, the experimental data were better fitted to the Elovich model, indicating that chemisorption occurs.
  • The adsorption mechanism of the activated biochars was favorable, reaching an adsorption capacity of 18 mg g−1 for BCH3PO4 and 366.49 mg g−1 for BCKOH and better fitting the Sips isotherm.
  • BCKOH showed the best results in the adsorption studies, making it promising to study other contaminants.

Author Contributions

Conceptualization, W.M.M.; Methodology, C.H.d.S.; Formal analysis, C.H.d.S.; Investigation, C.H.d.S.; Resources, M.H.N.O.S.; Data curation, C.H.d.S.; Writing—original draft, C.H.d.S.; Writing—review & editing, T.P.d.A., A.T.d.S., M.H.N.O.S. and W.M.M.; Visualization, T.P.d.A.; Supervision, A.T.d.S. and M.H.N.O.S.; Funding acquisition, A.T.d.S. and M.H.N.O.S. All authors have read and agreed to the published version of the manuscript.

Funding

This research was funded by Coordination for the Improvement of Higher Education Personnel (CAPES).

Data Availability Statement

Data are contained within the article.

Acknowledgments

Thanks to the Coordination for the Improvement of Higher Education Personnel (CAPES) for the maintenance of research grants and the Complex of Research Support Centers (COMCAP) for the availability of material analysis.

Conflicts of Interest

The authors declare no conflict of interest.

References

  1. Yadav, A.; Dindorkar, S.S.; Ramisetti, S.B. Adsorption Behaviour of Boron Nitride Nanosheets towards the Positive, Negative and the Neutral Antibiotics: Insights from First Principle Studies. J. Water Process Eng. 2022, 46, 102555. [Google Scholar] [CrossRef]
  2. Liu, B.; Zhang, S.G.; Chang, C.C. Emerging Pollutants—Part II: Treatment. Water Environ. Res. 2018, 90, 1792–1820. [Google Scholar] [CrossRef]
  3. Gomes, A.R.; Justino, C.; Rocha-Santos, T.; Freitas, A.C.; Duarte, A.C.; Pereira, R. Review of the Ecotoxicological Effects of Emerging Contaminants to Soil Biota. J. Environ. Sci. Health Part A 2017, 52, 992–1007. [Google Scholar] [CrossRef] [PubMed]
  4. Bahmani, M.; Saki, K.; Rafieian-Kopaei, M.; Karamati, S.A.; Eftekhari, Z.; Jelodari, M. The Most Common Herbal Medicines Affecting Sarcomastigophora Branches: A Review Study. Asian Pac. J. Trop. Med. 2014, 7, S14–S21. [Google Scholar] [CrossRef] [PubMed]
  5. Mabe, K.; Okuda, M.; Kikuchi, S.; Amagai, K.; Yoshimura, R.; Kato, M.; Sakamoto, N.; Asaka, M. Randomized Controlled Trial: PPI-Based Triple Therapy Containing Metronidazole versus Clarithromycin as First-Line Treatment for Helicobacter pylori in Adolescents and Young Adults in Japan. J. Infect. Chemother. 2018, 24, 538–543. [Google Scholar] [CrossRef] [PubMed]
  6. Madbouly, N.A.; Nashee, H.; Elgendy, A.A.; Rabee, I.; El Amir, A. Encapsulation of Low Metronidazole Dose in Poly (D,L-Lactide-Co-Glycolide) (PLGA) Nanoparticles Improves Giardia Intestinalis Treatment. Infect. Chemother. 2020, 52, 550–561. [Google Scholar] [CrossRef] [PubMed]
  7. Ok, Y.S.; Uchimiya, S.M.; Chang, S.X.; Bolan, N. Biochar: Production, Characterization, and Applications; CRC Press: Boca Raton, FL, USA, 2015. [Google Scholar]
  8. Cao, Q.; Huang, Z.; Liu, S.; Wu, Y. Potential of Punica Granatum Biochar to Adsorb Cu(II) in Soil. Sci. Rep. 2019, 9, 11116. [Google Scholar] [CrossRef] [PubMed]
  9. Tomczyk, A.; Sokołowska, Z.; Boguta, P. Biochar Physicochemical Properties: Pyrolysis Temperature and Feedstock Kind Effects. Rev. Environ. Sci. Biotechnol. 2020, 19, 191–215. [Google Scholar] [CrossRef]
  10. Hoslett, J.; Ghazal, H.; Ahmad, D.; Jouhara, H. Removal of Copper Ions from Aqueous Solution Using Low Temperature Biochar Derived from the Pyrolysis of Municipal Solid Waste. Sci. Total Environ. 2019, 673, 777–789. [Google Scholar] [CrossRef]
  11. Tan, X.; Liu, Y.; Zeng, G.; Wang, X.; Hu, X.; Gu, Y.; Yang, Z. Application of Biochar for the Removal of Pollutants from Aqueous Solutions. Chemosphere 2015, 125, 70–85. [Google Scholar] [CrossRef]
  12. Duan, S.; Wang, Y.; Liu, X.; Shao, D.; Hayat, T.; Alsaedi, A.; Li, J. Removal of U(VI) from Aqueous Solution by Amino Functionalized Flake Graphite Prepared by Plasma Treatment. ACS Sustain. Chem. Eng. 2017, 5, 4073–4085. [Google Scholar] [CrossRef]
  13. Hernandez-Mena, L.; Pecora, A.; Beraldo, A. Slow Pyrolysis of Bamboo Biomass: Analysis of Biochar Properties. Chem. Eng. Trans. 2014, 37, 115–120. [Google Scholar] [CrossRef]
  14. Wang, G.; Zhang, S.; Yao, P.; Chen, Y.; Xu, X.; Li, T.; Gong, G. Removal of Pb(II) from Aqueous Solutions by Phytolacca americana L. Biomass as a Low Cost Biosorbent. Arab. J. Chem. 2018, 11, 99–110. [Google Scholar] [CrossRef]
  15. Huang, D.; Luo, H.; Zhang, C.; Zeng, G.; Lai, C.; Cheng, M.; Wang, R.; Deng, R.; Xue, W.; Gong, X.; et al. Nonnegligible Role of Biomass Types and Its Compositions on the Formation of Persistent Free Radicals in Biochar: Insight into the Influences on Fenton-like Process. Chem. Eng. J. 2019, 361, 353–363. [Google Scholar] [CrossRef]
  16. França, F.R.M.; dos Santos Freitas, L.; Ramos, A.L.D.; da Silva, G.F.; Brandão, S.T. Storage and Oxidation Stability of Commercial Biodiesel Using Moringa oleifera Lam as an Antioxidant Additive. Fuel 2017, 203, 627–632. [Google Scholar] [CrossRef]
  17. Gupta, S.; Jain, R.; Kachhwaha, S.; Kothari, S.L. Nutritional and Medicinal Applications of Moringa oleifera Lam.—Review of Current Status and Future Possibilities. J. Herb. Med. 2018, 11, 1–11. [Google Scholar] [CrossRef]
  18. Raman, J.K.; Alves, C.M.; Gnansounou, E. A Review on Moringa Tree and Vetiver Grass—Potential Biorefinery Feedstocks. Bioresour. Technol. 2018, 249, 1044–1051. [Google Scholar] [CrossRef]
  19. Saucedo-Pompa, S.; Torres-Castillo, J.A.; Castro-López, C.; Rojas, R.; Sánchez-Alejo, E.J.; Ngangyo-Heya, M.; Martínez-Ávila, G.C.G. Moringa Plants: Bioactive Compounds and Promising Applications in Food Products. Food Res. Int. 2018, 111, 438–450. [Google Scholar] [CrossRef]
  20. Belhamdi, B.; Merzougui, Z.; Laksaci, H.; Trari, M. The Removal and Adsorption Mechanisms of Free Amino Acid L-Tryptophan from Aqueous Solution by Biomass-Based Activated Carbon by H3PO4 Activation: Regeneration Study. Phys. Chem. Earth Parts A/B/C 2019, 114, 102791. [Google Scholar] [CrossRef]
  21. De Araújo, T.P.; Quesada, H.B.; dos Santos, D.F.; da Silva Fonseca, B.C.; Barbieri, J.Z.; Bergamasco, R.; de Barros, M.A.S.D. Acetaminophen Removal by Calcium Alginate/Activated Hydrochar Composite Beads: Batch and Fixed-Bed Studies. Int. J. Biol. Macromol. 2022, 203, 553–562. [Google Scholar] [CrossRef] [PubMed]
  22. Robles, J.O.; Regalbuto, J.R. The Engineering of Pt/Carbon Catalyst Preparation for Application on Proton Exchange Fuel Cell Membrane (PEFCM); University of Illinois: Chicago, IL, USA, 2004. [Google Scholar]
  23. González-García, P. Activated Carbon from Lignocellulosics Precursors: A Review of the Synthesis Methods, Characterization Techniques and Applications. Renew. Sustain. Energy Rev. 2018, 82, 1393–1414. [Google Scholar] [CrossRef]
  24. dos Santos Bispo, M.; dos Santos, J.P.L.; dos Santos, L.C.L.; dos Santos Freitas, L.; Bispo, D.F.; da Silva, G.F. Synthesis and Characterization of Activated Carbon of Moringa oleifera Lam Pod and Evaluation of Its Performance in the Removal of Oils and Greases. J. Environ. Chem. Eng. 2021, 9, 105965. [Google Scholar] [CrossRef]
  25. Fiol, N.; Villaescusa, I. Determination of Sorbent Point Zero Charge: Usefulness in Sorption Studies. Environ. Chem. Lett. 2009, 7, 79–84. [Google Scholar] [CrossRef]
  26. Herath, A.; Layne, C.A.; Perez, F.; Hassan, E.B.; Pittman, C.U.; Mlsna, T.E. KOH-activated high surface area Douglas Fir biochar for adsorbing aqueous Cr(VI), Pb(II) and Cd(II). Chemosphere 2021, 269, 128409. [Google Scholar] [CrossRef]
  27. Viotti, P.V.; Moreira, W.M.; dos Santos, O.A.A.; Bergamasco, R.; Vieira, A.M.S.; Vieira, M.F. Diclofenac Removal from Water by Adsorption on Moringa oleifera Pods and Activated Carbon: Mechanism, Kinetic and Equilibrium Study. J. Clean. Prod. 2019, 219, 809–817. [Google Scholar] [CrossRef]
  28. de Araújo, T.P.; de Oliveira Tavares, F.; Vareschini, D.T.; Barros, M.A.S.D. Biosorption Mechanisms of Cationic and Anionic Dyes in a Low-Cost Residue from Brewer’s Spent Grain. Environ. Technol. 2021, 42, 2925–2940. [Google Scholar] [CrossRef]
  29. Reck, I.M.; Paixão, R.M.; Bergamasco, R.; Vieira, M.F.; Vieira, A.M.S. Removal of Tartrazine from Aqueous Solutions Using Adsorbents Based on Activated Carbon and Moringa oleifera Seeds. J. Clean. Prod. 2018, 171, 85–97. [Google Scholar] [CrossRef]
  30. Shaaban, A.; Se, S.M.; Mitan, N.M.M.; Dimin, M.F. Characterization of Biochar Derived from Rubber Wood Sawdust through Slow Pyrolysis on Surface Porosities and Functional Groups. Procedia Eng. 2013, 68, 365–371. [Google Scholar] [CrossRef]
  31. de Souza dos Santos, G.E.; Ide, A.H.; Duarte, J.L.S.; McKay, G.; Silva, A.O.S.; Meili, L. Adsorption of Anti-Inflammatory Drug Diclofenac by MgAl/Layered Double Hydroxide Supported on Syagrus coronata Biochar. Powder Technol. 2020, 364, 229–240. [Google Scholar] [CrossRef]
  32. Paunovic, O.; Pap, S.; Maletic, S.; Taggart, M.A.; Boskovic, N.; Turk Sekulic, M. Ionisable emerging pharmaceutical adsorption onto microwave functionalised biochar derived from novel lignocellulosic waste biomass. J. Colloid Interface Sci. 2019, 547, 350–360. [Google Scholar] [CrossRef] [PubMed]
  33. Abdul Khalil, H.P.S.; Jawaid, M.; Firoozian, P.; Rashid, U.; Islam, A.; Akil, H.M. Activated Carbon from Various Agricultural Wastes by Chemical Activation with KOH: Preparation and Characterization. J. Biobased Mater. Bioenergy 2013, 7, 708–714. [Google Scholar] [CrossRef]
  34. Quesada, H.B.; De Araújo, T.P.; Cusioli, L.F.; De Barros, M.A.S.D.; Gomes, R.G.; Bergamasco, R. Evaluation of Novel Activated Carbons from Chichá-Do-Cerrado (Sterculia striata St. Hil. et Naud) Fruit Shells on Metformin Adsorption and Treatment of a Synthetic Mixture. J. Environ. Chem. Eng. 2021, 9, 104914. [Google Scholar] [CrossRef]
  35. Yang, H.; Yan, R.; Chen, H.; Lee, D.H.; Zheng, C. Characteristics of Hemicellulose, Cellulose and Lignin Pyrolysis. Fuel 2007, 86, 1781–1788. [Google Scholar] [CrossRef]
  36. Selvarajoo, A.; Wong, Y.L.; Khoo, K.S.; Chen, W.H.; Show, P.L. Biochar Production via Pyrolysis of Citrus Peel Fruit Waste as a Potential Usage as Solid Biofuel. Chemosphere 2022, 294, 133671. [Google Scholar] [CrossRef] [PubMed]
  37. Lam, S.S.; Liew, R.K.; Lim, X.Y.; Ani, F.N.; Jusoh, A. Fruit Waste as Feedstock for Recovery by Pyrolysis Technique. Int. Biodeterior. Biodegrad. 2016, 113, 325–333. [Google Scholar] [CrossRef]
  38. Gehrke, V.; Maron, G.K.; da Silva Rodrigues, L.; Alano, J.H.; de Pereira, C.M.P.; Orlandi, M.O.; Carreño, N.L.V. Facile Preparation of a Novel Biomass-Derived H3PO4 and Mn(NO3)2 Activated Carbon from Citrus bergamia Peels for High-Performance Supercapacitors. Mater. Today Commun. 2021, 26, 101779. [Google Scholar] [CrossRef]
  39. Baptista, A.T.A.; Silva, M.O.; Gomes, R.G.; Bergamasco, R.; Vieira, M.F.; Vieira, A.M.S. Protein Fractionation of Seeds of Moringa oleifera Lam and Its Application in Superficial Water Treatment. Sep. Purif. Technol. 2017, 180, 114–124. [Google Scholar] [CrossRef]
  40. Alves, V.N.; Mosquetta, R.; Coelho, N.M.M.; Bianchin, J.N.; Di Pietro Roux, K.C.; Martendal, E.; Carasek, E. Determination of Cadmium in Alcohol Fuel Using Moringa oleifera Seeds as a Biosorbent in an On-Line System Coupled to FAAS. Talanta 2010, 80, 1133–1138. [Google Scholar] [CrossRef]
  41. Coldebella, P.F.; Fagundes-Klen, M.R.; Nishi, L.; Valverde, K.C.; Cavalcanti, E.B.; dos Santos, O.A.; Bergamasco, R. Potential Effect of Chemical and Thermal Treatment on the Kinetics, Equilibrium, and Thermodynamic Studies for Atrazine Biosorption by the Moringa oleifera Pods. Can. J. Chem. Eng. 2017, 95, 961–973. [Google Scholar] [CrossRef]
  42. Nasri, N.S.; Basri, H.; Garba, A. Synthesis and Characterization of Low-Cost Porous Carbon from Palm Oil Shell via K2CO3 Chemical Activation Process. Appl. Mech. Mater. 2015, 735, 36–40. [Google Scholar] [CrossRef]
  43. Ghani, W.A.W.A.K.; Mohd, A.; da Silva, G.; Bachmann, R.T.; Taufiq-Yap, Y.H.; Rashid, U.; Al-Muhtaseb, A.H. Biochar Production from Waste Rubber-Wood-Sawdust and Its Potential Use in C Sequestration: Chemical and Physical Characterization. Ind. Crops Prod. 2013, 44, 18–24. [Google Scholar] [CrossRef]
  44. Rodrigues, L.R.; Teixeira, J.A.; van der Mei, H.C.; Oliveira, R. Physicochemical and Functional Characterization of a Biosurfactant Produced by Lactococcus lactis 53. Colloids Surf. B Biointerfaces 2006, 49, 79–86. [Google Scholar] [CrossRef] [PubMed]
  45. Nelson, D.L.; Cox, M.M. Princípios de Bioquímica de Lehninger, 5th ed.; Artmed: Porto Alegre, Brazil, 2011. [Google Scholar]
  46. Alemdar, A.; Sain, M. Isolation and Characterization of Nanofibers from Agricultural Residues—Wheat Straw and Soy Hulls. Bioresour. Technol. 2008, 99, 1664–1671. [Google Scholar] [CrossRef] [PubMed]
  47. Pan, J.; Guan, B. Adsorption of Nitrobenzene from Aqueous Solution on Activated Sludge Modified by Cetyltrimethylammonium Bromide. J. Hazard. Mater. 2010, 183, 341–346. [Google Scholar] [CrossRef] [PubMed]
  48. Luo, J.; Li, X.; Ge, C.; Müller, K.; Yu, H.; Huang, P.; Li, J.; Tsang, D.C.W.; Bolan, N.S.; Rinklebe, J.; et al. Sorption of Norfloxacin, Sulfamerazine and Oxytetracycline by KOH-Modified Biochar under Single and Ternary Systems. Bioresour. Technol. 2018, 263, 385–392. [Google Scholar] [CrossRef] [PubMed]
  49. Meneghel, A.P.; Gonçalves, A.C., Jr.; Strey, L.; Rubio, F.; Schwantes, D.; Casarin, J. Biosorption and Removal of Chromium from Water by Using Moringa Seed Cake (Moringa oleifera Lam.). Quim. Nova 2013, 36, 1104–1110. [Google Scholar] [CrossRef]
  50. Shamsuddin, M.S.; Yusoff, N.R.N.; Sulaiman, M.A. Synthesis and Characterization of Activated Carbon Produced from Kenaf Core Fiber Using H3PO4 Activation. Procedia Chem. 2016, 19, 558–565. [Google Scholar] [CrossRef]
  51. Tee, E.; Tallo, I.; Kurig, H.; Thomberg, T.; Jänes, A.; Lust, E. Huge Enhancement of Energy Storage Capacity and Power Density of Supercapacitors Based on the Carbon Dioxide Activated Microporous SiC-CDC. Electrochim. Acta 2015, 161, 364–370. [Google Scholar] [CrossRef]
  52. Chen, Y.; Syed-Hassan, S.S.A.; Xiong, Z.; Li, Q.; Hu, X.; Xu, J.; Ren, Q.; Deng, Z.; Wang, X.; Su, S.; et al. Temporal and Spatial Evolution of Biochar Chemical Structure during Biomass Pellet Pyrolysis from the Insights of Micro-Raman Spectroscopy. Fuel Process. Technol. 2021, 218, 106839. [Google Scholar] [CrossRef]
  53. Liu, X.; He, C.; Yu, X.; Bai, Y.; Ye, L.; Wang, B.; Zhang, L. Net-like Porous Activated Carbon Materials from Shrimp Shell by Solution-Processed Carbonization and H3PO4 Activation for Methylene Blue Adsorption. Powder Technol. 2018, 326, 181–189. [Google Scholar] [CrossRef]
  54. Guo, Y.; Li, Y.; Wang, J.; Zhu, T.; Ye, M. Effects of Activated Carbon Properties on Chlorobenzene Adsorption and Adsorption Product Analysis. Chem. Eng. J. 2014, 236, 506–512. [Google Scholar] [CrossRef]
  55. Guizani, C.; Haddad, K.; Limousy, L.; Jeguirim, M. New Insights on the Structural Evolution of Biomass Char upon Pyrolysis as Revealed by the Raman Spectroscopy and Elemental Analysis. Carbon 2017, 119, 519–521. [Google Scholar] [CrossRef]
  56. Zuo, S.; Yang, J.; Liu, J. Effects of the Heating History of Impregnated Lignocellulosic Material on Pore Development during Phosphoric Acid Activation. Carbon 2010, 48, 3293–3295. [Google Scholar] [CrossRef]
  57. Cao, Q.; Xie, K.C.; Lv, Y.K.; Bao, W.R. Process Effects on Activated Carbon with Large Specific Surface Area from Corn Cob. Bioresour. Technol. 2006, 97, 110–115. [Google Scholar] [CrossRef] [PubMed]
  58. Aarab, N.; Hsini, A.; Essekri, A.; Laabd, M.; Lakhmiri, R.; Albourine, A. Removal of an Emerging Pharmaceutical Pollutant (Metronidazole) Using PPY-PANi Copolymer: Kinetics, Equilibrium and DFT Identification of Adsorption Mechanism. Groundw. Sustain. Dev. 2020, 11, 100416. [Google Scholar] [CrossRef]
  59. Carrales-Alvarado, D.H.; Rodríguez-Ramos, I.; Leyva-Ramos, R.; Mendoza-Mendoza, E.; Villela-Martínez, D.E. Effect of Surface Area and Physical–Chemical Properties of Graphite and Graphene-Based Materials on Their Adsorption Capacity towards Metronidazole and Trimethoprim Antibiotics in Aqueous Solution. Chem. Eng. J. 2020, 402, 126155. [Google Scholar] [CrossRef]
  60. Hendrasarie, N.; Maria, S.H. Combining Grease Trap and Moringa Oleifera as Adsorbent to Treat Wastewater Restaurant. S. Afr. J. Chem. Eng. 2021, 37, 196–205. [Google Scholar] [CrossRef]
  61. Rudzinski, W.; Everett, D.H. Adsorption of Gases on Heterogeneous Surfaces; Academic Press: London, UK, 1992. [Google Scholar]
  62. Habibi, A.; Belaroui, L.S.; Bengueddach, A.; López Galindo, A.; Sainz Díaz, C.I.; Peña, A. Adsorption of Metronidazole and Spiramycin by an Algerian Palygorskite. Effect of Modification with Tin. Microporous Mesoporous Mater. 2018, 268, 293–302. [Google Scholar] [CrossRef]
  63. Araujo, L.A.; Bezerra, C.O.; Cusioli, L.F.; Silva, M.F.; Nishi, L.; Gomes, R.G.; Bergamasco, R. Moringa oleifera Biomass Residue for the Removal of Pharmaceuticals from Water. J. Environ. Chem. Eng. 2018, 6, 7192–7199. [Google Scholar] [CrossRef]
  64. Kariim, I.; Abdulkareem, A.S.; Abubakre, O.K. Development and Characterization of MWCNTs from Activated Carbon as Adsorbent for Metronidazole and Levofloxacin Sorption from Pharmaceutical Wastewater: Kinetics, Isotherms and Thermodynamic Studies. Sci. Afr. 2020, 7, e00242. [Google Scholar] [CrossRef]
  65. Xavier, C.S.F.; Vieira, F.F.; Alves, M.P.; de Sousa, J.T. Use of Sugarcane Bagasse in the Adsorption of Textile Dyes in Aqueous Solutions. Res. Soc. Dev. 2021, 10, e59110716974. [Google Scholar] [CrossRef]
  66. Weber, W.J.; Morris, J.C. Advances in Water Pollution Research: Removal of Biologically Resistant Pollutant from Waste Water by Adsorption. In Proceedings of the 1st International Conference on Water Pollution; Pergamon Press: Oxford, UK, 1962; Volume 2, pp. 231–266. [Google Scholar]
  67. Juang, R.S.; Wu, F.C.; Tseng, R.L. Characterization and Use of Activated Carbons Prepared from Bagasses for Liquid-Phase Adsorption. Colloids Surf. A Physicochem. Eng. Asp. 2002, 201, 191–199. [Google Scholar] [CrossRef]
  68. Sun, Q.; Yang, L. The Adsorption of Basic Dyes from Aqueous Solution on Modified Peat–Resin Particle. Water Res. 2003, 37, 1535–1544. [Google Scholar] [CrossRef]
  69. Cussler, E.L. Diffusion: Mass Transfer in Fluid Systems, 2nd ed.; Cambrigde University: New York, NY, USA, 1997. [Google Scholar]
  70. Foo, K.Y.; Hameed, B.H. Insights into the Modeling of Adsorption Isotherm Systems. Chem. Eng. J. 2010, 156, 2–10. [Google Scholar] [CrossRef]
  71. Sepehr, M.N.; Kazemian, H.; Ghahramani, E.; Amrane, A.; Sivasankar, V.; Zarrabi, M. Defluoridation of Water via Light Weight Expanded Clay Aggregate (LECA): Adsorbent Characterization, Competing Ions, Chemical Regeneration, Equilibrium and Kinetic Modeling. J. Taiwan Inst. Chem. Eng. 2014, 45, 1821–1834. [Google Scholar] [CrossRef]
  72. Kalhori, E.M.; Al-Musawi, T.J.; Ghahramani, E.; Kazemian, H.; Zarrabi, M. Enhancement of the Adsorption Capacity of the Light-Weight Expanded Clay Aggregate Surface for the Metronidazole Antibiotic by Coating with MgO Nanoparticles: Studies on the Kinetic, Isotherm, and Effects of Environmental Parameters. Chemosphere 2017, 175, 8–20. [Google Scholar] [CrossRef]
  73. Ahmed, M.J.; Theydan, S.K. Microporous Activated Carbon from Siris Seed Pods by Microwave-Induced KOH Activation for Metronidazole Adsorption. J. Anal. Appl. Pyrolysis 2013, 99, 101–109. [Google Scholar] [CrossRef]
  74. Carrales-Alvarado, D.H.; Ocampo-Pérez, R.; Leyva-Ramos, R.; Rivera-Utrilla, J. Removal of the Antibiotic Metronidazole by Adsorption on Various Carbon Materials from Aqueous Phase. J. Colloid Interface Sci. 2014, 436, 276–285. [Google Scholar] [CrossRef]
  75. Ma, F.; Peng, C.; Hou, D.; Wu, B.; Zhang, Q.; Li, F.; Gu, Q. Citric Acid Facilitated Thermal Treatment: An Innovative Method for the Remediation of Mercury Contaminated Soil. J. Hazard. Mater. 2015, 300, 546–552. [Google Scholar] [CrossRef] [PubMed]
  76. Bulmău, C.; Mărculescu, C.; Lu, S.; Qi, Z. Analysis of Thermal Processing Applied to Contaminated Soil for Organic Pollutants Removal. J. Geochem. Explor. 2014, 147, 298–305. [Google Scholar] [CrossRef]
Figure 1. Predicted values and desirability of biochars as a function of temperature, heating rate, and time.
Processes 12 00560 g001
Figure 2. pHpzc of the BCM (a), BCH3PO4 (b), and BCKOH (c).
Processes 12 00560 g002
Figure 3. SEM of biochars BCM (a), BCH3PO4 (b), and BCKOH (c).
Processes 12 00560 g003aProcesses 12 00560 g003b
Figure 4. XRD of the BCM, BCH3PO4, and BCKOH.
Processes 12 00560 g004
Figure 5. Results of TGA and DTG analyses of M. oleifera seed shells (a), BCM (b), BCH3PO4 (c), and BCKOH (d).
Processes 12 00560 g005
Figure 6. FTIR spectra of BCM (a), BCH3PO4 (b), and BCH3PO4 after adsorption (c).
Processes 12 00560 g006
Figure 7. FTIR spectra of BCM (a) BCKOH (b), and BCKOH after adsorption (c).
Processes 12 00560 g007
Figure 8. Raman spectra of BCM, BCH3PO4, and BCKOH.
Processes 12 00560 g008
Figure 9. Adsorption tests of 24 h analyzing the removal (a) and adsorption capacity (b).
Processes 12 00560 g009
Figure 10. MNZ adsorption tests at different pH for BCH3PO4 (a) and BCKOH (b).
Processes 12 00560 g010
Figure 11. Metronidazole adsorption kinetics from BCH3PO4 in 30 mg L−1 (a), 45 mg L−1 (b), and 60 mg L−1 (c).
Processes 12 00560 g011
Figure 12. Metronidazole adsorption kinetics from BCKOH in 150 mg L−1 (a), 250 mg L−1 (b), and 350 mg L−1 (c).
Processes 12 00560 g012
Figure 13. Metronidazole adsorption kinetics adjusted to the diffusion-intraparticle model of the BCH3PO4 in 45 mg L−1 (a) and BCKOH in 250 mg L−1 (b).
Processes 12 00560 g013
Figure 14. Metronidazole adsorption isotherm using BCH3PO4 (a) and BCKOH (b).
Processes 12 00560 g014
Figure 15. Desorption rate of BCH3PO4.
Processes 12 00560 g015
Figure 16. Desorption rate of BCKOH.
Processes 12 00560 g016
Table 1. Biochar characterization.
TechniqueMethodologyEquipment
pHpzcMethodology based on the “11 points” method proposed by [22] -
SEMThe High and Low VacuumFEI Quanta 250 (Hillsboro, OR, USA)
XRDThe analysis conditions used a 40 KV copper tube lamp and a 30 mA current at a preset counting time of 120.32 s with the initial 2Θ of 5° and 80° at the end. The X’Pert HighScore 2.1.1 software database was used to understand the analysis results.X-ray diffractometry (BRUKER) equipment
TGA and DTG-SDT Q600 V20.9 Build 20 (TA instruments, New Castle, DE, USA)
Nitrogen adsorption/desorptionWhere the samples were dried at 150 °C for 3 h. The specific surface (SBET) and pore volume were determined using the Brunauer–Emmett-Teller (BET) method, where the total pore volume (Vp) was calculated by the P/Po ratio.Micromeritics, ASAP 2020 PLUS (Norcross, GA, USA)
FTIRSpectral range of 4000 to 400 cm−1, with a resolution of 4 cm−1 and 124 scans.Bruker’s Vertex 70v
RAMANSpectral range of 800–1800 cm−1, with the laser at a wavelength of 532 nm with a power of 20 mW, at a resolution of 9–15 cm−1. The baseline has been corrected using OPUS 7.5 software (Bruker, Ettlingen, Alemanha).Bruker’s Micro Raman Senterra
Table 2. Immediate analysis and elementary analysis of BCM.
Race OrderTemperature °CHeating Rate °C Min−1Residence Time (Min)C%Yield (%)
2500 (−1)10 (−1)40 (−1)72.9735.0
7700 (1)10 (−1)40 (−1)76.6332.69
1600 (0)15 (0)60 (0)77.3431.92
3700 (1)10 (−1)80 (1)77.4830.76
4500 (−1)20 (1)80 (1)75.2938.07
6500 (−1)20 (1)40 (−1)73.6236.92
5700 (1)20 (1)40 (−1)78.3931.53
9500 (−1)10 (−1)80 (1)73.8031.53
8700 (1)20 (1)80 (1)77.4436.53
Table 3. ANOVA table for yield.
Yield
FactorSum of SquaresDegrees of FreedomMean SquareF-Statisticp-Value
(1) Temperature49.75031149.7503119.886110.046786
(2) Heating rate1.2246111.224610.489500.556575
(3) Time0.0703110.070310.028110.882281
1 and 21.8528111.852810.740600.480160
1 and 32.5878112.587811.034400.416142
2 and 30.3240110.324010.129510.753386
Error5.0035222.50176
TSQ60.813408
TSQ—Total sum of squares. R² 0.9177.
Table 4. ANOVA table for carbon content.
Carbon Content
FactorSum of SquaresDegrees of FreedomMean SquareF-Statisticp-Value
(1) Temperature37.97561137.9756137.525050.025629
(2) Heating rate1.4365111.436511.419470.355707
(3) Time0.4465110.446510.441210.574870
1 and 20.0300110.030010.029660.879122
1 and 31.5400111.540011.521740.342658
2 and 30.1770110.177010.174910.716411
Error2.0240121.01201
TSQ43.629698
TSQ—Total sum of squares. R² 0.9536.
Table 5. N2 adsorption/desorption.
BCMBCH3PO4BCKOH
SBET (m² g−1)1.7821.371135.14
Vp (cm3 g−1)00.010.61
SMESOP (m² g−1)0.1713.76358.71
VMICROP (cm3 g−1)000.37
VMESOP (cm3 g−1)00.010.24
Table 6. Raman spectra parameters.
BiocharBand DBand GR
Raman Shift (cm−1)IntensityRaman Shift (cm−1)IntensityID/IG
BCM13301763157621410.823
BCH3PO4133028415843720.763
BCKOH133033515833600.93
Table 7. Kinetic parameters of metronidazole adsorption.
ModelMetronidazole BCH3PO4Metronidazole BCKOH
30 mg L−145 mg L−160 mg L−1150 mg L−1250 mg L−1350 mg L−1
Pseudo-first orderqt
(mg g−1)
0.2390.2690.3820.7500.8420.524
k1
(min−1)
7.137.807.5165.84243.2279.8
0.770.900.890.9580.9540.935
Adj. R²0.7490.890.8850.9540.950.927
Pseudo-second orderqt
(mg g−1)
0.0450.0530.0750.008160.00680.0029
k2
(g mg−1 min−1)
7.528.177.82170.9248.5291.8
R20.880.970.960.9850.9770.976
Adj. R²0.8730.9670.960.9830.9740.973
ElovichA
(g mg−1 min−1)
74.49298.116753.2661.783.21
B
(mg g−1)
1.291.351.6730.110.0860.049
R20.9870.9880.9930.9960.9980.995
Adj. R²0.9860.9860.9920.9960.9970.995
Table 8. Parameters of the diffusion-intraparticle model.
BCH3PO4
Stage 1Stage 2Stage 3
kdif
(mg g−1 min−0.5)
C
(mg g−1)
kdif
(mg g−1 min−0.5)
C
(mg g−1)
kdif
(mg g−1 min−0.5)
C
(mg g−1)
0.5746.120.8793.3680.200.9850.556.130.91
BCKOH
Stage 1Stage 2Stage 3
kdif
(mg g−1 min−0.5)
C
(mg g−1)
kdif
(mg g−1 min−0.5)
C
(mg g−1)
kdif
(mg g−1 min−0.5)
C
(mg g−1)
118.0520.290.88611.97207.10.9370.6264.90.92
Table 9. Isotherm model fitting parameters.
BCH3PO4
FreundlichSipsLangmuir
Kf
(L mg−1)
n Ks
(L mg−1)
nQmax (mg g−1)Kl
(L mg−1)
Qmax (mg g−1)
1.441.9850.9760.0110.7628.640.9880.01724.490.987
BCKOH
FreundlichSipsLangmuir
Kf
(L mg−1)
n Ks
(L mg−1)
nQmax (mg g−1)Kl
(L mg−1)
Qmax
(mg g−1)
17.972.170.9570.00581.45396.170.9980.0039486.010.99
Disclaimer/Publisher’s Note: The statements, opinions and data contained in all publications are solely those of the individual author(s) and contributor(s) and not of MDPI and/or the editor(s). MDPI and/or the editor(s) disclaim responsibility for any injury to people or property resulting from any ideas, methods, instructions or products referred to in the content.

