Article

Characterization of Contact Pressure Distribution and Bruising Prediction of Apple under Compression Loading

1
College of Mechanical and Electrical Engineering, Shihezi University, Shihezi 832003, China
2
Key Laboratory of Northwest Agriculture Equipment, Ministry Agriculture & Rural Affairs, Shihezi 832003, China
*
Author to whom correspondence should be addressed.
These authors contributed equally to this work.
Processes 2024, 12(3), 543; https://doi.org/10.3390/pr12030543
Submission received: 31 January 2024 / Revised: 18 February 2024 / Accepted: 25 February 2024 / Published: 10 March 2024
(This article belongs to the Special Issue Agriculture Products Processing and Storage)

Abstract

:
The pressure distribution characteristics of an apple subjected to compressive loading were investigated using the pressure-sensitive film (PSF) technique combined with apple bruise measurements. Pressure was unevenly distributed in the elliptical contact region. The average pressure had no effect on bruising because it changed slightly in the range of 0.26–0.31 MPa with increasing load. Pressures of 0.20–0.40 MPa accounted for 72% of the total pressure area. Comparatively, the area where pressure over 0.50 MPa was distributed could be ignored and showed little contribution to the bruise area. The contact edge subjected to pressure below 0.10 MPa showed that no bruising occurred. As a result, the relationship between the ≥0.10 MPa pressure area strongly correlated with the bruise area according to a linear equation, with a correlation coefficient of ≥0.99. When this relationship was applied to determine the bruise area with FE, satisfactory predicted results were obtained with minor error rates of 0–7.89% for loads of 54–80 N. But larger prediction errors occurred when the load was above 90 N, suggesting that the linear elastic FE model may not be appropriate for accurately predicting apple bruising.

1. Introduction

After harvest, apples may be subjected to different types of loading that may lead to mechanical damage as they are packaged, sorted, stored, and transported, with the two main types being static and dynamic. Among them, the wastage figure resulting from static loading could be 30% or higher every year. The data indicate that static loading has commonly caused apple damage. Hence, the focus of this work is on apple bruising due to static loading.
Studies on apple bruising have been carried out previously, using a variety of methods. Most empirical studies were based on bruise volume, bruise depth, bruise area, etc. [1,2,3,4,5,6]. The critical issue is that observing or measuring the volume and depth of the bruise is not easy. On the contrary, in practice, there is greater interest in the commercially significant damaged areas with visible bruising, which are assessed negatively by commercial operators and consumers [7,8]. Therefore, the surface area of damage may be more important than the total volume of damage [9,10,11,12]. In this respect, damage area is essentially related to the contact pressures rather than the total applied force [4,13,14,15,16,17,18,19]. Early studies have estimated the contact area and pressure based on elastic contact theory [20]. But errors in the estimates of contact area can be around 20% because of clear limitations of this theory in describing materials as complex as fruit and vegetables [21], which exhibit both anisotropic properties and viscoelastic behavior [22,23,24,25].
Experimentally, measuring the contact pressure area is difficult. Some techniques have tried to determine the contact pressure area and pressure distribution. During the early period, Herold et al. used a tactile sensing system to study apple contact areas. Additionally, Rabelo et al. (2001) used a transducer board with micro-switches disposed in linear and radial directions to measure orange contact areas [1,26]. Afterwards, Dan et al. (2004, 2006, 2007) continuously studied the mechanical stress distributions of cucumber and food with an I-Scan50 sheet sensor [27,28,29]. The ultrasonic technique was also employed by Lewis et al. (2008) to characterize apple contact pressure distribution. It was noted that non-invasive pressure-sensitive film (PSF) can measure the contact pressure area as a new technique [19]. Because the measurement results with this film can be visualized vividly and directly, it has been widely used in medical engineering and physics initially [30,31,32,33,34,35,36]. Recently, studies involving the use of PSF for fruit contact pressure analysis have begun to increase [37,38,39,40,41,42]. However, until now, little data have been published to further discuss the relationship between PSF pressure area and bruise area (>, < or ≈), although there is no doubt that fruit bruising is the consequence of contact pressure development, so it is expected to make certain which pressure ranges can be well compared with bruised areas.
Apart from measurement methods, an alternative approach is to estimate stresses using finite element (FE) analysis, which provides a user-friendly format for interpreting bruise formation in fruits. Several studies have reported on the analysis of static and dynamic contact pressure on fruits with the FE method [4,19,43,44,45,46,47]. Nonetheless, there are some limitations to FE in predicting bruise area without data support and guidance from contact pressure measurements. It is noteworthy that Lewis et al. used measurements from the ultrasonic technique of apple contact areas and stresses under static loading to validate the output from an FE simulation [19]. With this in mind, if contact pressure measurements are combined with PSF, the FE method can achieve a high degree of accuracy in predicting apple wear areas under static contact. In addition, the use of the pressure-sensitive film (PSF) technique combined with finite element (FE) analysis for more accurate bruise prediction may not have been extensively explored in the previous literature.
Therefore, the aim of this study was to use the PSF technique to measure the contact areas and pressure of whole apple fruit under compression tests. Furthermore, the relationship between the PSF contact area and bruising area is determined. Finally, it is used to validate the output of an FE model of an apple to improve bruising area prediction. The results will ultimately be developed into a design tool for apple harvest and packaging machines to reduce the likelihood of apple bruising occurring.

2. Materials and Methods

2.1. Samples

“Aksufuji” apple is one of the main cultivated apple varieties in the Aksu area, widely loved by consumers for its high sweetness, crispness, sweet flesh, and juiciness.“Aksufuji” cultivar apples at a similar ripening stage were harvested on 15 October 2021 from an orchard located in Aksu city, Xinjiang Autonomous Region, China. The samples were selected carefully by hand to remove all damaged and defected apples and stored at 2 ± 1 °C temperature and 90 ± 5% relative humidity (RH) immediately. Firmness, soluble solid content, and water content tests were carried out on the apple prior to testing to ensure that samples with consistent properties were used (Table 1).

2.2. Compression Tests and PSF Measurements

Before the compression tests, the samples were maintained at room temperature (20 ± 1) °C for 24 h. According to the literature [27], the critical value of the yield stress of red Fuji apple pulp is 40–100 N. Preparatory tests in this study detected damage to apples beginning at 50~60 N. The sample was loaded at the contact point between two parallel flat plates by applying a load (50, 52, 54, 56, 58, 60, 70, 80, 90, and 100 N) to the upper plate. For compression, the pressure-sensitive film was fixed on the contact surface between the flat plate and the apple for 300 s. The curvature radius of the contact point was maintained at 35.5 ± 1.3 mm for all tests with a spherometer to eliminate its effect on the bruise area. One hundred samples of Aksufuji apples were collected for the test at each level. Each test was repeated 10 times. At the same time, PSF (Fuji Film Corporation, Tokyo, Japan) was placed between the sample and the upper plate to measure the pressure area and contact pressure. The maximum pressure in the contact remained at approximately 0.5 MPa for all the loads in the previous study; therefore, the ultra-super-low film was adopted for the compression tests of apples [19]. When force was applied to the A-film (Figure 1), the microcapsules broke, and the color-forming material reacted with the color-developing material to present multiple colors corresponding to the level of applied force. During compression, the PSF measurement was performed at 20–35 °C and 35–80% relative humidity. After a 5 min dwell time, the C-film was placed into a PerfectionTM V300 Photo (Epson Corporation, Suwa, Japan) scanner model to identify the image of the contact pressure distribution, as shown in Figure 2. An FPD-8010E pre-scale pressure graph system (Fuji Film Corporation) was used to analyze the images and obtain the contact pressure and pressure area.

2.3. Apple Bruise Measurements

In the browning treatment and damage area measurement of the fruit damage site under normal conditions, intracellular polyphenol oxidase (PPO) binds to the inner membrane of the organelle and is protected and controlled by the cell membrane. When the membranes of the apple tissues are damaged, PPO from the cytoplasm mixes with phenolic molecules from the vacuole. The reaction results in brown coloration. The enzymatic browning reaction process is affected by many factors, such as the presence of air and pH value. PPO becomes activated when the pH of the reaction environment is 6.0–7.4 [48]. Therefore, adjusting the pH could accelerate the enzymatic browning reaction in the damaged area to obtain a clear browning area on the damaged part of the fruit. To attain full enzymatic fruit browning, the loading region of the apple samples was completely peeled back to the skin and soaked for 4 h in a 1.2 M NaHCO3 solution (pH 7.1). The excess solution on the surface was removed with absorbent paper. A distinct apple bruise profile was formed and imported into Matlab 2014 software (The MathWorks Inc., Natick, MA, USA) to detect the bruise’s edge and calculate the area. The damaged contour area was extracted, and the Bwarea algorithm was used to calculate the contour area to obtain the hydrostatic damage area of the apples (Figure 3).

2.4. Finite Element Analysis

2.4.1. Model and Mesh Generation

To simplify the modeling of apples, isotropic and linear elastic material properties were assumed. To generate the apple’s geometry, an outline curve was created using image processing technology. Half of the curved surface was imported into Simulia Abaqus 2016 software (Dassault Systemes, Vélizy-Villacoublay, France) and rotated 360° around the longitudinal axis (stem–calix) to create a geometric model of the apple. Tetrahedral elements were used to mesh the apple model (Figure 4), and 69,600 elements were formed. Models of the plates were then created using the block volume. The upper and lower plates were meshed with 3000 hexahedral rigid elements. All geometrical models were meshed using three-dimensional structural solid elements (SOLID185). The parameter values of the material properties used in meshing are listed in Table 2.

2.4.2. Simulation Analysis

The concept of equivalent stress has been used in failure analyses of agricultural materials [45,49]. The equivalent stress analysis followed the Von Mises failure criterion. Equivalent stresses are the functions of the three principal normal stresses (σ1, σ2, and σ3), which act in the perpendicular direction to the surface of the object, and they can be calculated using the following equation [14]:
(σ1σ2)2 + (σ2σ3)2 + (σ3σ1)2 = 2σe2
where σe is Von Mises stress or equivalent stress; σ1, σ2, and σ3 are the principal stresses (σ1σ2σ3).
To simulate actual compression tests, rigid-to-flexible contact pairs were created to represent the contact surfaces. The degrees of freedom of the plates were constrained to achieve axial compression. Loads were applied, and the desired analytical results, including the equivalent stress distribution, were obtained.

3. Results and Discussion

3.1. Changes in Bruise and PSF Contact Pressure Distribution

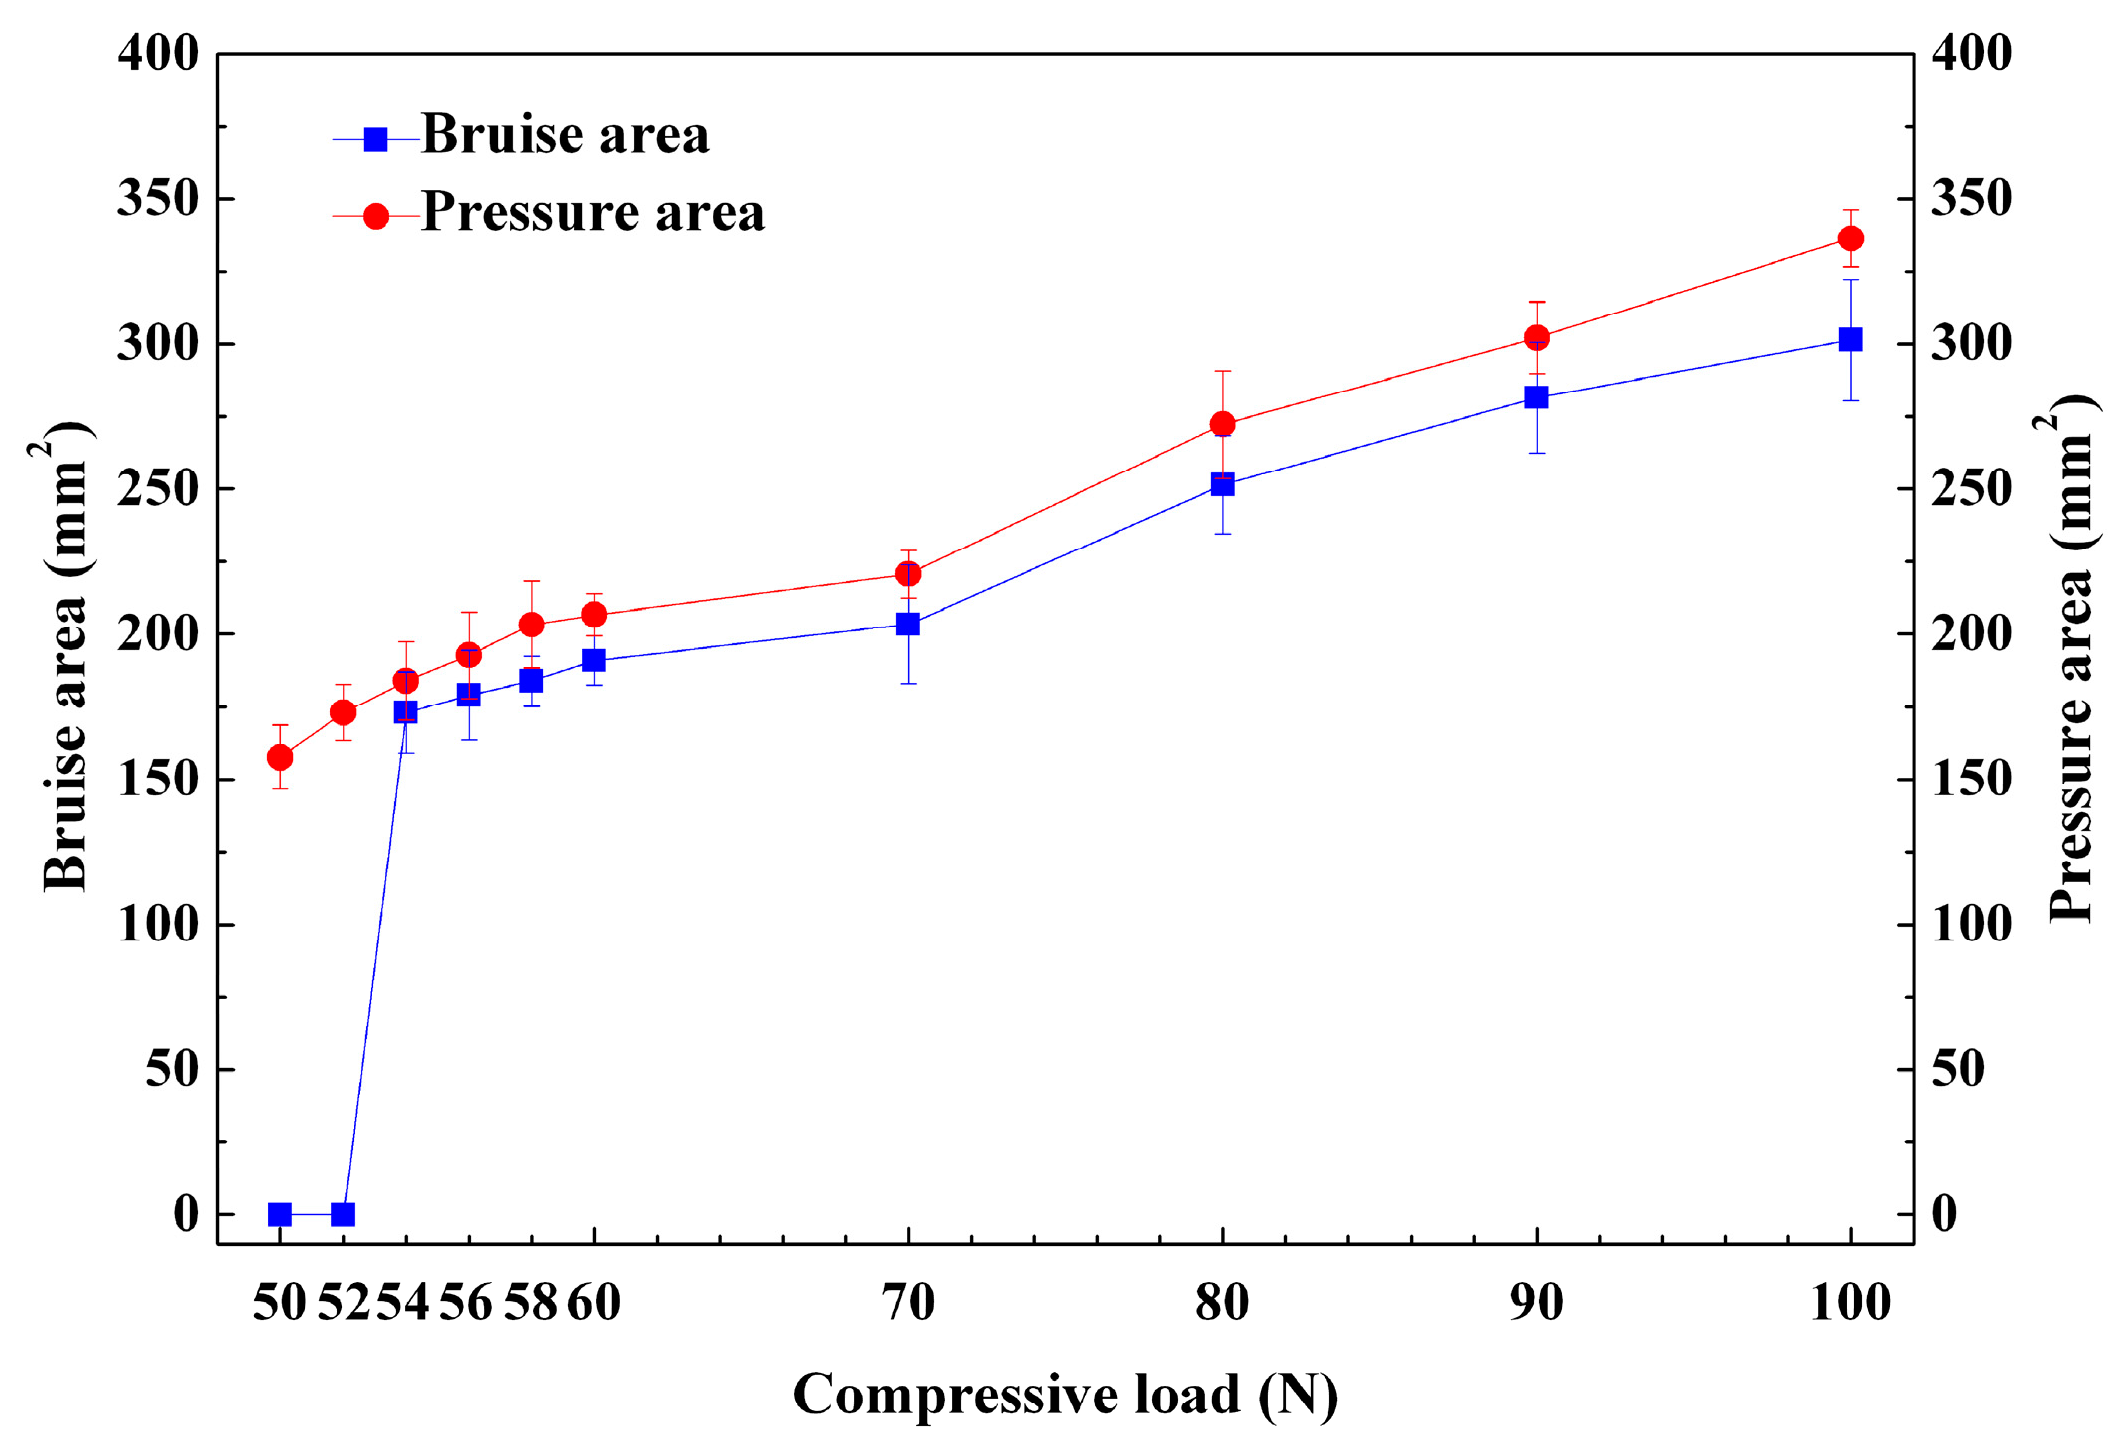
The apple bruises and contact pressure distributions are shown in Figure 5. The characteristic map of contact stress distribution in apples under different pressures revealed the tendency of the contour of the stress to be more similar to an ellipse. The stress distribution did not coincide with the contour of the damaged area under the corresponding pressure, and the area of stress distribution was larger than that of the damaged area. The lower stress (<0.10 MPa) was mainly distributed at the edge of the stress distribution area in a very small area. This was most likely the area of the stress distribution that did not cause damage to the apples. Because the pressure-sensitive film is sensitive to the roughness of a material’s surface, there are different degrees of bumps on the surface of the apples. Thus, there are still sporadic lower stresses inside the stress distribution area, which is consistent with the similar damage characteristics of apples subjected to pressure. No bruising was observed at loads of 50 and 52 N, although a contact pressure distribution could be observed. A small dent on the apple’s surface did not lead to any discoloration of the apple flesh. This may be because the apple flesh underwent elastic deformation at a relatively small load and did not reach the rupture point of the tissue. When the load was 54 N, a brown coloration associated with bruising occurred because of cell rupture. This suggests that the apple flesh most likely reached its failure or yield point at this load. In terms of this force and its corresponding bruise area, a calculated stress of 0.29 MPa would be close to the apple’s bioyield stress value. A similar value has been reported by Chakespari for failure stress in “Shafi Abadi” and “Golab Kohanz” apples, recorded at 0.37 and 0.32 MPa, respectively [6].
Compared with the actual bruised area, the pressure area on the PSF was slightly lower, which agrees with the ultrasonic measurements by Lewis et al. [19]. In addition, in Figure 6, the two trend lines for the bruise and pressure areas increase when the loads are kept nearly parallel, showing a relatively constant difference between the bruise area and pressure with changes in the applied load. The difference was 19.2 mm2, and the measured pressure area was approximately 9% higher than the bruised area.

3.2. The PSF Pressure Distribution Characteristics and Their Relationship with Bruising

The changes in the average pressure of apples with varying compressive loads are shown in Figure 7. For all loads, the average pressure fluctuated in the range of 0.26–0.31 MPa, showing no apparent changes. This means that apple bruise variation does not depend on the average pressure.
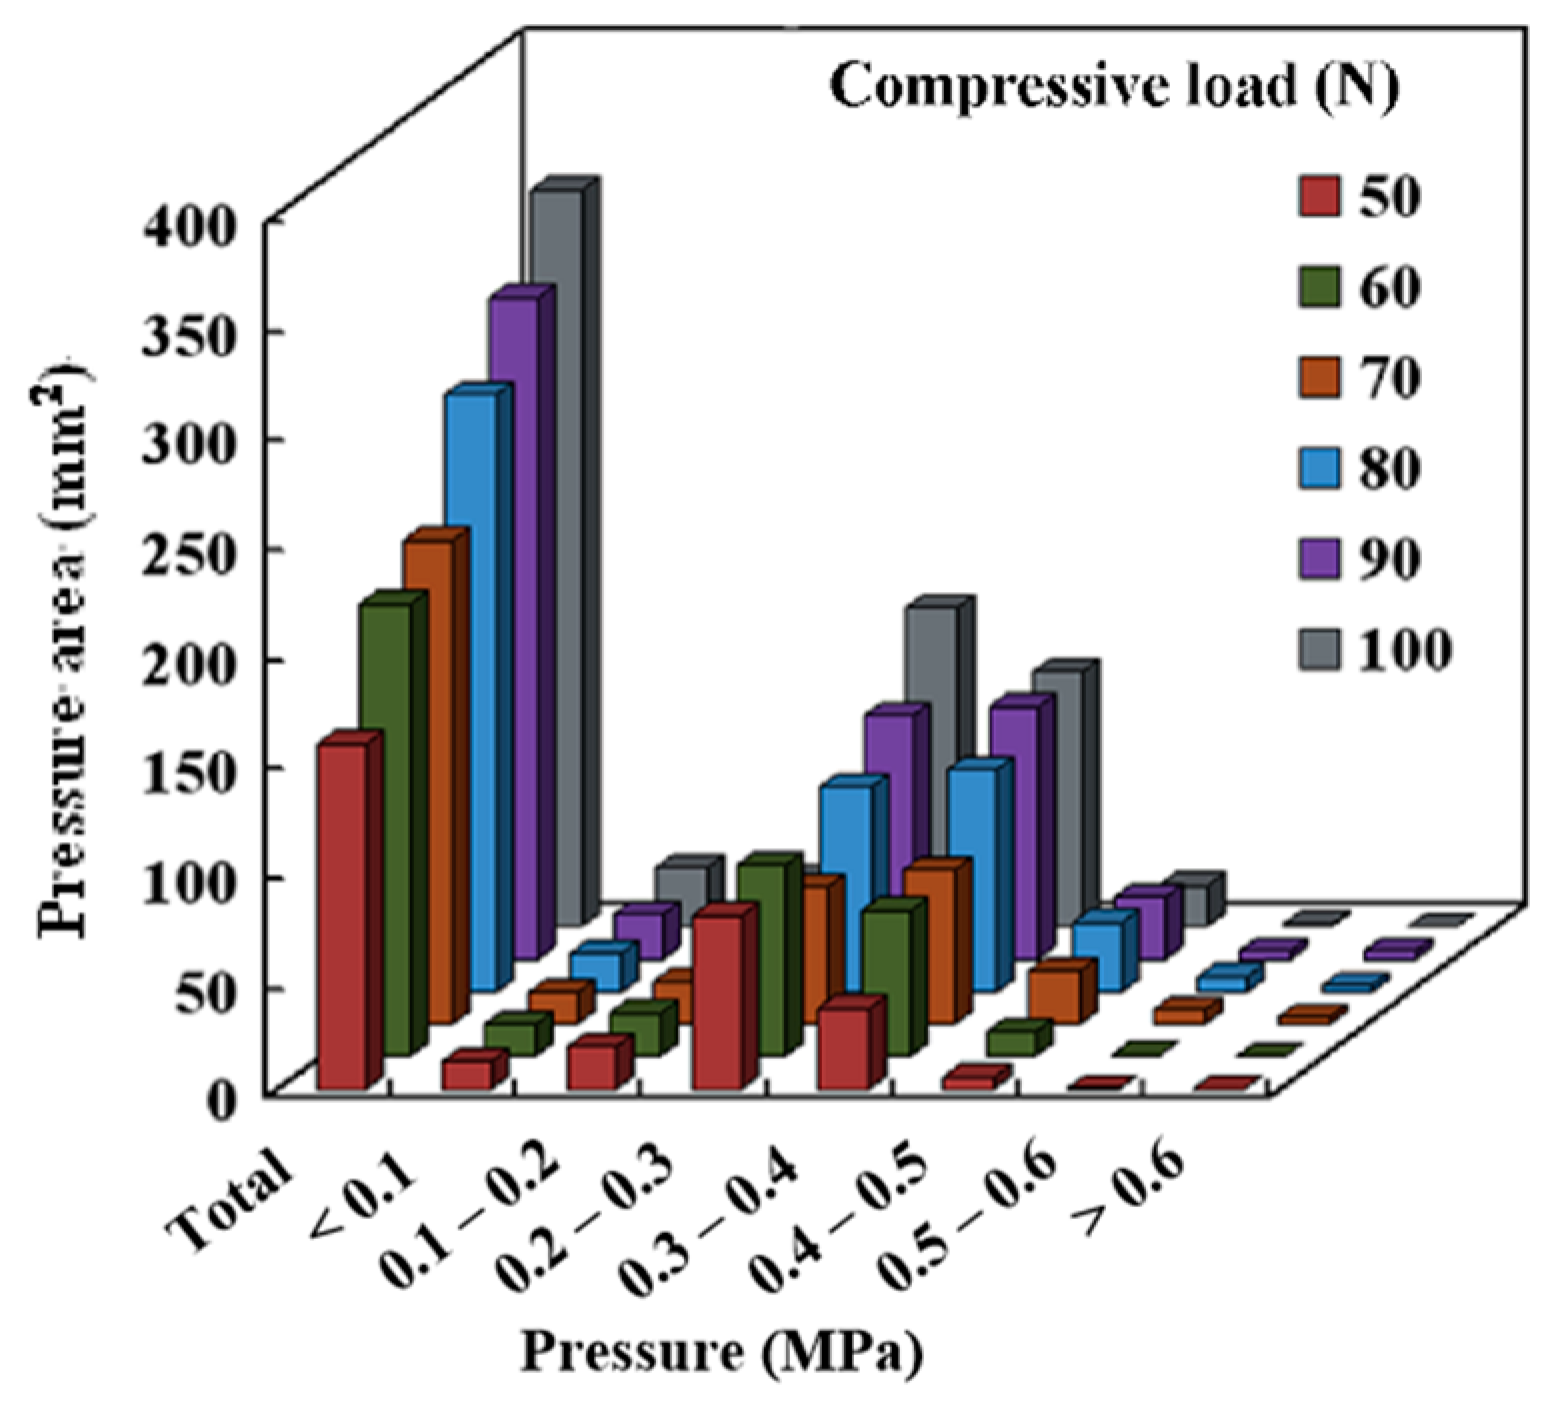
The PSF scans in Figure 5 show that the contact stress distribution on the apple at different pressures did not match the damaged contact area at its corresponding pressure. This is possible because PSF is sensitive to the roughness of the apple’s surface. The pressure was greater near the center of the contact area and lessened towards the edge. The histogram analysis of pressure distribution (Figure 8) showed that there was a relatively smaller area when the pressure was >0.40 MPa or <0.20 MPa. Especially for pressures ≥0.50 MPa, the distributed area was so small (only 1–11 mm2) that it could be ignored. This was probably because a few tiny sharp points on the apple’s surface caused concentrated areas of local stress. Therefore, it is evident that apple bruises cannot be influenced by peak pressure. Comparatively, the areas of pressure ranged from 0.20 to 0.40 MPa and accounted for 72% of the total pressure area. The tissue in this region may be ruptured and collapsed by the larger stress because the pressure of 0.29 MPa was an approximate value of apple failure stress (see Section 3.1).
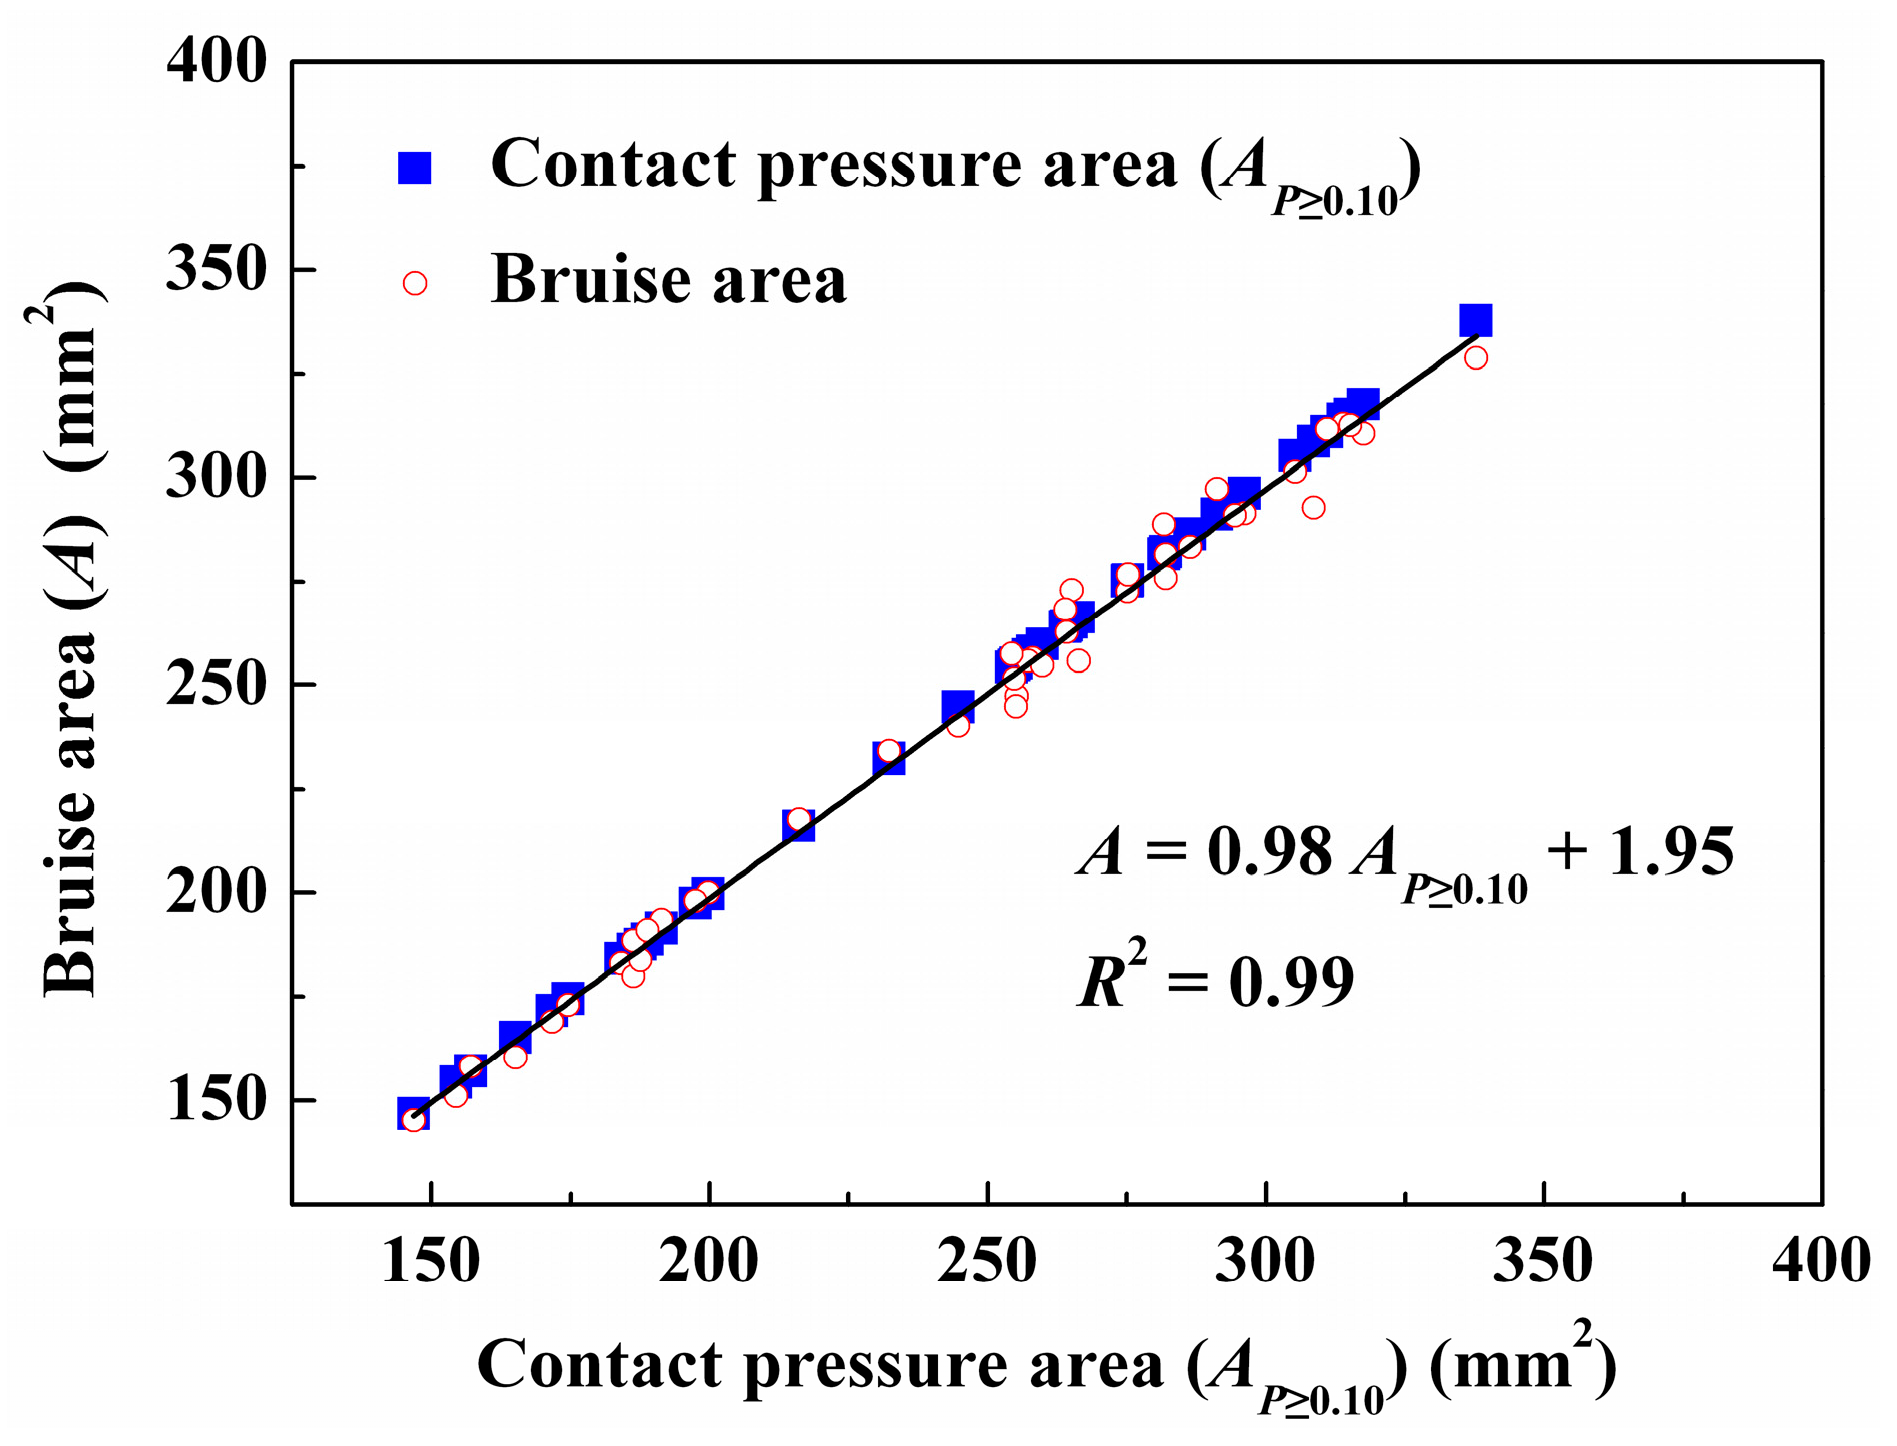
Additionally, the PSF scans showed that pressures ≥0.10 MPa were distributed mainly at the edge of the contact circle. The average area was just 16.9 mm2, which happened to coincide with the difference between the bruise area and total pressure area, as mentioned in Section 3.1. This makes us believe that the edge region subjected to the pressure of <0.10 MPa is likely to not be damaged. Comparisons of areas with five contact pressure ranges (≥0, ≥0.05, ≥0.10, ≥0.15, and ≥0.20 MPa) with bruise areas (Table 3) further proved that the areas of pressures of ≥0.10 MPa were closest to the bruised area among the five pressure ranges. When the area of this contact pressure range was applied to estimate the bruised area, the average error was only 1.66%. Hence, as shown in Figure 9, a fairly good linear relationship between the bruise area and ≥0.10 MPa pressure area was also determined (correlation coefficient R2 ≥0.99).
A = 0.98Ap≥0.10 + 1.95
where A is the bruise area, and Ap≥0.10 is the area of ≥0.10 MPa pressure (stress).
In summary, the average stress for apple pulp failure was 0.29 MPa, but the damaged area exceeded the stress distribution range of 0.29 MPa and reached 0.10 MPa. The rupture of the pulp under a stress of 0.29 MPa would lead to the collapse or rupture of the surrounding adjacent tissues, and the release of browning-inducing phenolics would further enhance this diffusion effect. The release of phenolics would further enhance the diffusion effect, and only pulp tissues in the stress range of <0.10 MPa might be relatively intact and not subjected to the browning effect of phenolics. From these analyses, it is clear that no browning damage occurred at <0.10 MPa stress at the edge of the compression edge, and only the area with stress ≥0.10 MPa was the actual damaged area of the apple.

3.3. Prediction of Bruise Area with FE Simulation of Contact Stress

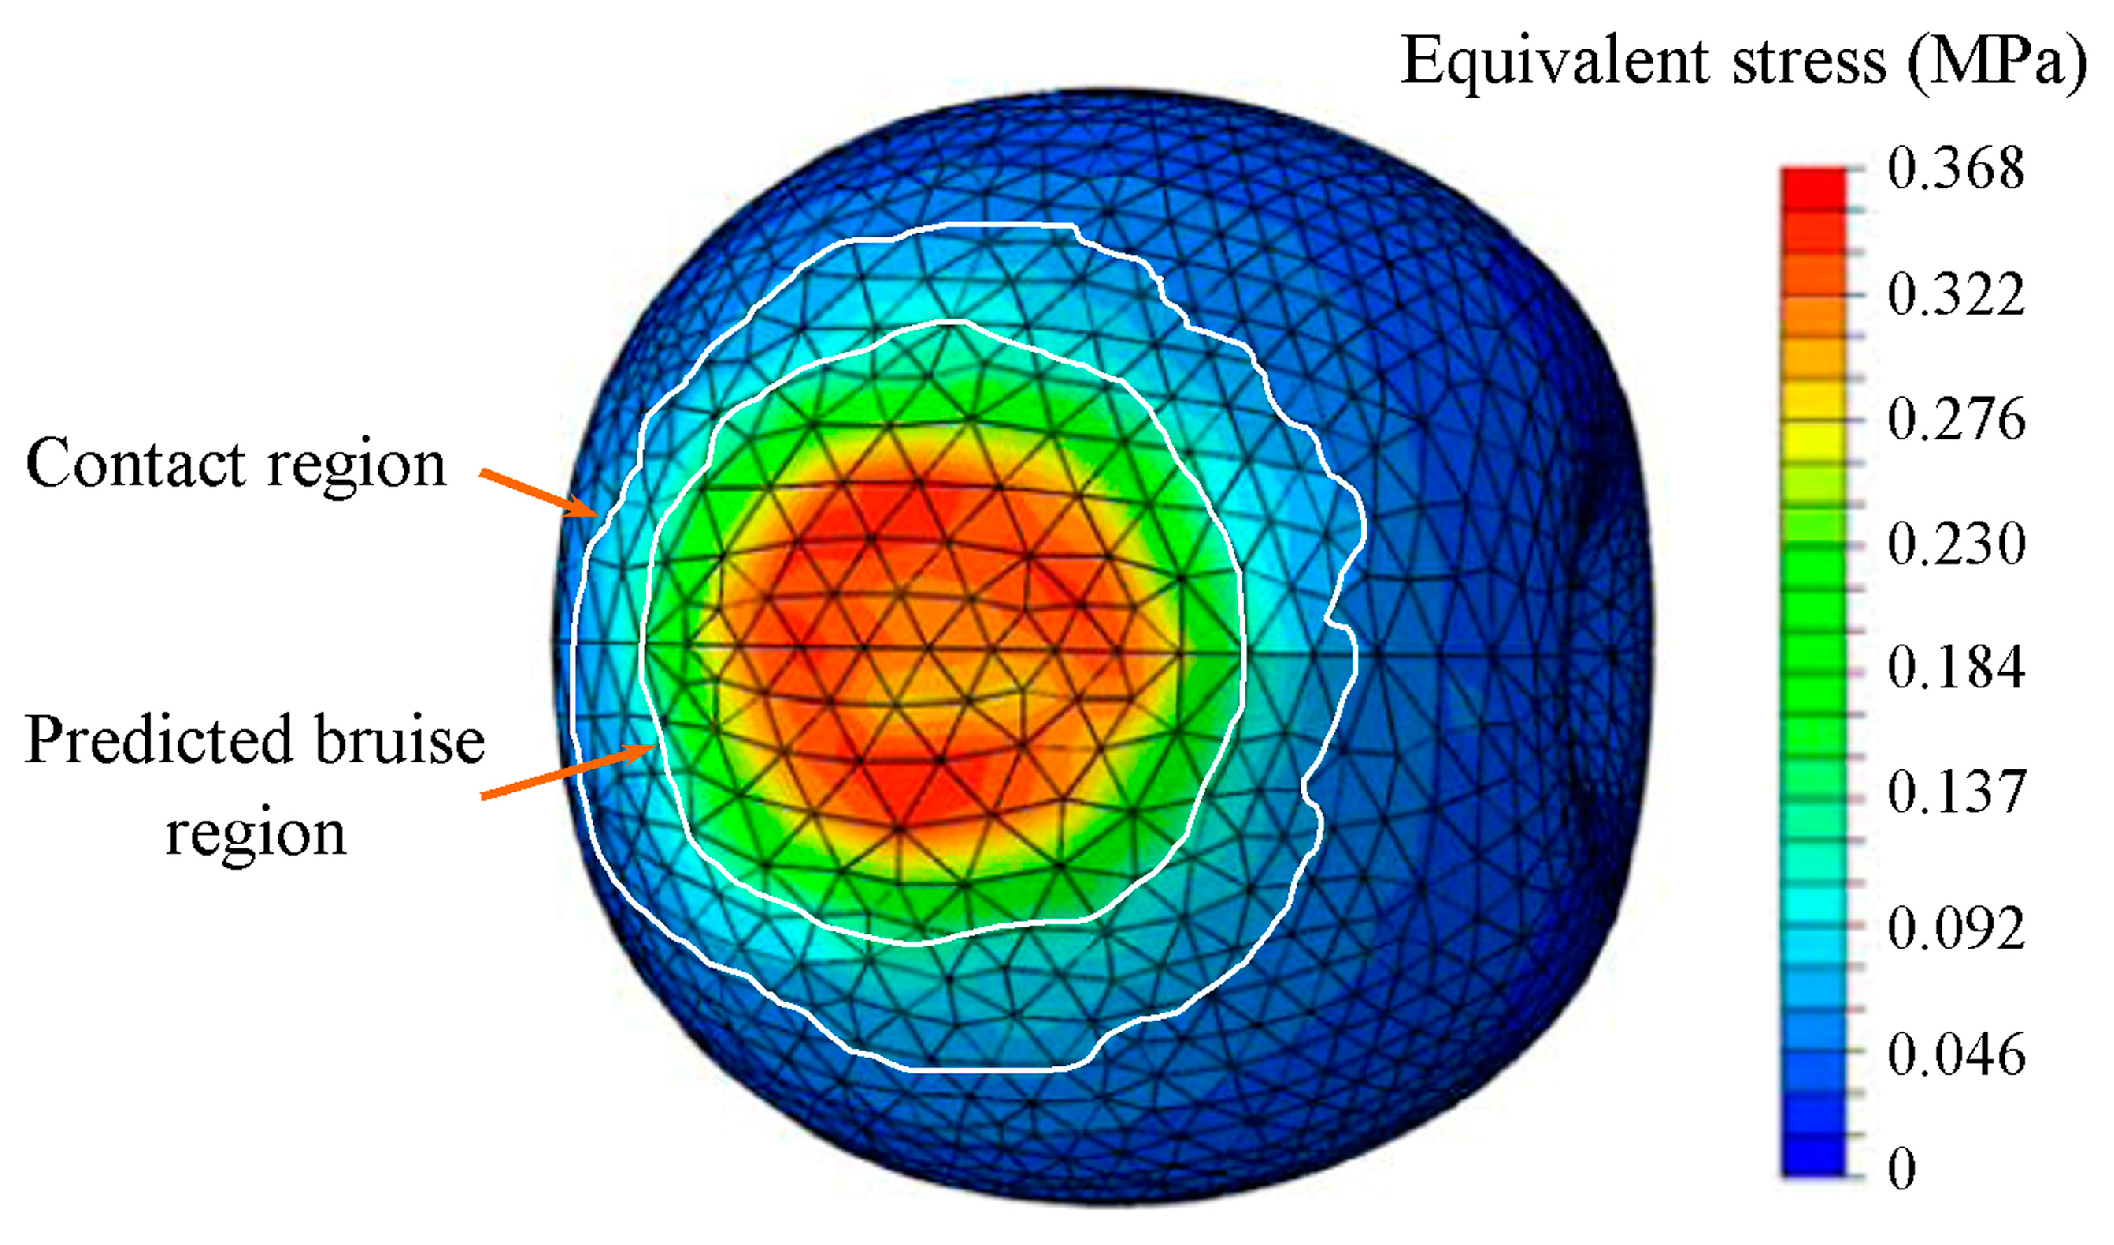
Figure 10 shows a typical plot of the FE simulation of the equivalent stress for apples compressed at 100 N. Unlike in the PSF scans, the stress did not display a fragmentary distribution. This may be because apple models with smooth surfaces were used in the FE analysis. Thus, the maximum contact stress was slightly lower than the value measured by the PSF, remaining at a level of 0.30–0.40 MPa.
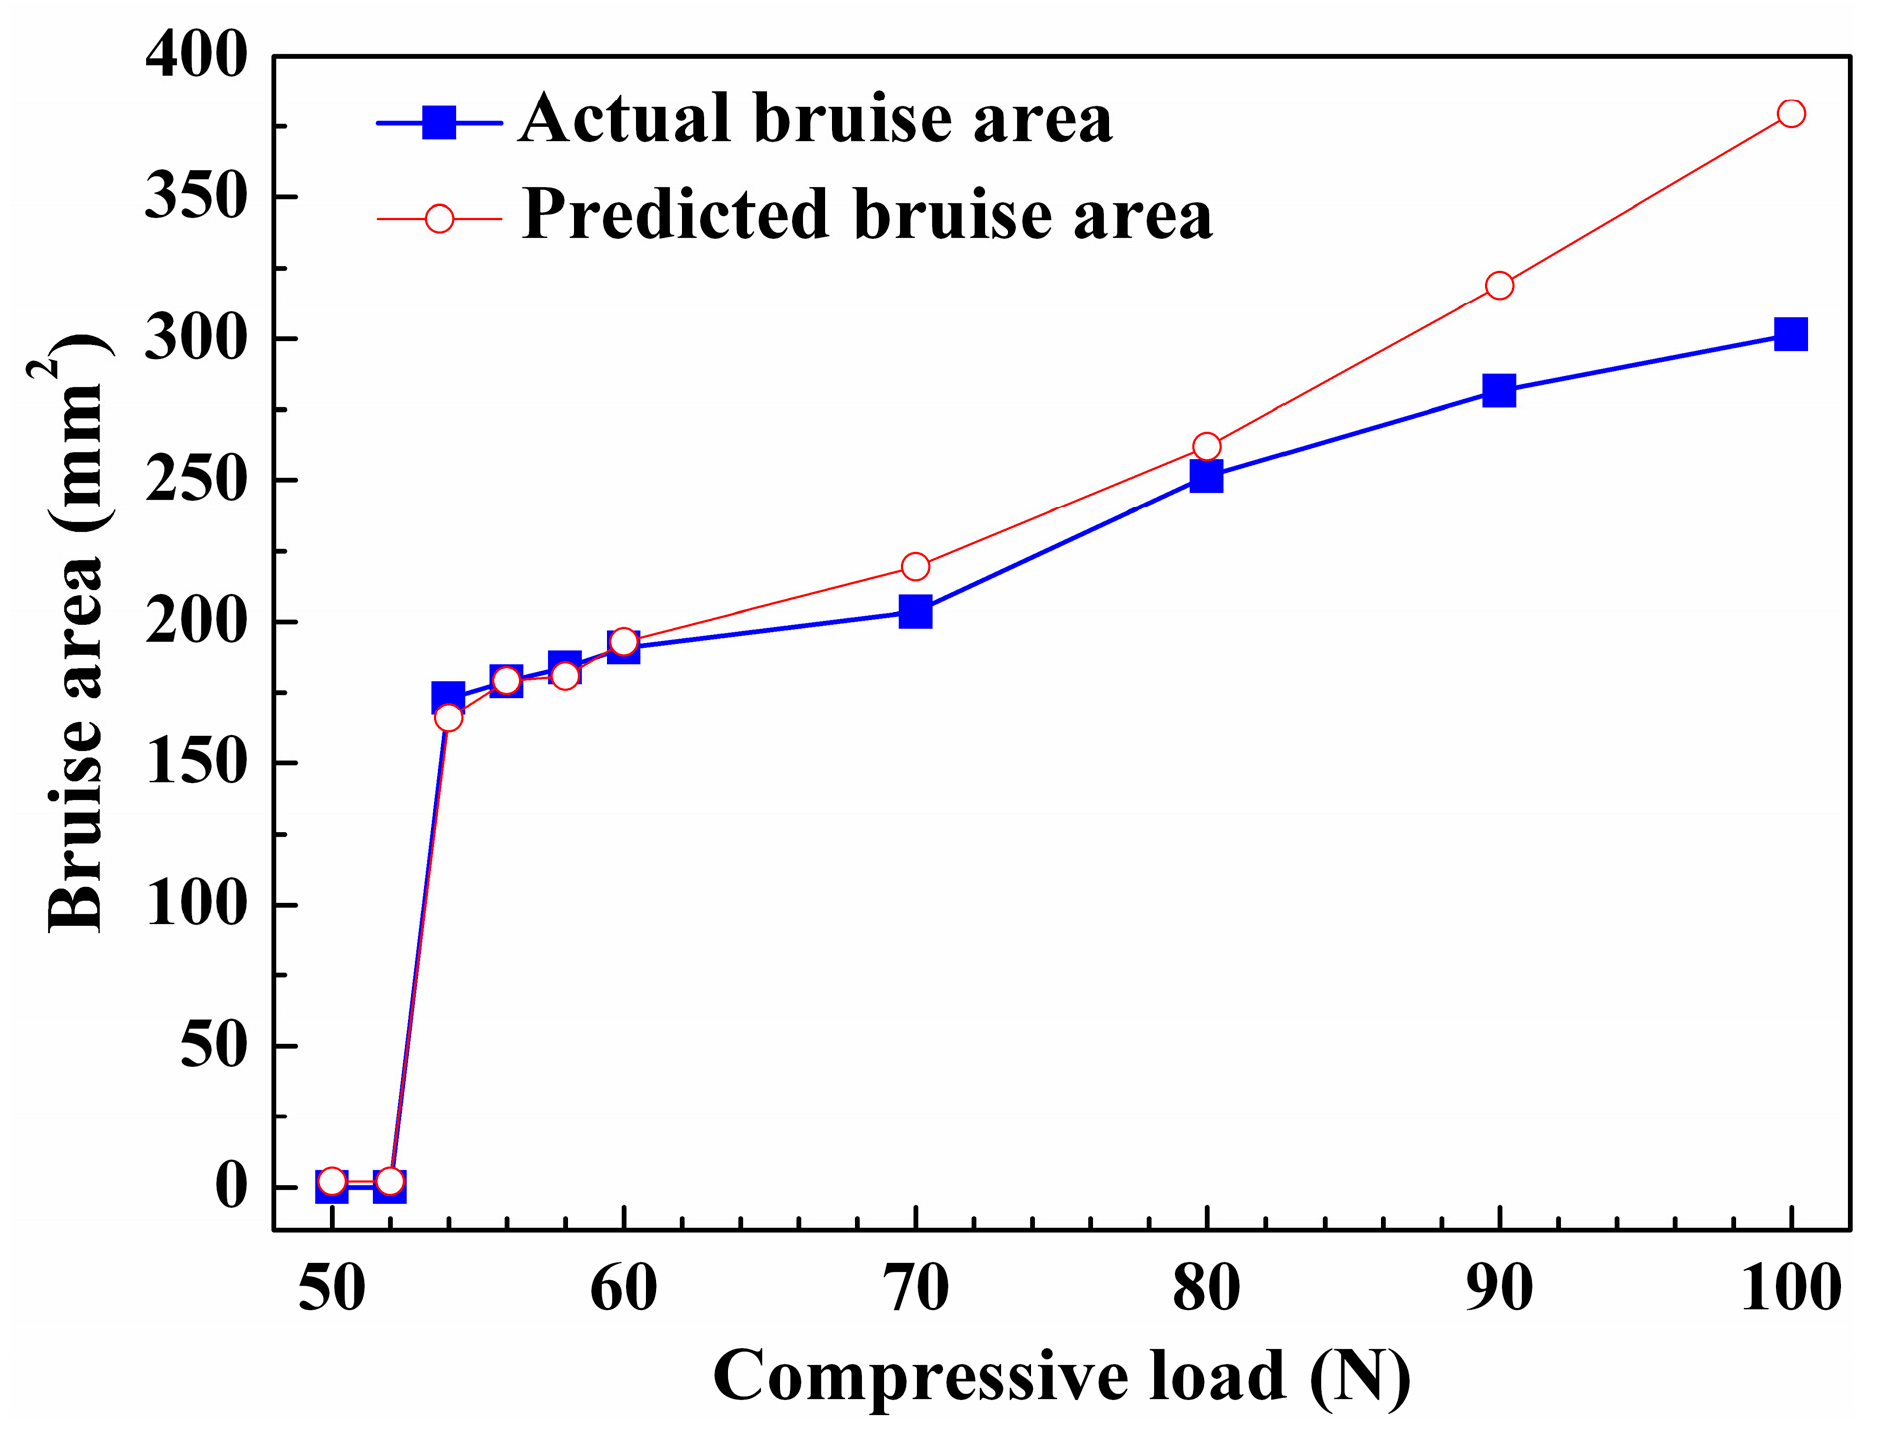
As discussed above, the area of contact over 0.10 MPa in each case can be used to accurately assess apple bruises; therefore, it was used to define the predicted bruise region in the equivalent stress distribution, as illustrated in Figure 11. This figure depicts the results of the evaluation of the predicted bruising of apples with increasing compressive loads. The predicted bruise size was slightly larger than the actual bruise on the apple, especially for loads over 80 N. The predicted bruise areas were calculated using Equation (2) and compared with the experimental results for the apple bruise. As shown in Table 4 and Figure 12, a better-predicted area was achieved with minor error rates of 0–7.89% when the load was changed from 54 to 80 N. However, a sudden rise in the predicted error for the bruise was evident when the compressive load was >80 N. For a load of 100 N, the predicted bruise areas were 25.90% larger than the actual bruise area. This unsatisfactory result suggests that the assumption of linear elastic material properties in FE analysis is not applicable for apple bruise prediction when subjected to heavy plastic deformation under larger loading conditions. This needs to be improved by introducing the elastic–plastic properties of apples in the FE analysis in future work.

4. Conclusions

The apple bruise area under compression was measured using enzymatic browning and bruise contour extraction with image processing. A novel PSF technique was used to characterize the contact pressure distribution. A threshold of compressive load of 54 N was identified, and the failure stress of the apple flesh was approximately 0.29 MPa. Above this value, enzymatic browning occurred. The contact pressure exhibited a fragmented distribution and formed an elliptical region. The average pressure fluctuated slightly in the range of 0.26–0.31 MPa as the applied load changed, showing no effect on the bruised area. The pressure over 0.50 MPa distributed at tiny spots contributed little to the bruised area. The contact areas of 0.20–0.40 MPa pressure accounted for 72% of the total pressure area. The pressure of <0.10 MPa mainly covered the contact edge, and its distributed region showed no bruises. Therefore, a pressure area of ≥0.10 MPa is strongly linearly correlated with the bruise area, with a correlation coefficient of ≥0.99. When this pressure range and its linear equation were used for the determination of the bruise area in the FE simulations for compressed apples, the predicted error was only 0–7.89% for loads ranging from 50 to 80 N. However, a larger predicted error occurred when the load exceeded 90 N. Thus, the linear elastic FE model would not be appropriate for the accurate prediction of apple bruises.
In addition, it is clear from these analyses that apple pulp did not suffer browning damage in the stress region <0.10 MPa at the edge of the compression. This threshold contributes to our understanding of the ability of apples to tolerate external stresses. Understanding the relationship between stress thresholds and bruise formation can help optimize apple handling and packaging methods. Avoiding or minimizing mechanical damage during the postharvest handling, storage, and transportation of fruits is essential.

Author Contributions

Conceptualization, J.W. (Jiaping Wang), C.W. and J.W. (Jie Wu); experiments, J.W. (Jiaping Wang); data analysis, C.W. and J.W. (Jiaping Wang); writing—original draft preparation, J.W. (Jiaping Wang) and C.W.; writing—review and editing, J.W. (Jie Wu); chart, J.W. (Jie Wu) and J.W. (Jiaping Wang). All authors have read and agreed to the published version of the manuscript.

Funding

This work was supported by the National Natural Science Foundation of China under grant 31560476.

Data Availability Statement

Data are contained within the article.

Conflicts of Interest

The authors declare no conflicts of interest.

References

  1. Herold, B.; Geyer, M.; Studman, C. Fruit contact pressure distributions—Equipment. Comput. Electron. Agric. 2001, 32, 167–179. [Google Scholar] [CrossRef]
  2. Amiri, A.; Bompeix, G. Micro-wound detection on apple and pear fruit surfaces using sulfur dioxide. Postharvest Biol. Technol. 2005, 36, 51–59. [Google Scholar] [CrossRef]
  3. Acican, T.; Alibis, K.; Ozelkok, I.S. Mechanical damage to apple during transport in wooden grates. Biosyst. Eng. 2007, 96, 239–248. [Google Scholar] [CrossRef]
  4. Lewis, R.; Yoxall, A.; Canty, L.A.; Reina Romo, E. Development of engineering design tools to help reduce apple bruising. J. Food Eng. 2007, 83, 356–365. [Google Scholar] [CrossRef]
  5. Ahmadi, E.; Ghassemzadeh, H.R.; Sadeghi, M.; Moghaddam, M. The effect of impact and fruit properties on the bruising of peach. J. Food Eng. 2010, 97, 110–117. [Google Scholar] [CrossRef]
  6. Chakespari, A.G.; Rajabipour, A.; Mobli, H. Strength behavior study of apples (cv. Shafi Abadi & Golab Kohanz) under compression loading. Mod. Appl. Sci. 2010, 4, 173–182. [Google Scholar] [CrossRef]
  7. Van Zeebroeck, M.; Van Linden, V.; Darius, P.; De Ketelaere, B.; Ramon, H.; Tijskens, E. The effect of fruit factors on the bruise susceptibility of apples. Postharvest Biol. Technol. 2007, 46, 10–19. [Google Scholar] [CrossRef]
  8. Van Zeebroeck, M.; Van Linden, V.; Ramon, H.; De Baerdemaeker, J.; Nicolai, B.M.; Tijskens, E. Impact damage of apples during transport and handling (Review). Postharvest Biol. Technol. 2007, 45, 157–167. [Google Scholar] [CrossRef]
  9. Pang, W.L.; Studman, C.J.; Ward, G.T. Bruising damage in apple-to-apple impact. J. Agric. Eng. Res. 1992, 52, 229–240. [Google Scholar] [CrossRef]
  10. Pang, W.L.; Studman, C.J.; Banks, N.H. Analysis of damage thresholds in apple-to-apple impacts using an instrumented sphere. N. Z. J. Crop Hortic. Sci. 1992, 20, 159–166. [Google Scholar] [CrossRef]
  11. Studman, C.J. Model of fruit bruising. In Proceedings of the 2nd Australasian Postharvest Conference, Science and Technology for the Fresh Food Revolution; Institute for Horticultural Development, Department of Natural Resources and the Environment: Canberra, Australia, 1996; pp. 241–246. [Google Scholar]
  12. Studman, C.J. Handling Systems and Packaging. In CIGR Agricultural Engineering Handbook; Bakker-Arkema, F.W., Ed.; American Society of Agricultural Engineers: St. Joseph, MI, USA, 1999; Chapter 3; Volume IV.3, pp. 291–340. [Google Scholar]
  13. Schoorl, D.; Holt, J.E. Bruise resistance measurements in apples. J. Texture Stud. 1980, 11, 389–394. [Google Scholar] [CrossRef]
  14. Johnson, K.L. Contact Mechanics; Cambridge University Press: New York, NY, USA, 1985. [Google Scholar]
  15. Geyer, M.; Herold, B.; Studman, C.J. Fruit contact pressure distributions. In Proceedings of the Conference Proceedings, Ag Eng 98, Oslo, Norway, 24–27 August 1998. 98-F-001. [Google Scholar]
  16. Herold, B.; Truppel, I.; Siering, G.; Geyer, M. A pressure measuring sphere for monitoring handling of fruit and vegetables. Comput. Electron. Agric. 1996, 15, 73–88. [Google Scholar] [CrossRef]
  17. Kohyama, K.; Sasaki, T.; Dan, H. Active stress during compression testing of various foods measured using a multiple-point sheet sensor. Biosci Biotechnol Biochem. 2003, 67, 1492–1498. [Google Scholar] [CrossRef] [PubMed]
  18. Van Zeebroeck, M.; Dintwa, E.; Tijskens, E.; Deli, V.; Loodts, J.; De Baerdemaeker, J.; Ramon, H. Determining tangential contact force model parameters for viscoelastic materials (apples) using a rheometer. Postharvest Biol. Technol. 2004, 33, 111–125. [Google Scholar] [CrossRef]
  19. Li, Y.C.; Song, S.J.; Zhao, C.X. Dropping impact experiment of crisp pears and contact pressure analysis. Int. J. Food Prop. 2023, 26, 2826–2837. [Google Scholar] [CrossRef]
  20. Timoshenko, S.P.; Goodier, J.N. Theory of Elasticity, 3rd ed.; McGraw-Hill: New York, NY, USA, 1970. [Google Scholar]
  21. Siyami, S.; Brown, G.K.; Burgess, G.J.; Gerrish, J.B.; Tennes, B.R.; Burton, C.L.; Zapp, R.H. Apple impact bruise prediction models. Trans. Am. Soc. Agric. Eng. 1988, 31, 1038–1046. [Google Scholar] [CrossRef]
  22. Khan, A.A.; Vincent, J.F. Anisotrophy of apple parenchyma. J. Sci. Agric. 1990, 52, 455–466. [Google Scholar] [CrossRef]
  23. Khan, A.A.; Vincent, J.F. Anisotrophy in the fracture properties of apple flesh as investigated by crack opening tests. J. Mater. Sci. 1993, 28, 45–51. [Google Scholar] [CrossRef]
  24. Studman, C. Factors affecting the bruise susceptibility of fruit. In Proceedings of the Conference on Plant Biomechanics, Reading, UK, 7–12 September 1997; Jeronimidis, G., Vincent, J.F.V., Eds.; University of Reading: Reading, UK, 1997; pp. 273–281. [Google Scholar]
  25. Mohsenin, N.N. Physical Properties of Plant and Animal Materials; Gordon and Breach: New York, NY, USA, 1970; Volume 1, pp. 88–100, 341–365, 401–430. [Google Scholar]
  26. Rabelo, G.F.; Fabbro, I.M.; Linares, A.W. Contact stress area measurement of spherical fruit. In Proceedings of the III International Symposium on Sensors in Horticulture, Haifa, Israel, 17–21 August 1997; pp. 195–200. [Google Scholar]
  27. Dan, H.; Okuhara, K.; Kohyama, K. Visualization of planar stress distributions in cucumber cultivars using a multiple-point sheet sensor. J. Sci. Food Agric. 2004, 84, 1091–1096. [Google Scholar] [CrossRef]
  28. Dan, H.; Okuhara, K.; Kohyama, K. Mechanical stress distributions in cross-sections of cucumber cultivars during the fracture process. J. Sci. Food Agric. 2006, 86, 26–34. [Google Scholar] [CrossRef]
  29. Dan, H.; Azuma, T.; Kohyama, K. Characterization of spatiotemporal stress distribution during food fracture by image texture analysis methods. J. Food Eng. 2007, 81, 429–436. [Google Scholar] [CrossRef]
  30. Wang, A.Y.; Lu, S.B.; Ma, Z.P.; Bi, S. Development and biomechanics application of a pressure sensitive film imaging and analysis system. Beijing Biomed. Eng. 2001, 20, 282–284. [Google Scholar]
  31. Liau, J.J.; Hu, C.C.; Cheng, C.K.; Huang, C.H.; Lo, W.H. The influence of inserting a Fuji pressure sensitive film between the tibiofemoral joint of knee prosthesis on actual contact characteristics. Clin. Biomech. 2001, 16, 160–166. [Google Scholar] [CrossRef] [PubMed]
  32. Liau, J.J.; Cheng, C.K.; Huang, C.H.; Lo, W.H. Effect of Fuji pressure sensitive on actual contact characteristics of artificial tibiofemoral joint. Clin. Biomech. 2002, 17, 698–704. [Google Scholar] [CrossRef]
  33. Maklewska, E.; Krucinska, I.; Mayers, G.E. Estimating the shock-absorbing ability of protector materials by use of pressure films. Fibres Text. East. Eur. 2005, 13, 52–55. [Google Scholar]
  34. Maklewska, E.; Krucinska, I.; Mayers, G.E.; Ebner, B. Two stage test verifies shock absorption ability of materials used in protective clothing. Res. J. Text. Appar. Res. Technol. Manag. 2006, 5, 1–7. [Google Scholar]
  35. Bachus, K.N.; Demarcoa, A.L.; Judd, K.T. Measuring contact area, force, and pressure for bioengineering applications: Using Fuji film and TekScan systems. Med. Eng. Phys. 2006, 28, 483–488. [Google Scholar] [CrossRef]
  36. Zach, L.; Horak, L.; Ruzicka, P.; Konvickova, S. Knee joint edoprosthesis—Verification of contact pressures by pressure sensitive films. Proc. World Congr. Eng. 2008, 2, 2–4. [Google Scholar]
  37. Lu, F.; Ishikawa, Y.; Kitazawa, H.; Satake, T. Measurement of impact pressure and bruising of apple fruit using pressure-sensitive film technique. J. Food Eng. 2010, 96, 614–620. [Google Scholar] [CrossRef]
  38. Lu, F.; Ishikawa, Y.; Kitazawa, H.; Satake, T. Impact damage to apple fruits in commercial corrugated fiberboard box packaging evaluated by the pressure-sensitive film technique. J. Food Agric. Environ. 2010, 8, 132–136. [Google Scholar]
  39. Wu, J.; Guo, K.Q.; Ge, Y.; Wang, Y.Y. Contact pressure distribution characteristics of Korla pear fruit at moment of drop impact. Trans. CSAE 2012, 28, 250–254. [Google Scholar] [CrossRef]
  40. Wu, J.; Li, F.; Ge, Y.; Hu, R. Measurement of contact pressure of Korla pear under compression and bruising predication using finite element analysis. Trans. CSAE 2013, 29, 261–266. [Google Scholar]
  41. Sun, H.J.; Wu, J.; Feng, Z.; Wang, Z.P. Contact stress of drop impact to corrugated board and damage predication for Korla pear. Mod. Food Sci. Technol. 2014, 30, 48–52. [Google Scholar] [CrossRef]
  42. Stopa, R.; Szyjewicz, D.; Komarnicki, P.; Kuta, Ł. Determining the resistance to mechanical damage of apples under impact loads. Postharvest Biol. Technol. 2018, 146, 79–89. [Google Scholar] [CrossRef]
  43. Kim, G.W.; Kim, M.S.; Sagara, Y.; Bae, Y.H.; Lee, I.B.; Do, G.S.; Lee, S.H.; Kang, S.W. Determination of the viscoelastic properties of apple flesh under quasi-static compression based on finite element method optimization. Food Sci. Technol. Res. 2008, 14, 221–231. [Google Scholar] [CrossRef]
  44. Dintwa, E.; Van Zeebroeck, M.; Ramon, H.; Tijskens, E. Finite element analysis of the dynamic collision of apple fruit. Postharvest Biol. Technol. 2008, 49, 260–276. [Google Scholar] [CrossRef]
  45. Sadrnia, H.; Rajabipour, A.; Jafari, A.; Javadi, A.; Mostofi, Y.; Kafashan, J.; Dintwa, E.; De Baerdemaeker, J. Internal bruising prediction in watermelon compression using nonlinear models. J. Food Eng. 2008, 86, 272–280. [Google Scholar] [CrossRef]
  46. Stopa, R.; Komarnicki, P.; Kuta, Ł.; Szyjewicz, D.; Słupska, M. Modeling with the finite element method the influence of shaped elements of loading components on the surface pressure distribution of carrot roots. Comput. Electron. Agric. 2019, 167, 105046. [Google Scholar] [CrossRef]
  47. Liu, X.P.; Cao, Z.T.; Yang, L.; Chen, H.; Zhang, Y.L. Research on Damage Properties of Apples Based on Static Compression Combined with the Finite Element Method. Foods 2022, 11, 1851. [Google Scholar] [CrossRef] [PubMed]
  48. Wu, M.; Chen, J.S.; Huang, W.J.; Yan, B.; Peng, Q.Y.; Liu, J.F.; Chen, L.Y.; Zeng, H.B. Injectable and self-healing nanocomposite hydrogels with ultrasensitive pH-responsiveness and tunable mechanical properties: Implications for controlled drug delivery. Biomacromolecules 2020, 21, 2409–2420. [Google Scholar] [CrossRef] [PubMed]
  49. Kim, G.W.; Do, G.S.; Bae, Y.; Sagara, Y. Analysis of mechanical properties of whole apple using finite element method based on three-dimensional real geometry. Food Sci. Technol. Res. 2008, 14, 329–336. [Google Scholar] [CrossRef]
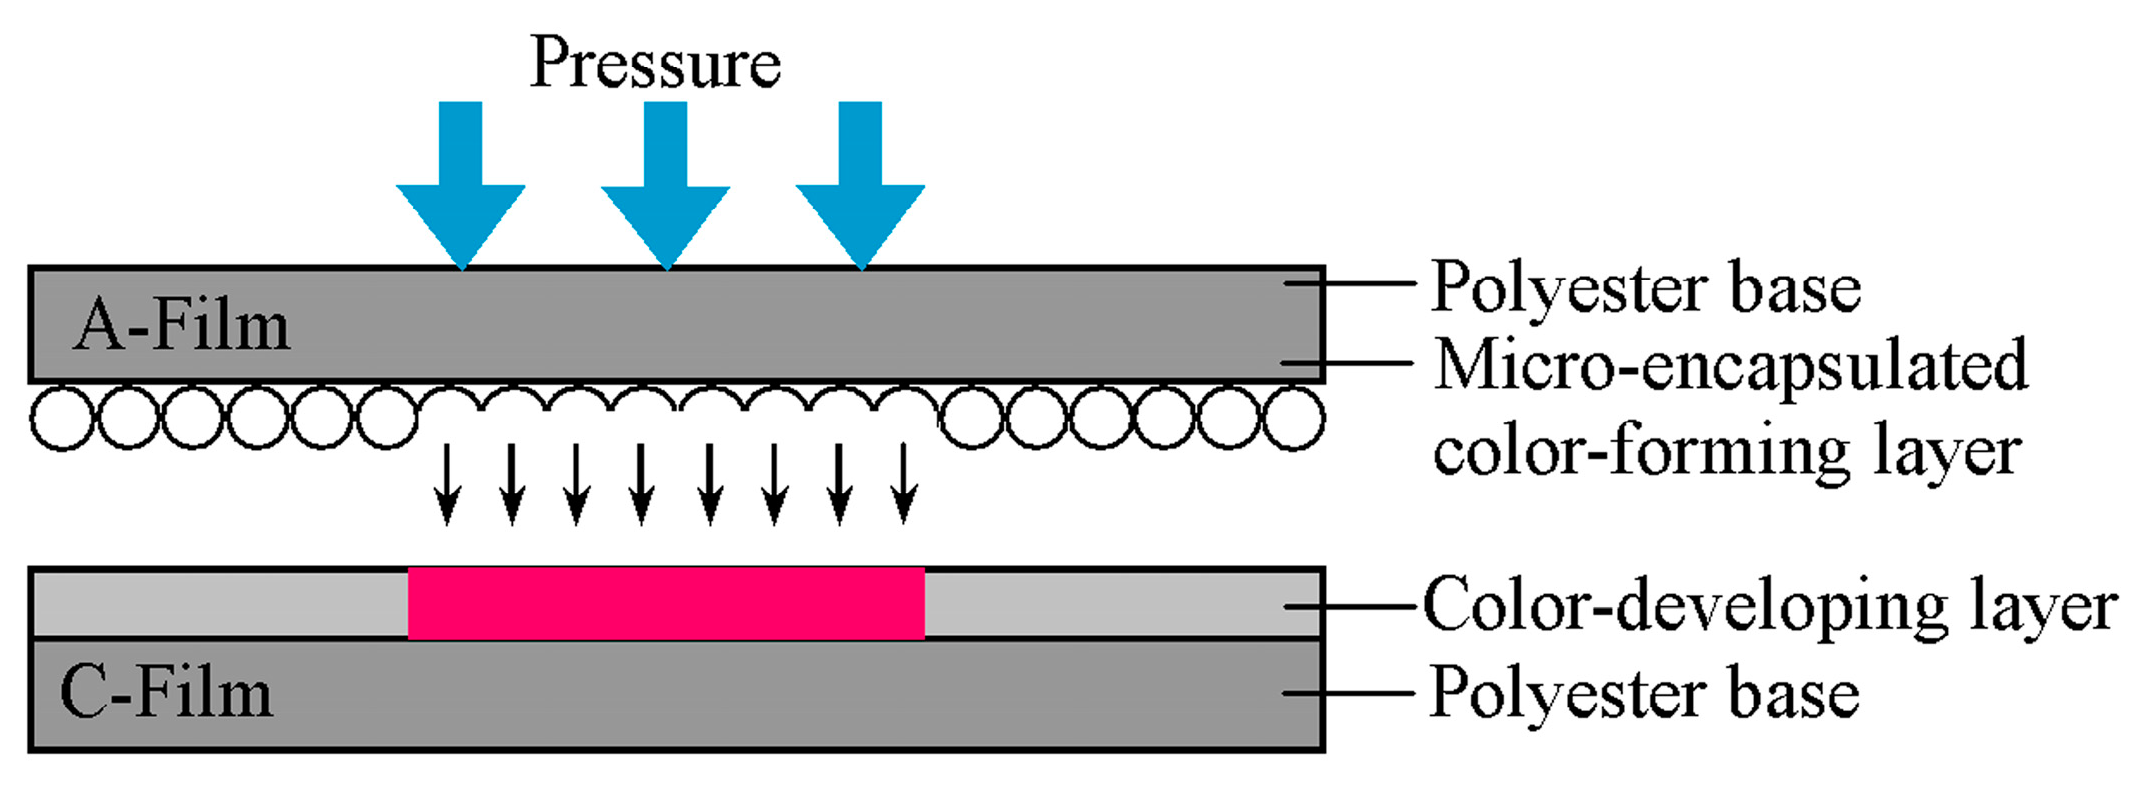
Figure 1. Coloring mechanism of the pressure-sensitive film (Fuji Film Corporation, 2009).
Processes 12 00543 g001
Figure 2. Mapping of contact pressure distribution for apple under compression: (a) PSF image; (b) scanned image; (c) stress nephogram.
Processes 12 00543 g002
Figure 3. The steps of apple bruise determination: (a) peeling of the contact region of an apple sample; (b) enzymatic browning in 10% NaHCO3 solution (pH = 7.1); (c) taking photo and transforming into a gray image; (d) bruising contour extraction.
Processes 12 00543 g003
Figure 4. FE model for an apple compression.
Processes 12 00543 g004
Figure 5. The PSF contact pressure distributions of apples under compression and their corresponding bruises.
Processes 12 00543 g005
Figure 6. Changes in bruise area and contact pressure area of apple with increasing compressive loads.
Processes 12 00543 g006
Figure 7. Changes in average pressure of apple with increasing compressive loads.
Processes 12 00543 g007
Figure 8. Pressure area distribution histogram of apple at different compressive loads.
Processes 12 00543 g008
Figure 9. Relationship between contact area of ≥0.1 MPa pressure and bruise area.
Processes 12 00543 g009
Figure 10. Determination of predicted bruise area in FE model of an apple compressed at 100 N.
Processes 12 00543 g010
Figure 11. Evaluation of actual and predicted bruises of apple with increasing compressive loads.
Processes 12 00543 g011
Figure 12. Examples of the different methods used for apple bruise under compressive loads.
Processes 12 00543 g012
Table 1. Material properties of apple sample.
Value
Mass (g)200.0 ± 6.7
Firmness (N)79.9 ± 2.6
Soluble solid content (°Brix)13.7 ± 0.4
Water content (%)86.8 ± 1.2
Table 2. Young’s modulus, Poisson’s ratio, and density for the FE models.
Material PropertiesValues
ApplePlate
Elastic modulus (MPa)2.362 × 10⁵
Poisson’s ratio0.340.30
Density (Kg/m3)10007800
Table 3. Comparisons of contact area of different pressure ranges with bruise area.
Compressive
Load (N)
Average Difference by the PSF (%)
≥0 MPa≥0.05 MPa≥0.10 MPa≥0.15 MPa≥0.20 MPa
50
52
549.726.961.222.046.42
5610.729.742.099.5011.20
5813.169.732.0510.3411.32
606.075.181.1112.2311.74
708.535.501.2317.9015.92
808.265.992.127.604.07
907.454.801.748.495.12
1009.496.121.747.895.84
Table 4. The relative error rates of bruise area predicted by the FE analysis.
F (N)
505254565860708090100
Average actual
bruise area (mm2)
00172.99179.04183.82190.95203.35251.51281.46301.40
Average predicted
bruise area (mm2)
1.951.95165.98179.21180.82192.99219.39261.97318.92379.46
Average relative
error rate (%)
4.050.091.631.077.894.1613.3125.90
Disclaimer/Publisher’s Note: The statements, opinions and data contained in all publications are solely those of the individual author(s) and contributor(s) and not of MDPI and/or the editor(s). MDPI and/or the editor(s) disclaim responsibility for any injury to people or property resulting from any ideas, methods, instructions or products referred to in the content.