Article

A Study of the Top-Coal-Drawing Law of Steeply Inclined and Extremely Thick Coal Seams in the Wudong Coal Mine

College of Energy Science and Engineering, Xi’an University of Science and Technology, Xi’an 710054, China
*
Author to whom correspondence should be addressed.
Processes 2024, 12(3), 481; https://doi.org/10.3390/pr12030481
Submission received: 17 January 2024 / Revised: 17 February 2024 / Accepted: 20 February 2024 / Published: 27 February 2024

Abstract

:
In addressing the issue of a low drawing rate in a steeply inclined and extremely thick coal seam, this study focused on the engineering background of the +575 horizontal working faces in the Wudong Coal Mine. By utilizing physical similarity simulation experiments, research was carried out on the top-coal-drawing rate and the gangue ratio at different coal-drawing intervals in horizontal segment mining for steeply inclined and thick coal seams, in which the relationships between the top-coal-drawing law and the drawing interval and technologies were revealed. The discrete element method was used to establish a numerical simulation model for the horizontal segment mining of steeply inclined and thick coal seams, and the roof-drawing law in the cases of the three-interval-group-of-support and drawing-once-every-two-support methods were analyzed before finally obtaining the optimal drawing technology. Through field practice, the coal-drawing effect of the technology was verified. The results indicated that the logarithmic functional relationship between the top-coal-drawing rate and the gangue ratio was established, and the optimal control indicator for top coal drawing was reached when the gangue ratio reached from 13% to 18%. The top-coal-drawing rate for the three-interval-group-of-support approach was higher than that of the method for drawing once every two supports. It was determined that the optimal mining technology was using a one-web-cutting-with-one-drawing approach for a three-interval-group-of-support method at a top-coal-drawing rate of 69.14%, which was 10.86% higher than that of the original technology. The research results further enriched the theory of top coal drawing in steeply inclined and extremely thick coal seams, thereby providing a reference and guidance for such mining operations.

1. Introduction

In China’s energy system, the status of coal as the main source of energy is stable at present and will remain so for a long time to come [1,2,3,4,5]. The proposal to achieve national “carbon peaking and carbon neutrality” has further promoted the high-quality development of the coal industry [6,7,8,9,10]. Xinjiang is an important fulcrum for realizing China’s “Belt and Road” strategy, and its steeply inclined coal seams are unique. In recent years, in the practice for mining steeply inclined and thick coal seams, a series of mining technologies has gradually been formed. However, the top-coal-drawing rate of the fully mechanized drawing in a steeply inclined coal seam is generally low, which severely restricts the efficient production of coal resources [11,12,13,14,15].
In view of the top-coal-drawing technology used in steeply inclined coal seams, a great deal of research has been conducted by many scholars, and rich theoretical results have been generated. The horizontal sublevel method for drawing mining is the most important for steeply inclined coal seams. At present, research into the top-coal-drawing law is mainly based on similar simulation experiments and numerical calculations [16,17]. PFC3D numerical simulations were employed by Wang Jiachen et al. [18] to simulate different top-coal-drawing methods, and it was revealed that the drawing body was similar to an ellipsoid, the interface between the coal and gangue was a three-dimensional funnel surface, and the extraction–drawing ratio and the drawing interval had a great influence on the top coal recovery rate. The grouping method for interval drawing, the law of the top coal movement, the interface characteristics of coal and rock, and the top-coal-drawing rate under the mining conditions of the Tashan Mine were simulated and analyzed by Wang Shen et al. [19] using CDEM discrete element software. Based on this, the impact mechanism of the number of supports for the morphology of top-coal-drawing bodies was revealed. Wei W. and Yang, L. et al. [20,21] analyzed the drawing mechanisms of the top coal by considering the structure of the hydraulic support. The formation and evolution characteristics of the ellipsoid structure of the overlying strata were obtained. At the same time, owing to the existence of an arch structure, top coal drawing was hindered, thereby resulting in a low recovery rate. Huo Y. et al. [22] researched the top coal migration law via a numerical simulation. The movement law of the top coal in steeply inclined and extremely thick coal seams, based on a numerical calculation, was studied by Zhang Yong et al. [23]. They concluded that the two-wheel drawing method of “two web cuttings with one drawing” could strengthen top coal drawing, reduce the degree of mixed gangue, and improve the top coal recovery rate. The research results of many past scholars have laid a foundation for top-coal-drawing mining in inclined and extremely thick coal seams, but most of the research results have been aimed at achieving a dynamic evolution of the law of coal and gangue in top-coal-drawing mining; as such, there are relatively few studies on top-coal-drawing rates for different drawing methods.
We used +575 horizontal working faces on a 45# coal seam in the northern mining area of the Wudong Coal Mine as the research background. A physical similarity simulation model for the steeply inclined and extremely thick coal seams was established, and the top-coal-drawing laws in the initial drawing stage, periodic drawing stage, and excessive drawing stage at different drawing intervals were analyzed. At the same time, the coal-drawing rates of the three-interval-group-of-support and the drawing-once-every-two-support methods were studied using PFC2D numerical simulations. The introduced research ideas are shown in Table 1. The research results can guide the optimization of coal-drawing technology parameters on the working face, which is important for enriching the coal-drawing theory and for achieving the safe and efficient mining of steeply inclined and extremely thick coal seams.

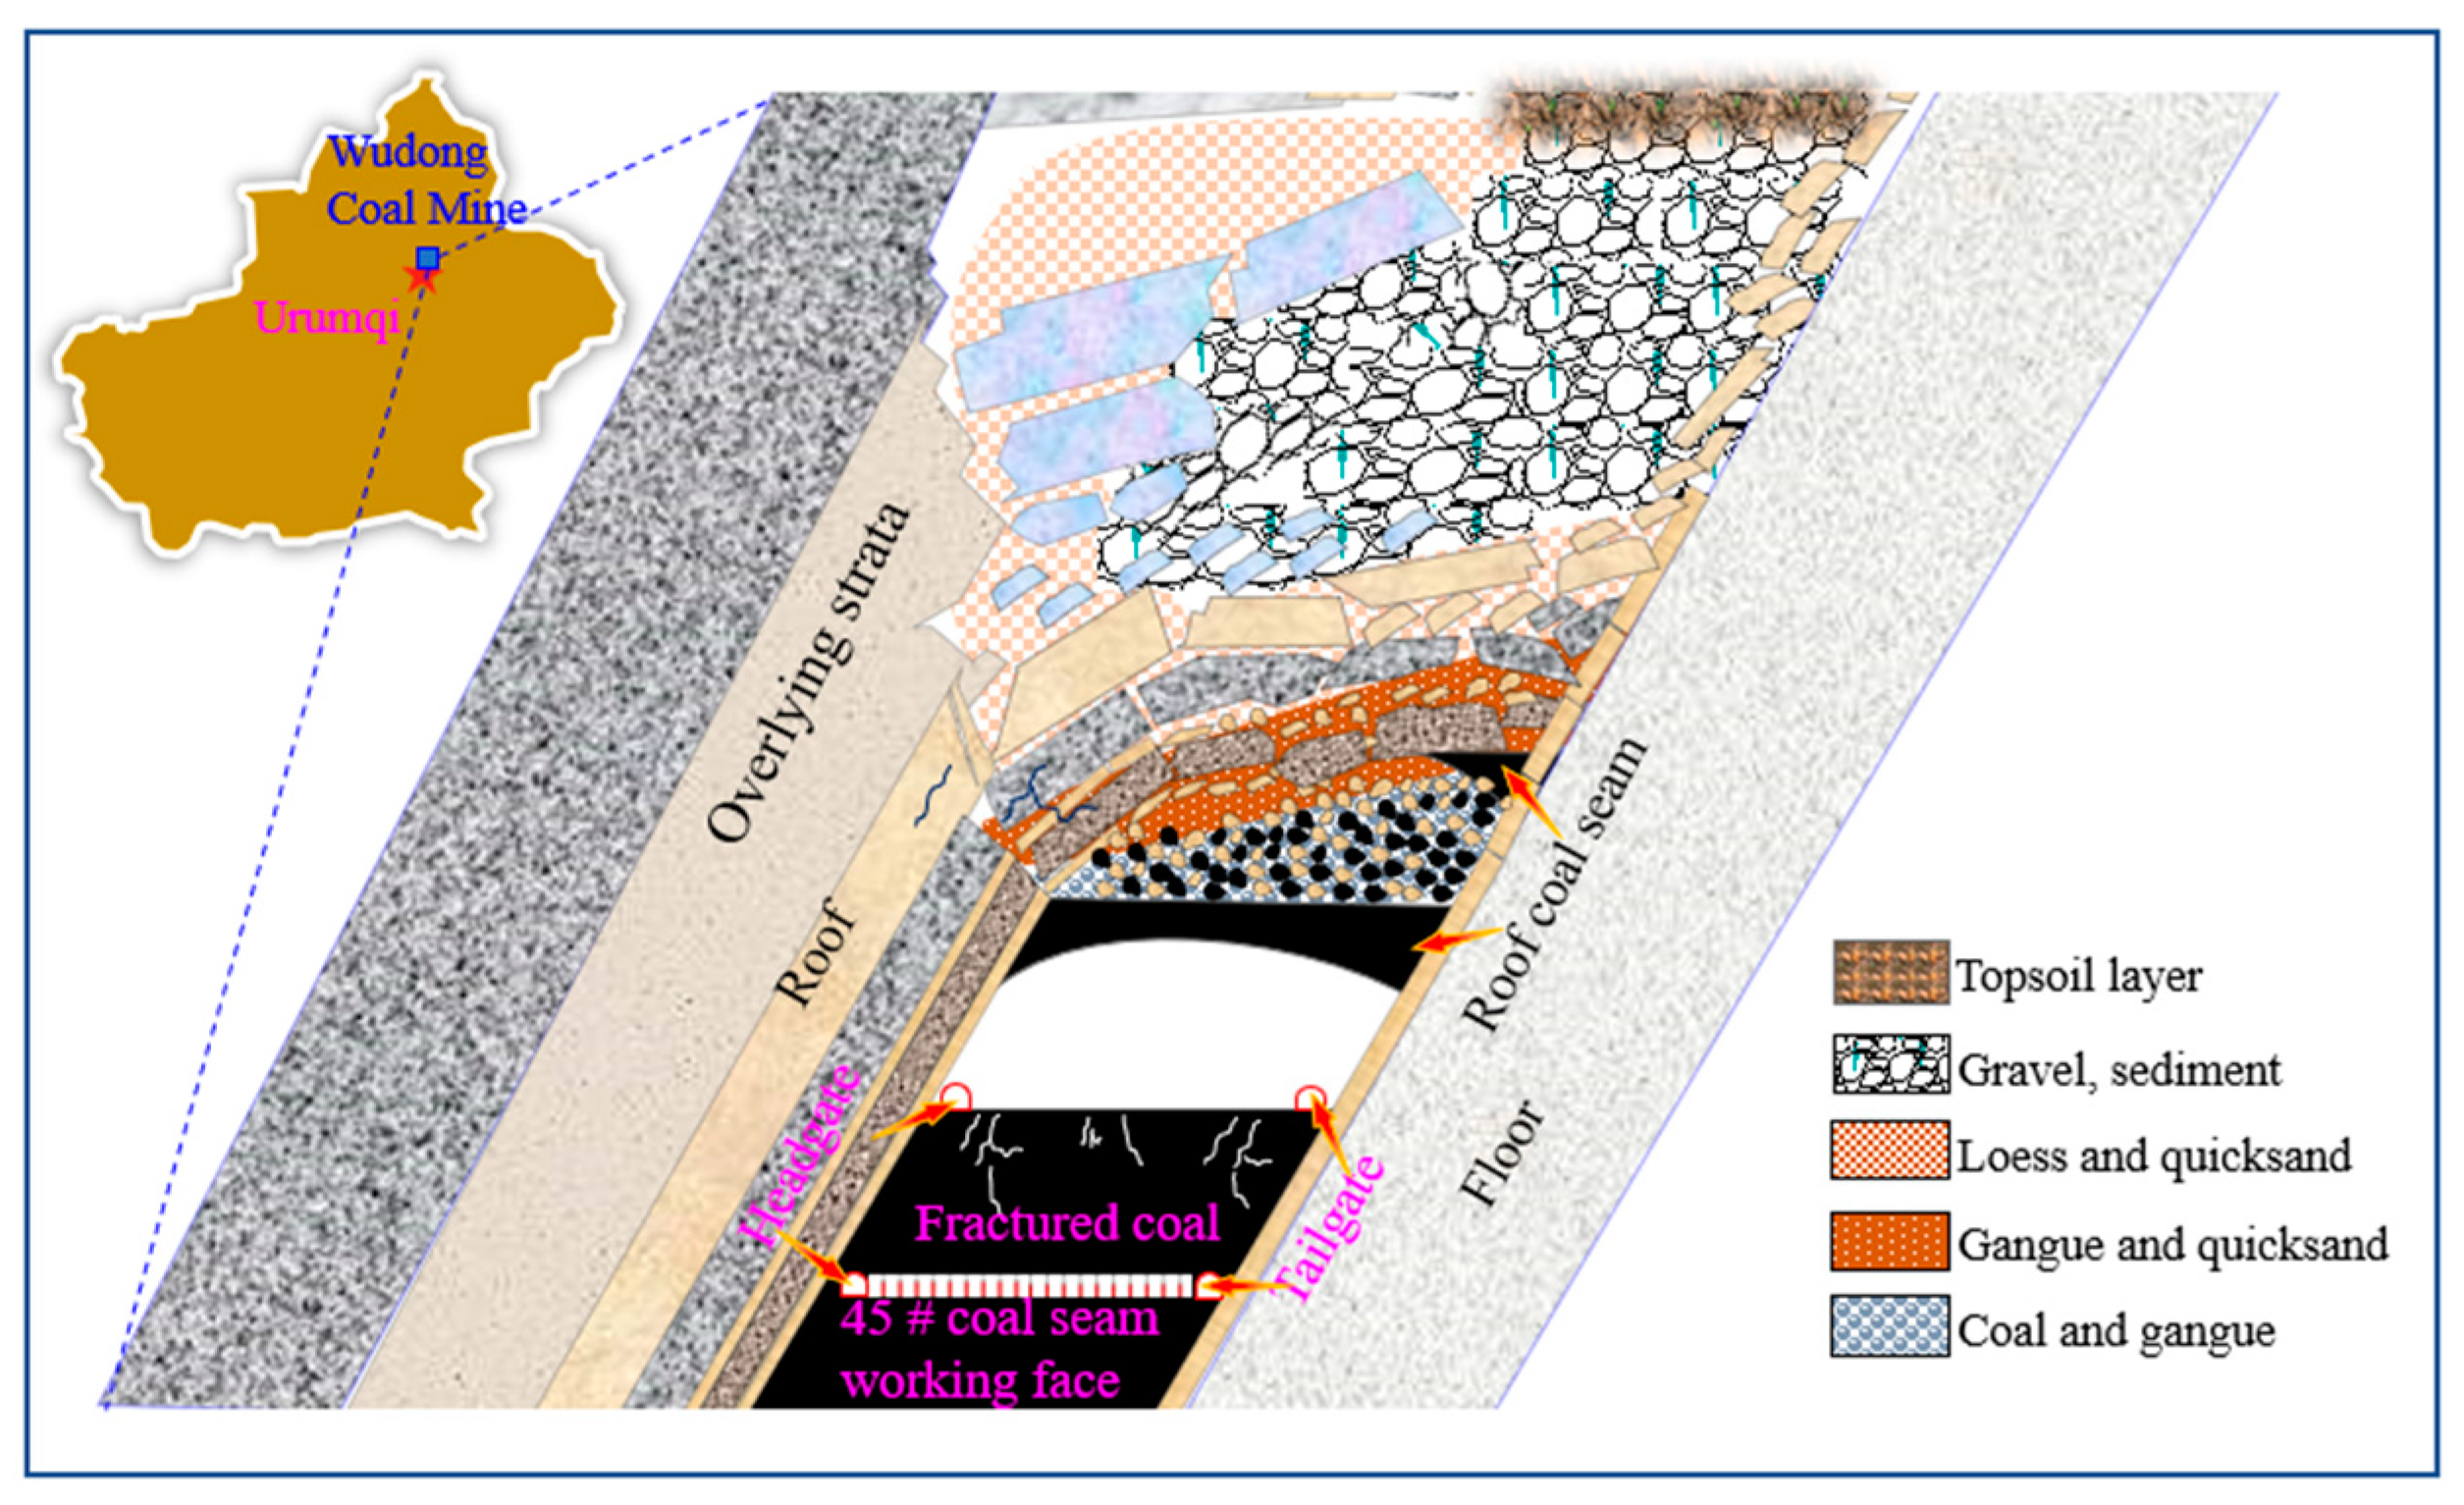
2. Engineering Background

The mining area of the Wudong Coal Mine is about 19.94 km2, the design production capacity is 6.00 Mt/a, and the design service life is 76.9 a. The northern area of the mine is divided into a 45# coal seam and a 43# coal seam (according to the geological conditions of the coal seam). The 45# coal seam was the one that was mainly studied in this paper. The dip angle of the 45# coal seam was 43–45°, and the average thickness of the coal seam was 30 m.
When the northern mining area of the Wudong Coal Mine was mined to the +575 level of the 45# coal seam, the width of the working face was 30.6 m, the mining height was 3.0 m, the height of the top coal was 22.0 m, the cutting depth was 0.8 m, the extraction–drawing ratio was 1:7.33, and the designed strike length was 1234 m. The geological structure of the working face was relatively simple, with local joints and fracture development zones, and the coal seam was broken and prone to fall. The layout of a fully mechanized drawing face in a horizontal section is shown in Figure 1. A fully mechanized drawing mining method for a horizontal section was adopted on the working face, and the roof management was carried out by all drawing. The whole process included mining and advanced pre-splitting, which were relatively independent. In the past drawing process of the Wudong Coal Mine, there were obvious cases of residual coal in the goaf and triangular coal in the roof and floor, which caused a severe loss of top coal. Table 2 shows the mining situation of the 45# coal seam in the northern mining area. It can be seen from the table that the drawing rate of the 45# coal seam was generally low. However, with a gradual increase in mining depth, the drawing rate showed a significant decreasing trend.

3. Physical Similarity Simulation of the Top-Coal-Drawing Law

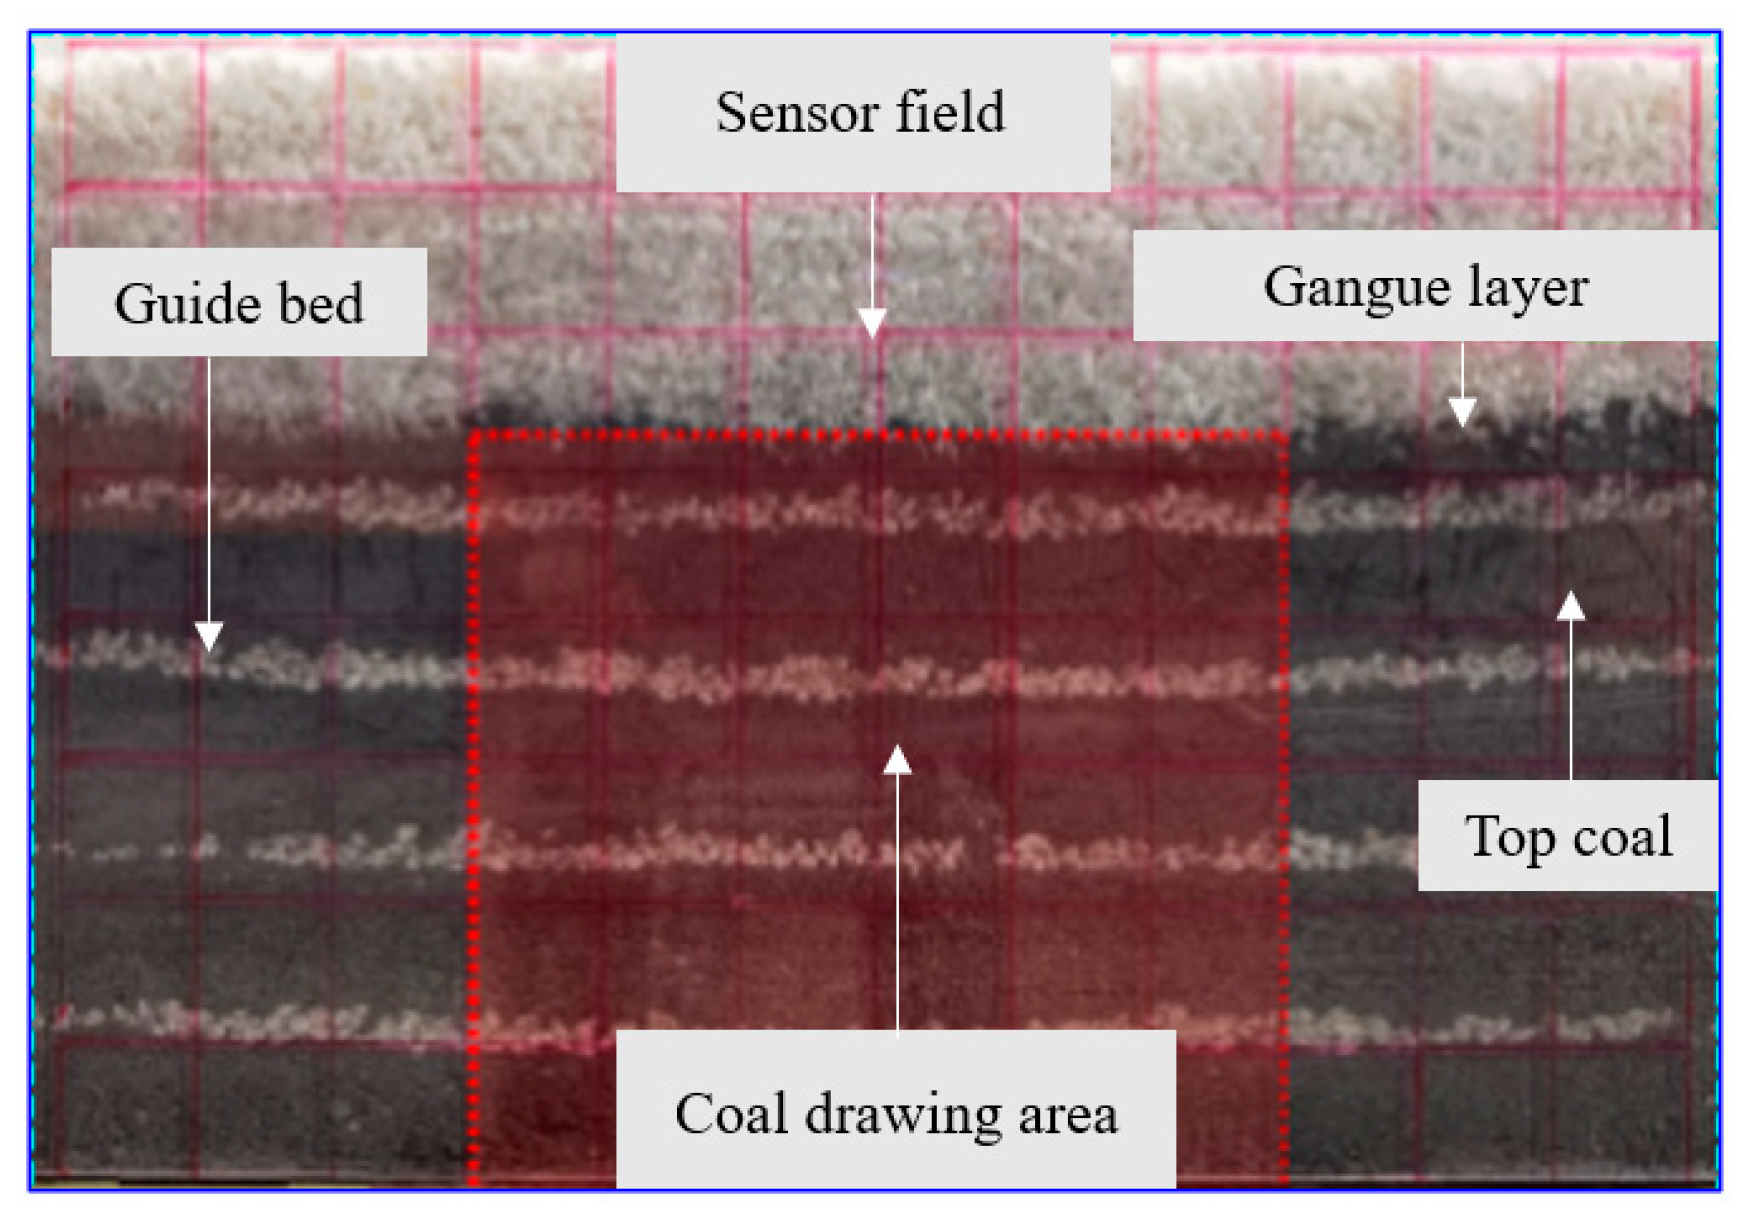
3.1. Similarity Simulation Device and Experimental Steps

The physical similarity simulation experimental model of top coal drawing adopted the special simulation experimental frame of top coal drawing in a steeply inclined coal seam. The length × width × height of the experimental frame was 1710 mm × 500 mm × 1050 mm. The two steel plates of the simulated roof and floor could be changed from 0° to 90° by adjusting the nut and the rod body to simulate different coal seam dip angles. The bottom of the two steel plates was equipped with pulleys fixed on the slide rail at the bottom of the support, and the simulation of different widths was realized by adjusting the pulley at the bottom of the steel plate. In the experiment, the acrylic plate was installed before and after the model frame, which made observing the top coal drawing and taking photos in real time convenient. There was a long strip at the bottom of the experimental frame, and different coal-drawing processes were simulated by moving the steel pipe. The whole experimental process mainly included the steps of instrument installation, coal drawing, coal and gangue screening, weighing, photographing, and data recording and analysis. When the gangue particles appeared continuously and the proportion of gangue reached 30%, the coal-drawing process was ended, and the drawing rate and the gangue ratio were calculated. The device and steps of a similar simulation experiment are shown in Figure 2.
The optimal drawing-technology parameters were determined, and the coal–gangue-drawing control technology was formulated in line with the actual production conditions of the mine to study the top-coal-drawing pattern of the steeply inclined and extremely thick coal seams for different coal-drawing technology parameters. This was performed to guide the design and optimization of the coal-drawing technology and specific parameters of the working face, as well as to achieve safe and efficient production. The specific experimental process was as follows:
(1) The experimental box was filled with bulk particles according to the requirements. The ratio of mining to drawing was 1:7.33, and all kinds of required instruments were installed;
(2) After the filling was complete, the gate for the coal drawing was opened. The coal body was cleaned in time to ensure continuous drawing;
(3) During the coal-drawing process, the state of the coal-drawing gate was observed. If the marker layer was observed as reaching the coal-drawing gate, the coal-drawing gate was closed, and the coal drawing was suspended;
(4) The marker-layer particles were sorted out, the number of marker particles was recorded, and all the drawing particles were weighed;
(5) Drawing continued until the next bit of the sign layer appeared. Step (4) was repeated until the gangue layer reached the coal-drawing gate and then the gate was closed, and the particle weight was recorded;
(6) Drawing continued. Then, when gangue accounted for 40% of the material after the end of the coal drawing, the appearance and weight of the gangue particles were recorded. After this, it was then time for excess coal drawing;
(7) Throughout the coal-drawing process, each time the coal drawing was stopped, a camera was used to take pictures, and the flow state of the coal and gangue was recorded.
The geometric similarity ratio of the experiment and the field-engineering practice was determined to be 1:100. The height of the model was 400 mm, of which the height of the top coal was 220 mm, the height of the gangue was 150 mm, the height of the support was 30 mm, and the width of the support was 150 mm. The height of the simulated section was 25 m, and the height of the overlying gangue was 15 m.
The initial layout of the model is shown in Figure 3. The coal-drawing area was arranged in the middle of the coal seam to avoid the influence of the boundary conditions during coal drawing. The monitoring area was larger than the coal-drawing area to achieve a complete monitoring of the coal-drawing area. The red grid in the figure shown below is 40 mm × 40 mm, and this was used to monitor the development of the coal–gangue boundary and record the coordinates of the points on it. The whole experiment contained four different coal-drawing intervals in the coal–gangue-drawing state, and each experiment only simulated the drawing state of the top coal and gangue at one drawing interval. The coal-drawing process at the four different drawing intervals was divided into the initial drawing stage, the drawing stage, and then the excess drawing stage in turn, which was convenient for the statistical analyses of the drawing rate and the gangue ratio. The optimal drawing interval was derived under specific conditions by comparing the drawing characteristics of the top coal and gangue at the four different drawing intervals. The contents of the top coal per advancing degree were 294.90 g, 589.8 g, 884.7 g, and 1179.6 g.

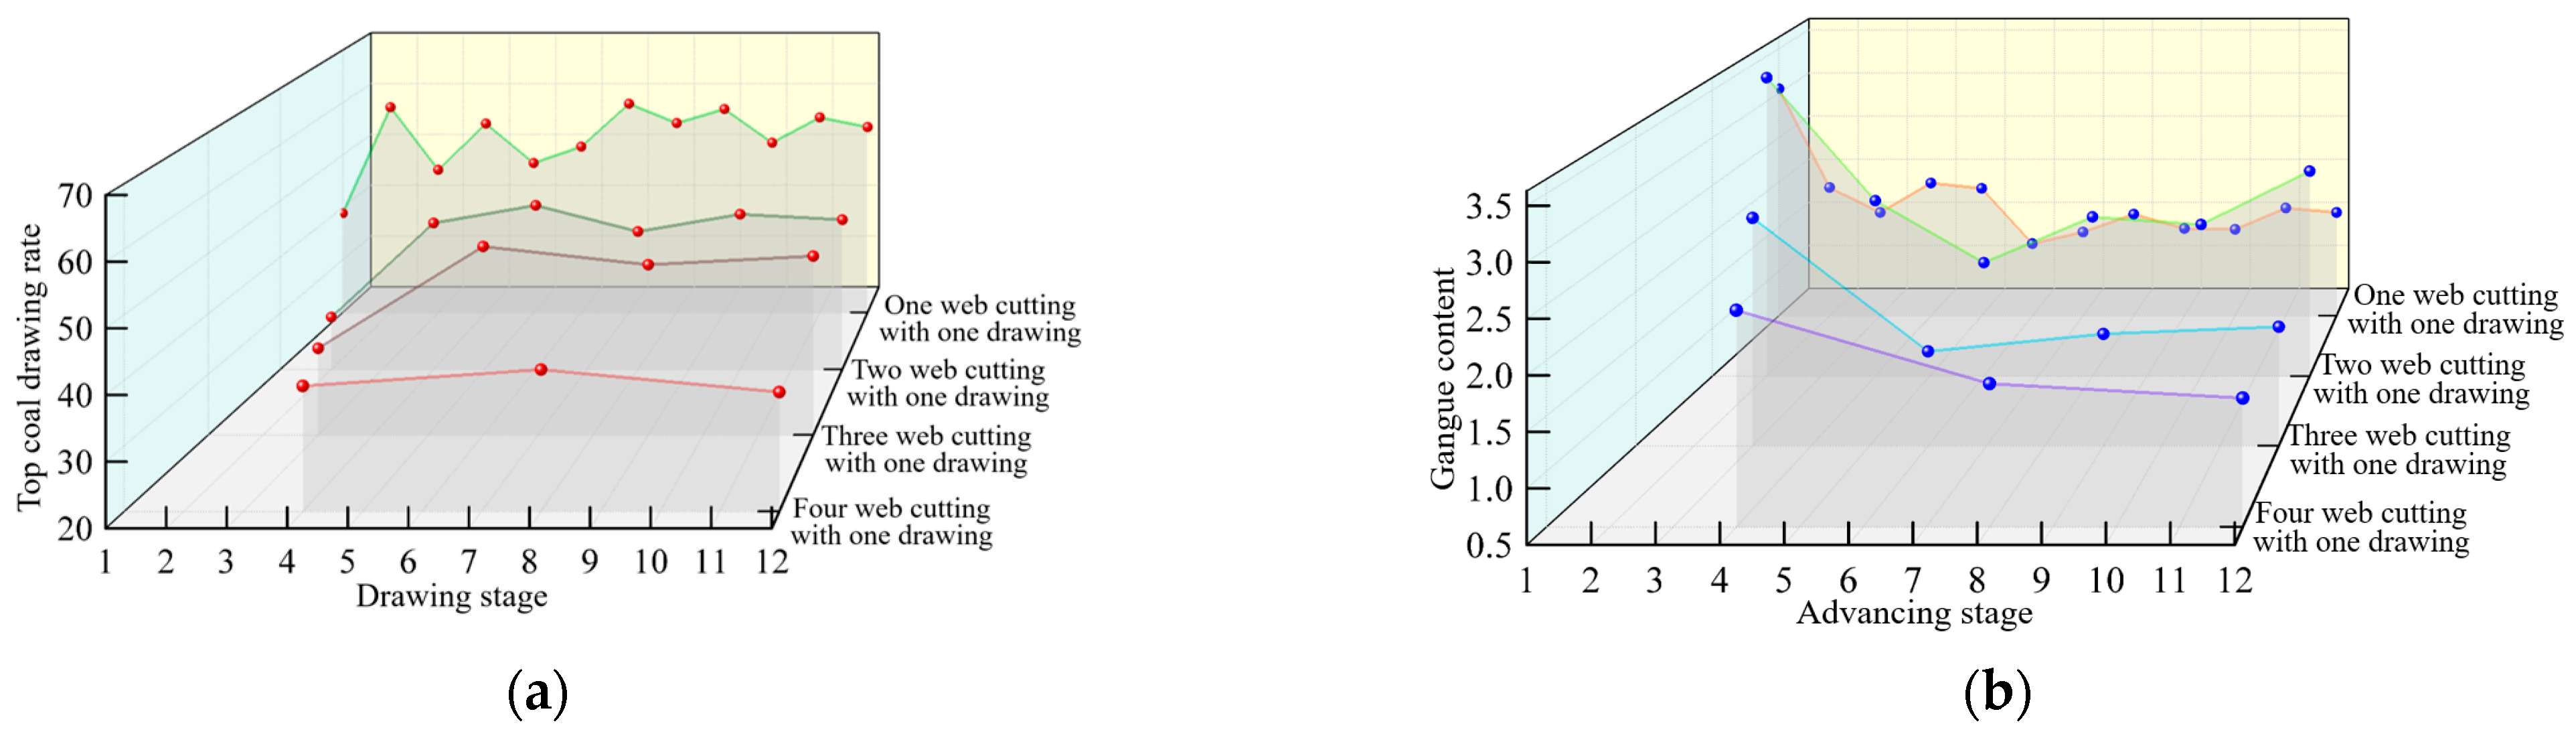
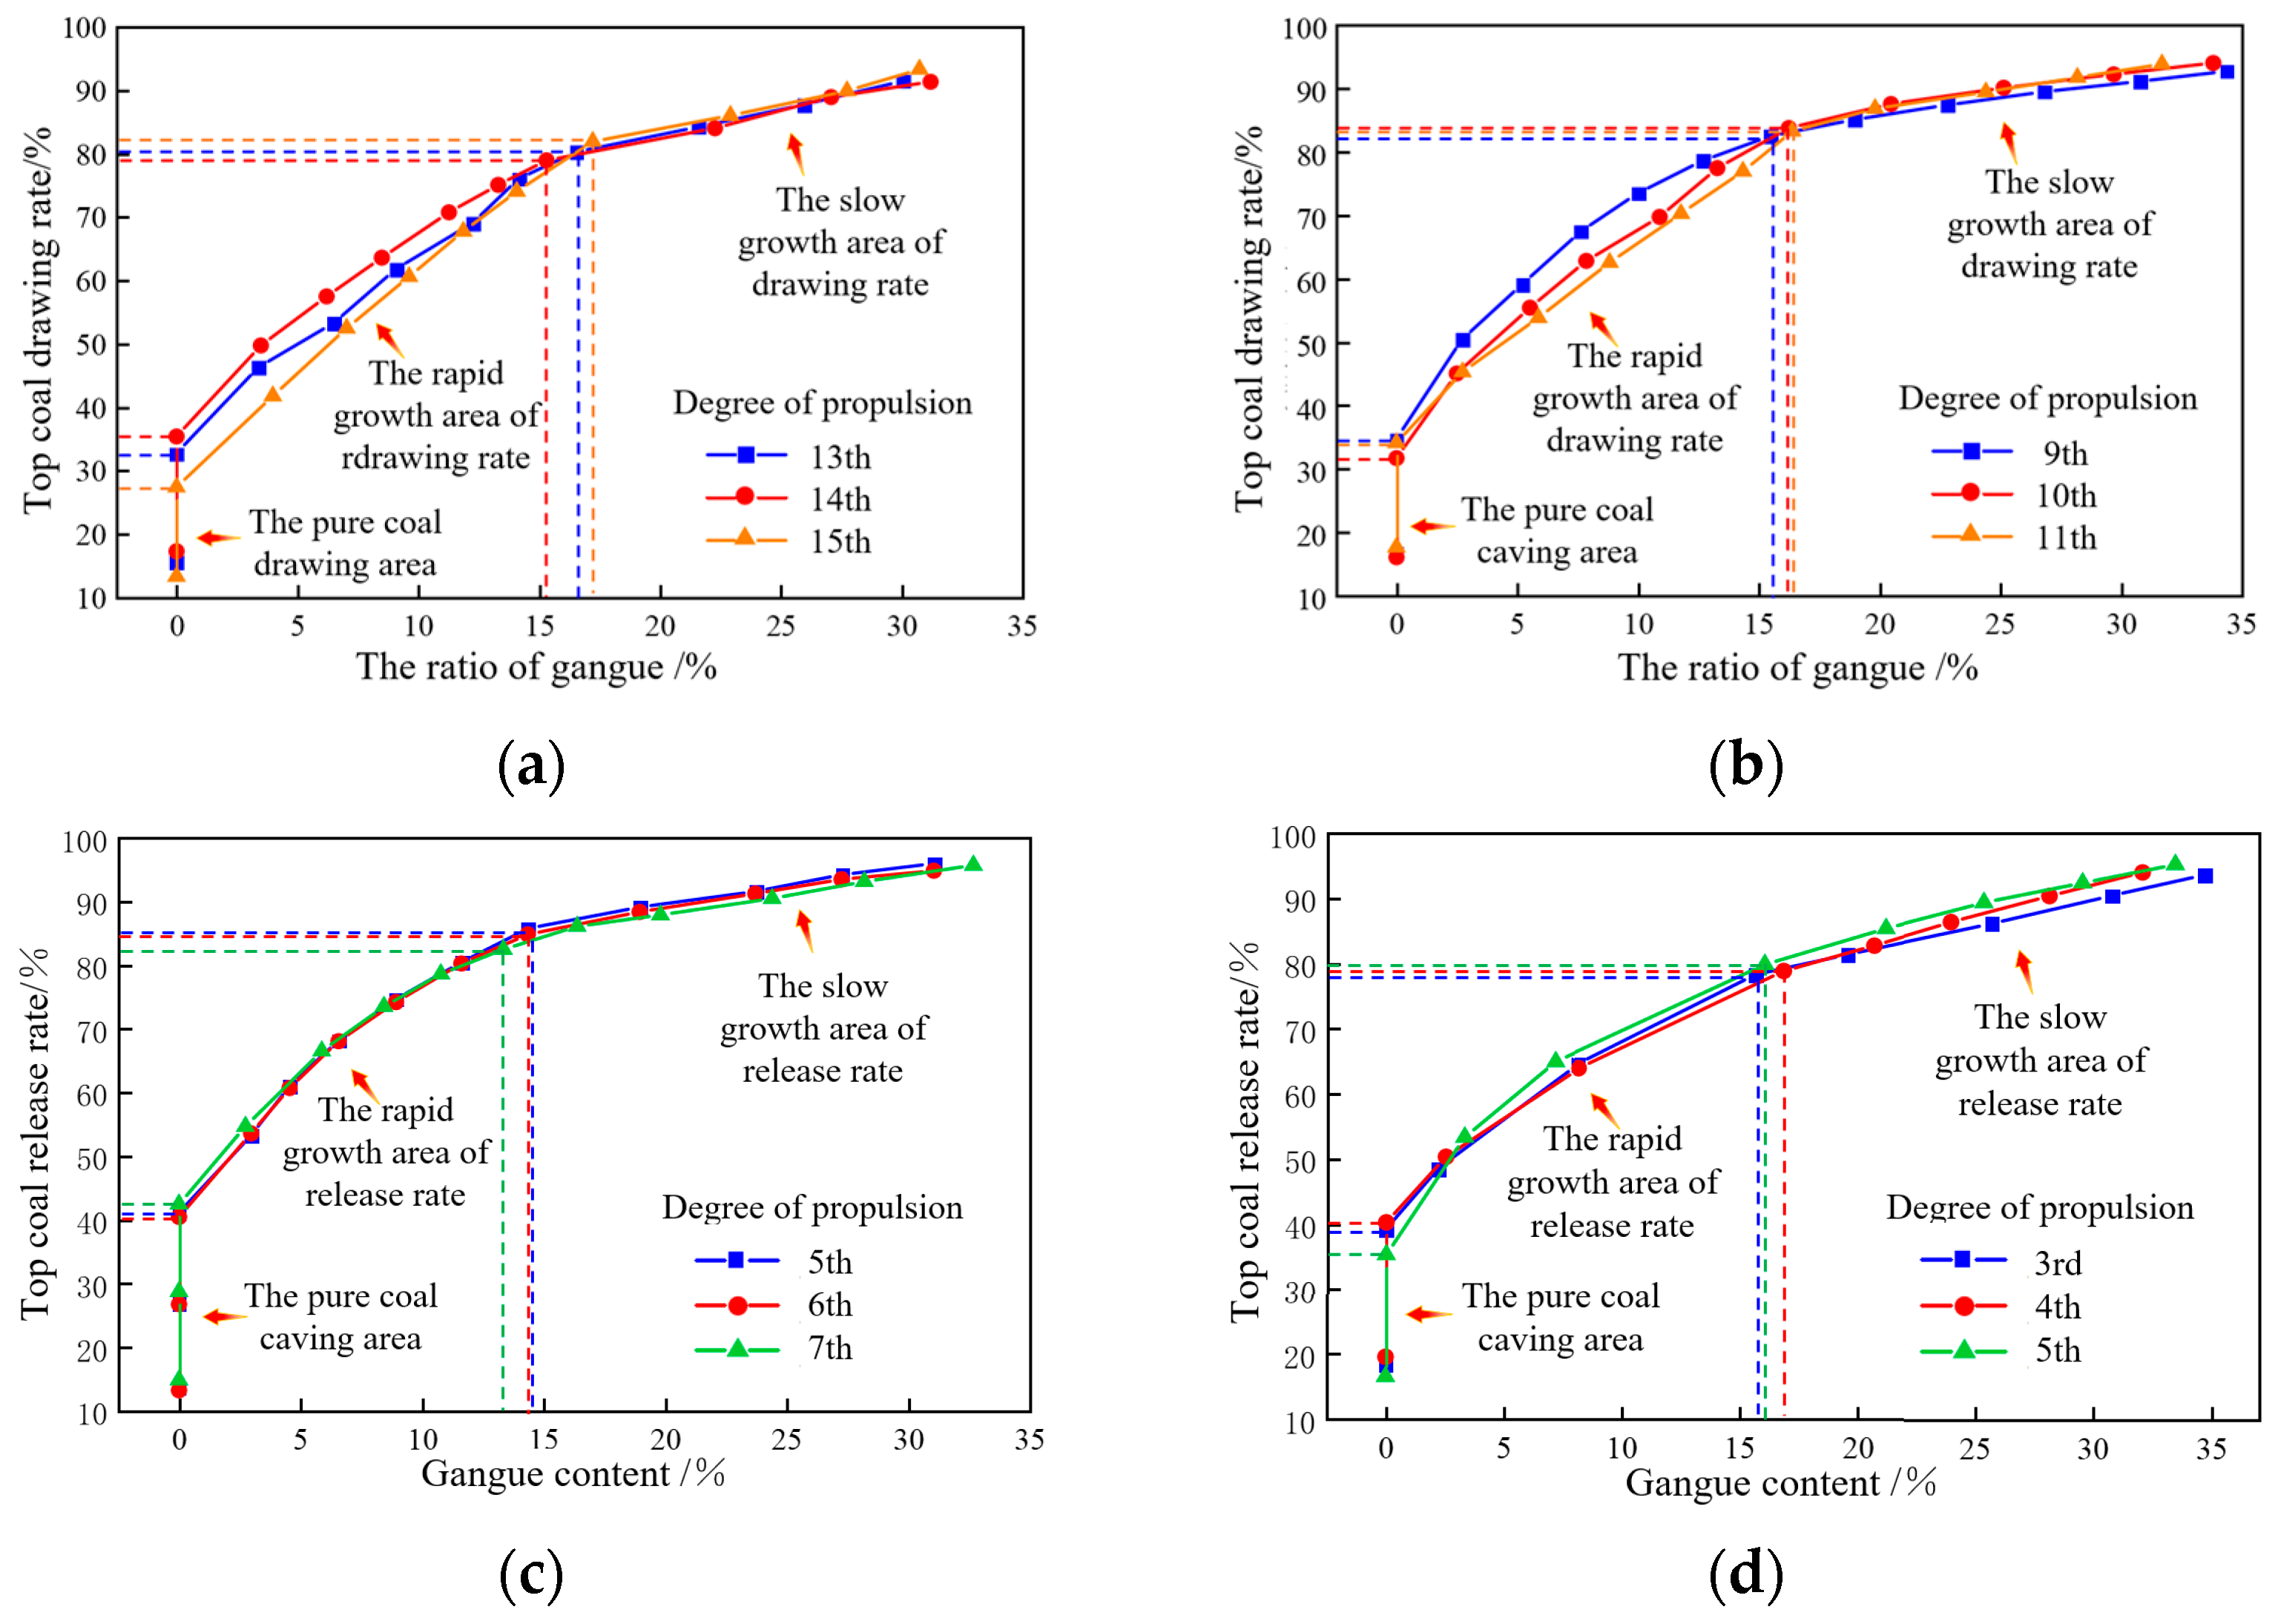
3.2. Experimental Result Analysis of the Physical Similarity Simulation

3.2.1. Results of the Initial Drawing Experiment

During the initial drawing experiment, the quality and weight of the top-coal drawn at different mining degrees were statistically analyzed and compared. The statistics of the coal and gangue drawings in the initial coal-drawing stage at different drawing intervals were then obtained, as shown in Table 3.
As the similar simulation experiment of the top coal drawing could not be accurately controlled for the operation of “stopping when gangue appears”, a small amount of gangue would be released at the end of each advance of the coal drawing. To ensure the rigor of the experiment, the quality of the pure coal and the gangue was counted together in the experiment. In the initial coal-drawing stage, the top coal was not disturbed, and the arrangement was complete. During the coal drawing, a large area of top coal was fully released. The gangue in the goaf was placed above the top coal, which gradually sunk with the drawing of the top coal. We immediately sealed the opening when it was observed that gangues were being discharged, thus resulting in the maximum drawing of pure coal and a minimal admixture of gangue during the initial process. This stage had the best coal-drawing effect. At this stage, the coal-drawing efficiency was at its highest. The distributions of the coal and gangue at different coal-drawing intervals in the initial drawing stage are illustrated in Figure 4. It could be seen from this that the distributions between the coal and gangue were similar after the initial coal-drawing stage at different drawing intervals, and they also were found to be unrelated to the drawing interval.
Based on the above, it could be concluded that during the initial coal-drawing stage, the quantity of the top coal that was released and the gangue ratio were not affected by the drawing interval. In addition, the released pure coal mass far exceeded the top coal content per advance. Owing to different drawing intervals, the top coal content varied significantly with each advance, thereby resulting in a significant negative correlation between the top-coal-drawing rate and the drawing interval during the initial stage.

3.2.2. Results of the Periodic-Coal-Drawing Experiment

The periodic-coal-drawing phase occupied a long period and was a relatively important phase in the entire coal-drawing stage. To analyze the drawing pattern of the top coal at different advances during the periodic coal drawing, the top-coal-drawing rate of each advancing stage was compared with the gangue ratio, and a comparison curve was plotted, as shown in Figure 5.
The top-coal-drawing rate and the gangue ratio were important indicators for evaluating the mining effectiveness of the top coal drawing. By comparative analysis, it could be seen that the first advance of the periodic-coal-drawing stage was influenced by the boundary between coal and gangue in the initial stage, and the amount of coal drawn decreased sharply to the minimum. Afterward, the coal–gangue boundaries remained roughly the same and tended to stabilize, thus causing the pure coal drawing to exhibit periodic fluctuations. The drawing rate of the first advance was the lowest; after this, the top-coal-drawing rate increased rapidly and fluctuated around the average value. During the coal-drawing stage, the top-coal-drawing rate using the one-web-cutting-with-one-drawing method was significantly higher than those using the other three methods. The top-coal-drawing rates for the other three methods were fairly close to each other but, overall, lower. The variation law of the gangue ratio was opposite to that of top-coal-drawing rate, i.e., it decreased initially and then stabilized. The difference in the gangue ratio at different coal-drawing intervals was not significant. Through calculations, it was determined that the amount of pure coal drawn from the top coal in the initial stage was 5.18 times the amount of the top coal drawn per advancing degree and 11.49 times the amount of coal drawn in the periodic-coal-drawing phase, and the theoretical amount of the pure coal drawn per advancing degree was found to be approximately 133.0 g.

3.2.3. Results of the Excessive-Coal-Drawing Experiment

The experiment demonstrated that a top-coal-drawing process that involves “stopping when gangue appears” produces basically pure coal. Therefore, it was necessary to explore the ways through which to increase the top-coal-drawing rate within a reasonable coal–gangue-ratio range. In the experiment, the principle for excessive drawing was adopted for the last three web cuttings of each drawing interval, and the mass of the gangue that was released each time was recorded. The drawing rate of the top coal and the gangue ratio were calculated. When the gangue ratio reached 30%, the coal drawing was stopped. The flow of the coal and gangue when conducting excessive drawing for the last three web cuttings at different coal-drawing intervals is shown in Figure 6.
From Figure 6, it can be observed that during excessive coal drawing, the boundary between the coal and gangue presented a “parabolic” shape that had an opening in the direction of the advancement. Owing to excessive coal drawing, the curvature of the boundary increased with the increase in the coal-drawing interval, which was mainly manifested in the upper part of the top coal. In addition, the movement boundary of the top coal gradually expanded, thus resulting in a more thorough drawing of the top coal.
By statistically analyzing the results of multiple coal-drawing operations for the last three web cuttings, the mass of the pure coal and gangue released each time was obtained, and the drawing rate of the top coal and gangue after each coal-drawing operation within a single advance was calculated. Based on the calculation results, the relationship curve for the top-coal-drawing rate and the gangue ratio at different drawing intervals was plotted, as shown in Figure 7.
From Figure 7, it could be observed that the top-coal-drawing rate generally increased with the increase in the gangue ratio. The relationship curve for the top-coal-drawing rate and the gangue ratio could be divided into three regions: The first region was the pure-coal-drawing area, where the gangue ratio was always 0, the slope of the curve did not exist, and the top-coal-drawing rate was generally low. The second region was the rapid growth area of the top-coal-drawing rate, where the top-coal-drawing rate rapidly increased with an increase in the gangue ratio, and the overall slope of the curve was steep. According to the results of the single coal drawing, the quality of the pure coal was higher than that of the gangue in this area. The third region was the slow growth area of the top-coal-drawing rate. In this region, the top-coal-drawing rate increased slowly with an increase in the gauge ratio until it no longer increased. The slope of the curve was gentle overall. As ascertained via the results of the single coal drawing, the quality of the pure coal that was released in this region was found to be lower than that of the gangue, and there was a clear boundary between the second and third regions.
According to the experimental results, under the condition of one web cutting with one drawing, when the gangue ratio rose to between 15% and 18%, the top-coal-drawing rate reached around 80%, and it was also found that the coal drawing could be stopped at this time. Under the condition of two web cuttings with one drawing, when the gangue ratio rose to between 15% and 17%, the top-coal-drawing rate reached approximately 83%, and it was also found that the coal drawing could be stopped at this time. Under the condition of three web cuttings with one drawing, when the gangue ratio rose to between 13% and 15%, the top-coal-drawing rate reached approximately 85.5%, and it was also found that the coal drawing could be stopped at this time. Under the condition of four web cuttings with one drawing, when the gangue ratio rose to between 15% and 17%, the top-coal-drawing rate reached approximately 79%, and it was also found that the coal drawing could be stopped at this time.
The average drawing rate and gangue ratio were calculated at the end of each coal drawing to further explore the specific relationship between the top-coal-drawing rate and the gangue ratio at different coal-drawing intervals. The last three advancing steps were averaged and fitted to obtain the specific relationship between the average top-coal-drawing rate and the average gangue ratio at different coal-drawing intervals. It could be seen that the average top-coal-drawing rate, η, and the average gangue ratio, ρ, showed a relationship of the natural logarithmic function. According to the fitting result, the specific relationships between the average top-coal-drawing rate, η, and the average gangue ratio, ρ, at different coal-drawing intervals were obtained, as shown in Equations (1) to (4).
One web cutting with one drawing:
η = 13.919 + 22.814 ln ρ .
Two web cuttings with one drawing:
η = 24.552 + 20.086 ln ρ .
Three web cuttings with one drawing:
η = 36.554 + 17.415 ln ρ .
Four web cuttings with one drawing:
η = 31.398 + 17.377 ln ρ .
The goodness-of-fit values of the above equations were R 1 2 = 0.983 , R 2 2 = 0.979 , R 3 2 = 0.992 , and R 4 2 = 0.985 , respectively. It was indicated that there was a close relationship between the dependent variable (the average top-coal-drawing rate, η) and the independent variable (the average gangue ratio, ρ), and the fitting formulas were found to be relatively accurate.
Through an analysis of the top-coal-drawing rate and the gangue ratio in the initial coal-drawing stage, the periodic-coal-drawing stage, and the excessive-coal-drawing stage at different coal-drawing intervals, the results showed that the maximum amounts of pure coal released from the top coal during the initial coal-drawing stage were 4.65, 2.43, 1.60, and 1.18 times the amount of top coal reserves per advance under the respective conditions, and they were 10.07, 5.12, 3.23, and 2.43 times the mean value of the amounts of coal released during the periodic-drawing stage, respectively. In the periodic-drawing stage, the top-coal-drawing rate when using a one-web-cutting-with-one-drawing approach was found to be the highest. At the same time, by analyzing the top-coal-drawing rate, η, and the gangue ratio, ρ, of the excessive coal drawing, the relationship of the natural logarithmic function between the top-coal-drawing rate, η, and the gangue ratio, ρ, was determined, which led to the corresponding stopping conditions.

4. Numerical Simulation of the Top-Coal-Drawing Law

4.1. Numerical Simulation Design

PFC2D numerical software was used to establish a numerical calculation model that was the same size as the actual working face (1:1 scale) with a +575 horizontal working face on a 45# coal seam in the northern mining area of the Wudong Coal Mine as the actual background. The roof-drawing patterns were simulated for the three drawing-interval groups of supports and drawing-once-every-two-support group. The dimensions of the model were as follows: 77 m in length, 40 m in height, and 45° in inclination. FISH programming was used to generate the marker layers at certain distances during the modeling to facilitate the observation of the flow state of the roof, where the colors were different from those of the other parameters, and ball elements were used to simulate the coal and gangue. The simulation supports were established according to the on-site supports, which were simulated by wall elements with a central distance of 1.5 m. The opening and closing of the drawing gate and the advancing process of the supports were controlled through FISH programming. The particle parameters of the coal, gangue, and supports are shown in Table 4 and Table 5.
The initial conditions of the model were as follows: walls were used as the boundaries of the model on all four sides with fixed velocities of 0; the initial velocities and displacements of the particles were both 0, and they were only affected by gravity, i.e., g = 9.81 m/s2; the contact between the particles (ball–ball) used the linearpbond model, and the contact between the particles and the wall (ball–facet) used the linear model. The initial state of the numerical model is shown in Figure 8.

4.2. Numerical Simulation Result Analysis

4.2.1. The Three Drawing-Interval Groups of Supports

Each group of supports consisted of two adjacent supports, and the size of the drawing gate was 3 m. There was a total of 30 supports on the working face, and these were divided into 15 groups. The drawing sequence was as follows: in the first stage, the gates of the first, fifth, ninth, and thirteenth groups of supports were opened; in the second stage, the gates of the third, seventh, and eleventh groups of supports were opened; and, in the third stage, the gates of the remaining supports were opened, with the drawing gate and sequence controlled with FISH programming. The “stopping when gangue appears” indicator served as the stop signal for drawing.
The number of particles drawn by each set of supports was counted, and the variation curve with the number of support groups was then plotted, as shown in Figure 9.
It can be observed from the above figure that the particle drawing from different groups of supports exhibited periodic variation. During the initial stage of coal drawing in the three interval groups of supports, the particle drawing was found to be significantly higher than in the second and third stages. The mass of the drawing was the least during the third stage, thereby indicating a periodic variation in the top-coal-drawing rate that was above each group of supports.
The total number of roof coal particles In the numerical calculation model was 30,883, and a total of 23,091 particles were released. The distribution of the unreleased roof coal is shown in Figure 10.
It is evident from the above figure that the coal loss was mainly divided into residual coal at the goaf, top, and floor, and most of the coal loss came from the floor. According to our calculations, the total top-coal-drawing rate was 74.71% when drawing the three interval groups of supports.

4.2.2. Drawing Once Every Two Supports

When a drawing-once-every-two-support approach was used, two adjacent supports were taken as a group, and the coal-drawing gates of the two supports were opened at the same time. The stop sign was “stopping when gangue appears”. The movement laws of the top-coal-drawing rates, as well as the gangue ratio during different stages, were analyzed. When a drawing-once-every-two-support approach was used, the initial drawing state was the same as that in the drawing-three-interval-group-of-support approach.
The number of particles that were released was statistically counted, and the variation curve with the number of support groups was plotted, as shown in Figure 11.
It can be observed from the above figure that the maximum pure coal outflow occurred in the initial coal-drawing stage, and this exceeded the single outflow in the periodic-drawing stage. Owing to the influence of the boundary between the coal and gangue in the initial drawing stage, the outflow sharply decreased during the second drawing (i.e., the first periodic drawing) stage, and the subsequent outflow of the pure coal gradually increased and fluctuated. Owing to the presence of the coal seam’s inclination, the reserve of the top coal on the roof side gradually decreased. When the drawing reached the supports on the roof side, the overall outflow of the pure coal decreased gradually with the drawing sequence, and this was found to be consistent with the similar simulation results.
In the numerical calculation model, the total number of top coal particles was 30,883, and 21,985 of these were released. The distribution of the unreleased top coal is shown in Figure 12.
The above figure indicates that the top coal loss mainly included the residual coal in the goaf and the coal in the roof and floor, where most of the coal loss came from the triangular coal on the floor. According to the calculations, the overall top-coal-drawing rate for one coal drawing between two groups of supports was 71.19%, which was lower than the total top-coal-drawing rate when the coal was released in a three-interval-group-of-support approach. Therefore, a drawing-three-interval-group-of-support approach was more reasonable compared to a drawing-once-every-two-support approach.

5. On-Site Verification

By conducting similar simulation experiments and numerical calculations, as described above, the analysis results indicated that for the steeply inclined and extremely thick coal seams in the 45# coal seam of the northern mining area of the Wudong Coal Mine, the optimal coal-drawing technology was as follows: For the drawing advance along the strike direction, one web cutting with one drawing was selected as the best approach. The drawing method used along the dip direction was adopting a drawing-three-interval-group-of-support approach. Therefore, based on the original drawing technology, the optimized technology of “one web cutting with one drawing and three interval groups of supports” was adopted and applied on site. A comparative analysis of the top-coal-drawing rate before and after optimization was conducted to verify the application effects.
Figure 13 represents the technology of the top-coal-drawing rate before and after optimization. As shown in the figure, the top-coal-drawing rate of the working face at an elevation level of +721–+575 was statistically analyzed using the original drawing technology in the environment of the Wudong Coal Mine. The average top-coal-drawing rate before optimization was 58.28%, and the top-coal-drawing rate showed an evident decreasing trend with increases in the mining depth. When using the optimized technology, a top-coal-drawing rate at an elevation level of +550–+450 was statistically analyzed. The average top-coal-drawing rate before optimization was 69.14%, and the top-coal-drawing rate remained basically stable with increases in the mining depth.

6. Conclusions

(1) The functional relationship between the top-coal-drawing rate and the gangue ratio was established via the top-coal-drawing experiment. In addition, the best control index of the top coal drawing was determined, and it was also concluded that the coal-drawing effect with a one-web-cutting-with-one-drawing approach was (relatively) the best;
(2) The numerical simulation results showed that the laws of the coal-drawing-three-interval-group-of-support and drawing-once-every-two-support approaches were generally similar. The top-coal-drawing rate of the three-interval-group-of-support approach was higher than that of the drawing-once-every-two-support method;
(3) The experiments and simulations helped to comprehensively determine the optimal coal-drawing technology for the steeply inclined and extremely thick coal seams as the one-web-cutting-with-one-drawing and the three-interval-group-of-support approaches, respectively. Field application showed that the optimized top-coal-drawing rate was 10.86% higher than that of the original technology.

7. Discussion

(1) The optimal drawing technology and its drawing rate derived in this paper were validated at only one of the mining levels in the field. As for the relationship between the top-coal-drawing rate and the mining level for this technology, further field tests are needed;
(2) The drawing technology mentioned in this paper originated from special steeply inclined and extremely thick coal seams. However, whether it is also applicable to other coal seams under different mining conditions, such as near horizontal coal seams, requires further experiments and on-site verification.

Author Contributions

Formal analysis, J.C.; methodology, J.C.; software, L.W.; validation, J.C.; investigation, H.Z. and H.Q.; writing—original draft preparation, L.W.; writing—review and editing, J.C., X.L. and L.W.; supervision, J.C. and B.Y.; project administration, B.Y.; funding acquisition, X.L. All authors have read and agreed to the published version of the manuscript.

Funding

This research was funded by the Shaanxi Provincial Natural Science Basic Research Project’s Enterprise Joint Fund under grant No. 2019JLZ-04.

Data Availability Statement

The data are contained within the article.

Conflicts of Interest

The authors declare no conflicts of interest.

References

  1. Xie, H.; Ren, S.; Xie, Y.; Jiao, X. Development opportunities of the coal industry towards the goal of carbon neutrality. J. China Coal Soc. 2021, 46, 2197–2211. [Google Scholar]
  2. Liu, F.; Cuo, L.; Zhao, L. Research on coal safety range and green low-carbon technology patlunder the dual-carbon background. J. China Coal Soc. 2022, 47, 11–22. [Google Scholar]
  3. Yan, B.; Jia, H.; Yang, Z.; Yilmaz, E.; Liu, H. Goaf instability in an open pit iron mine triggered by dynamics disturbance: A large-scale similar simulation. Int. J. Min. Reclam. Environ. 2023, 37, 606–629. [Google Scholar] [CrossRef]
  4. Huo, Y.; Zhu, D.; Wang, Z.; Song, X. Numerical Investigation of Top Coal Drawing Evolution in Longwall Top Coal Drawing by the Coupled Finite Difference Method-Discrete Element Method. Energies 2021, 14, 219. [Google Scholar] [CrossRef]
  5. Fu, Q.; Yang, K.; He, X.; Liu, Q.; Wei, Z.; Wang, Y. Destabilization Mechanism and Stability Control of the Surrounding Rock in Stope Mining Roadways below Remaining Coal Pillars: A Case Study in Buertai Coal Mine. Processes 2022, 10, 2192. [Google Scholar] [CrossRef]
  6. Wang, J.C.; Zhang, J.W. Longwall top-coal drawing mining in extremely inclined thick coal seam. In Proceedings of the 24th World Mining Congress Proceedings:Underground Mining, Rio de Janeiro, Brazil, 18–21 October 2016; pp. 277–286. [Google Scholar]
  7. Song, Z.Y.; Konietzky, H.; Herbst, M. Drawing mechanism of fractured top coal in longwall top coal drawing. Int. J. Rock Mech. Min. Sci. 2020, 130, 104329. [Google Scholar] [CrossRef]
  8. Zeng, Y.; Liu, X.; Wu, Q.; Liang, J. Theory and technical conception of coal-water-thermal positive synergistic co-extraction under the dual carbon background. J. China Coal Soc. 2023, 48, 538–550. [Google Scholar]
  9. Wang, S.; Liu, L.; Zhao, Y.; Zhang, B.; Wang, J.; Zhu, M.; Wang, M.; Zhang, X. New energy exploitation in coal-endowed areas under the target of “double carbon”: A new path for transformation and upgrading of coal mines in the future. Coal Sci. Technol. 2023, 51, 59–79. [Google Scholar]
  10. Sun, X.; Liu, Y.; Wang, J.; Li, J.; Sun, S.; Cui, X. Study on three-dimensional stress field of gob-side entry retaining by roof cutting without pillar under near-group coal seam mining. Processes 2019, 7, 552. [Google Scholar] [CrossRef]
  11. Wang, J. Thick Coal Seam Mining Theory and Technology; Metallurgical Industry Press: Beijing, China, 2009; pp. 2–6. [Google Scholar]
  12. Wang, Z.; Yang, X.; Wang, G.; Gong, H. Study on Instability Characteristics of the Directional Borehole on the Coal-Seam Roof: A Case Study of the Tingnan Coal Mine. Processes 2023, 11, 1675. [Google Scholar] [CrossRef]
  13. Wang, G.; Pang, Y.; Xu, Y.; Meng, L.; Han, H. Development of intelligent green and efficient miningtechnology and equipment for thick coal seam. J. Min. Saf. Eng. 2023, 40, 882–893. [Google Scholar]
  14. Wang, J.H. Development and prospect on fully mechanized mining in Chinese coal mines. Int. J. Coal Sci. Technol. 2014, 1, 253–260. [Google Scholar] [CrossRef]
  15. Wang, J.; Zhao, B.; Zhao, P.; Yang, S.; An, J.; Jiang, Z. Research on the longwall top-coal drawing mining technique in extremely inclined and soft thick coal seam. J. China Coal Soc. 2017, 42, 286–292. [Google Scholar]
  16. Zhang, F.; Yang, W. Stress distribution law of steeply inclined horizontal sectional drawing coal mining and prevention and control of rock burst. Saf. Coal Mines 2023, 54, 101–108. [Google Scholar]
  17. Zhang, J.; Wang, J.; Wei, W. Effect of face dip angle on the drawing mechanism in longwall top-coal drawing mining. J. China Univ. Min. Technol. 2018, 47, 805–814. [Google Scholar]
  18. Wang, J.; Wei, L.; Zhang, J.; Li, Z. 3-D numerical simulation on the top-coal movement law under drawing mining technique. Coal J. 2013, 38, 1905–1911. [Google Scholar]
  19. Wang, S.; Huang, Z.; Li, D.; Zhang, W.; Wang, Z.; Li, H. Study of top—Coal flow mechanism under stage and multi—Grouping top—Coal drawing technology in extra thick coal seam. Coal Sci. Technol. 2021, 49, 17–24. [Google Scholar]
  20. Wei, W.; Wang, J.; Zhang, J.; Wu, S.; Li, Z.; Zhang, X. Drawing mechanisms of granular top coal considering the structure of hydraulic support in longwall top coal caving. Bull. Eng. Geol. Environ. 2023, 82, 138. [Google Scholar] [CrossRef]
  21. Yang, L.; Wang, J.; Yang, S.; Li, Z.; Wu, S. Improving the top coal recovery ratio in longwall top coal caving mining using drawing balance analysis. Int. J. Min. Reclam. Environ. 2023, 37, 319–337. [Google Scholar] [CrossRef]
  22. Huo, Y.; Song, X.; Zhu, D. Numerical investigation of top-coal migration in the first coal-drawing process by an FDM–DEM coupling method. Energies 2020, 13, 5493. [Google Scholar] [CrossRef]
  23. Zhang, Y.; Zhang, B.; Li, L.; Zhang, S.; Liu, J.; Zhao, J. Study on the effect of roof fracture development on gas drainage in steep full-mechanized drawing mining. J. Min. Saf. Eng. 2014, 31, 809–813. [Google Scholar]
Disclaimer/Publisher’s Note: The statements, opinions, and data contained in all publications are solely those of the individual author(s) and contributor(s) and not of MDPI and/or the editor(s). MDPI and/or the editor(s) disclaim(s) responsibility for any injury to people or property resulting from any ideas, methods, instructions, or products referred to in the content.
Figure 1. Layout of the drawing face in Wudong Coal Mine.
Processes 12 00481 g001
Figure 2. Device and steps of a similar simulation experiment.
Processes 12 00481 g002
Figure 3. Initial layout of the model.
Processes 12 00481 g003
Figure 4. Flow status of coal and gangue at different coal-drawing intervals in the initial stage.
Processes 12 00481 g004
Figure 5. Variations in the top-coal-drawing rate and the gangue ratio with the drawing stage: (a) variations in the top-coal-drawing rate with the drawing stage; (b) variations in the gangue ratio with the drawing stage.
Processes 12 00481 g005
Figure 6. Flow of the coal and gangue during excessive coal drawing at different intervals.
Processes 12 00481 g006
Figure 7. Relationship between the top-coal-drawing rate and the gangue ratio when conducting excessive drawing: (a) one web cutting with one drawing; (b) two web cuttings with one drawing; (c) three web cuttings with one drawing; (d) four web cuttings with one drawing.
Processes 12 00481 g007
Figure 8. Initial state of numerical model.
Processes 12 00481 g008
Figure 9. Relationship between the number of drawn particles and the number of support groups under the three interval groups of supports.
Processes 12 00481 g009
Figure 10. Distribution of the coal loss with the three interval groups of supports: (a) process 1; (b) process 2; (c) process 3; (d) process 4.
Processes 12 00481 g010
Figure 11. Relationship between the number of drawn particles and the number of support groups in a drawing-once-every-two-support approach.
Processes 12 00481 g011
Figure 12. Distribution of coal loss after each stage with a drawing-once-every-two-support approach: (a) process 1; (b) process 2; (c) process 3; (d) process 4.
Processes 12 00481 g012
Figure 13. Top coal-drawing-rates before and after optimization.
Processes 12 00481 g013
Table 1. Introduction to the research ideas.
Research ProceduresResearch MethodsTop-Coal-Drawing MethodsResearch Content
1Physical similarity simulationOne web cutting with one drawing
Two web cuttings with one drawing
Three web cuttings with one drawing
Four web cuttings with one drawing
Initial coal drawing
Periodic coal drawing
Excessive coal drawing
2Numerical simulationDrawing interval of every three groups of supports
Drawing-once-every-two-support method
Top-coal-drawing rate
Distribution of residual coal in the goaf
3On-site verificationOne web cutting with one drawing and three interval groups of supportsTop-coal-drawing rate of the working face at an elevation level of +721–+575
Table 2. Statistics of the 45# coal seam mining in the northern mining area of Wudong Coal Mine.
Altitude Elevation Strike Length/mWidth of Working Face/mHeight of Horizontal Section/mTop Coal Height/mDrawing RatioGeological Reserves/MtDrawing Rate/%
+7218104213.5111:4.40.671686.34
+6889004218.7516.251:6.50.983472.01
+6451628412522.51:91.67.82461.05
+62011352725221:7.30.9348632.86
+5751234332522.01:7.31.17139.12
Table 3. Amount of coal and gangue released in the initial coal-drawing stage.
Drawing IntervalQuality of Coal/gQuality of Gangue/gRate of Drawing/%Rate of Gangue/%
One web cutting with one drawing1372.57.5465.410.54
Two web cuttings with one drawing1436.08.2243.470.57
Three web cuttings with one drawing1417.77.8160.250.55
Four web cuttings with one drawing1396.59.5118.390.68
Table 4. Particle parameters of the coal and gangue.
MaterialDensity
ρ/(kg/m3)
Radius
R/(m)
Normal Stiffness
kn/(N/m)
Tangential Stiffness
ks/(N/m)
Coefficient of Friction
Coal13120.05–0.152 × 1082 × 1080.4
Gangue25000.15–0.254 × 1084 × 1080.4
Table 5. Parameters of the drawing support.
Height/(m)Central Distance/(m)Dip Angle
/(°)
Normal Stiffness
/(N/m)
Tangential Stiffness
/(N/m)
Coefficient of Friction
3.01.5452 × 1092 × 1090.2
Disclaimer/Publisher’s Note: The statements, opinions and data contained in all publications are solely those of the individual author(s) and contributor(s) and not of MDPI and/or the editor(s). MDPI and/or the editor(s) disclaim responsibility for any injury to people or property resulting from any ideas, methods, instructions or products referred to in the content.

