Describing the Drying and Solidification Behavior of Single Suspension Droplets Using a Novel Unresolved CFD-DEM Simulation Approach


Abstract
1. Introduction
2. Materials and Methods
2.1. Model Structure
2.2. The CFD Model
2.3. The DEM Model
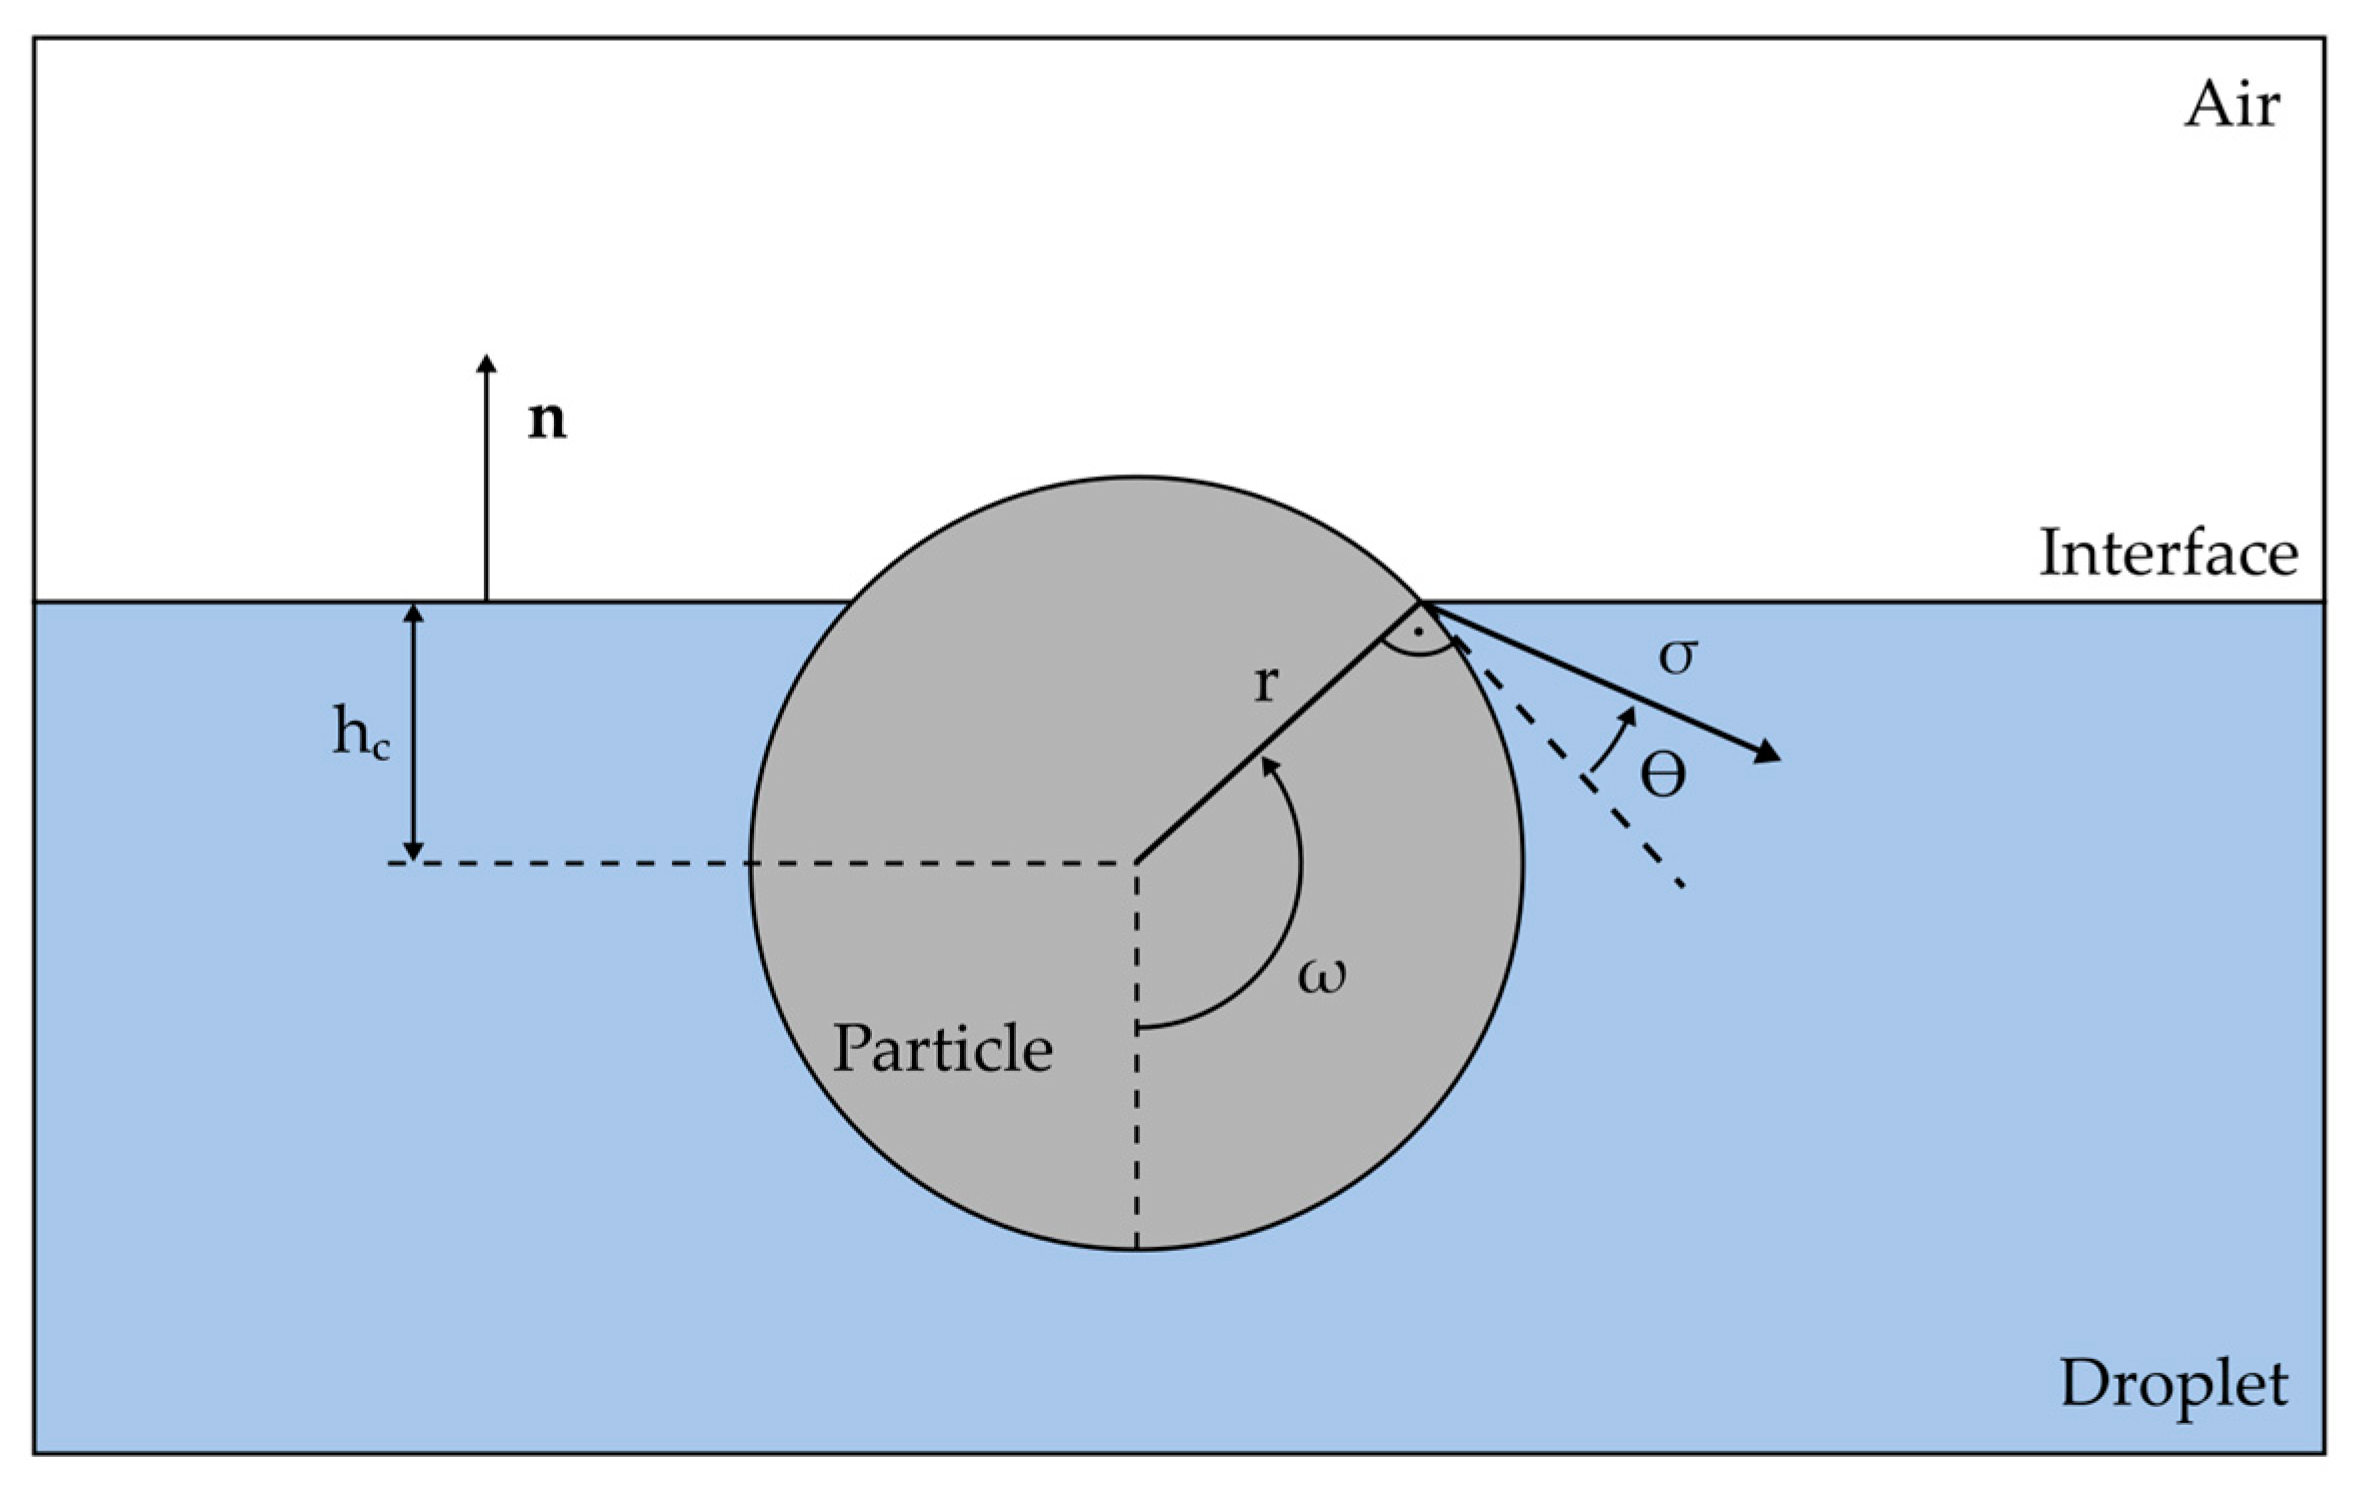
2.3.1. The Capillary Force Model
2.3.2. The Particle Bond Model
3. Results
3.1. Model Analyis
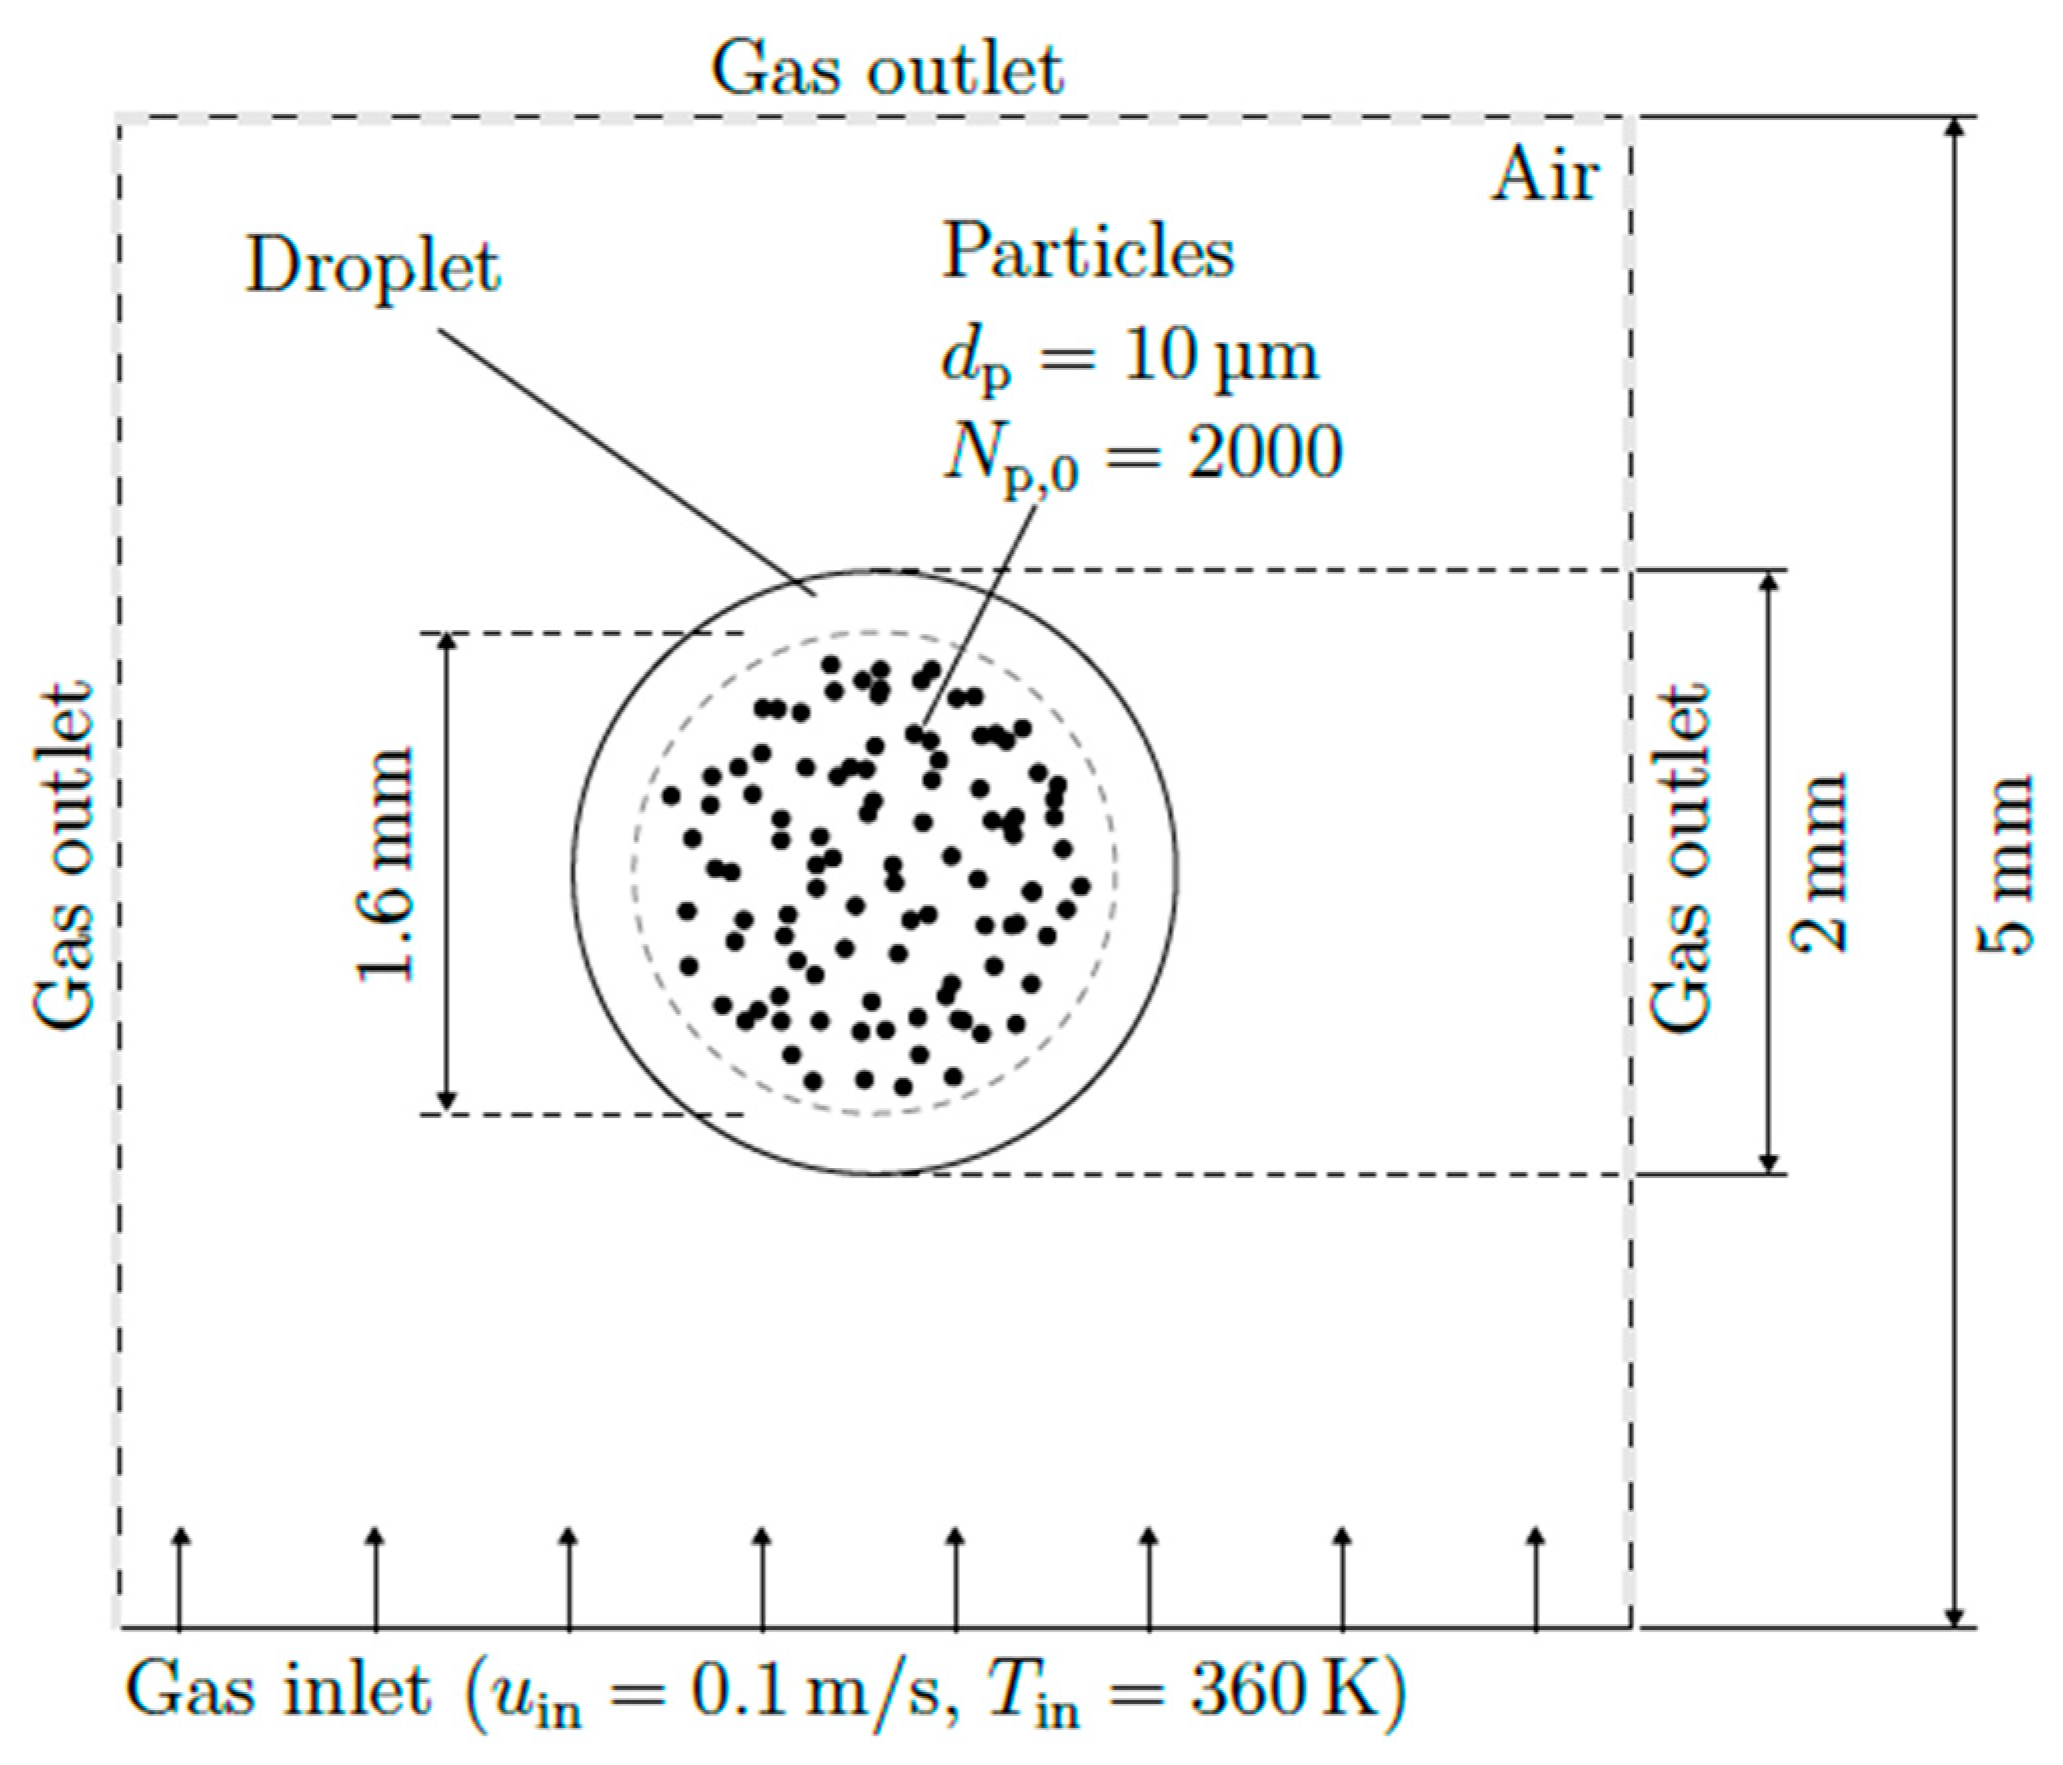
Simulation Setup
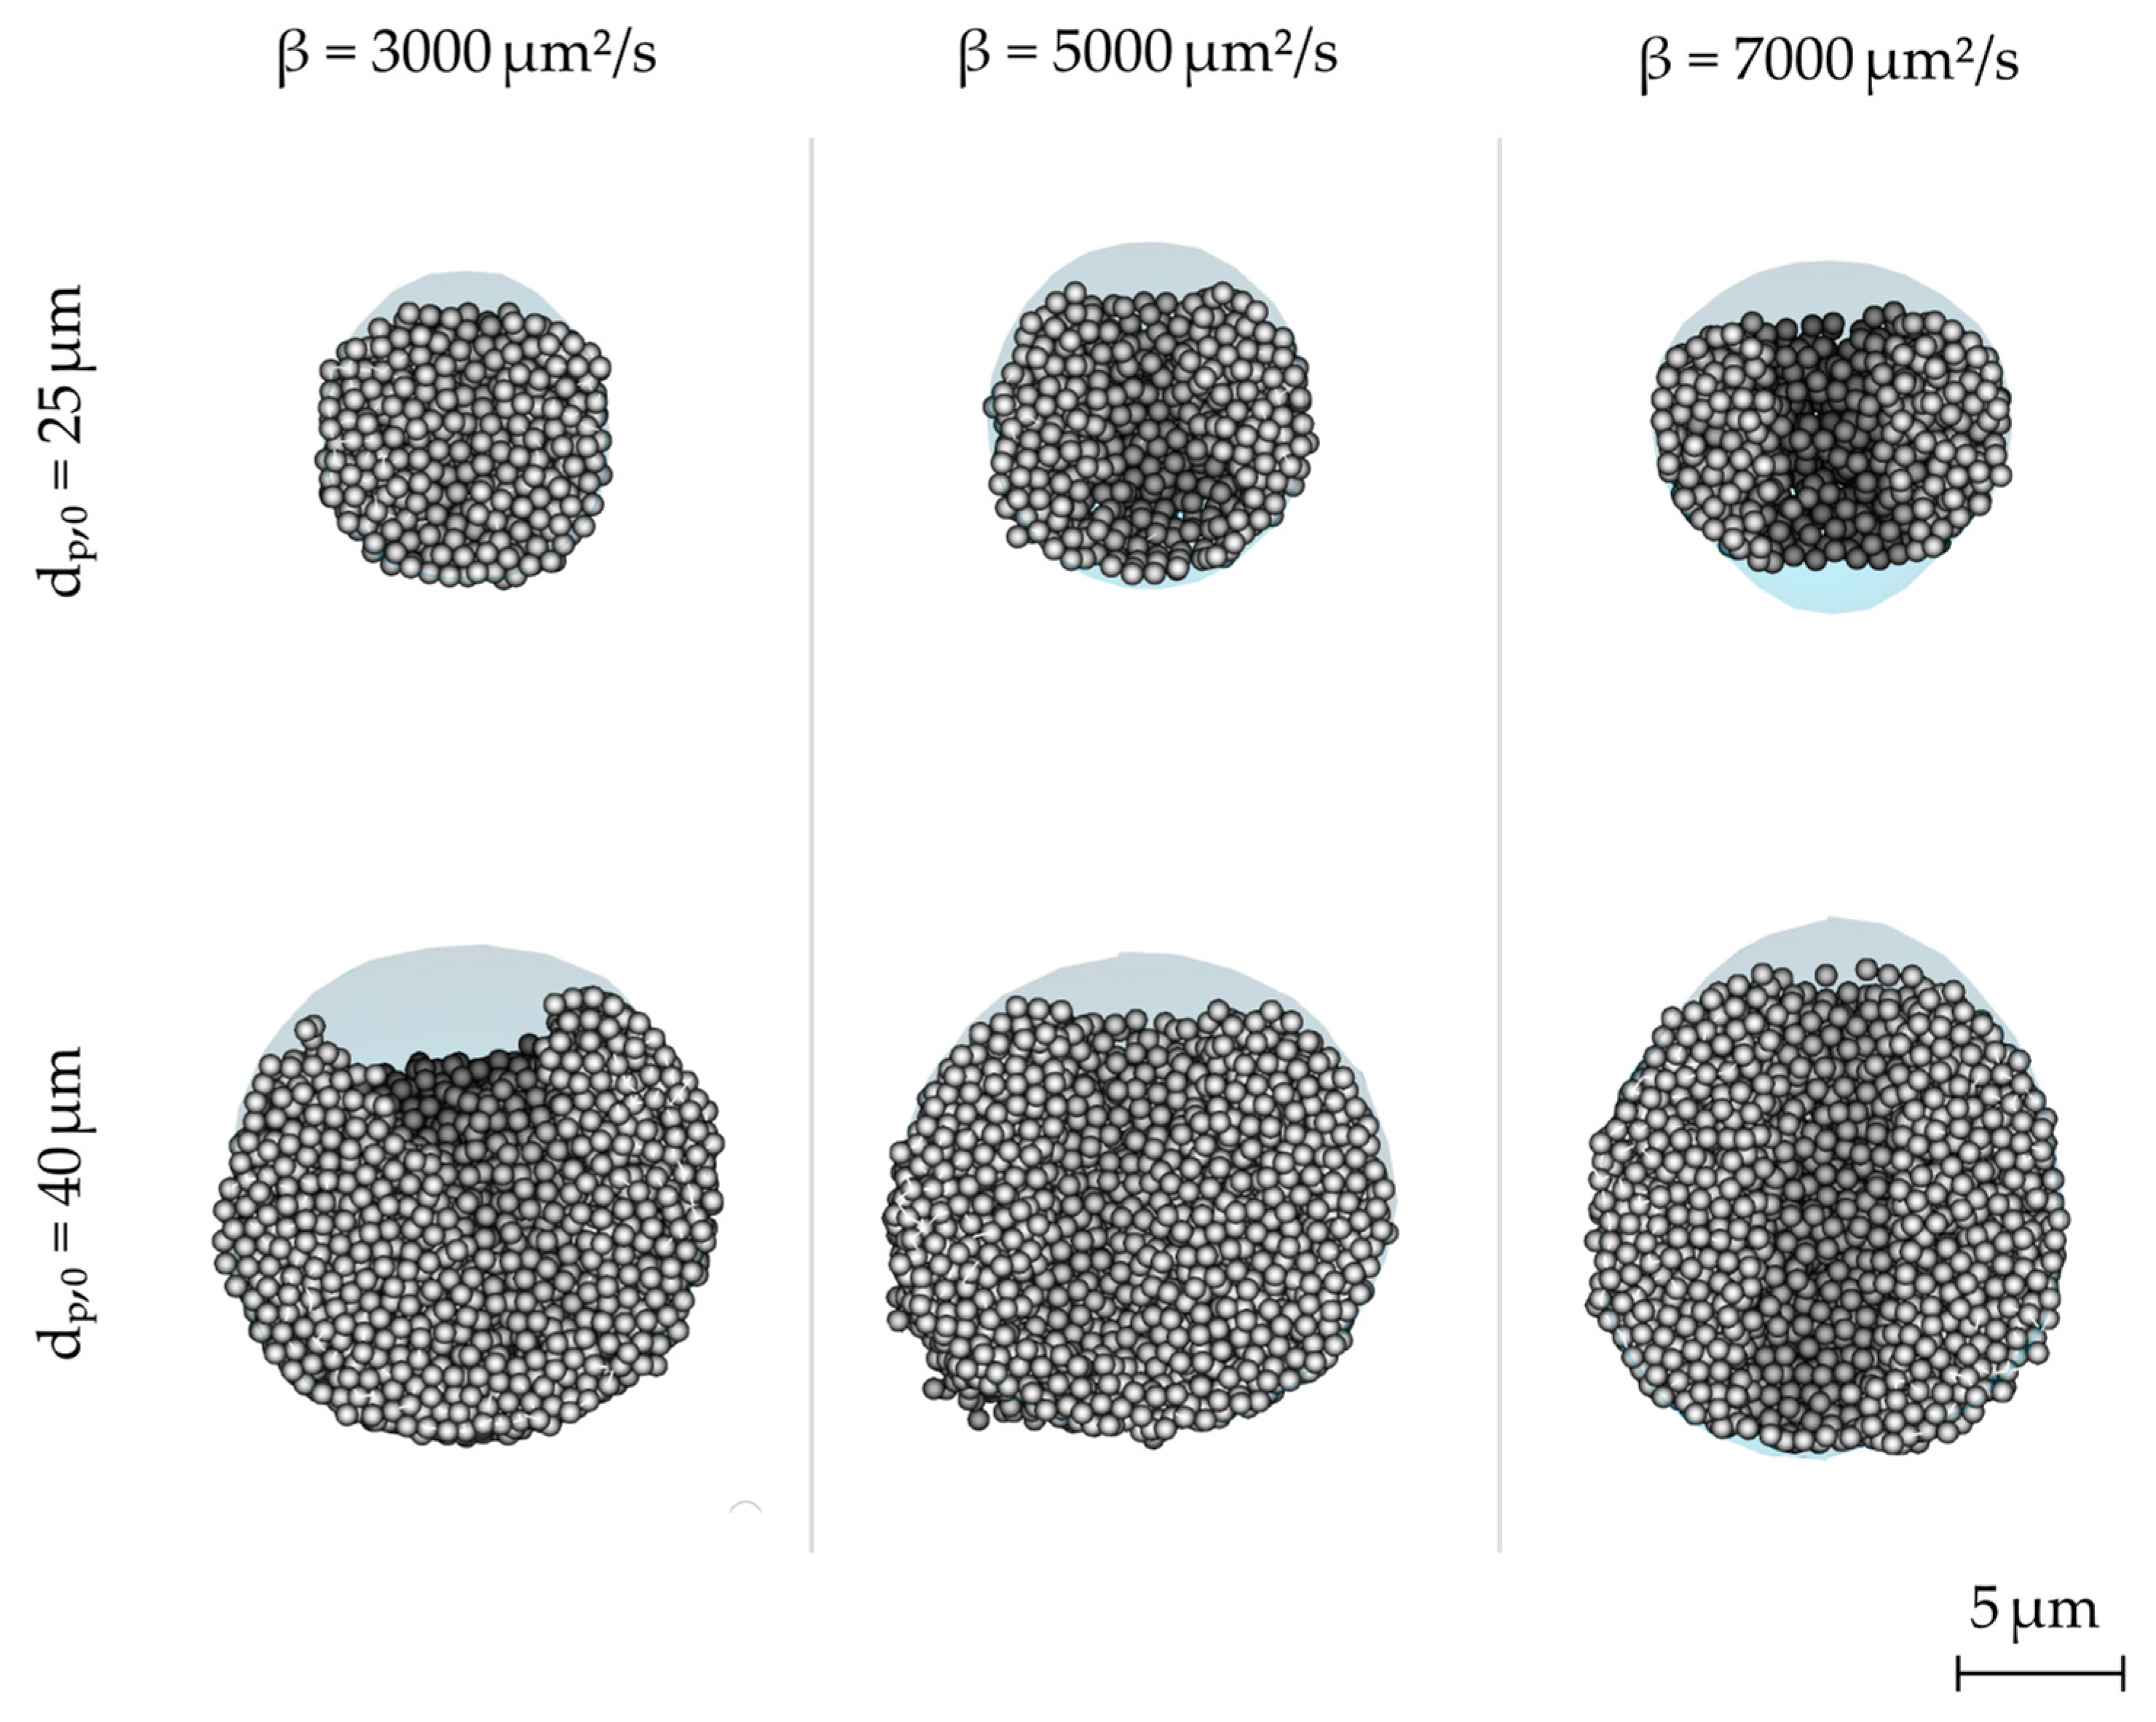
3.2. Particle Morphologies
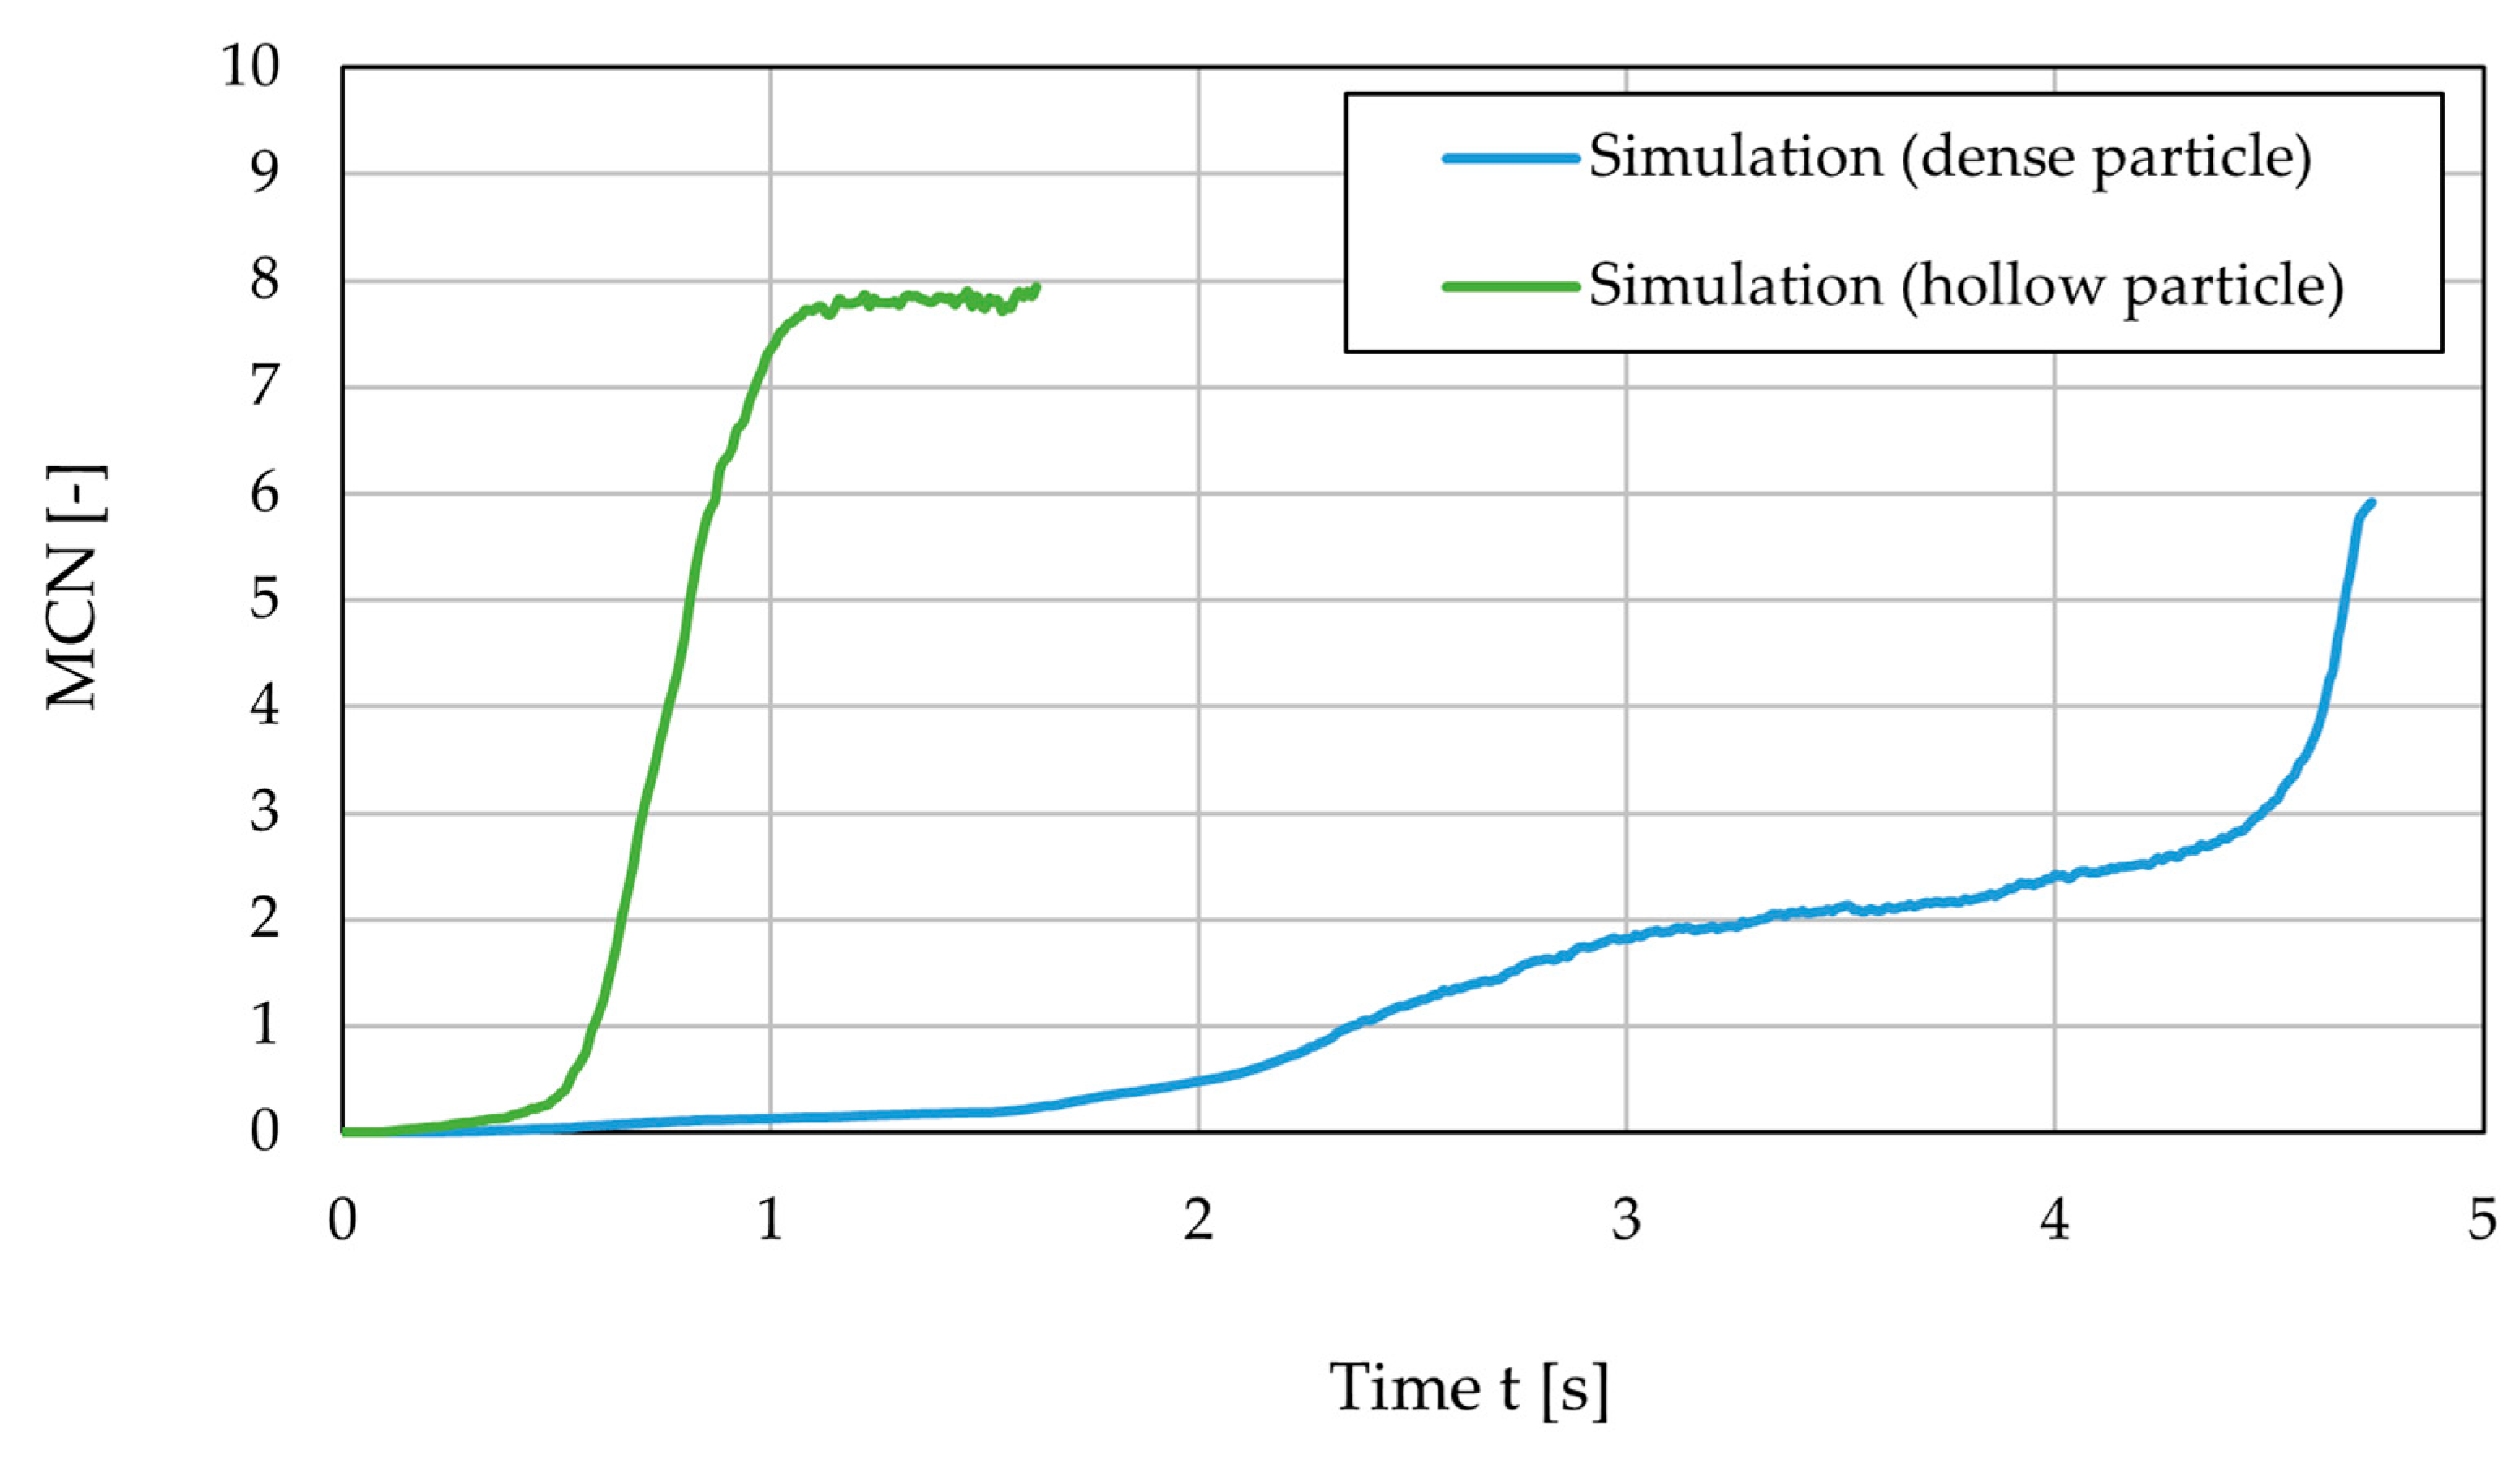
3.3. Drying Rate
4. Conclusions
- (1)
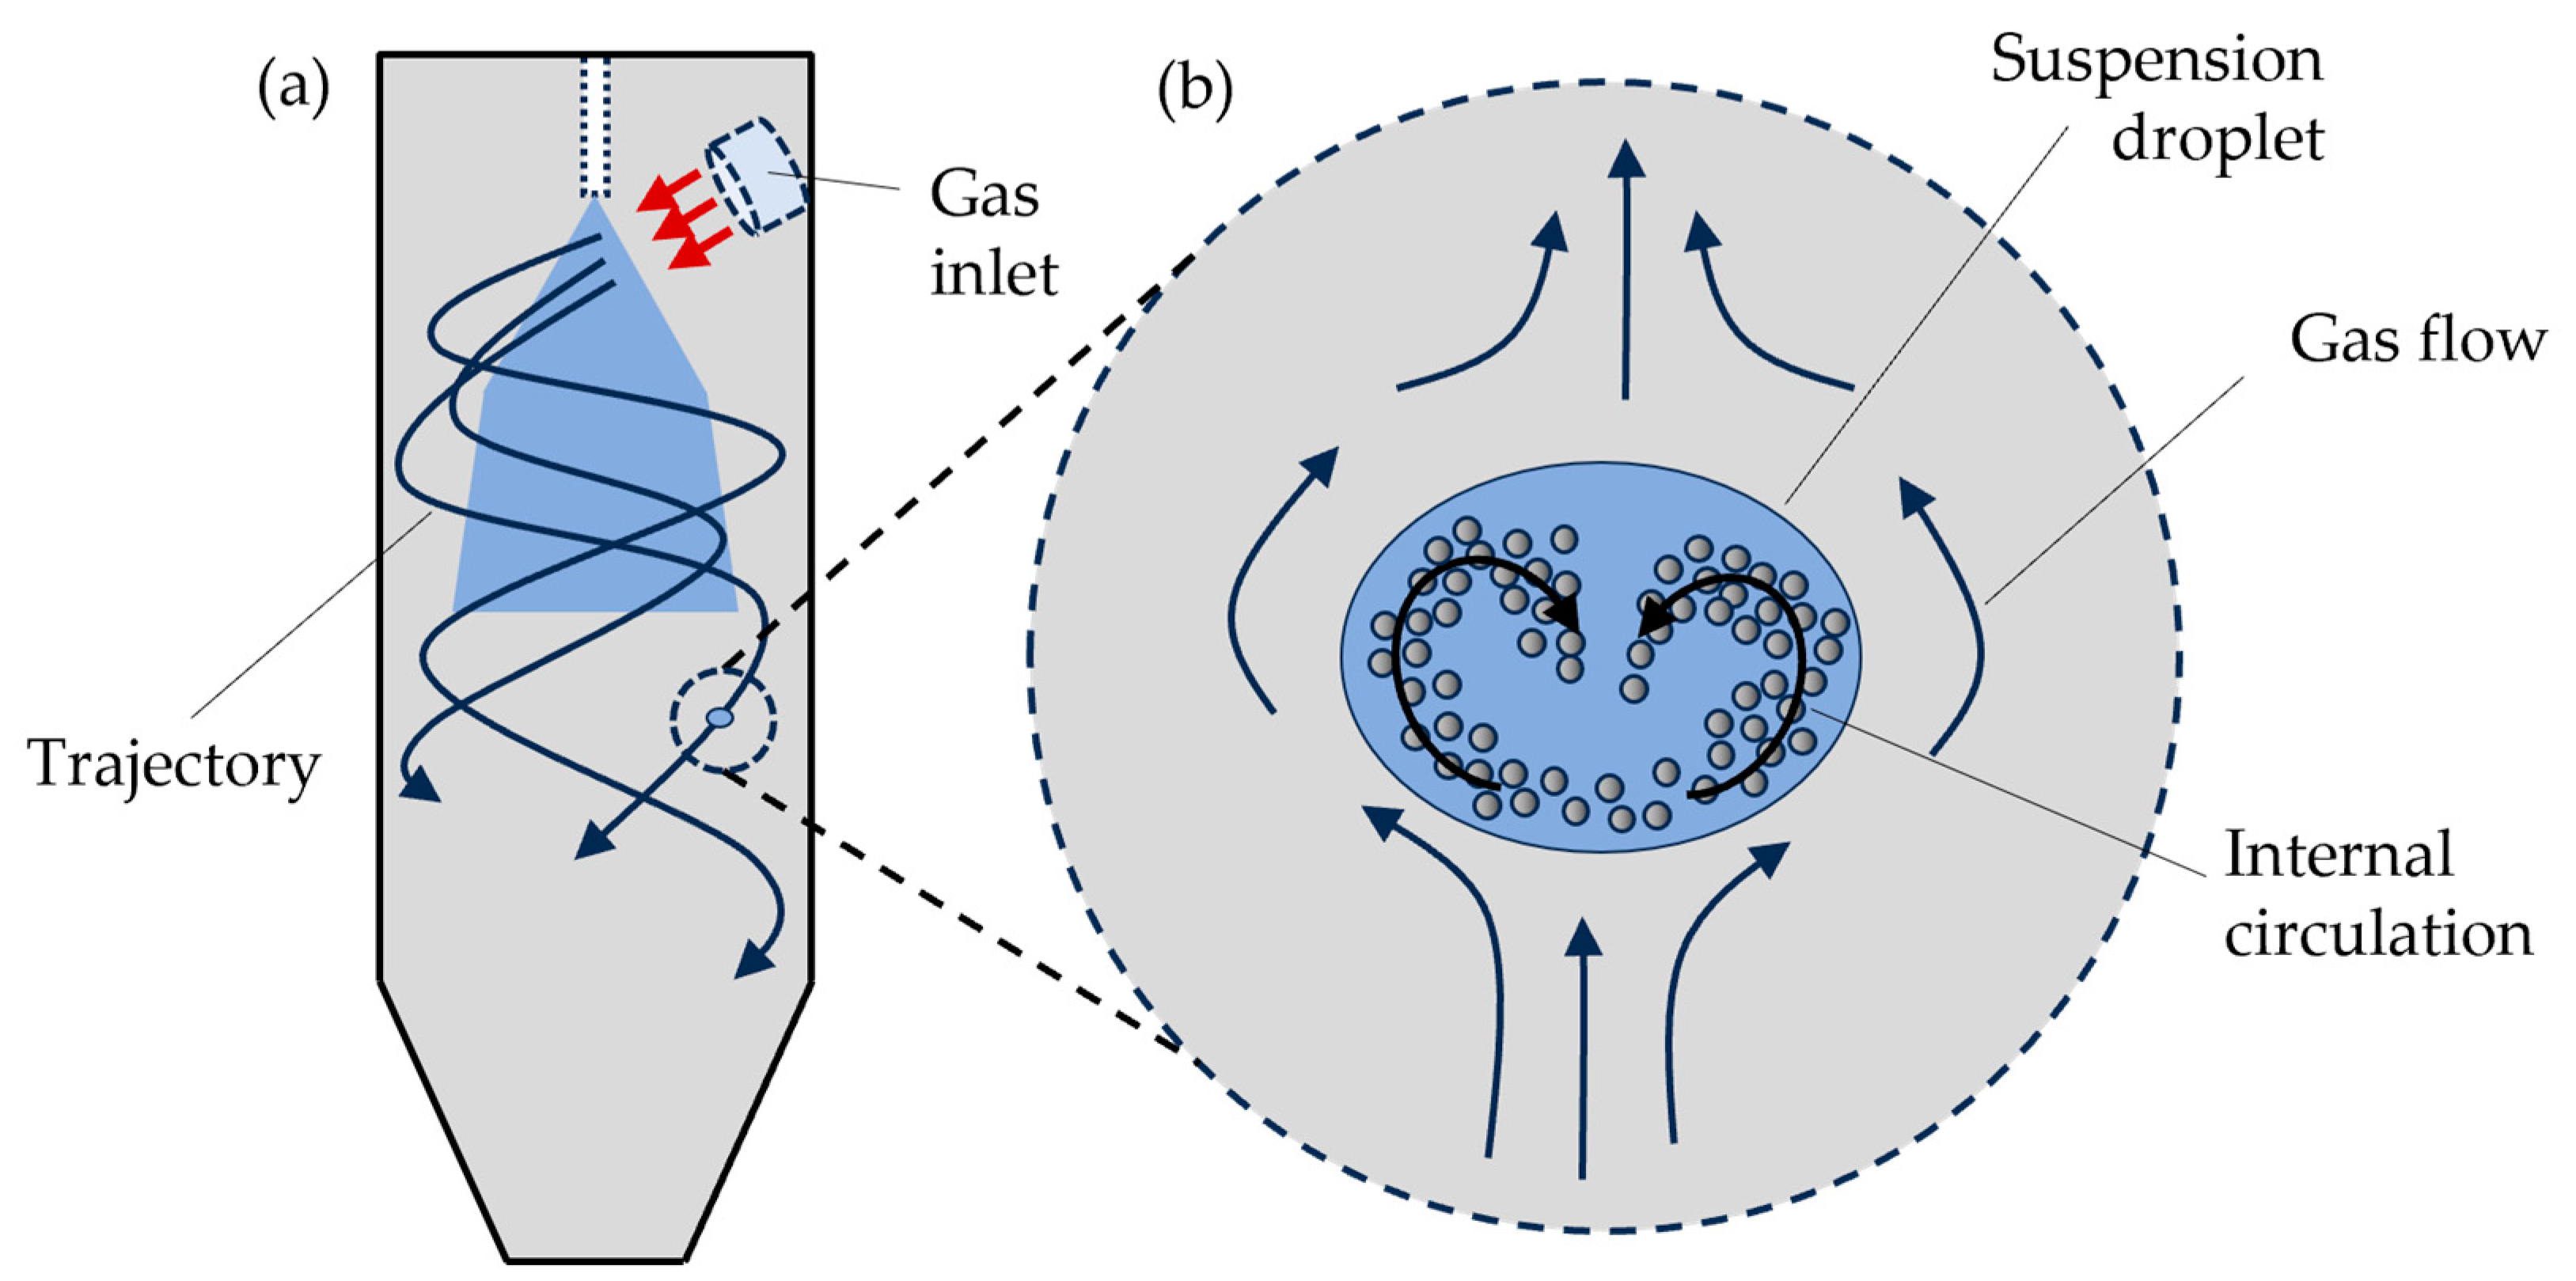
- Simulations and experiments on different scales are combined to describe and investigate the particle formation mechanisms in spray dryers, both on a droplet and apparatus scale.
- (2)
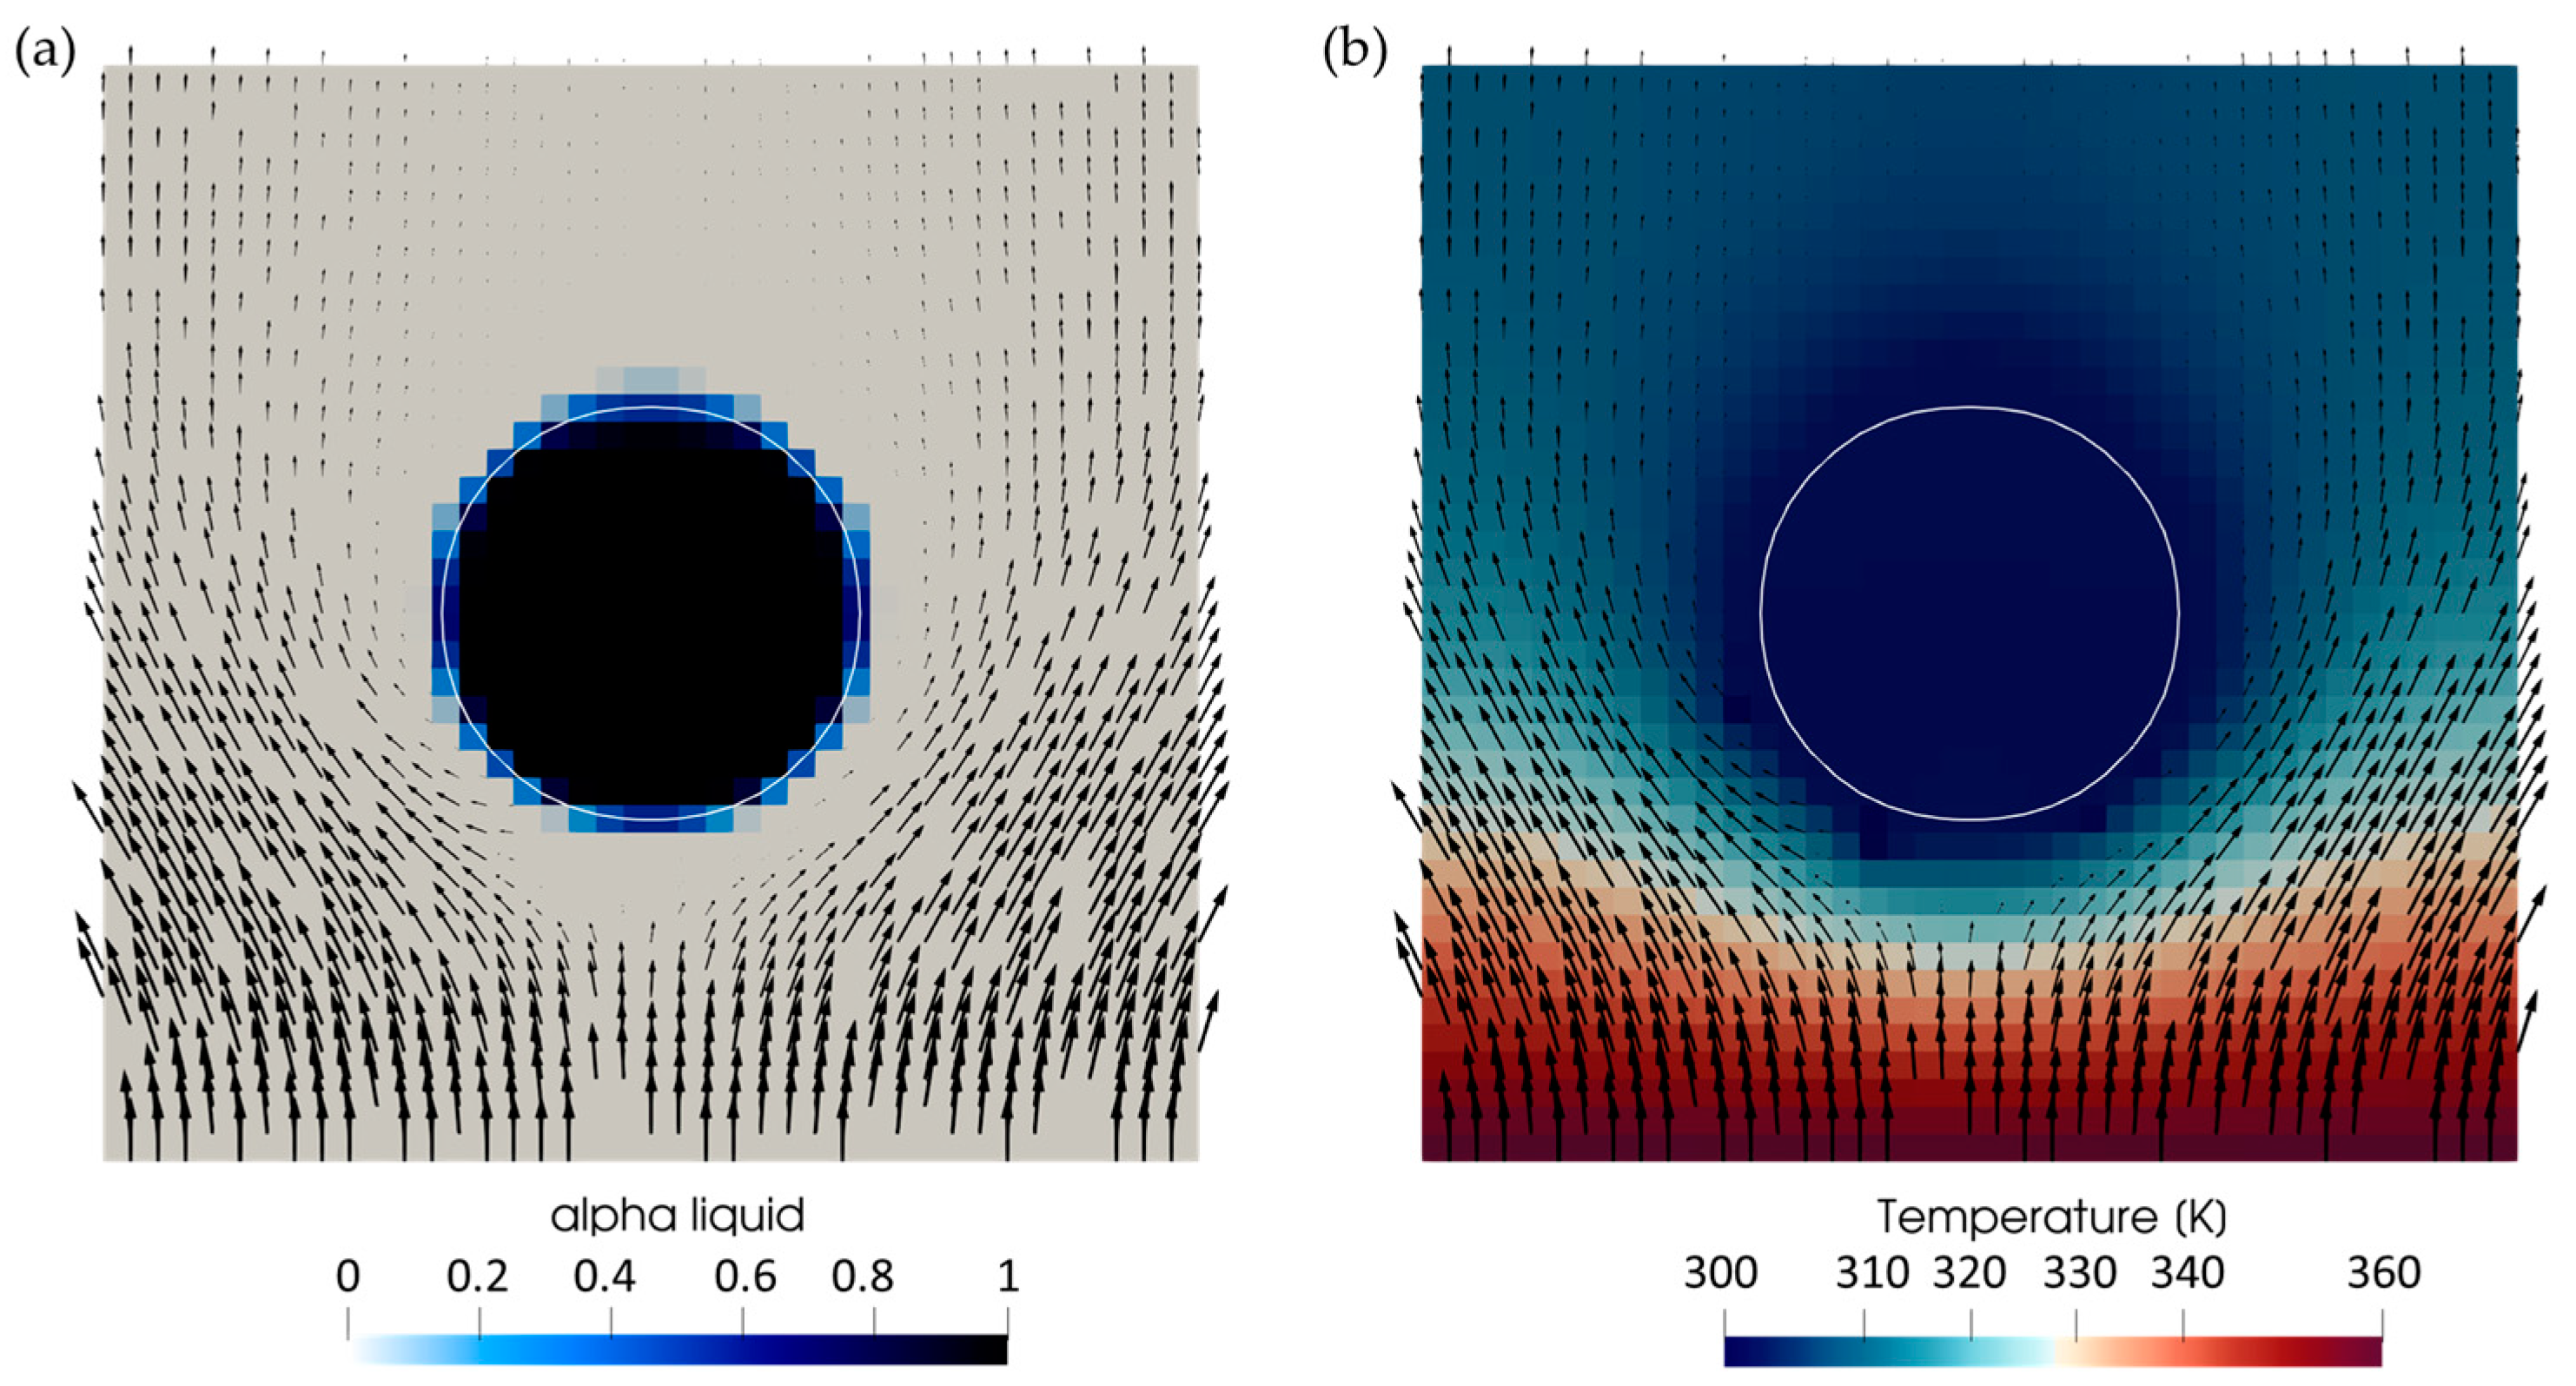
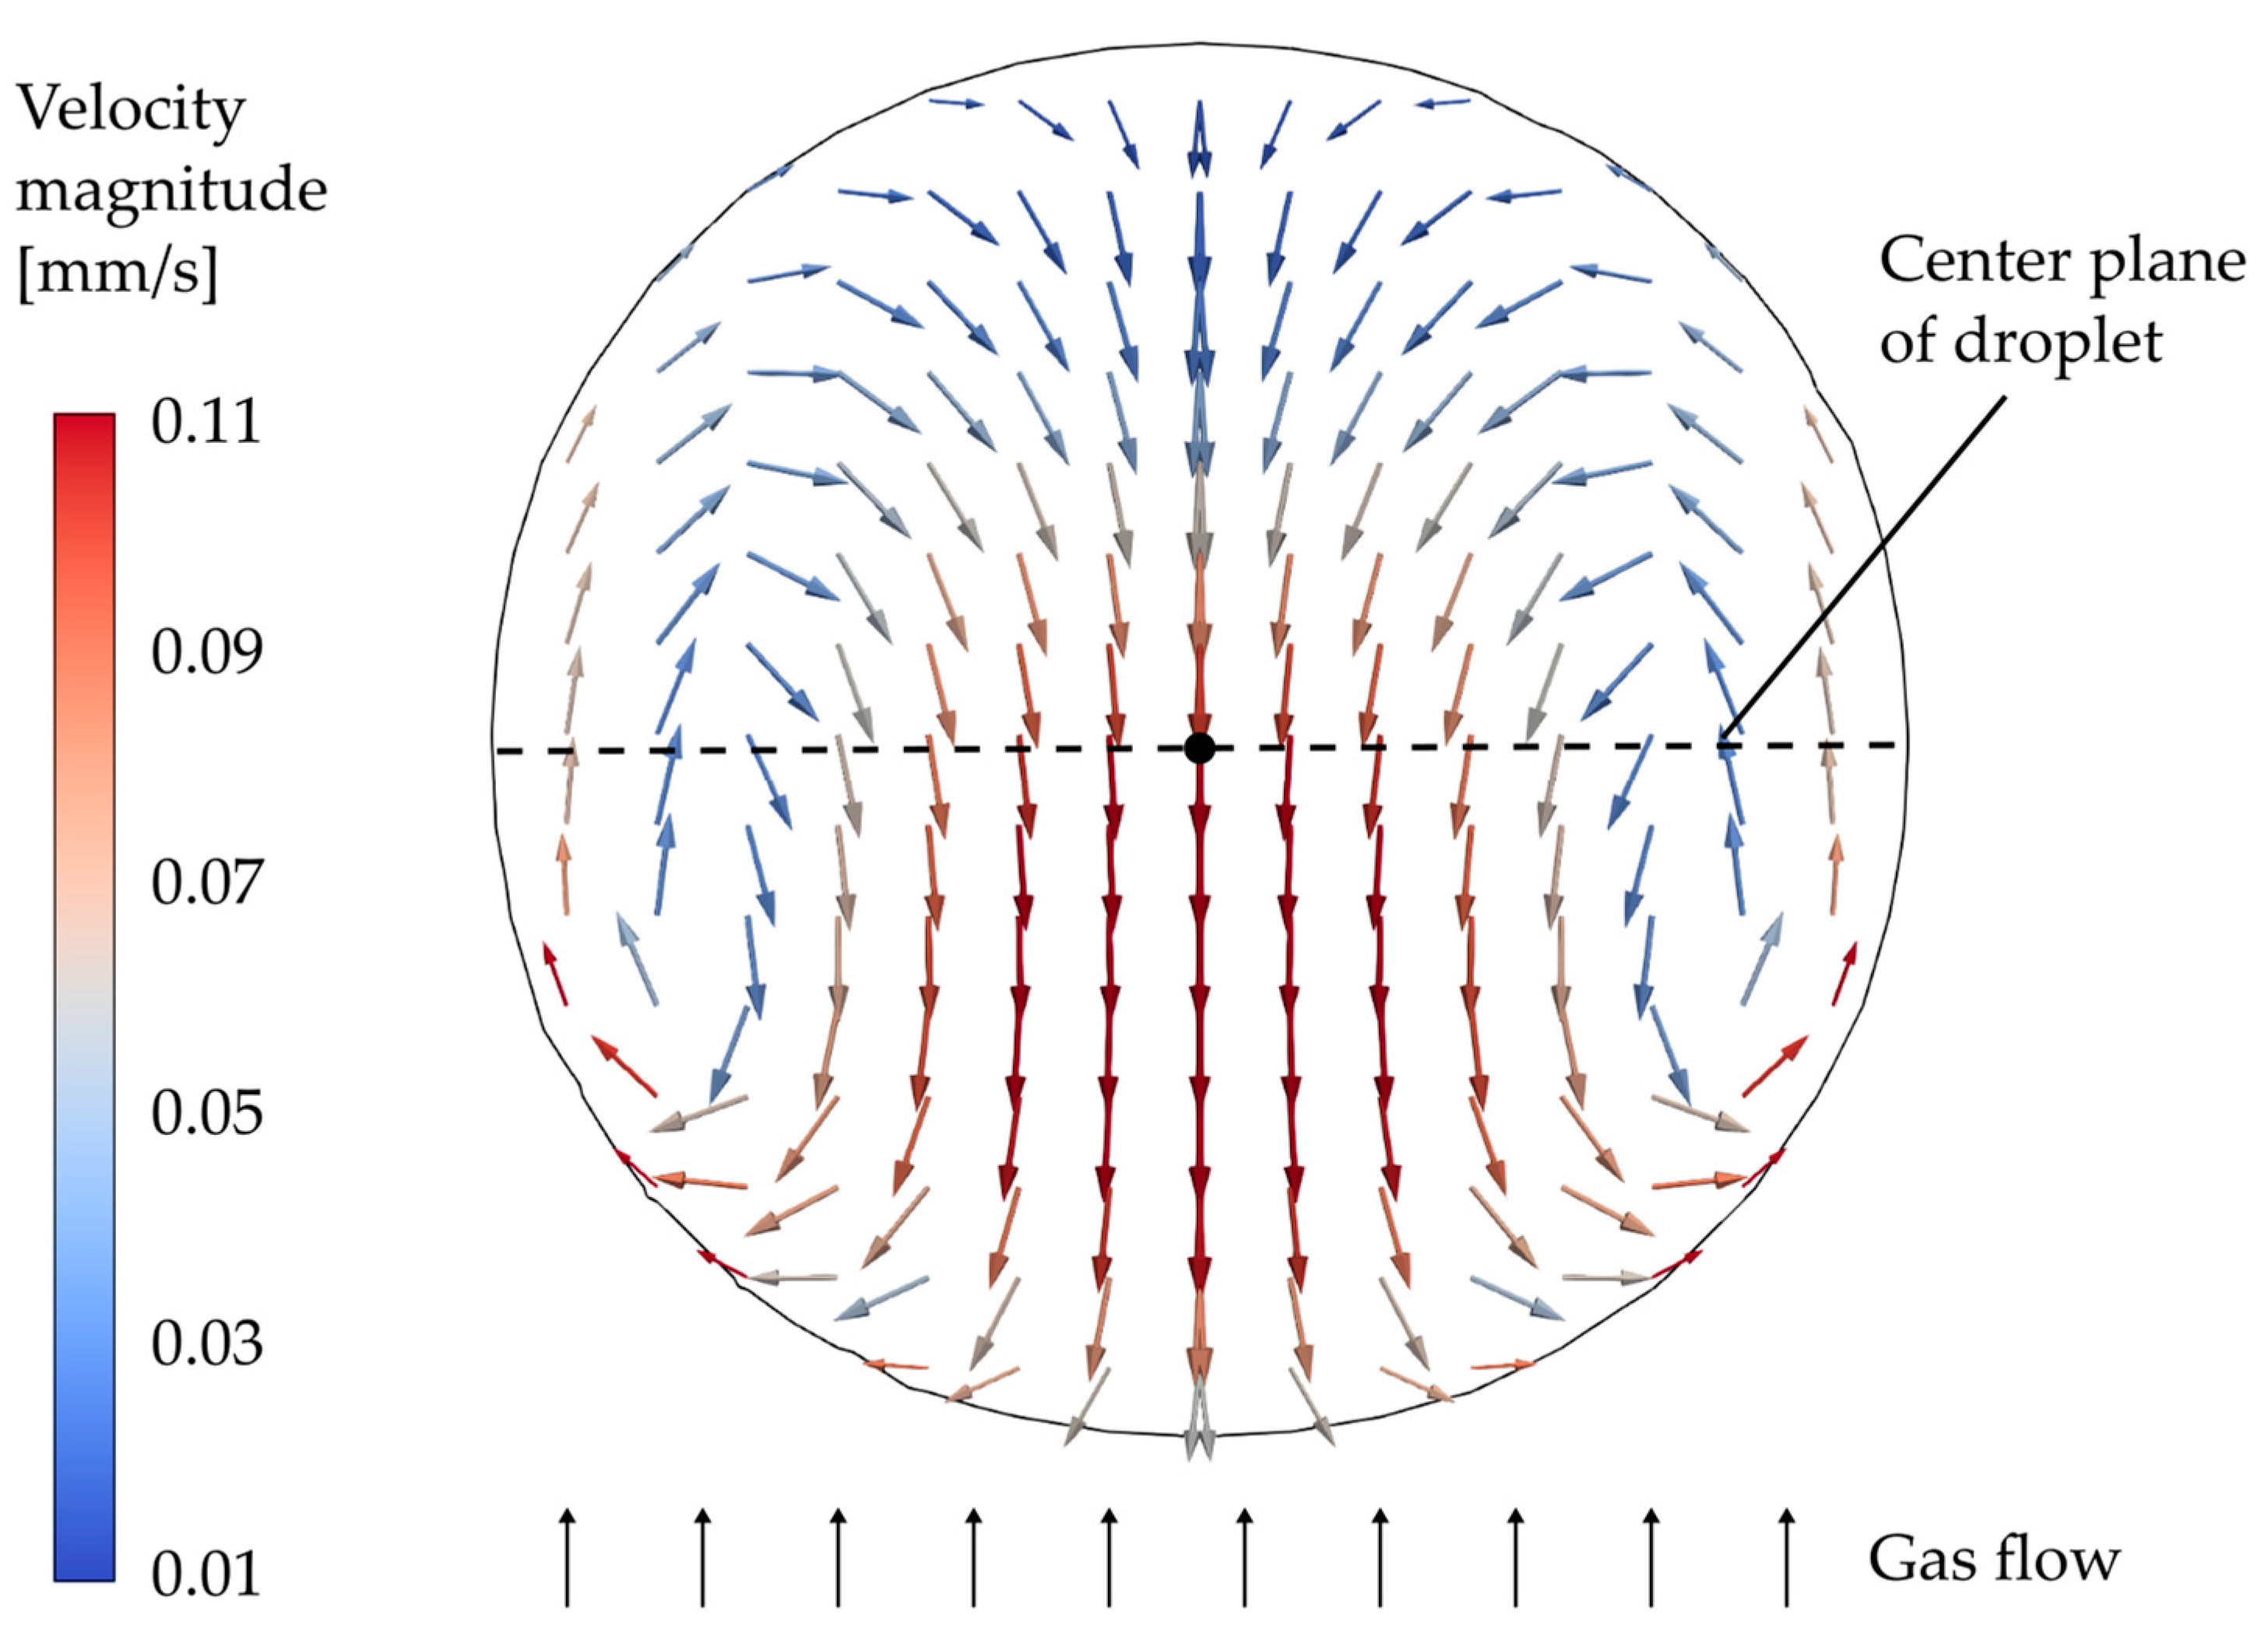
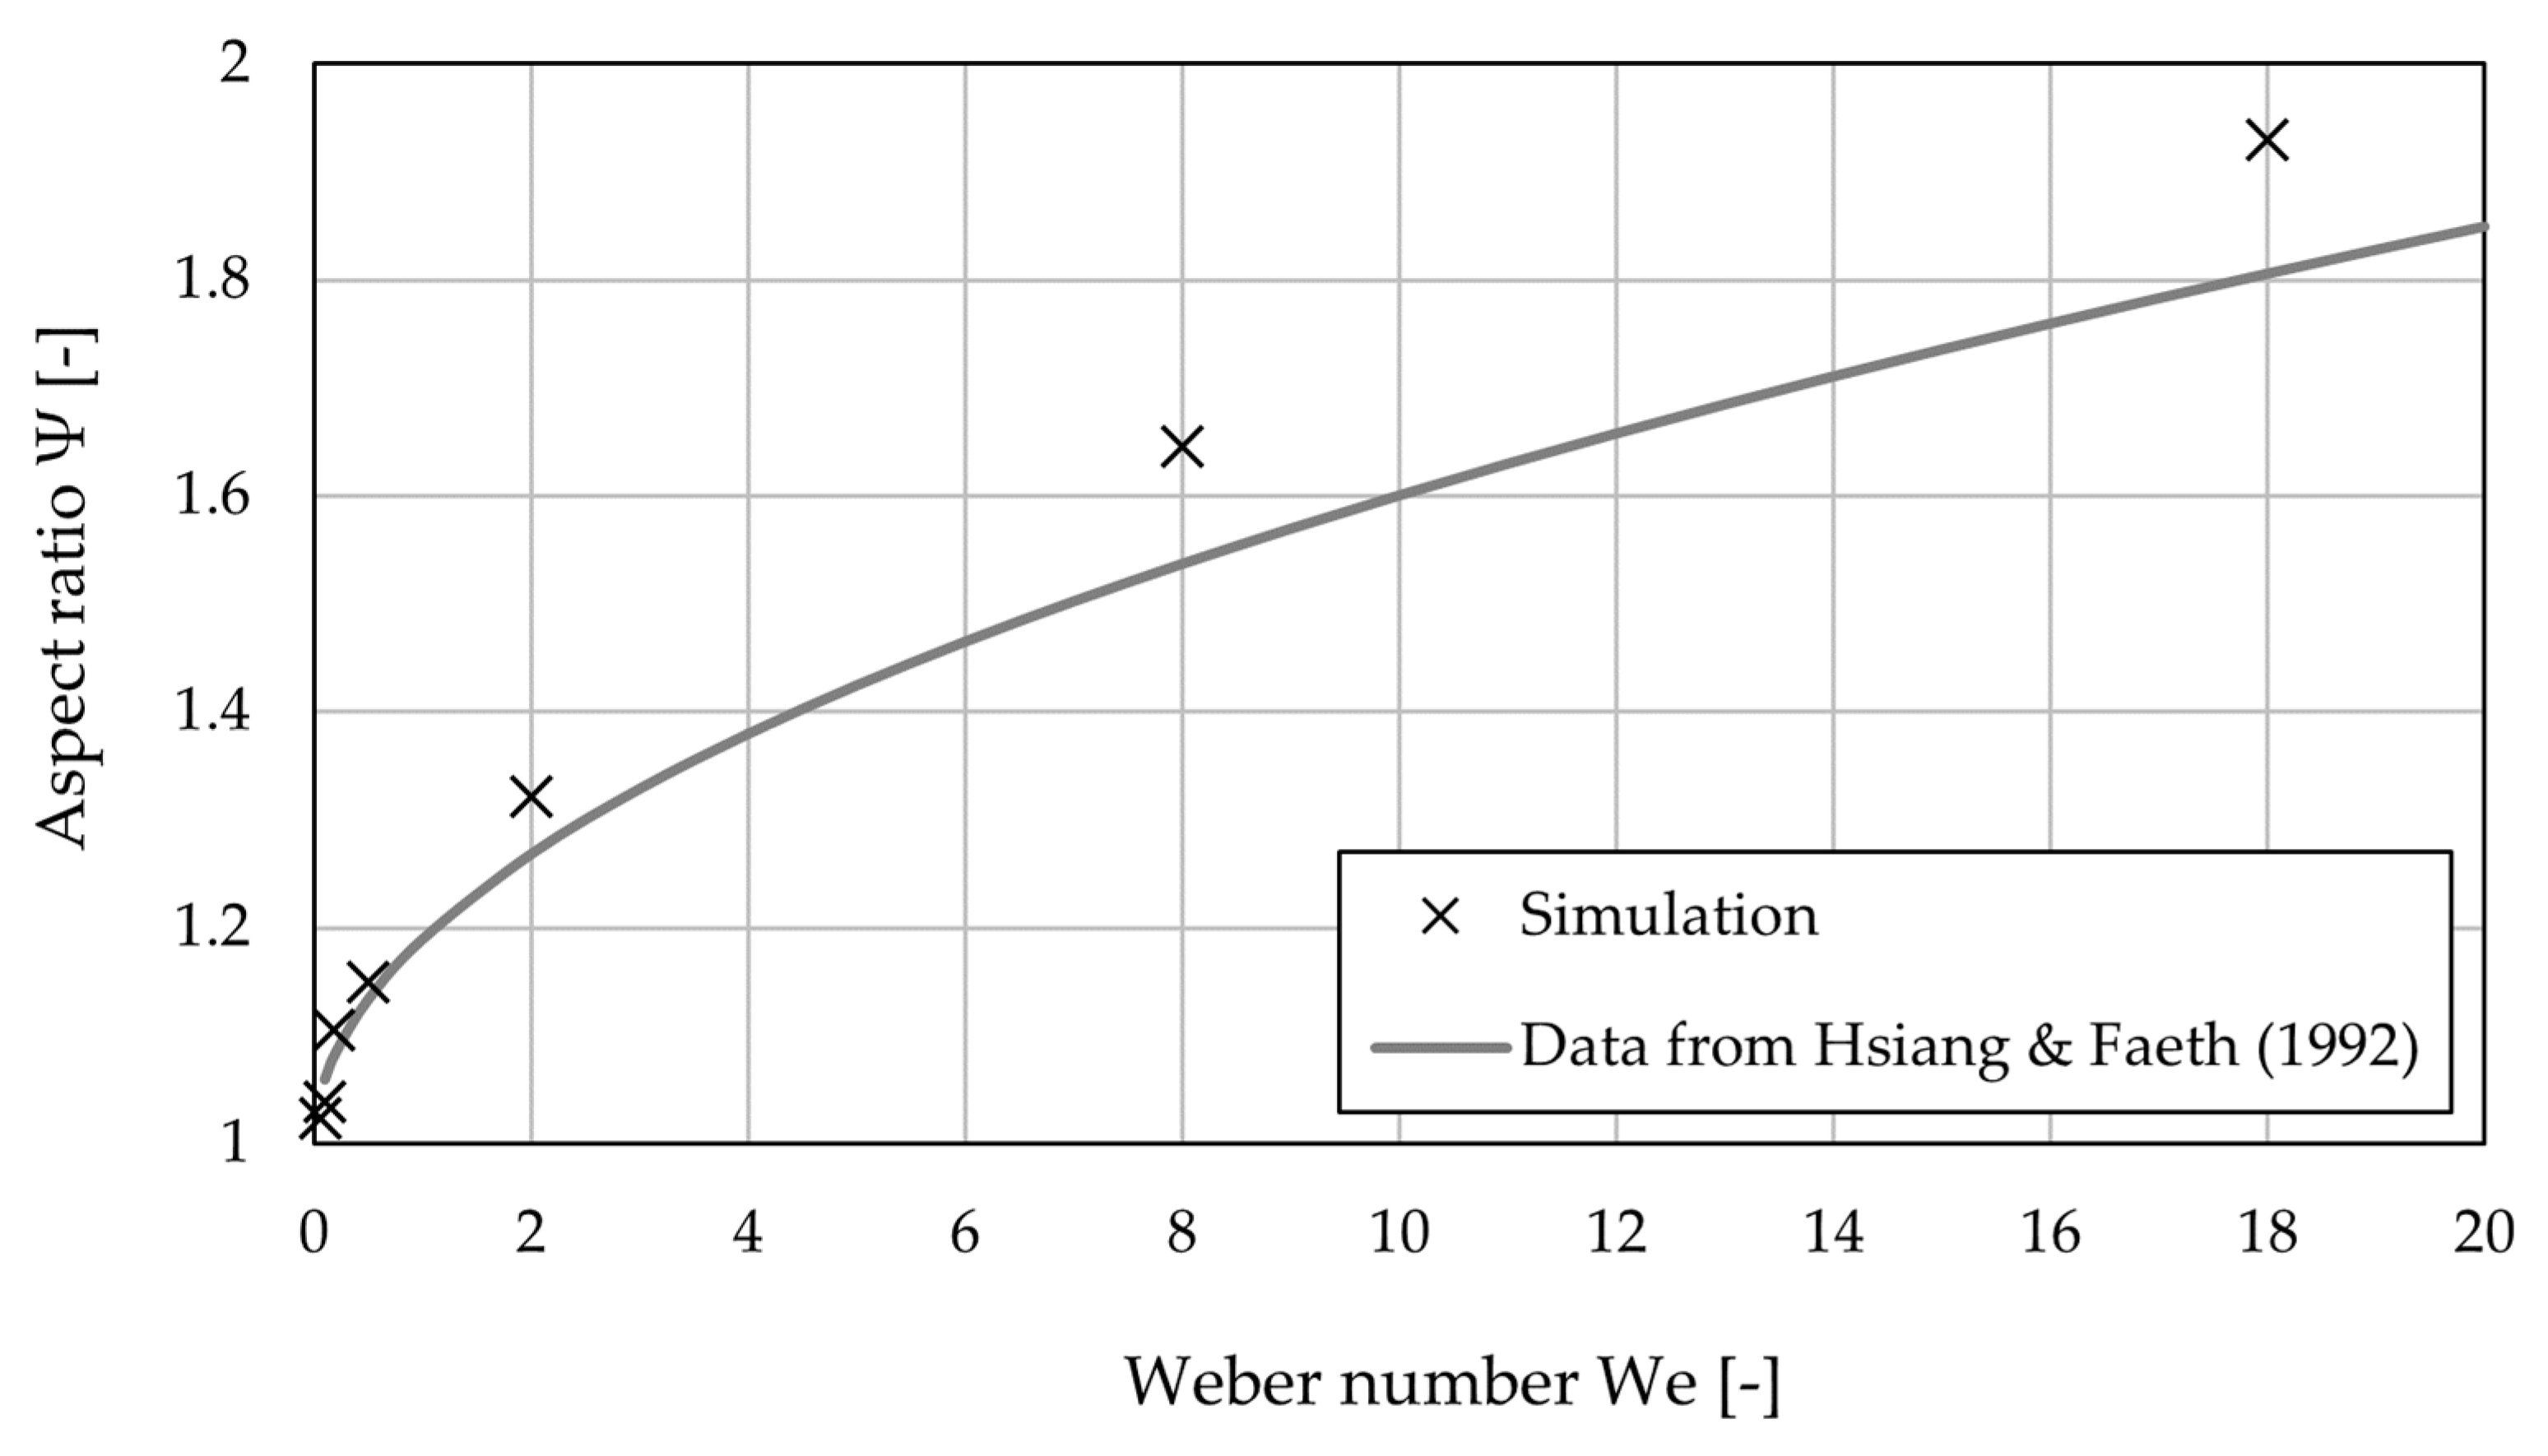
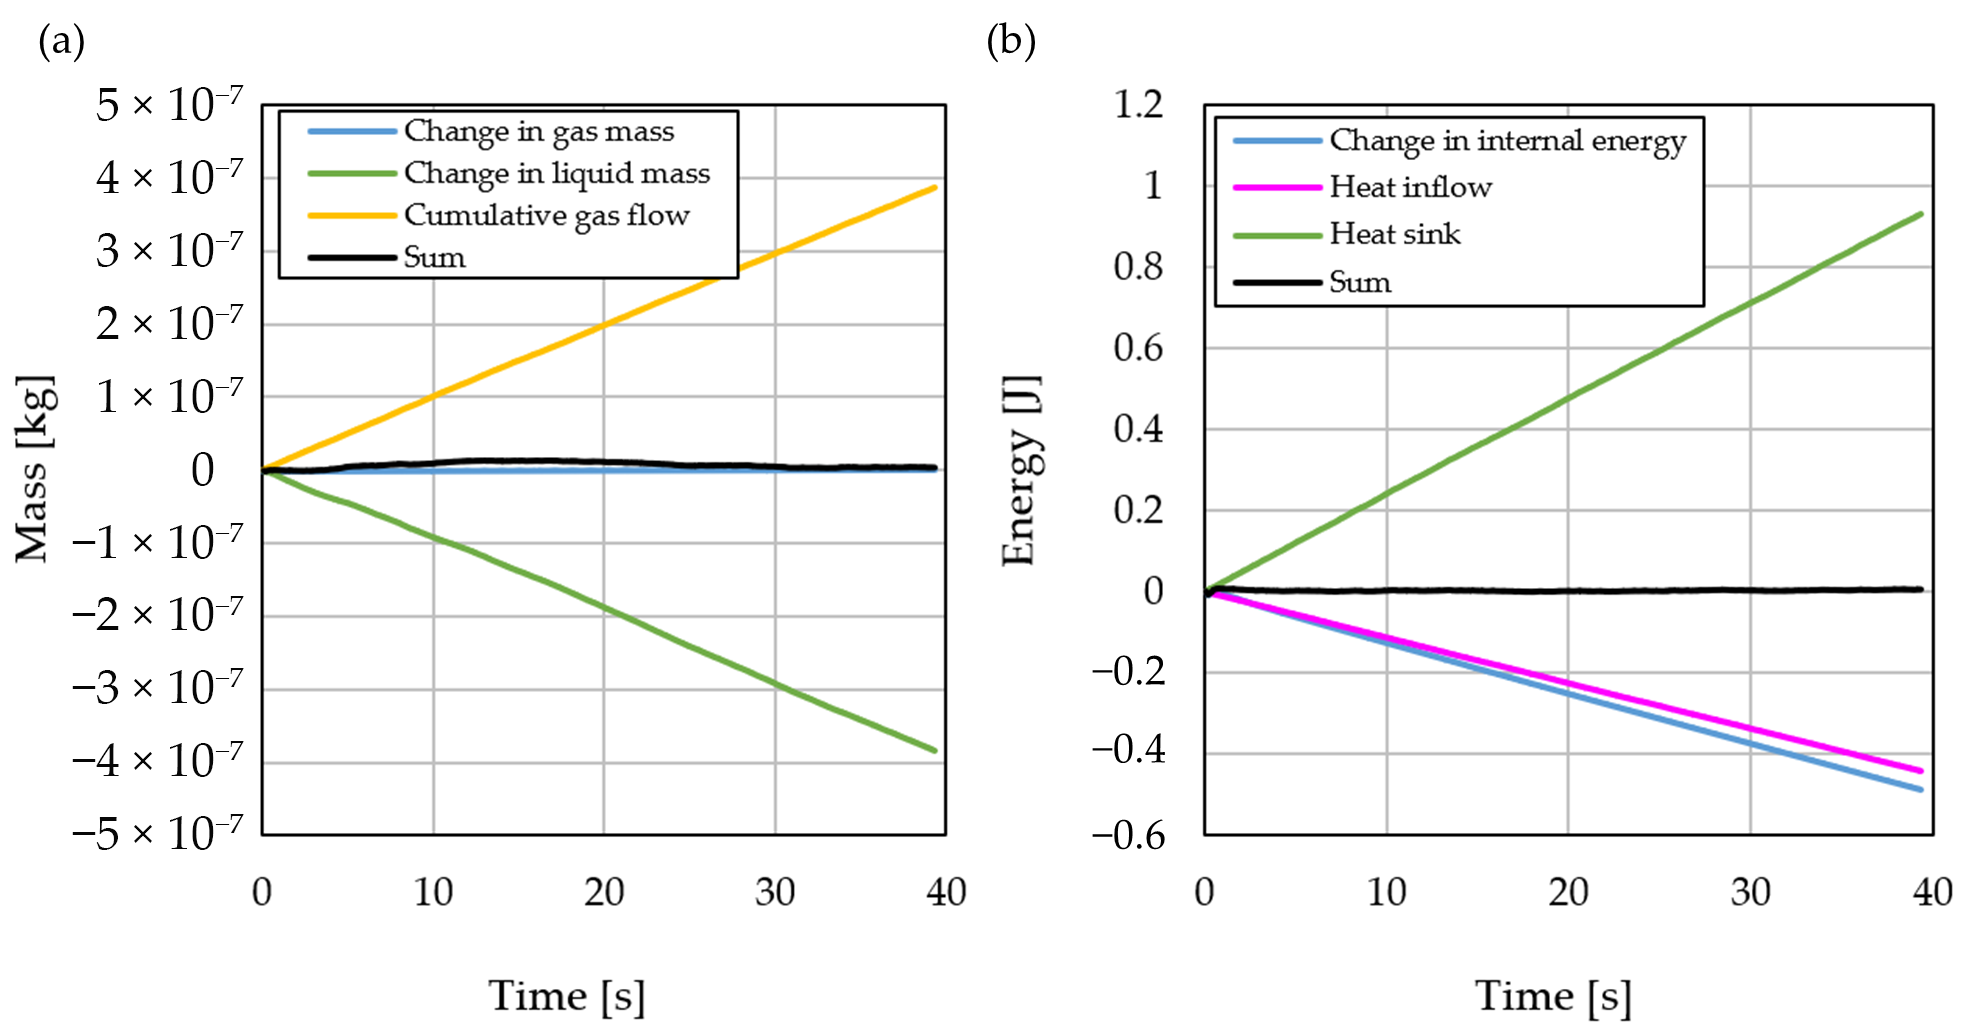
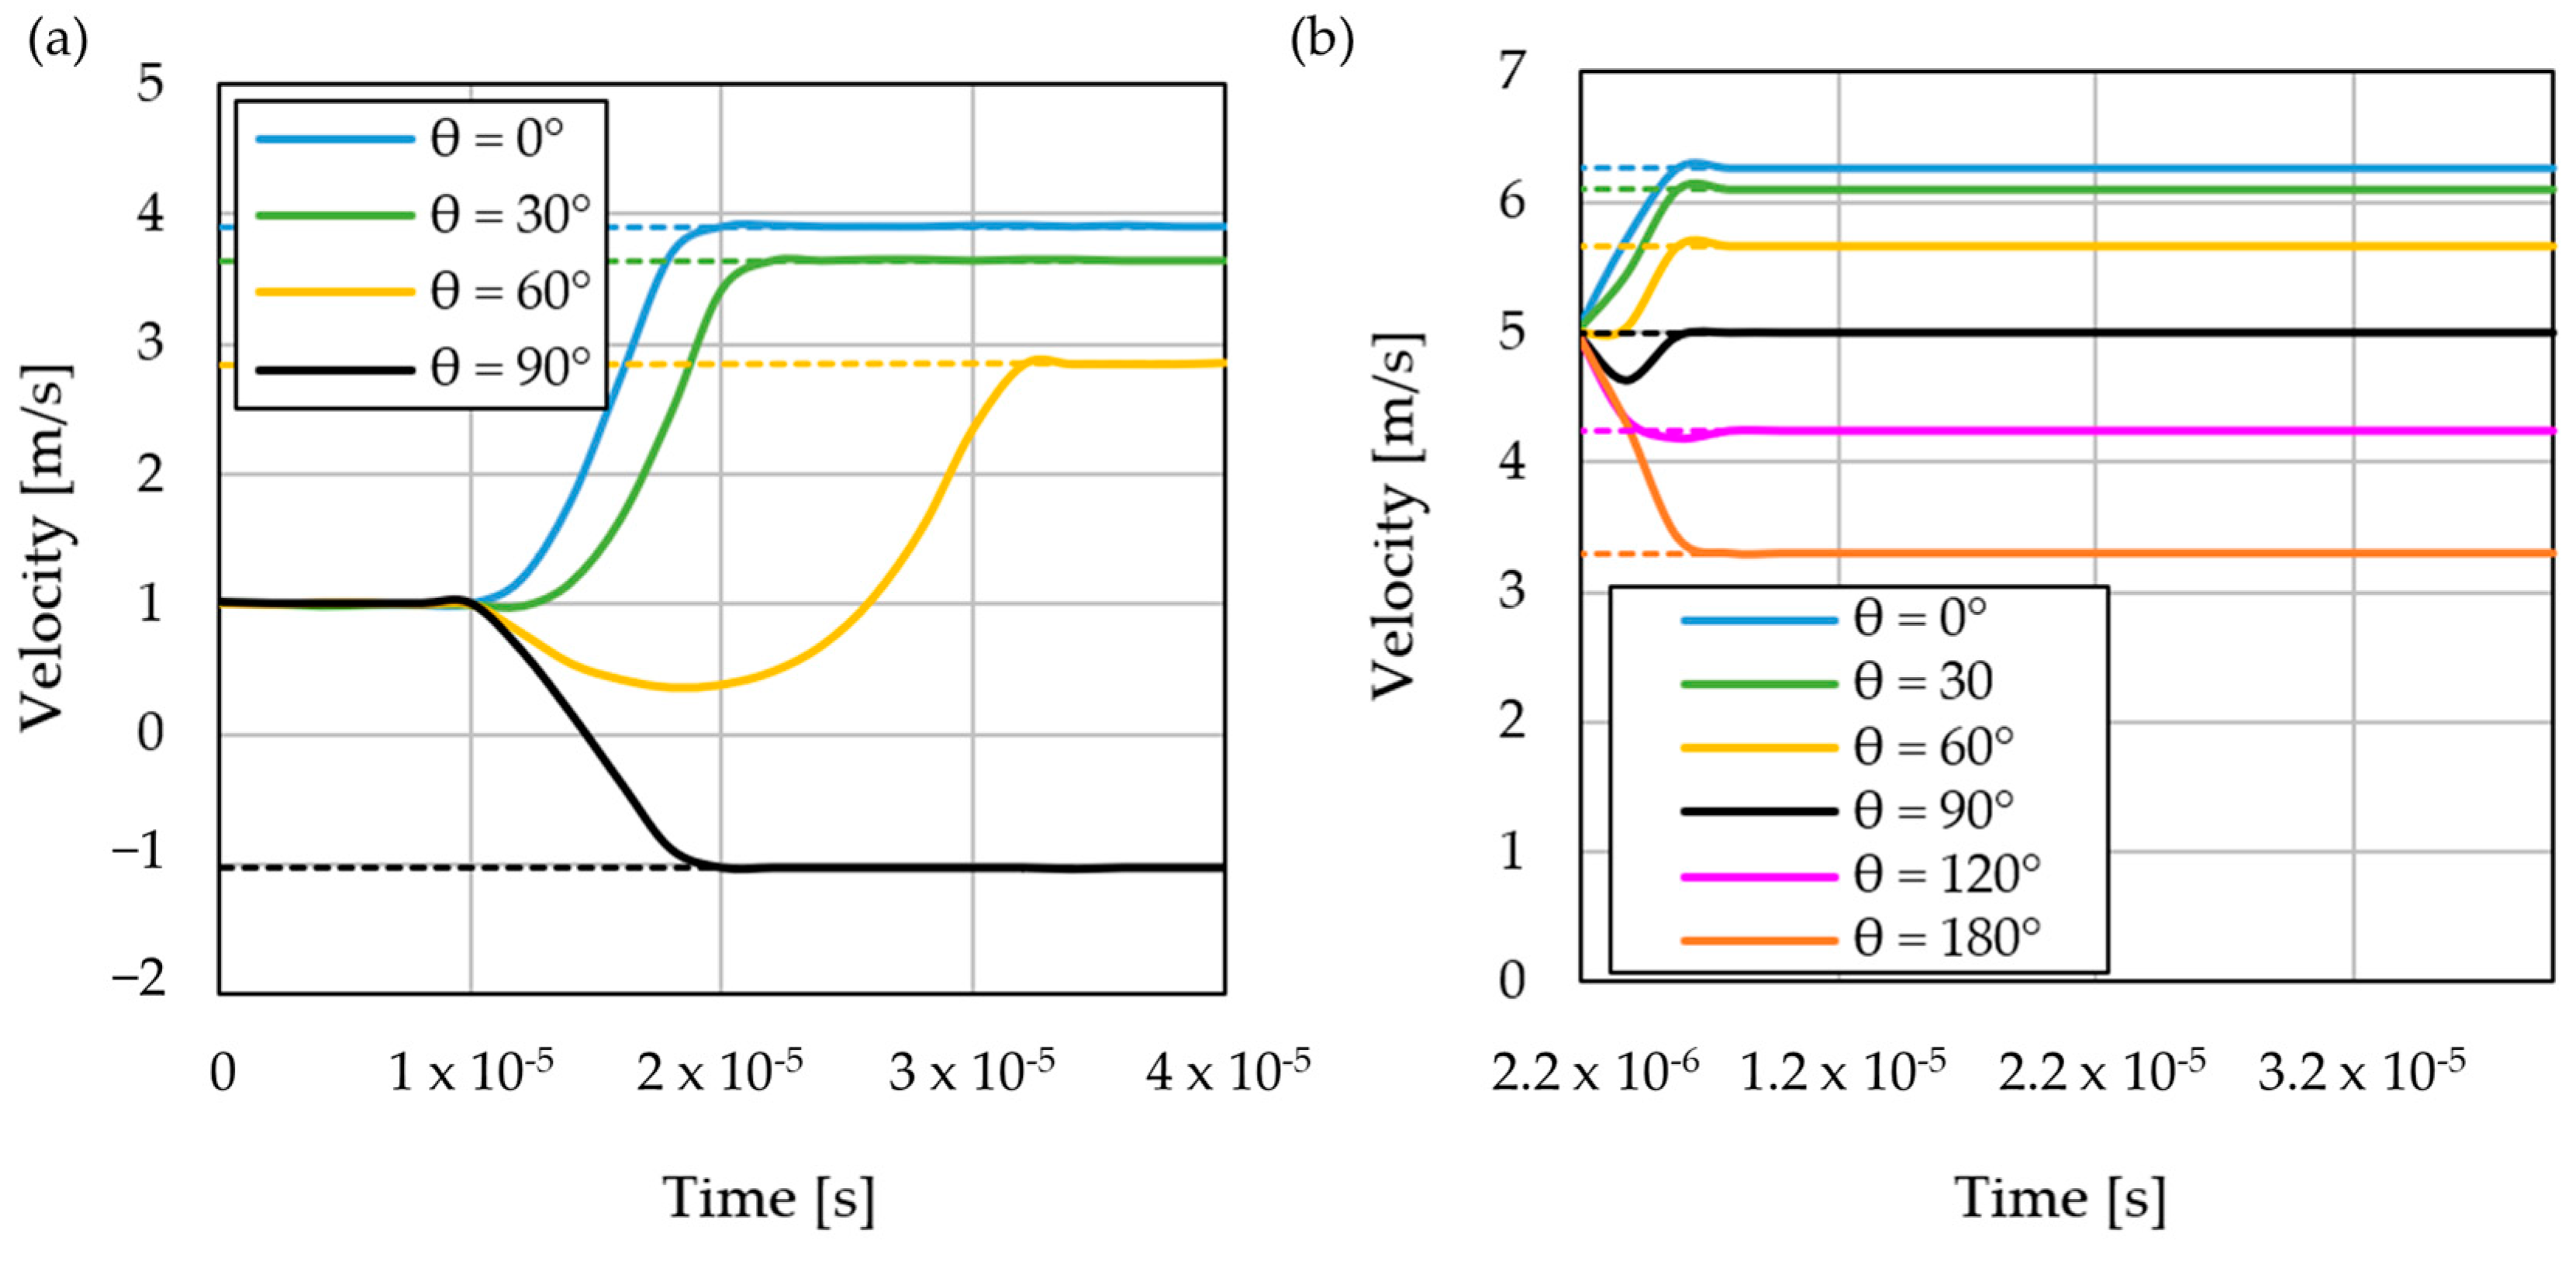
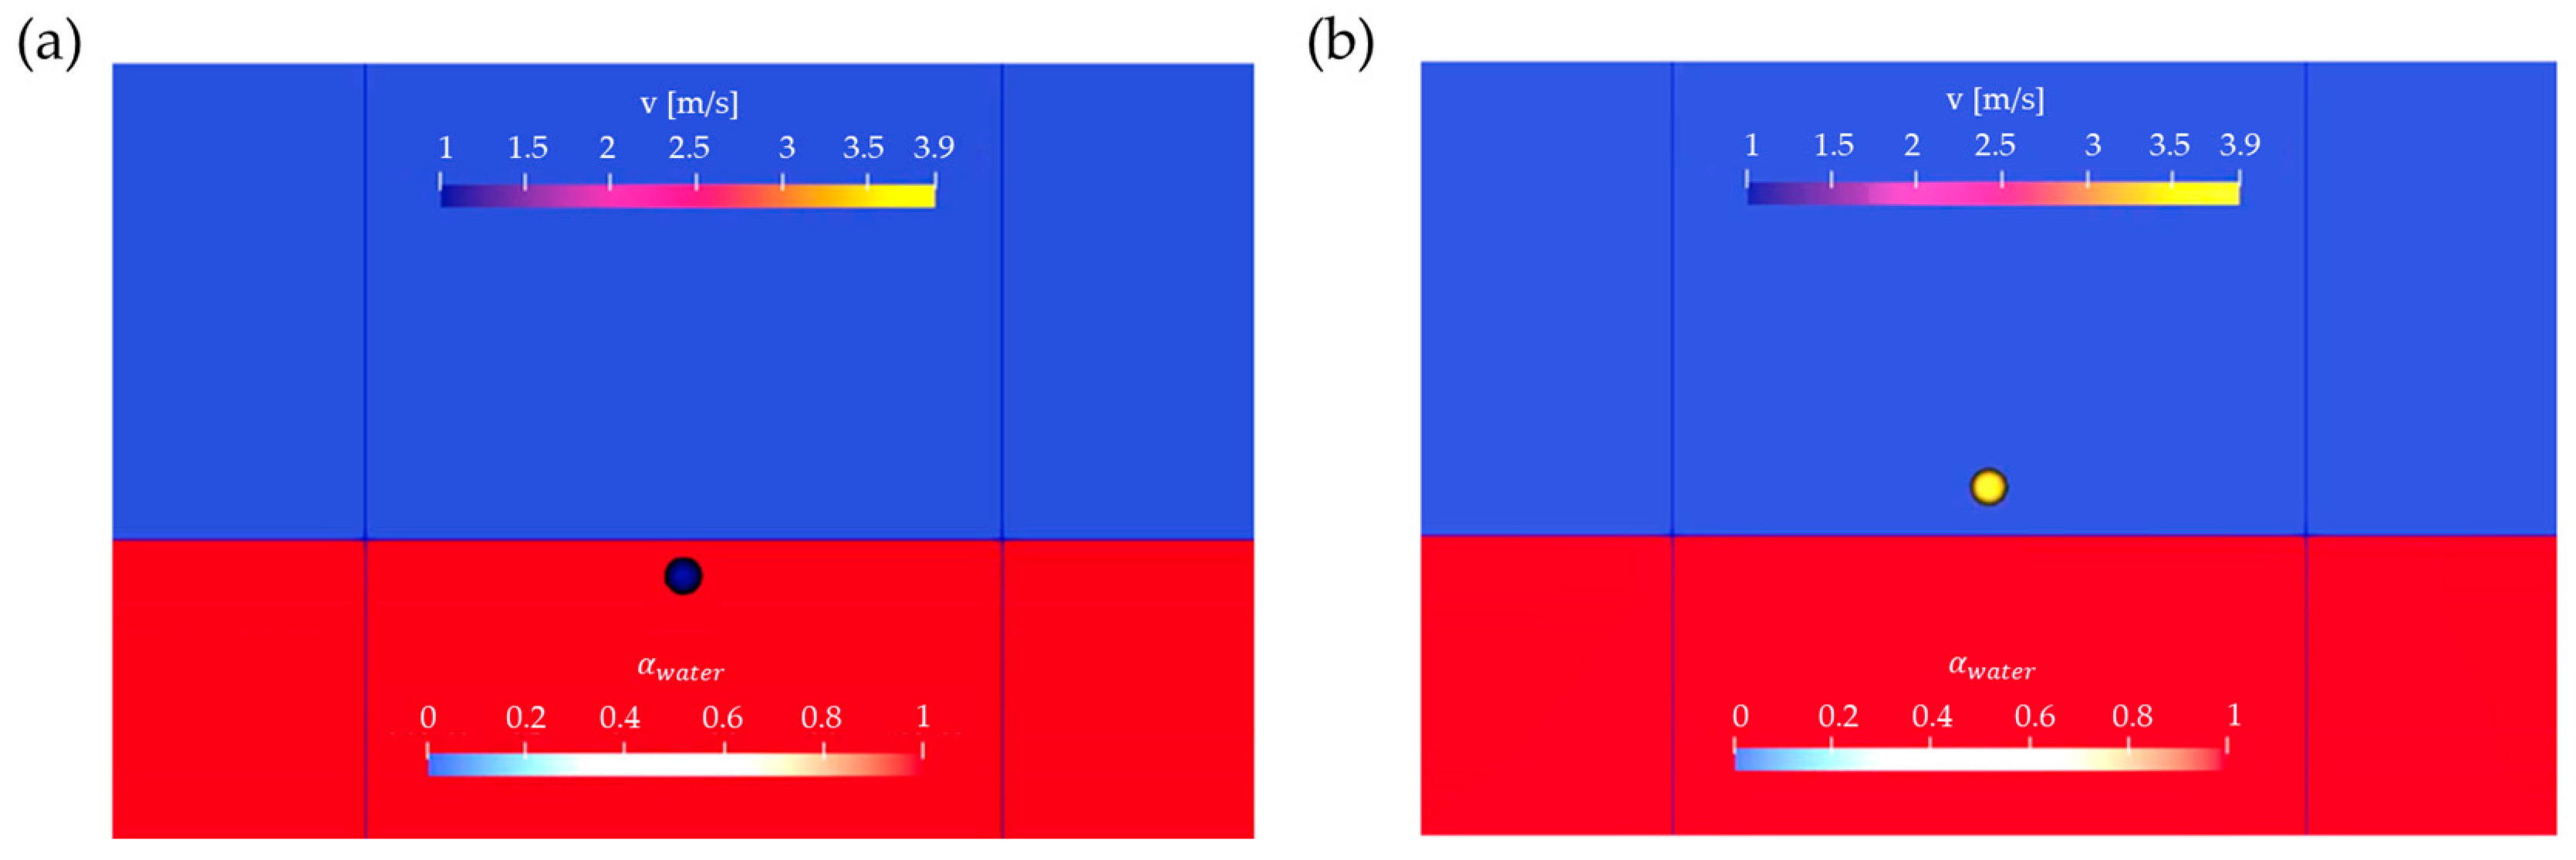
- The CFD-DEM model is thoroughly analyzed for its physical plausibility, and the impact of the main model input parameters has been determined. The internal flow field and the droplet deformation due to the surrounding gas flow show comparable results to analytical and empirical results from the literature.
- (3)
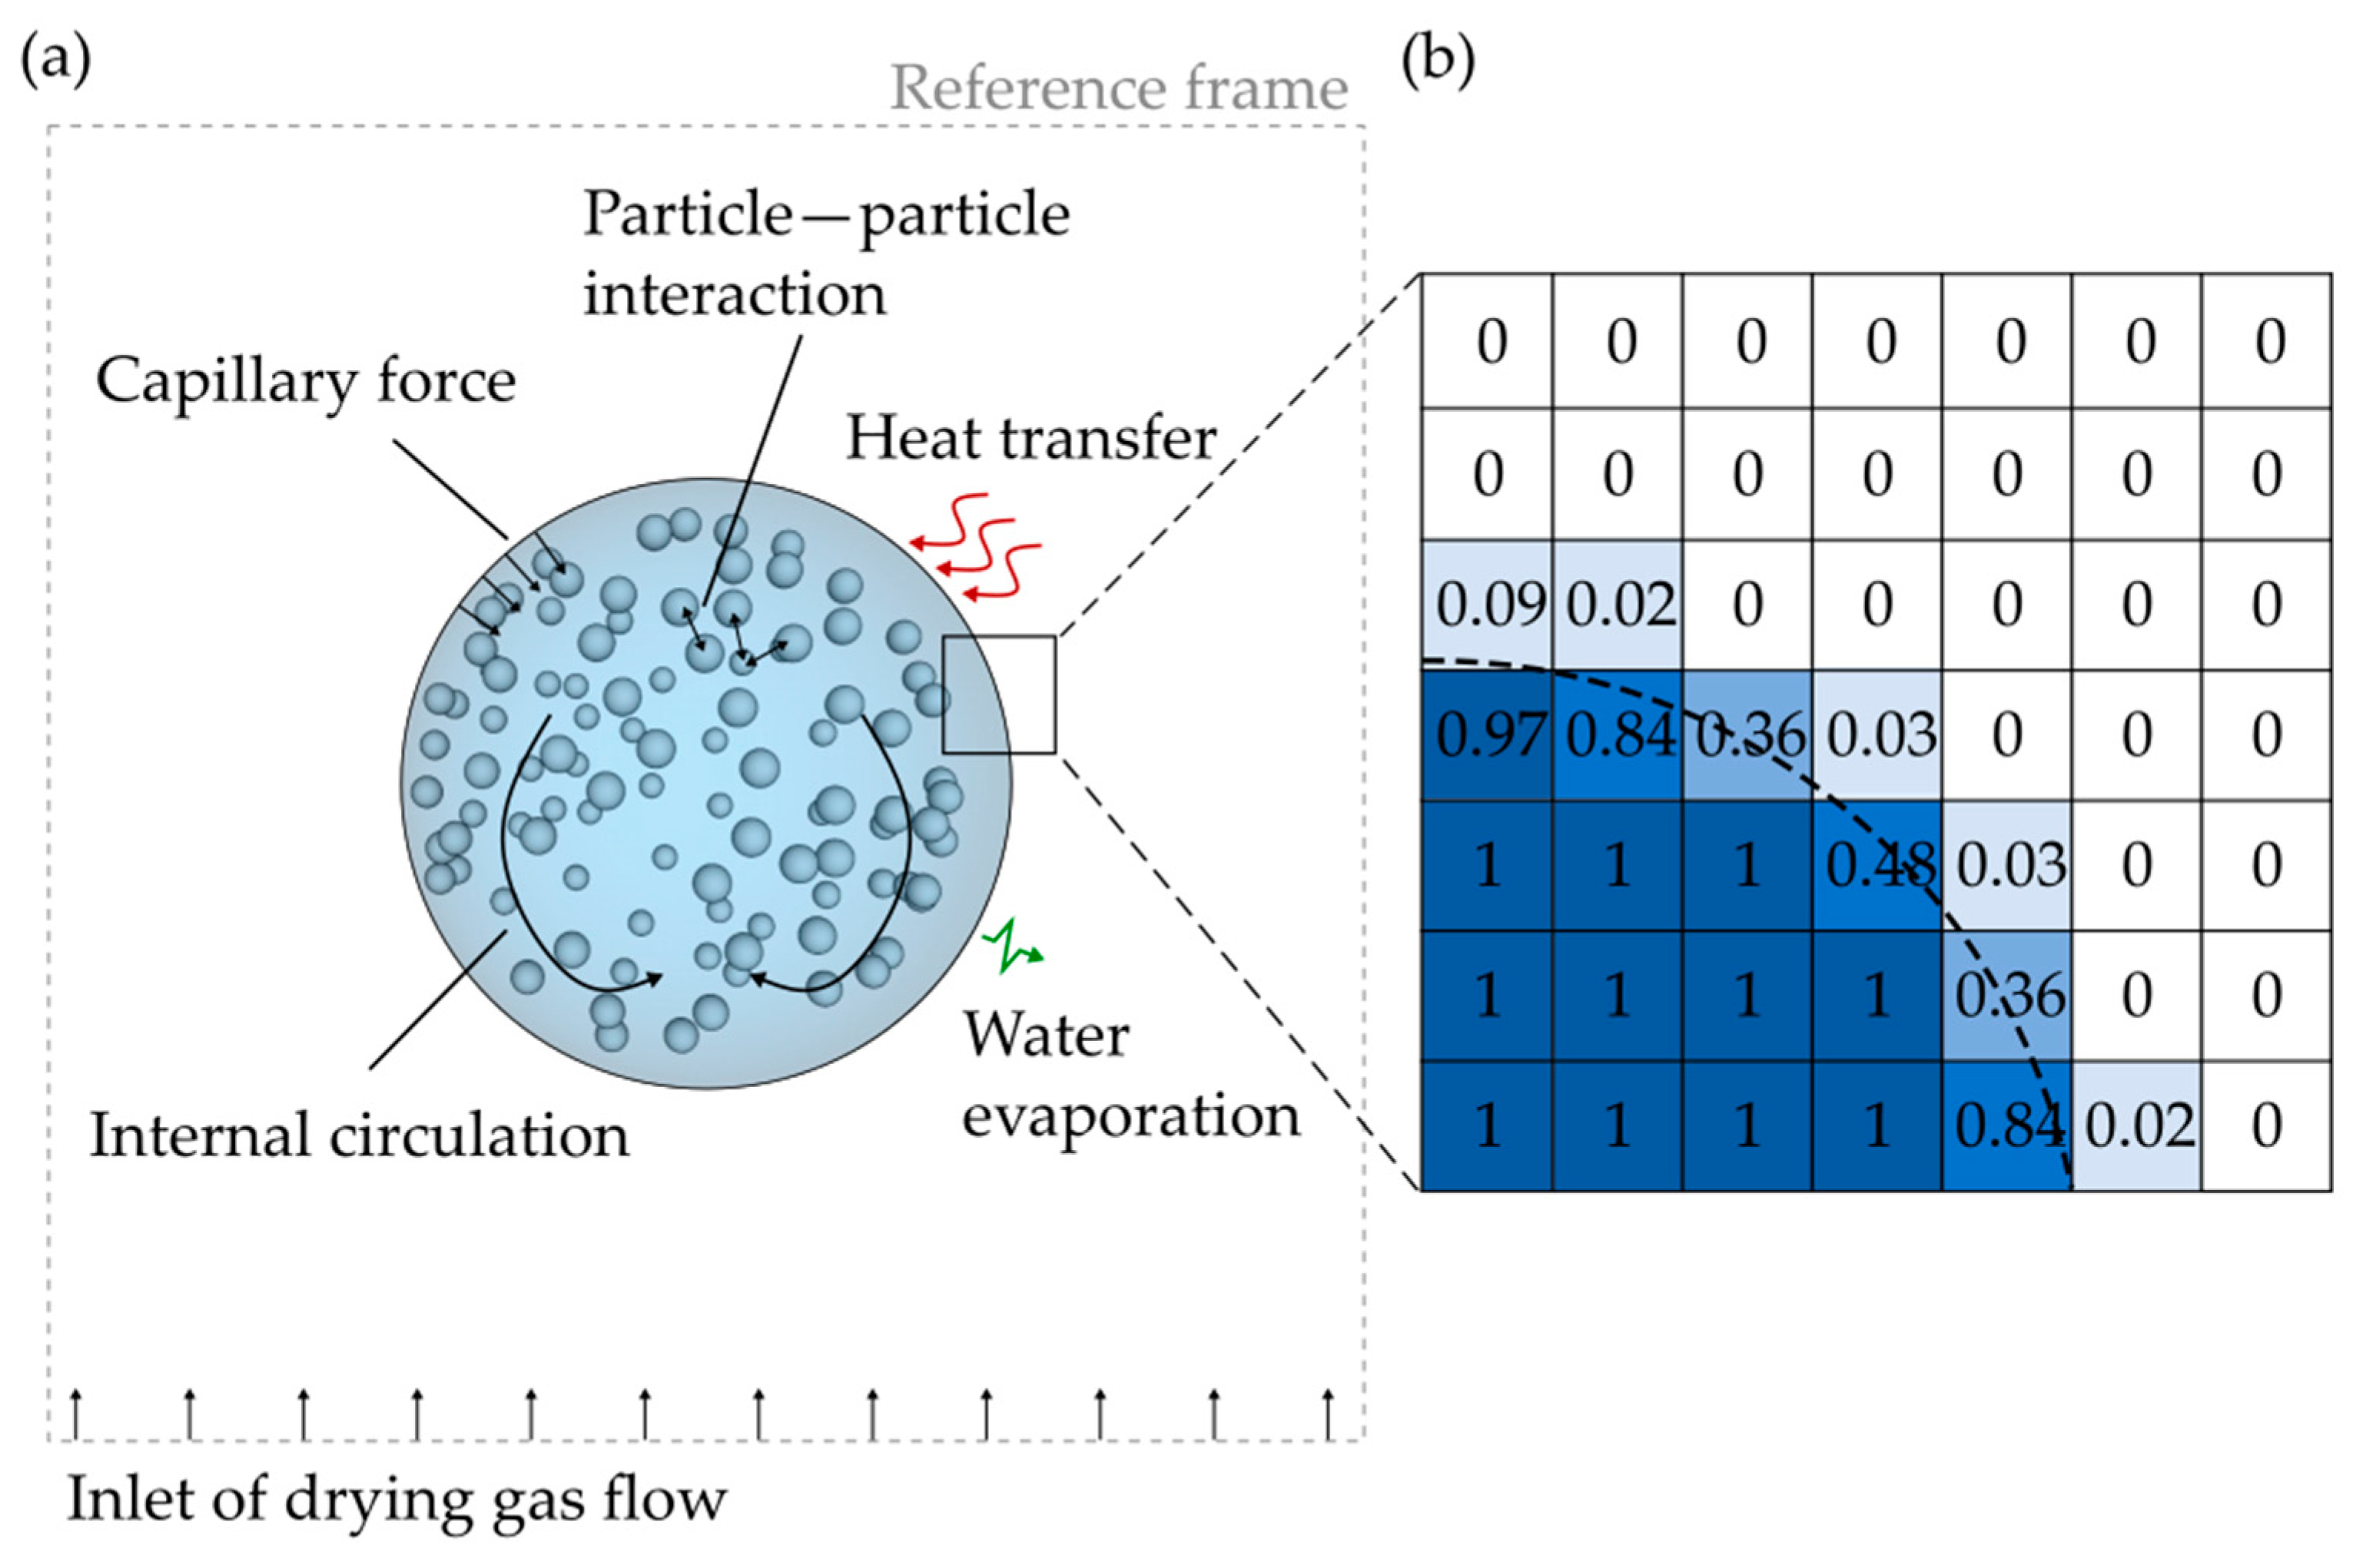
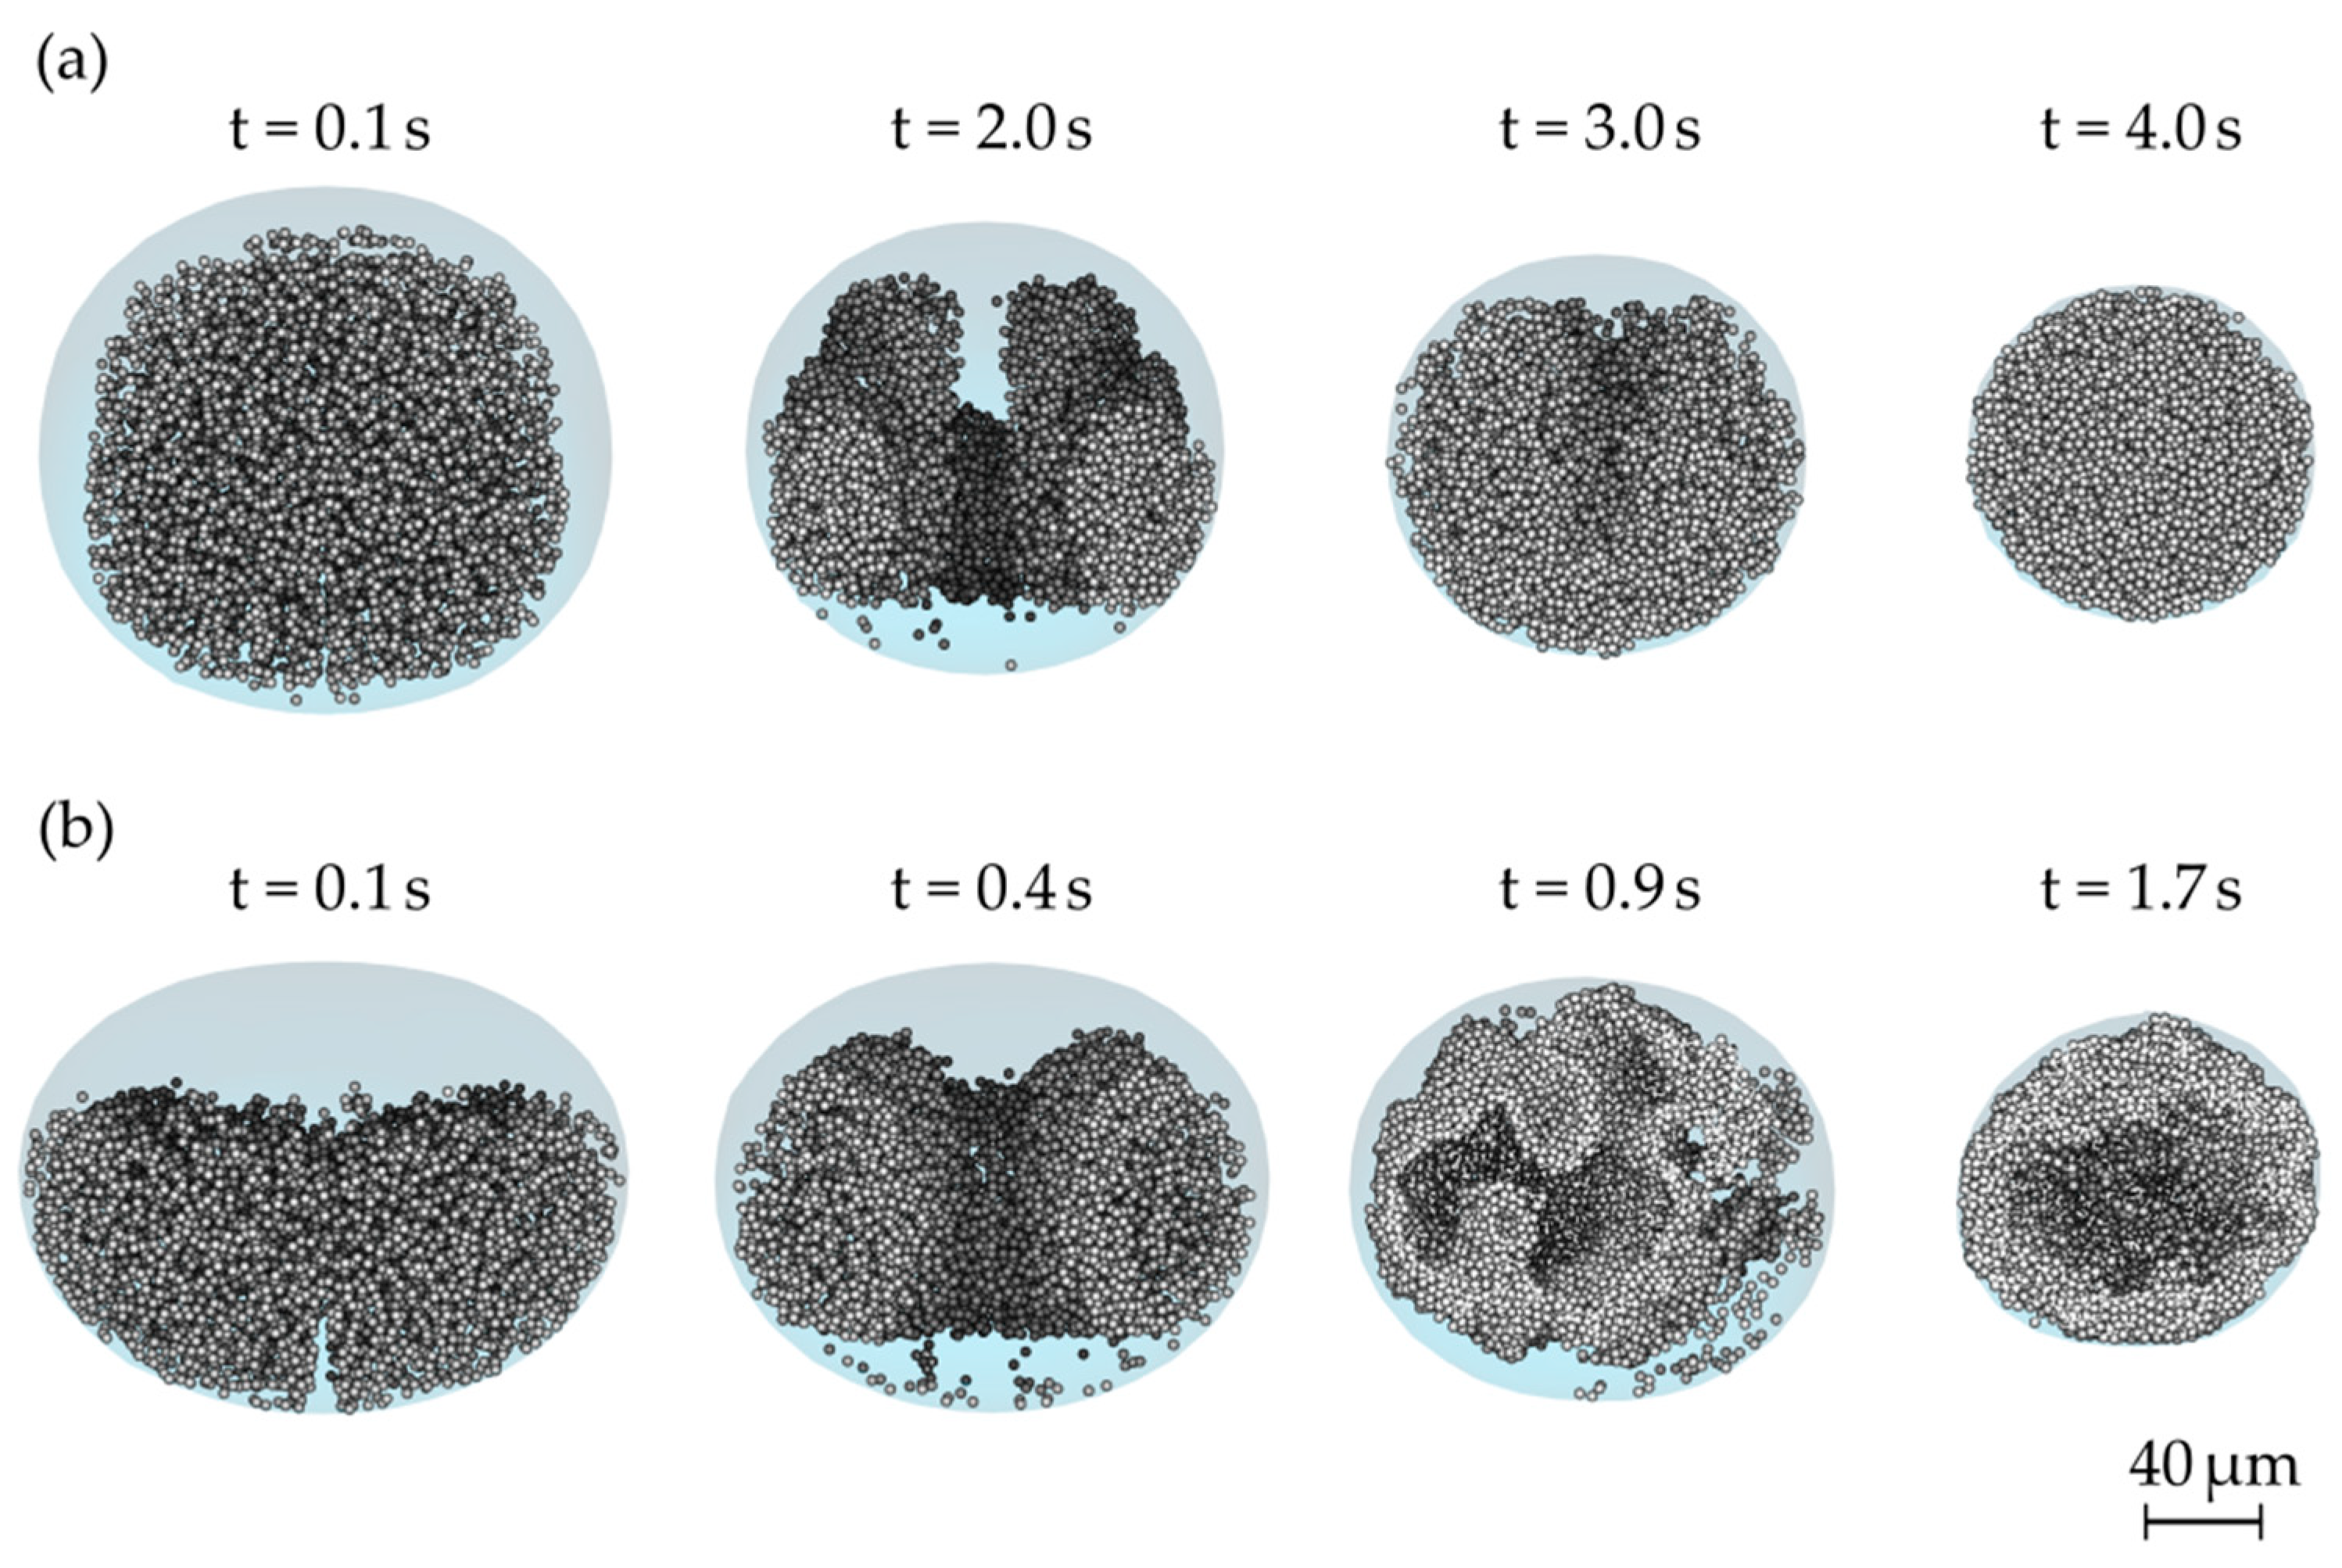
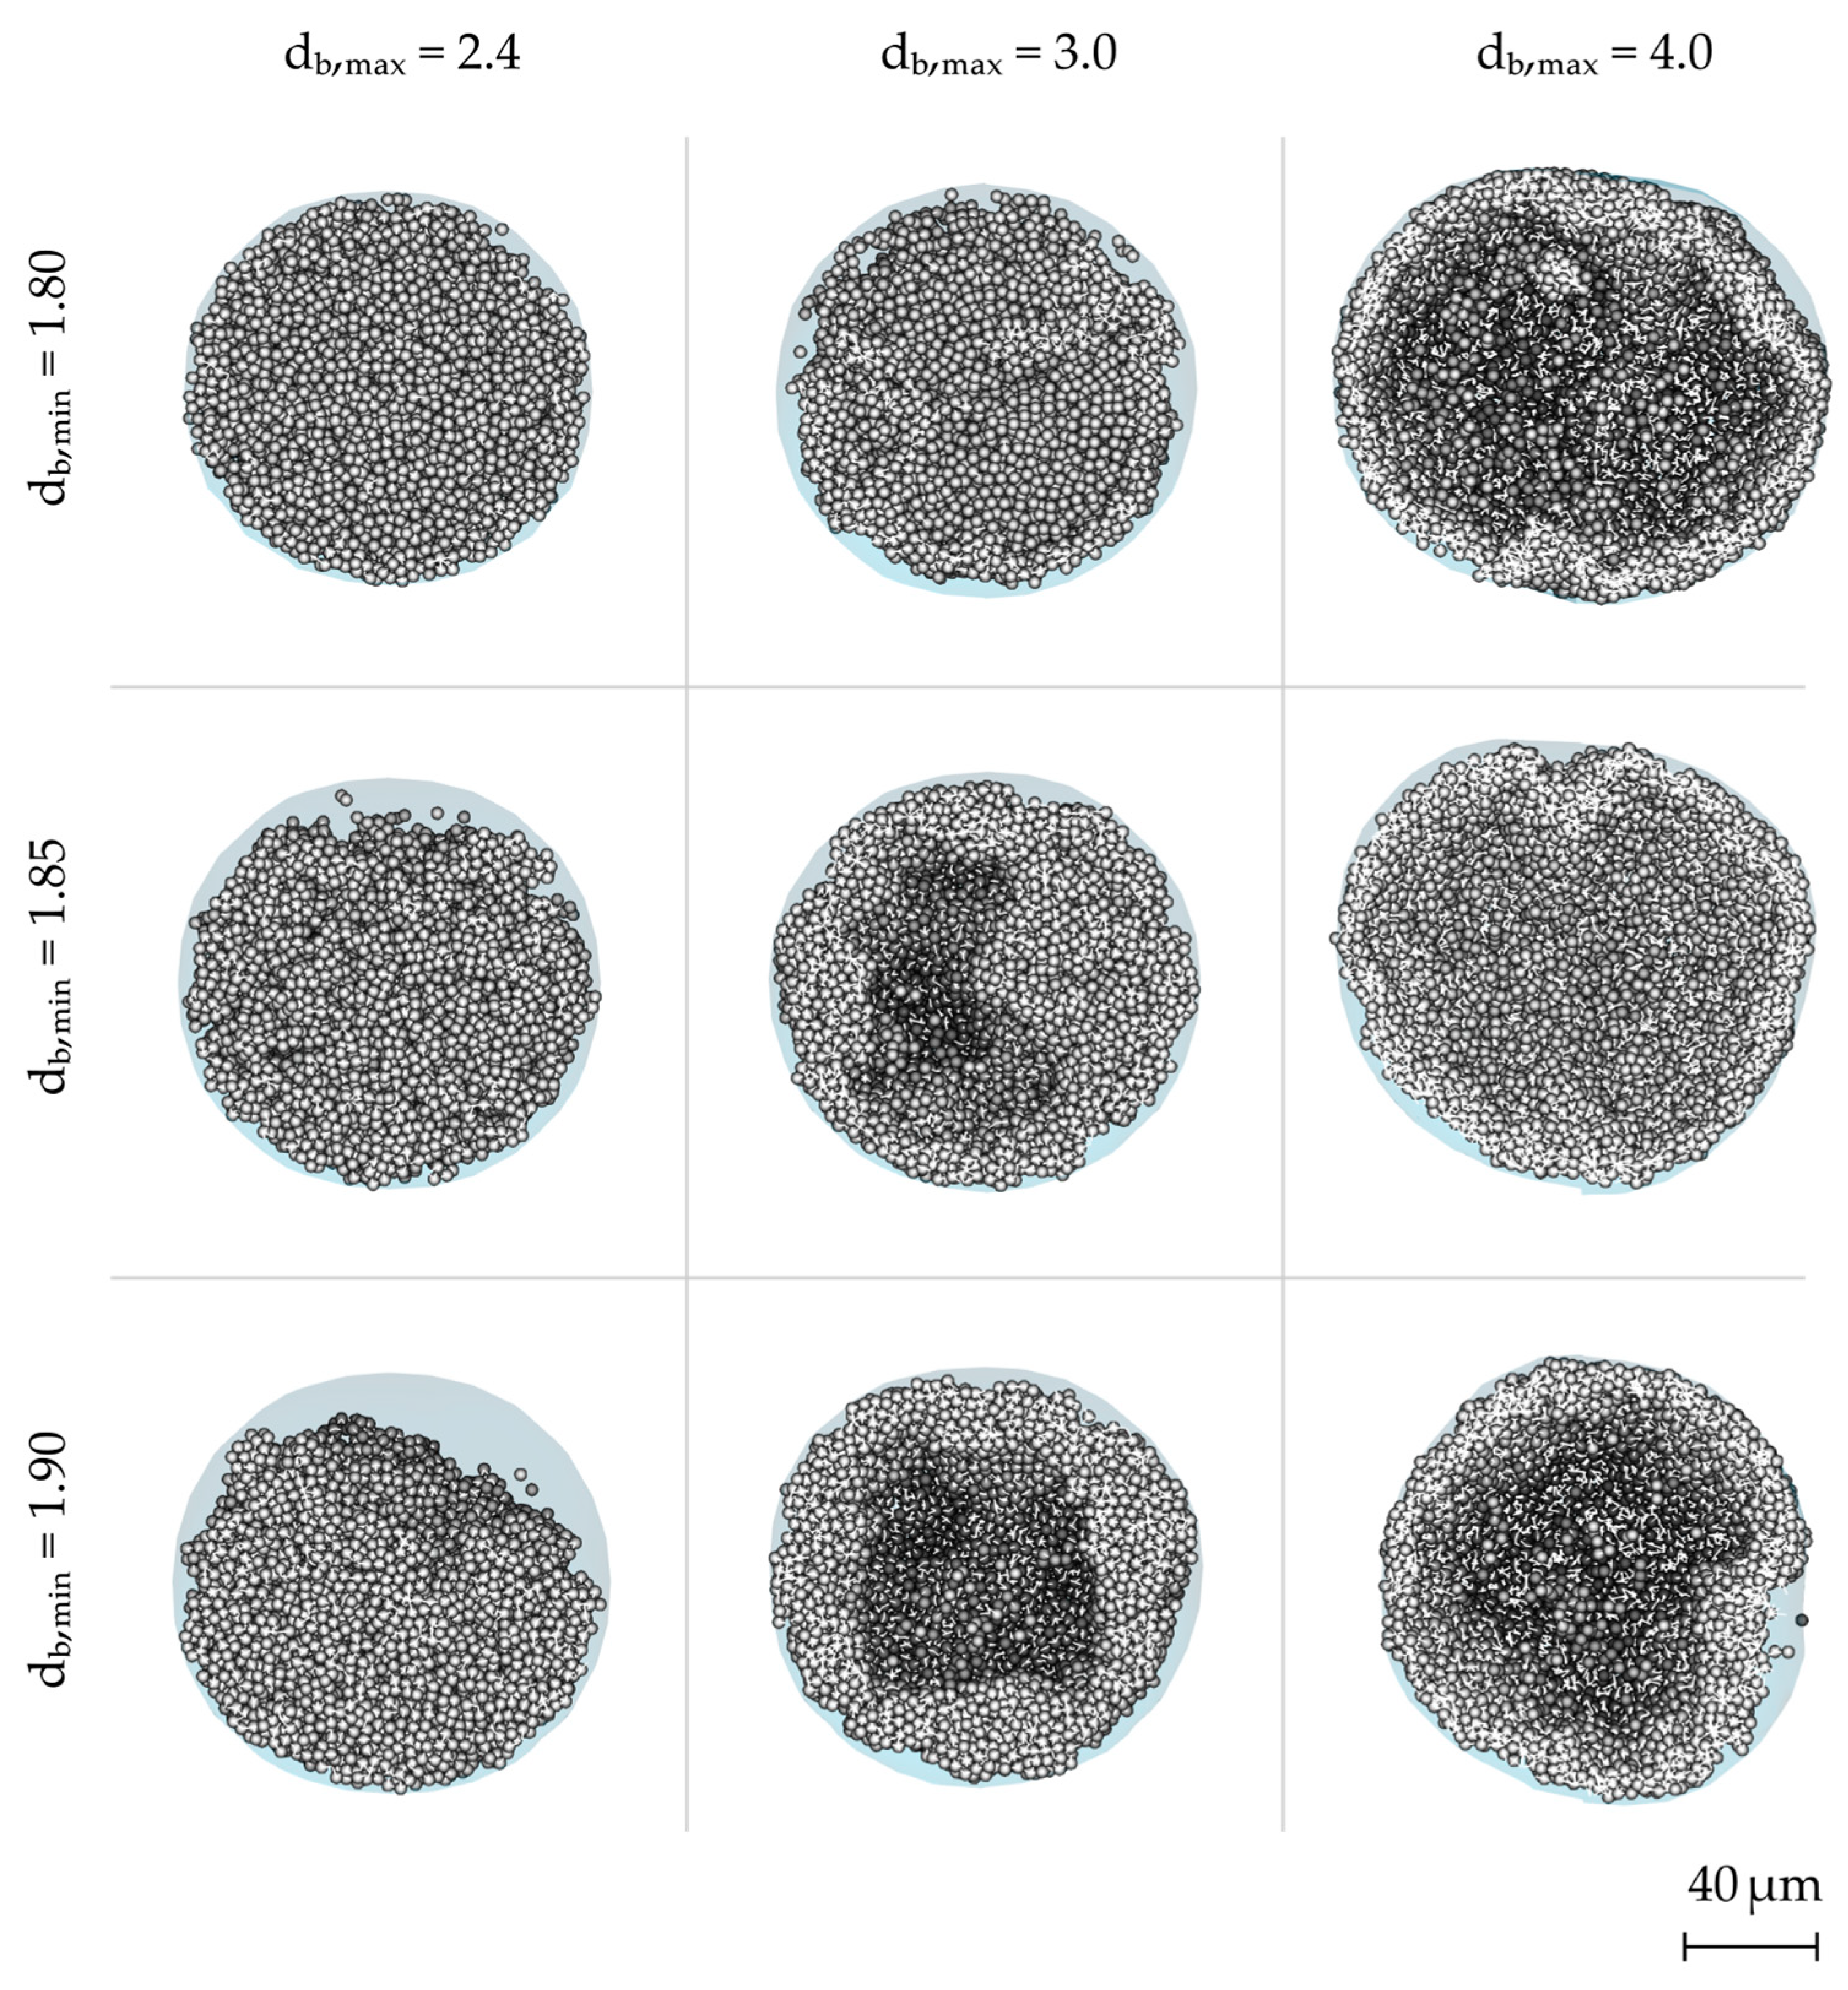
- The droplet simulations illustrate the complex behavior of particle–particle–liquid movement and interactions, which influence the particle formation process.
- (4)
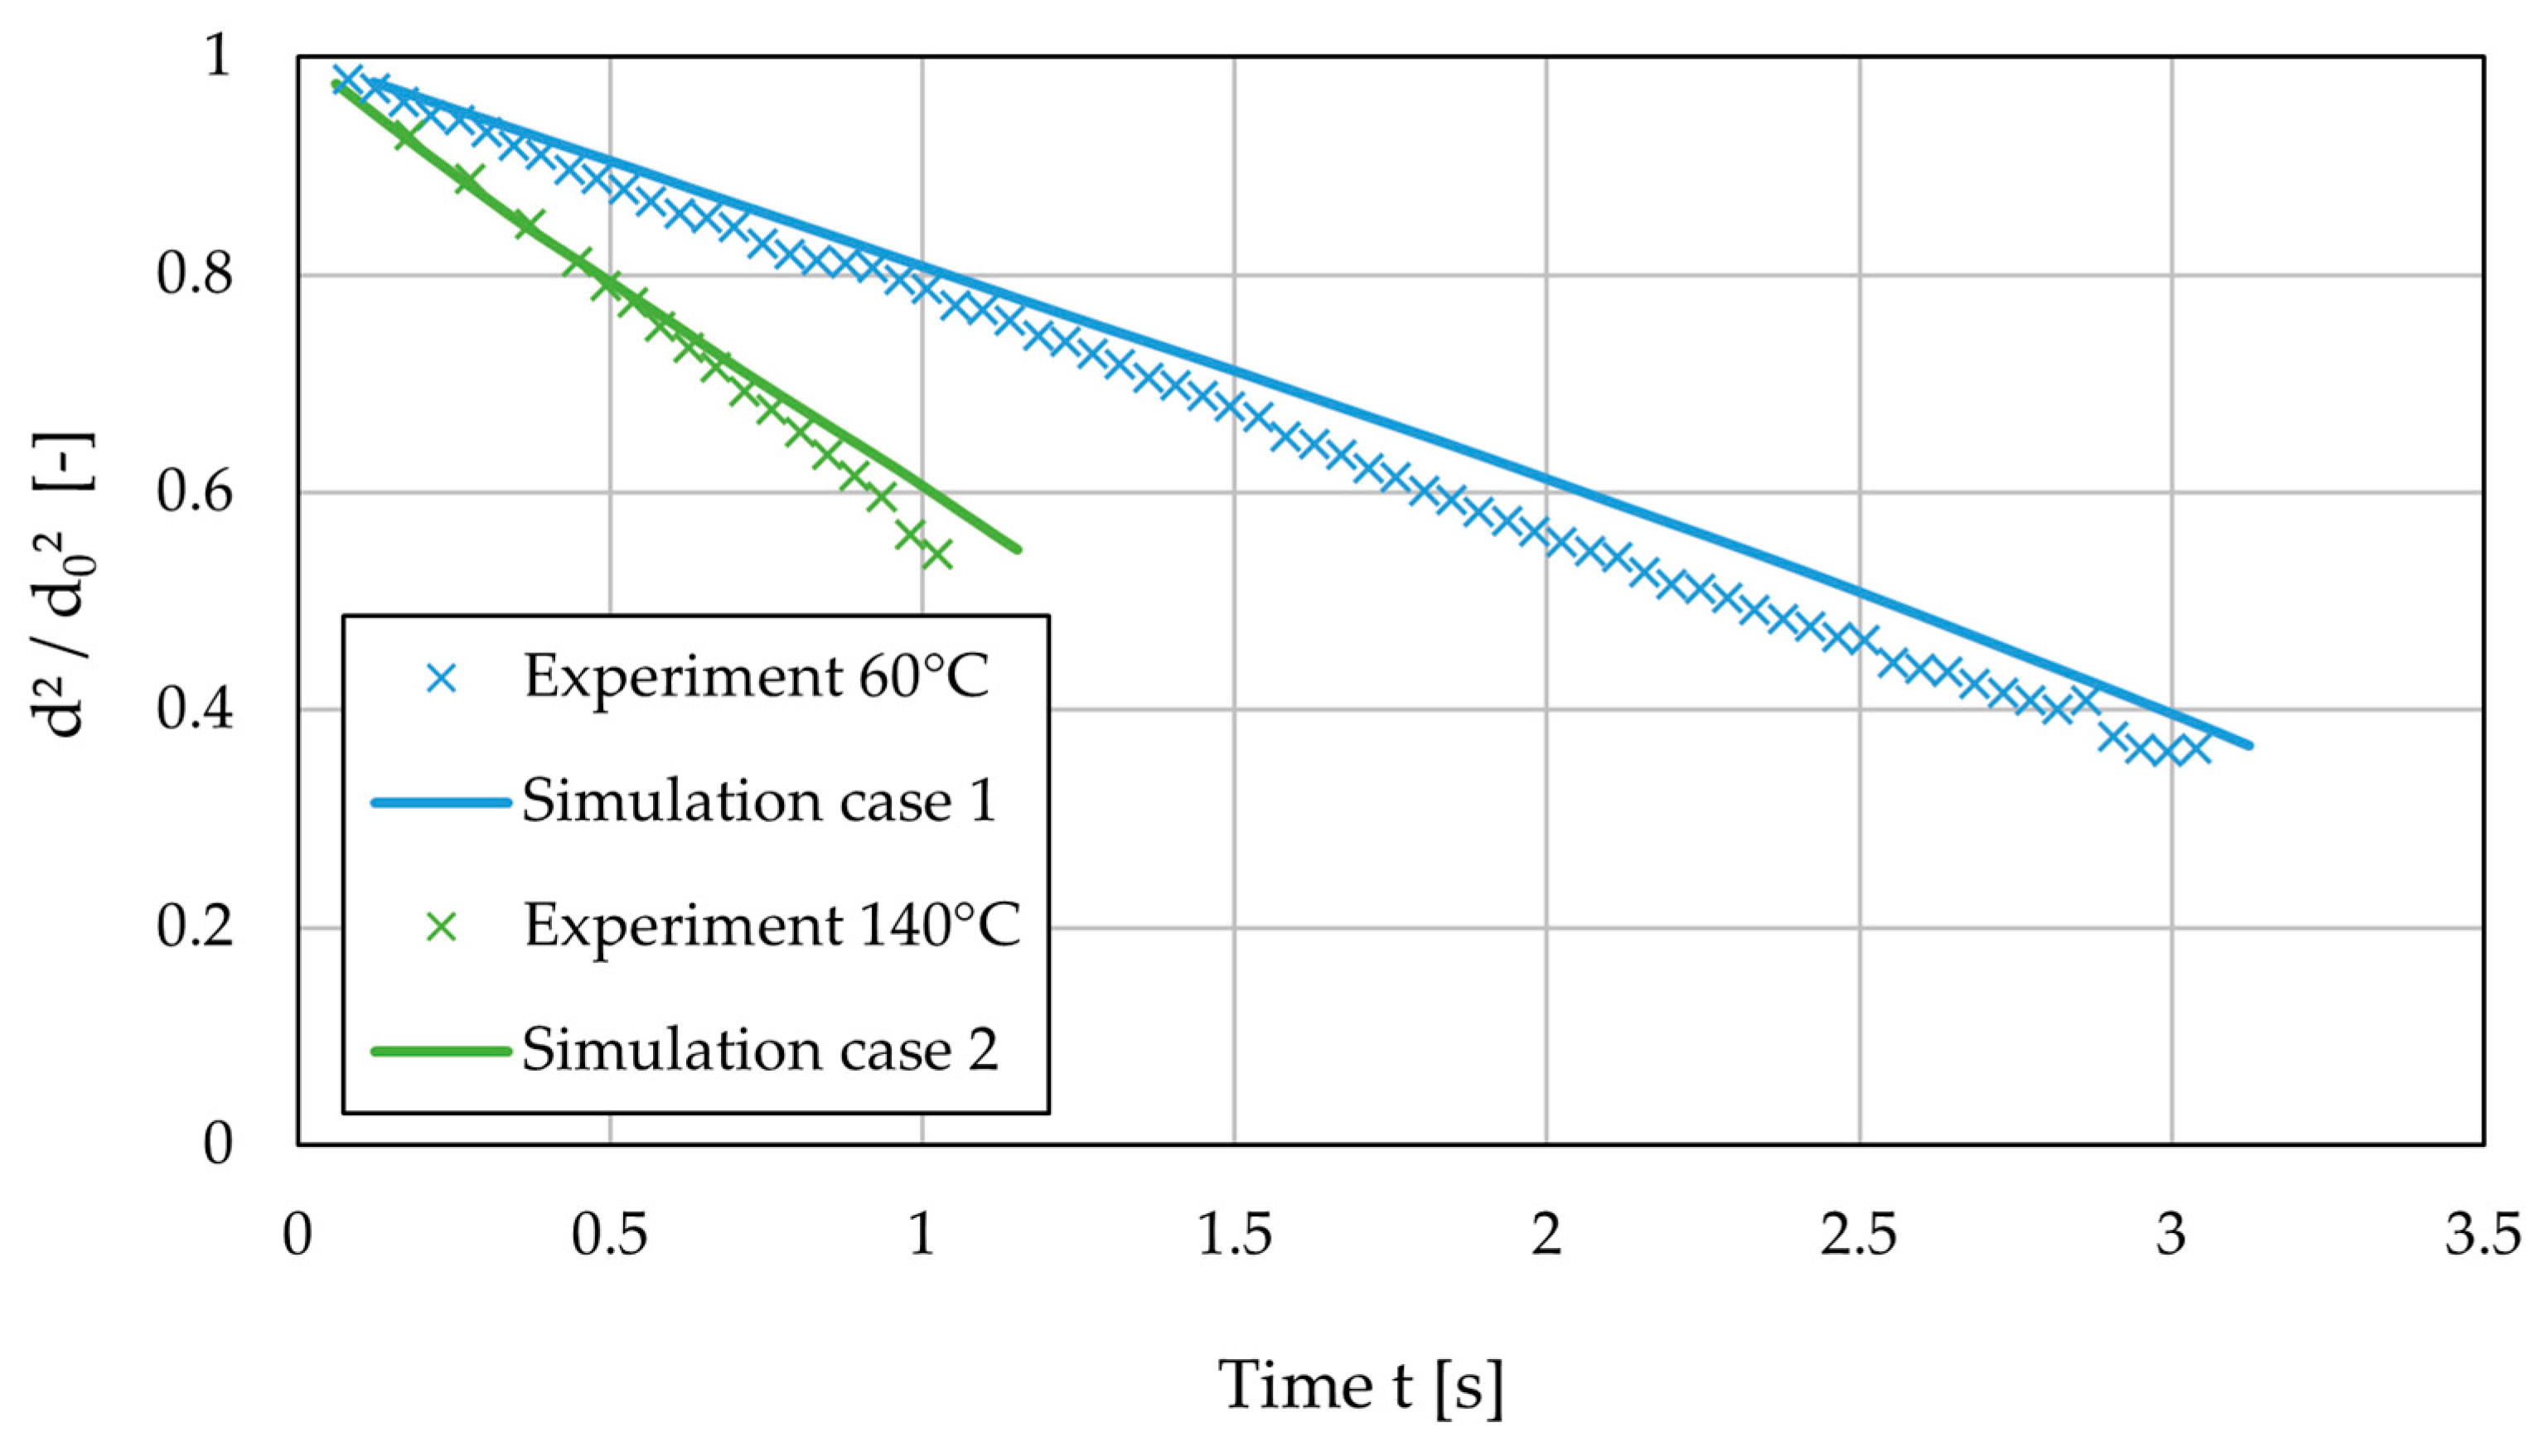
- The results from the droplet-scale simulation show that the morphology of spray dried particles is influenced both by the effective drying conditions and the material properties.
Author Contributions
Funding
Data Availability Statement
Acknowledgments
Conflicts of Interest
Appendix A. Model Verification


Appendix B. Simulation Parameters

| Parameter | Model Analysis (Section 3.1) | Particle Morphologies (Section 3.2) | Drying Rate (Section 3.3) |
|---|---|---|---|
| Boundary/initial conditions | |||
| [m/s] | 0.1 | 0.01 | 0.01 |
| [K] | 360 | 353 | 343 |
| [µm] | 2000 | 200 | 25/40 |
| Material properties | |||
| [kg/m3] | 1000 | 1000 | 1000 |
| [J/(kg K)] | 4186 | 4186 | 4186 |
| [W/(m K)] | 0.6089 | 0.6089 | 0.6089 |
| [N/m] | 1 × 10⁻⁵ | 0.07 | 0.07 |
| [kg/m3] | 1 | 1 | 1 |
| [J/(kg K)] | 1852 | 1852 | 1852 |
| [W/(m K)] | 0.04353 | 0.04353 | 0.04353 |
| [kJ/kg] | 2256 | 2256 | 2256 |
| [µm] | 10 | 4 | 1 |
| [Pa] | 5 × 10⁶ | 5 × 10⁵ | 1 × 10⁷ |
| [-] | 0.45 | 0.45 | 0.45 |
| Numerical Parameters | |||
| [s] | 1 × 10⁻³ | 5 × 10⁻⁶ | 2.5 × 10⁻⁷ |
| [s] | 1 × 10⁻⁵ | 2.5 × 10⁻⁷ | 2.5 × 10⁻⁹ |
| [-] | 2000 | 11,400 | 1420/5820 |
| [kg/(K s)] | −1 × 10⁻¹⁰ | −1 × 10⁻¹⁴ | −5 × 10⁻¹⁶/−2 × 10−15/−4 × 10−15 |
References
- Tsotsas, E. Multiscale Approaches to Processes That Combine Drying with Particle Formation. Dry. Technol. 2015, 33, 1859–1871. [Google Scholar] [CrossRef]
- Mezhericher, M.; Levy, A.; Borde, I. Theoretical Models of Single Droplet Drying Kinetics: A Review. Dry. Technol. 2010, 28, 278–293. [Google Scholar] [CrossRef]
- Law, C.K. Recent advances in droplet vaporization and combustion. Prog. Energy Combust. Sci. 1982, 8, 171–201. [Google Scholar] [CrossRef]
- Na, K.; Choi, M.; Ryoo, R. Recent advances in the synthesis of hierarchically nanoporous zeolites. Microporous Mesoporous Mater. 2013, 166, 3–19. [Google Scholar] [CrossRef]
- Sosnik, A.; Seremeta, K.P. Advantages and challenges of the spray-drying technology for the production of pure drug particles and drug-loaded polymeric carriers. Adv. Colloid Interface Sci. 2015, 223, 40–54. [Google Scholar] [CrossRef] [PubMed]
- Kloss, C.; Goniva, C.; Hager, A.; Amberger, S.; Pirker, S. Models, Algorithms and Validation for Opensource DEM and CFD-DEM. Prog. Comput. Fluid Dyn. Int. J. 2012, 12, 140. [Google Scholar] [CrossRef]
- Zhu, H.P.; Zhou, Z.Y.; Yang, R.Y.; Yu, A.B. Discrete Particle Simulation of Particulate Systems: Theoretical Developments. Chem. Eng. Sci. 2007, 62, 3378–3396. [Google Scholar] [CrossRef]
- Zhu, H.P.; Zhou, Z.Y.; Yang, R.Y.; Yu, A.B. Discrete Particle Simulation of Particulate Systems: A Review of Major Applications and Findings. Chem. Eng. Sci. 2008, 63, 5728–5770. [Google Scholar] [CrossRef]
- El-Emam, M.A.; Zhou, L.; Shi, W.; Han, C.; Bai, L.; Agarwal, R. Theories and applications of CFD–DEM coupling approach for granular flow: A review. Arch. Comput. Methods Eng. 2021, 28, 4979–5020. [Google Scholar] [CrossRef]
- Golshan, S.; Sotudeh-Gharebagh, R.; Zarghami, R.; Mostoufi, N.; Blais, B.; Kuipers, J.A.M. Review and Implementation of CFD-DEM Applied to Chemical Process Systems. Chem. Eng. Sci. 2020, 221, 115646. [Google Scholar] [CrossRef]
- Breinlinger, T.; Hashibon, A.; Kraft, T. Simulation of the Influence of Surface Tension on Granule Morphology during Spray Drying Using a Simple Capillary Force Model. Powder Technol. 2015, 283, 1–8. [Google Scholar] [CrossRef]
- Breinlinger, T.; Hashibon, A.; Kraft, T. Simulation of the Spray Drying of Single Granules: The Correlation Between Microscopic Forces and Granule Morphology. J. Am. Ceram. Soc. 2015, 98, 1778–1786. [Google Scholar] [CrossRef]
- Nishiura, D.; Shimosaka, A.; Shirakawa, Y.; Hidaka, J. Simulation of Drying of Particulate Suspensions in Spray-Drying Granulation Process. J. Chem. Eng. Jpn. 2010, 43, 641–649. [Google Scholar] [CrossRef]
- Yabe, T.; Xiao, F.; Utsumi, T. The Constrained Interpolation Profile Method for Multiphase Analysis. J. Comput. Phys. 2001, 169, 556–593. [Google Scholar] [CrossRef]
- Miyazaki, S.; Nishiura, D.; Shimosaka, A.; Shirakawa, Y.; Hidaka, J. Revealing the Formation Mechanism of Granules by Drying Simulation of Slurry Droplet. Adv. Powder Technol. 2011, 22, 93–101. [Google Scholar] [CrossRef]
- Washino, K.; Tan, H.S.; Hounslow, M.J.; Salman, A.D. A New Capillary Force Model Implemented in Micro-Scale CFD–DEM Coupling for Wet Granulation. Chem. Eng. Sci. 2013, 93, 197–205. [Google Scholar] [CrossRef]
- OpenCFD Ltd. OpenFOAM—The Open Source CFD Toolbox. 2009. Available online: http://www.openfoam.com (accessed on 20 January 2024).
- Xie, Y.; Chen, Y.; Fang, Z.; Zhou, H.; Wei, S.; Yang, L. The research of gas-solid fluidized bed bubbling behavior based on CFD-DEM coupled simulation. Chem. Eng. Res. Des. 2023, 195, 166–180. [Google Scholar] [CrossRef]
- Buchholz, M. Towards a Multiscale Model-Based Design of Spray Drying Processes; Granulation; Number 23 in SPE-Schriftenreihe; Cuvillier Verlag: Göttingen, Germany, 2023. [Google Scholar]
- Buchholz, M.; Haus, J.; Pietsch-Braune, S.; Kleine Jäger, F.; Heinrich, S. CFD-Aided Population Balance Modeling of a Spray Drying Process. Adv. Powder Technol. 2022, 33, 103636. [Google Scholar] [CrossRef]
- Zhou, Z.Y.; Kuang, S.B.; Chu, K.W.; Yu, A.B. Discrete particle simulation of particle–fluid flow: Model formulations and their applicability. J. Fluid Mech. 2010, 661, 482–510. [Google Scholar] [CrossRef]
- Gopala, V.R.; van Wachem, B.G.M. Volume of fluid methods for immiscible-fluid and free-surface flows. J. Chem. Eng. 2008, 141, 204–221. [Google Scholar] [CrossRef]
- Koch, D.L.; Hill, R.J. Inertial Effects in Suspension and Porous-Media Flows. Annu. Rev. Fluid Mech. 2001, 33, 619–647. [Google Scholar] [CrossRef]
- Cundall, P.A.; Strack, O.D.L. A Discrete Numerical Model for Granular Assemblies. Géotechnique 1979, 29, 47–65. [Google Scholar] [CrossRef]
- Di Renzo, A.; Di Maio, F.P. Comparison of Contact-Force Models for the Simulation of Collisions in DEM-Based Granular Flow Codes. Chem. Eng. Sci. 2004, 59, 525–541. [Google Scholar] [CrossRef]
- Pöschel, T.; Schwager, T. Computational Granular Dynamics; Springer: Berlin/Heidelberg, Germany, 2005. [Google Scholar]
- Liggghts® Open Source Discrete Element Method Particle Simulation Code. Available online: https://www.cfdem.com/liggghts-open-source-discrete-element-method-particle-simulation-code (accessed on 20 January 2024).
- Potyondy, D.O.; Cundall, P.A. A bonded-particle model for rock. Int. J. Rock Mech. Min. Sci. 2004, 41, 1329–1364. [Google Scholar] [CrossRef]
- Tuckermann, R.; Bauerecker, S.; Neidhart, B. Evaporation Rates of Alkanes and Alkanols from Acoustically Levitated Drops. Anal. Bioanal. Chem. 2002, 372, 122–127. [Google Scholar] [CrossRef]
- Buchholz, M.; Haus, J.; Polt, F.; Pietsch, S.; Schönherr, M.; Kleine Jäger, F.; Heinrich, S. Dynamic Model Development Based on Experimental Investigations of Acoustically Levitated Suspension Droplets. Int. J. Heat Mass Transf. 2021, 171, 121057. [Google Scholar] [CrossRef]
- Kallendorf, C.; Fath, A.; Oberlack, M.; Wang, Y. Exact Solutions to the Interfacial Surfactant Transport Equation on a Droplet in a Stokes Flow Regime. Phys. Fluids 2015, 27, 082104. [Google Scholar] [CrossRef]
- Rybczynski, W. On the Translatory Motion of a Fluid Sphere in a Viscous Medium. Bull. Acad. Sci. Crac. Ser. A 1911, 40, 33–78. [Google Scholar]
- Hsiang, L.-P.; Faeth, G.M. Near-Limit Drop Deformation and Secondary Breakup. Int. J. Multiph. Flow 1992, 18, 635–652. [Google Scholar] [CrossRef]
- Walton, D.E.; Mumford, C.J. Spray Dried Products—Characterization of Particle Morphology. Chem. Eng. Res. Des. 1999, 77, 21–38. [Google Scholar] [CrossRef]
- Mondragon, R.; Julia, J.E.; Barba, A.; Jarque, J.C. Microstructure and mechanical properties of grains of silica nanofluids dried in an acoustic levitator. J. Eur. Ceram. Soc. 2012, 32, 4295–4304. [Google Scholar] [CrossRef]
- Vehring, R.; Foss, W.R.; Lechuga-Ballesteros, D. Particle formation in spray drying. J. Aerosol Sci. 2007, 38, 728–746. [Google Scholar] [CrossRef]


Disclaimer/Publisher’s Note: The statements, opinions and data contained in all publications are solely those of the individual author(s) and contributor(s) and not of MDPI and/or the editor(s). MDPI and/or the editor(s) disclaim responsibility for any injury to people or property resulting from any ideas, methods, instructions or products referred to in the content. |
© 2024 by the authors. Licensee MDPI, Basel, Switzerland. This article is an open access article distributed under the terms and conditions of the Creative Commons Attribution (CC BY) license (https://creativecommons.org/licenses/by/4.0/).
Share and Cite
Buchholz, M.; Weis, D.; Togni, R.; Goniva, C.; Heinrich, S. Describing the Drying and Solidification Behavior of Single Suspension Droplets Using a Novel Unresolved CFD-DEM Simulation Approach. Processes 2024, 12, 480. https://doi.org/10.3390/pr12030480
Buchholz M, Weis D, Togni R, Goniva C, Heinrich S. Describing the Drying and Solidification Behavior of Single Suspension Droplets Using a Novel Unresolved CFD-DEM Simulation Approach. Processes. 2024; 12(3):480. https://doi.org/10.3390/pr12030480
Chicago/Turabian StyleBuchholz, Moritz, Dominik Weis, Riccardo Togni, Christoph Goniva, and Stefan Heinrich. 2024. "Describing the Drying and Solidification Behavior of Single Suspension Droplets Using a Novel Unresolved CFD-DEM Simulation Approach" Processes 12, no. 3: 480. https://doi.org/10.3390/pr12030480
APA StyleBuchholz, M., Weis, D., Togni, R., Goniva, C., & Heinrich, S. (2024). Describing the Drying and Solidification Behavior of Single Suspension Droplets Using a Novel Unresolved CFD-DEM Simulation Approach. Processes, 12(3), 480. https://doi.org/10.3390/pr12030480