Abstract
Assessing oxidation–reduction potential (ORP) is of paramount importance in the efficient management of wastewater within both chemical and biological treatment processes. However, despite its critical role, insufficient information exists about how reactive chemical species generated by cold plasma (CP) in chemical treatment are associated with ORP and air flow rate. Therefore, we aim to identify the correlation between ORP and the removal of organic pollutants when using CP treatment. Additionally, we introduce a machine-learning-based operation to predict removal efficiency in the CP process. Results reveal a significant correlation of over 0.9 between real-time ORP and total organic carbon (TOC), which underscores the efficacy of ORP as a key parameter. This approach made it possible to control OH radical generation by regulating the air flow rate of the CP. This study posits that smart management facilitated by machine learning has the potential to enhance the economic viability of CP feasibility while maintaining overall treatment performance.
1. Introduction
The advanced oxidation process (AOP) has been investigated to mitigate challenges linked to treatment problems associated with pathogen inactivation [1], persistent organic pollutants (POPs) [2], pharmaceuticals, and personal care products (PPCPs) [1]. Its competitiveness compared to other conventional biological treatments lies in its capability to produce reactive oxygen species (ROS), which dismantle specific chemical bonds within persistent organics characterized by a profusion of electron donors [3]. However, the deployment of AOPs for ROS generation requires substantial quantities of chemical or energy consumption, making them well known for their low cost-effectiveness [4].
In contrast, cold plasma (CP), or non-thermal plasma operating under ambient temperature and pressure, has been getting attention due to its relatively low energy consumption and high cost-effectiveness, particularly when utilizing air instead of pure inert gas [5]. Consequently, CP has been regarded as a viable alternative for the physico-chemical degradation of persistent organic pollutants that overcomes the prescribed limitations of conventional AOPs [6]. Furthermore, existing literature suggests that CP has the capability to mitigate the acute toxicity associated with such pollutants [7]. This establishes CP as a promising avenue for the advancement of environmentally sustainable and economically viable treatment approaches.
Treatment processes involving CP that generate reactive chemicals demand a multifaceted approach to ensure optimal operational efficiency. The elevated redox potential inherent in these reactive chemicals, along with the recombinants, facilitates the breakdown of the persistent pollutants to restore lost electrons [8]. Consequently, the augmentation of the oxidation–reduction potential (ORP) [9] becomes a pivotal parameter requiring vigilant monitoring for enhanced control over the wastewater treatment processes [10]. Recent advancements in ORP monitoring sensors contribute significantly to the refinement of control mechanisms, thereby bolstering overall operational performance more effectively [11,12]. This technological progression demands a more effective management strategy for CP-based systems in the domain of wastewater treatment.
Amidst the rapid evolution of machine learning algorithms in recent years, numerous researchers have extensively applied these technologies across diverse sectors, including scientific studies, industrial production, and energy applications [13]. The incorporation of machine learning (ML) into wastewater treatment management can be a promising way to predict treatment efficiency in both CP and ORP contexts. Although there are various ML algorithms, they commonly learn the hidden patterns from big data to predict the results [14,15]. In the case of supervised ML, labeled input and output training data are imperative during the training phase, necessitating meticulous preparation by researchers. In contrast, unsupervised ML relies on unlabeled or raw data, enabling the identification of patterns or trends and the clustering of similar data to enhance overall dataset understanding [16,17]. Clustering algorithms are useful for evaluating data similarity [18,19]. Among these, K-mean clustering is regarded as the most reliable algorithm. The robustness of the algorithm comes from recording data in a structured manner and iteratively refining the determination of optimal values for K centroids, enhancing its reliability for subsequent iterations [20,21,22,23,24].
Among various organic pollutants, surfactants emerge as a pertinent focal point for establishing a correlation between the treatment of organic pollutants in the CP process and ORP. This emphasis stems from the recognition that certain surfactants are identified as hazardous materials capable of potentially disrupting water ecosystems. Therefore, thorough investigations are imperative to verify the mitigating effect on toxicity associated with the surfactants.
Sodium dodecylbenzene sulfonate (SDBS), an anionic surfactant widely employed in detergent production, oil recovery, painting, and various industrial applications [25,26], is noteworthy. Enhanced oil recovery (EOR) in particular represents a well-known technology utilizing SDBS to address the global demand for energy resources [27,28]. Despite its widespread usage, little attention has been directed towards assessing the environmental toxicity associated with the extensive utilization of SDBS.
Therefore, this study demonstrates an innovative approach to predicting the treatment efficiency of the CP process by means of ORP monitoring. Originality can be found in that it employs an indirect quantification method to evaluate the concentration of reactive chemical species in relation to the air flow rate during CP treatment. Additionally, the research evaluates the efficiency of surfactant reduction by dynamically adapting the real-time ORP data and employing an ML algorithm throughout the CP treatment process. Moreover, by harnessing ML techniques, this investigation delves into uncovering the intricate correlation between ORP dynamics and surfactant reduction while predicting removal efficiency using ML.
2. Materials and Methods
2.1. Experimental Configuration and Setups
SDBS (CH3(CH2)11C6H4SO3Na, Sigma-Aldrich, Burlington, MA, USA) was purchased from Sigma-Aldrich. The SDBS solution was prepared by mixing 45 mg of SDBS in 3000 mL of de-ionized water, which was stored in the refrigerator at 4 °C before further analysis. SDBS synthetic wastewaters were prepared with a 15 mg/L concentration, which was initially analyzed. They were analyzed in triplicate, and the initial concentrations are shown in Table 1. The CP was manufactured by Company G in J City, Korea. The CP produces a glow discharge. Moreover, 10 mA and 2.2 W plasmas generated air-based plasma under room temperature and pressure. The plasma generator can convert AC 220 V up to DC 10,000 V. The CP includes the air pump (2546C-10, WELCH, Niles, IL, USA). The air pump was controlled by a digital flow switch (PFM711S-C6-A-WS, Dae Dong Automation Co., Ltd., Seoul, Republic of Korea). In each test, the 10 L reactor was filled with 3 L of a 15 mg/L SDBS solution. An aeration pump was operated with air flow rates of 10 L/min, 5 L/min, and 2.5 L/min, which were controlled by a flow meter.

Table 1.
Initial values of pH, TOC, TC, and TIC. This SDBS synthetic wastewater contains 15 mg/L of SDBS.
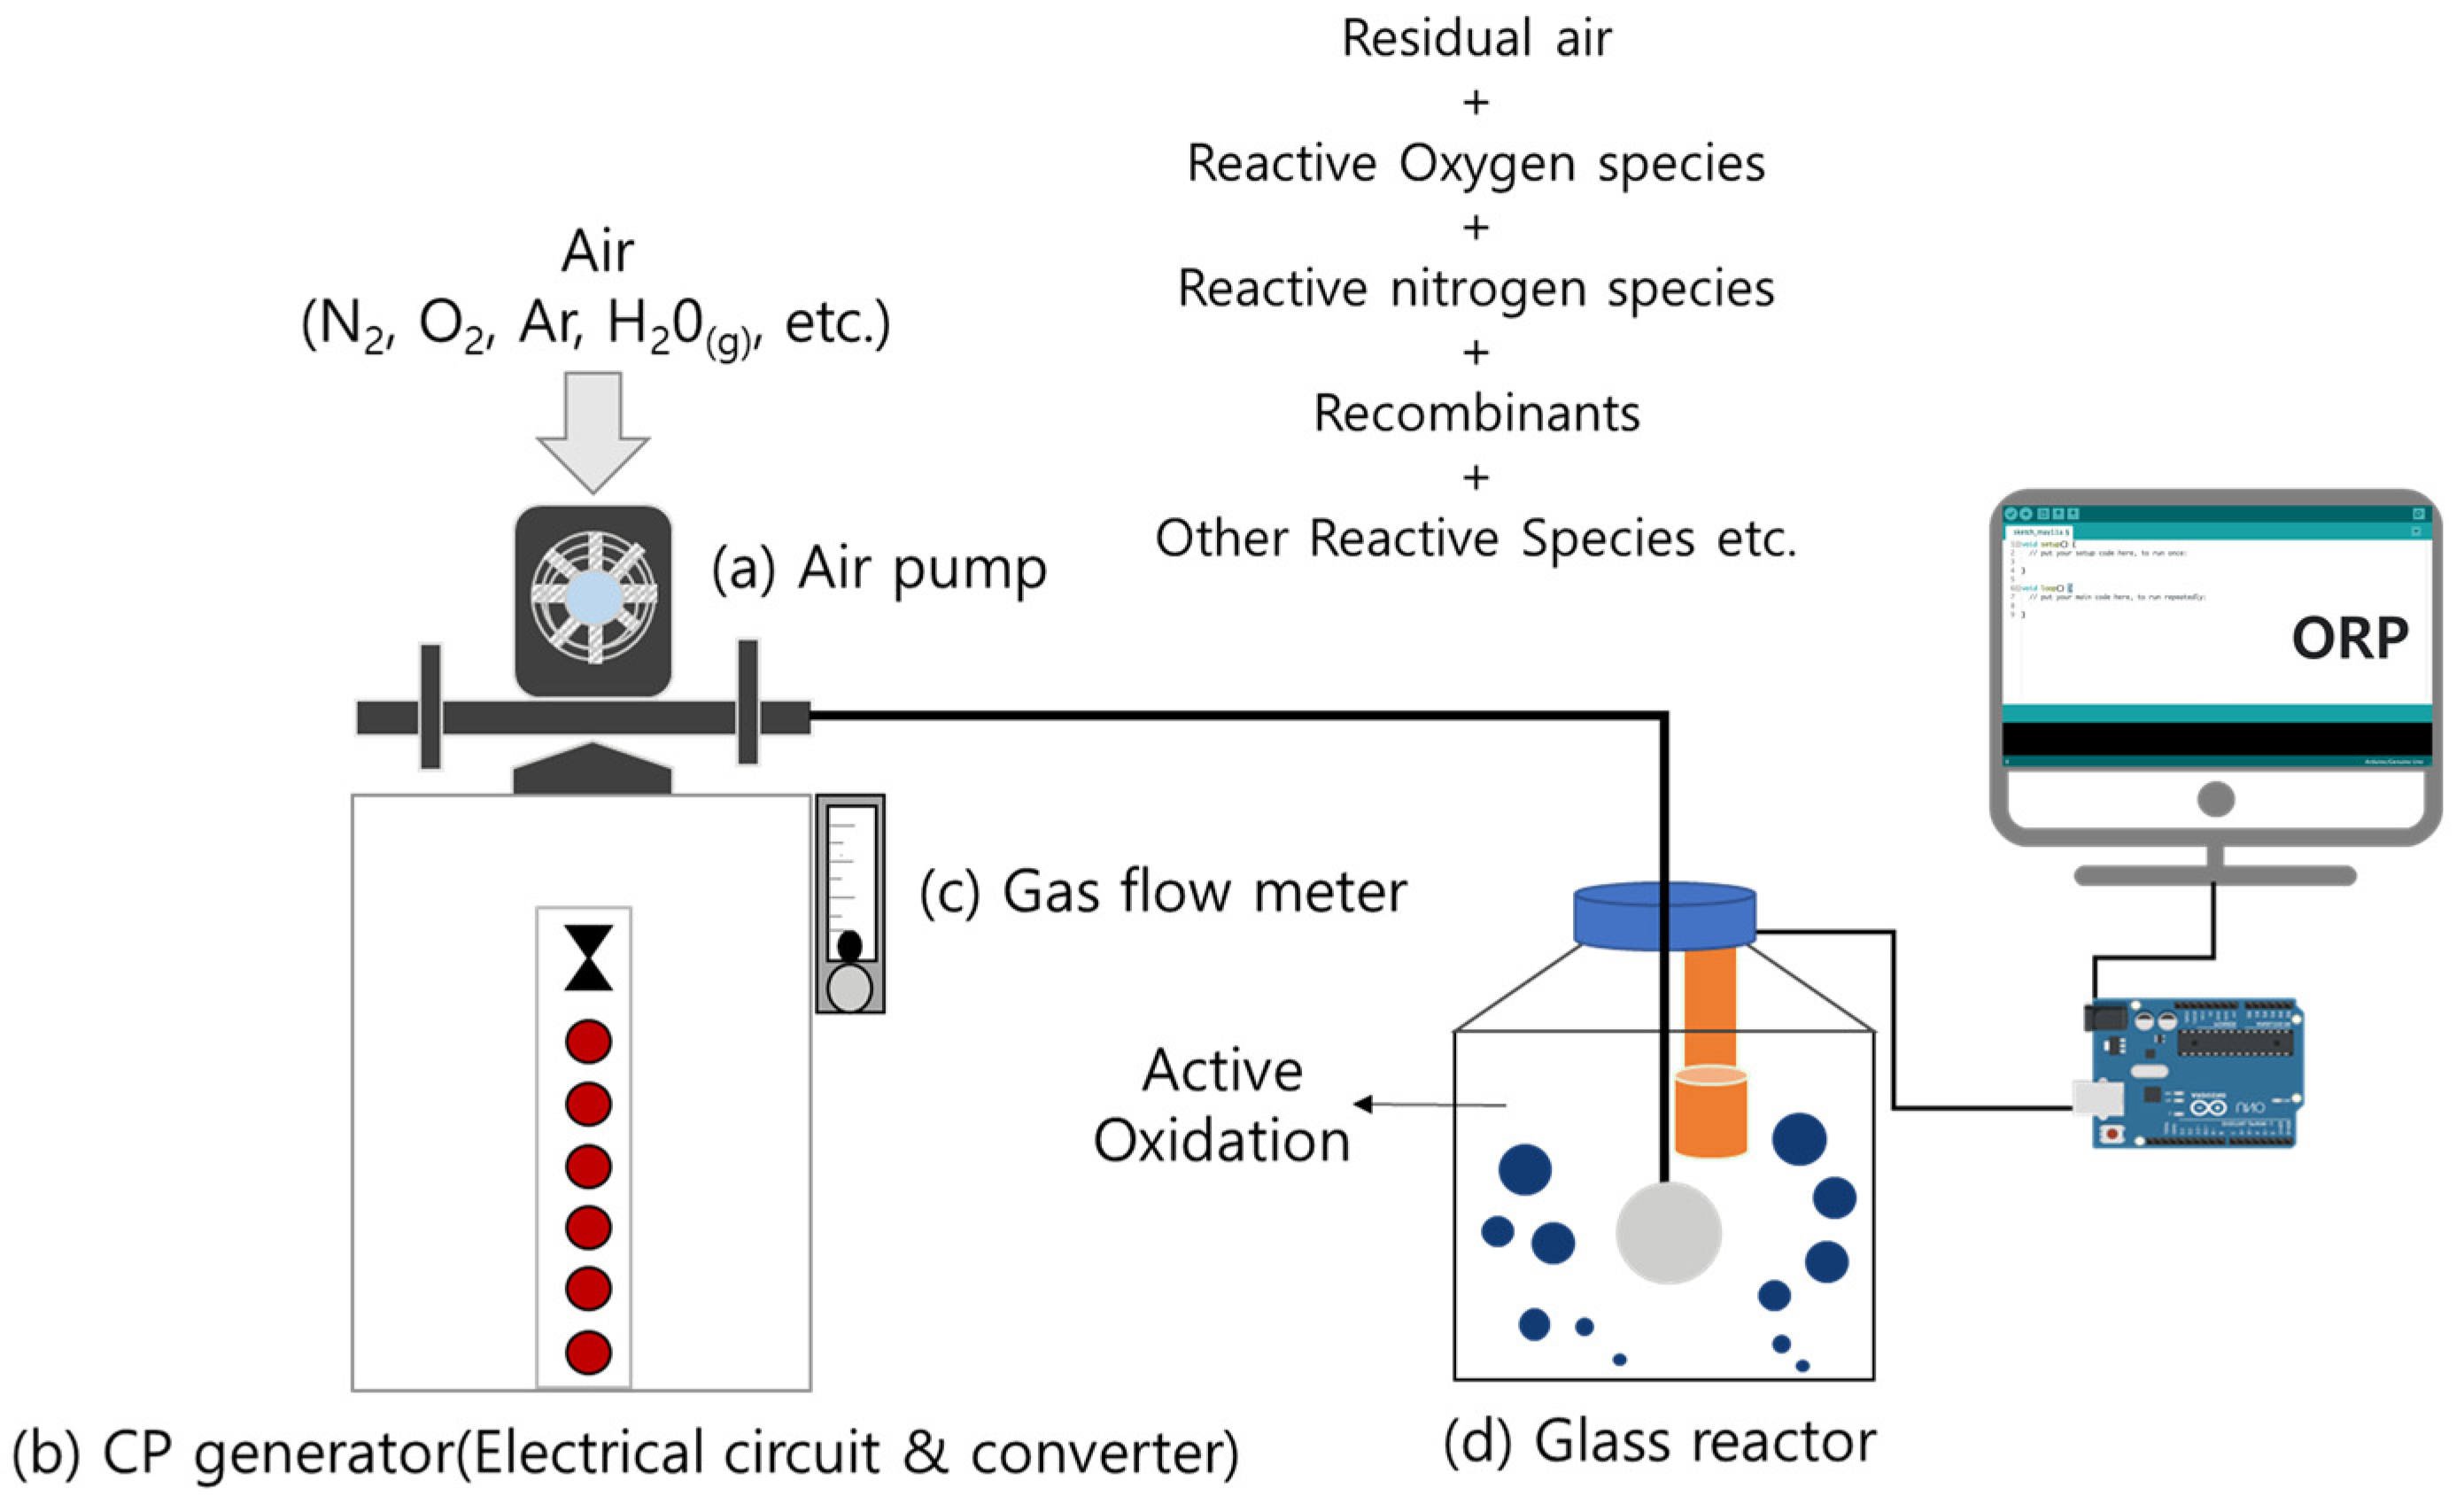
Monitoring of the SDBS removal process was conducted using an ORP sensor (SEN0165, DFROBOT, Shanghai, China), which was interfaced with an Arduino microcontroller (Arduino UNO R3, Mecha solution, Daegu, Republic of Korea). Arduino, an open-source platform renowned for its versatility in both hardware and software [29], served as the foundation for this monitoring system. Utilizing language and libraries based on C++ and an integrated development environment (IDE) for the programming interface [30], the configuration of the Arduino board and port settings were imperative to facilitate code uploading within the IDE [31]. Arduino IDE version 2.0, freely downloadable and installable software, served as the programming environment [32]. The connection between the Arduino board and the PC was established through a USB cable. The open-source code from GitHub was utilized for Arduino programming. CoolTerm software version 2.1.1.1288, offering serial monitoring capabilities coupled with data logging functionalities, was employed for monitoring and data storage concurrently [33]. Data acquired through CoolTerm were saved in a text (*.txt) file format. Figure 1 shows the schematic diagram depicting the configuration of the SDBS removal system under test in this study.
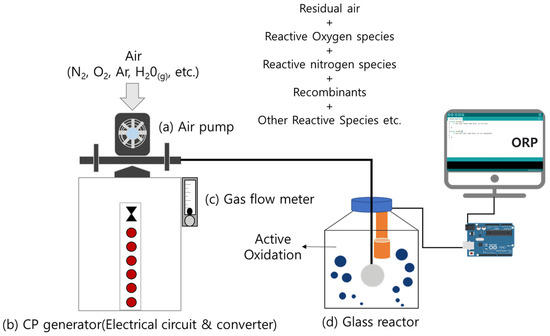
Figure 1.
A schematic diagram of the CP process coupled with an Arduino-based real-time ORP monitoring system for the removal of SDBS: (a) air pump for plasma reaction; (b) CP generator equipped with electrical circuits and a converter system; (c) gas flow meter to determine independent variables; (d) glass reactor for the active oxidation and reduction of substances.
2.2. Quantification of Hydroxyl Radical
To assess the efficacy of the CP process and to compare it with airflow, OH radicals were quantified utilizing established methodologies. Considering that OH radicals are dissolved within the liquid medium, chemical dosimetry based on terephthalic acid (TA) was employed [34]. This method relies on the fluorescent characteristics of hydroxy terephthalic acid (HTA), which is produced through the reaction of TA with OH radicals [35].
The intensity of the fluorescent peak emitted by HTA is directly proportional to the concentration of OH radicals generated during the CP process [36]. In contrast to TA, which lacks fluorescence properties, HTA emits light at 425 nm when excited by a light source at 310 nm [37]. Distilled water was used to dissolve TA (C8H6O4, Sigma Aldrich, Burlington, MA, USA) at a concentration of 2 mM. It has been documented that the fluorescence intensity of HTA solutions remains stable within a pH range of 6 to 11; however, a significant decrease in intensity occurs at lower pH values [38]. Distilled water was employed to dissolve NaOH at a concentration of 5 mM, thereby setting the initial pH of the TA solution to 10 with an electrical conductivity of 0.323 mS/cm.
HTA generated from the TA solution was measured under CP flow rates of 2.5 L/min, 5 L/min, and 10 L/min. The fluorescence photometer was utilized to analyze HTA emissions, which were observed at 425 nm when excited by a light source at 310 nm. HTA measurements were conducted using a fluorescence spectrometer (LS 55 Fluorescence Spectrometer, PerkinElmer, Connecticut, Shelton, USA) and a quartz cell (Quartz Cell, Korea Materials Science Co., Ltd., Seoul, Republic of Korea). The concentration of HTA was determined using a calibration curve. A standard solution comprising 50 μM of HTA (C8H7O5, Sigma Aldrich, Burlington, MA, USA) in de-ionized water was prepared. Analytical solutions were derived through appropriate dilutions of the 50 μM HTA solutions. Eight HTA solutions with different concentrations were used for a calibration curve. A calibration curve (R2 = 0.99) was generated with each concentration plotted on the x-axis and the detected sensitivity at 425 nm plotted on the y-axis. The concentration of OH radicals in the liquid was determined using the calibration curve and known concentrations of the HTA standard solution.
2.3. SDBS Removal Using CP
Sampling involved drawing 40 mL through a sampling tube using a syringe, with all samples subsequently stored in conical tubes in a refrigerator at 4 °C. Total organic carbon (TOC) concentration was assessed following the high-temperature combustion method (ES 04311.1c) outlined in the water pollution standard method. TOC analysis was performed in triplicate using a TOC analyzer (TOC-L, Shimadzu, Japan). Samples from reactors operating at air flow rates of 2.5 L/min, 5 L/min, and 10 L/min were analyzed accordingly.
Given the presence of sulfur atoms within the SDBS molecule, the formation of SO42− ions as intermediate by-products was anticipated, resulting from the breakdown of sulfonyl bonds [39]. Sulfate ions were quantified using an ion chromatograph (Dionex Aquion IC, Thermo Scientific, Waltham, MA, USA), with all samples filtered through a 0.2 µm PVDF syringe filter prior to IC analysis.
The concentration of SDBS was determined in accordance with the anionic surfactant analysis method (ES 04359.1d) specified in the water pollution standard method. Methylene blue, a cationic dye, facilitated the determination of anionic surfactant levels in SDBS samples. The ion association between surfactants and methylene blue was extracted using chloroform, with chloroform measurements conducted using a UV spectrophotometer (UV-1800, Shimadzu, Japan) at an optical density (OD) of 650 nm. SDBS concentrations were confirmed and quantified against a standard curve (R2 > 0.99).
Acute toxicity tests were carried out following the acute toxicity test method employing Daphnia magna (ES 04704.1b) as stipulated in the water pollution standard method. Daphnia magnae were obtained from the National Institute of Environmental Research, South Korea. Offspring from mother cultures were collected within 24 h preceding the commencement of the test. Subsequently, neonates born within 24 h were extracted using a glass pipette. Daphnia magna neonates younger than 24 h were exposed to six different concentrations of SDBS (100%, 50%, 25%, 12.5%, 6.25%, and a control at 0%) diluted within a medium. Five Daphnia magna individuals were introduced into beakers containing 50 mL of SDBS samples per concentration, with the number of deceased or impaired individuals recorded 24 h later. An impairment of swimming behavior was defined as the absence of movement for more than 15 s. Four repetitive experiments were performed on the diluted SDBS samples, respectively. Toxicity was expressed as an effective concentration of acute toxic units (TU) as per Equation (1). TU values were calculated using the EC50 expressed as a volume percentage. The EC50 results underwent statistical evaluation using the Trimmed Spearman-Karber method (TSK) software version 1.5.
2.4. Unsupervised and Supervised Learning in Machine Learning
The pre-determined value of K, an essential input parameter for achieving optimal clustering, must be provided in advance. The elbow method, a primary technique for determining the precise number of clusters, was employed to optimize the clustering process within the K-mean clustering method [40]. Subsequently, the optimal number of clusters was determined using the Silhouette index through elbow analysis.
Cluster analysis utilizing the K-means algorithm within SPSS statistics facilitated the identification of clusters. Subsequent to this, a simple linear regression analysis was conducted based on the centroid values derived from the K-mean clustering process. Linear regression is the most common approach for modeling numeric data and can be adapted to almost all types of data [41].
3. Results and Discussion
3.1. Evidence of Hydroxyl Radical Formation in CP According to Variations in Air Flow Rate
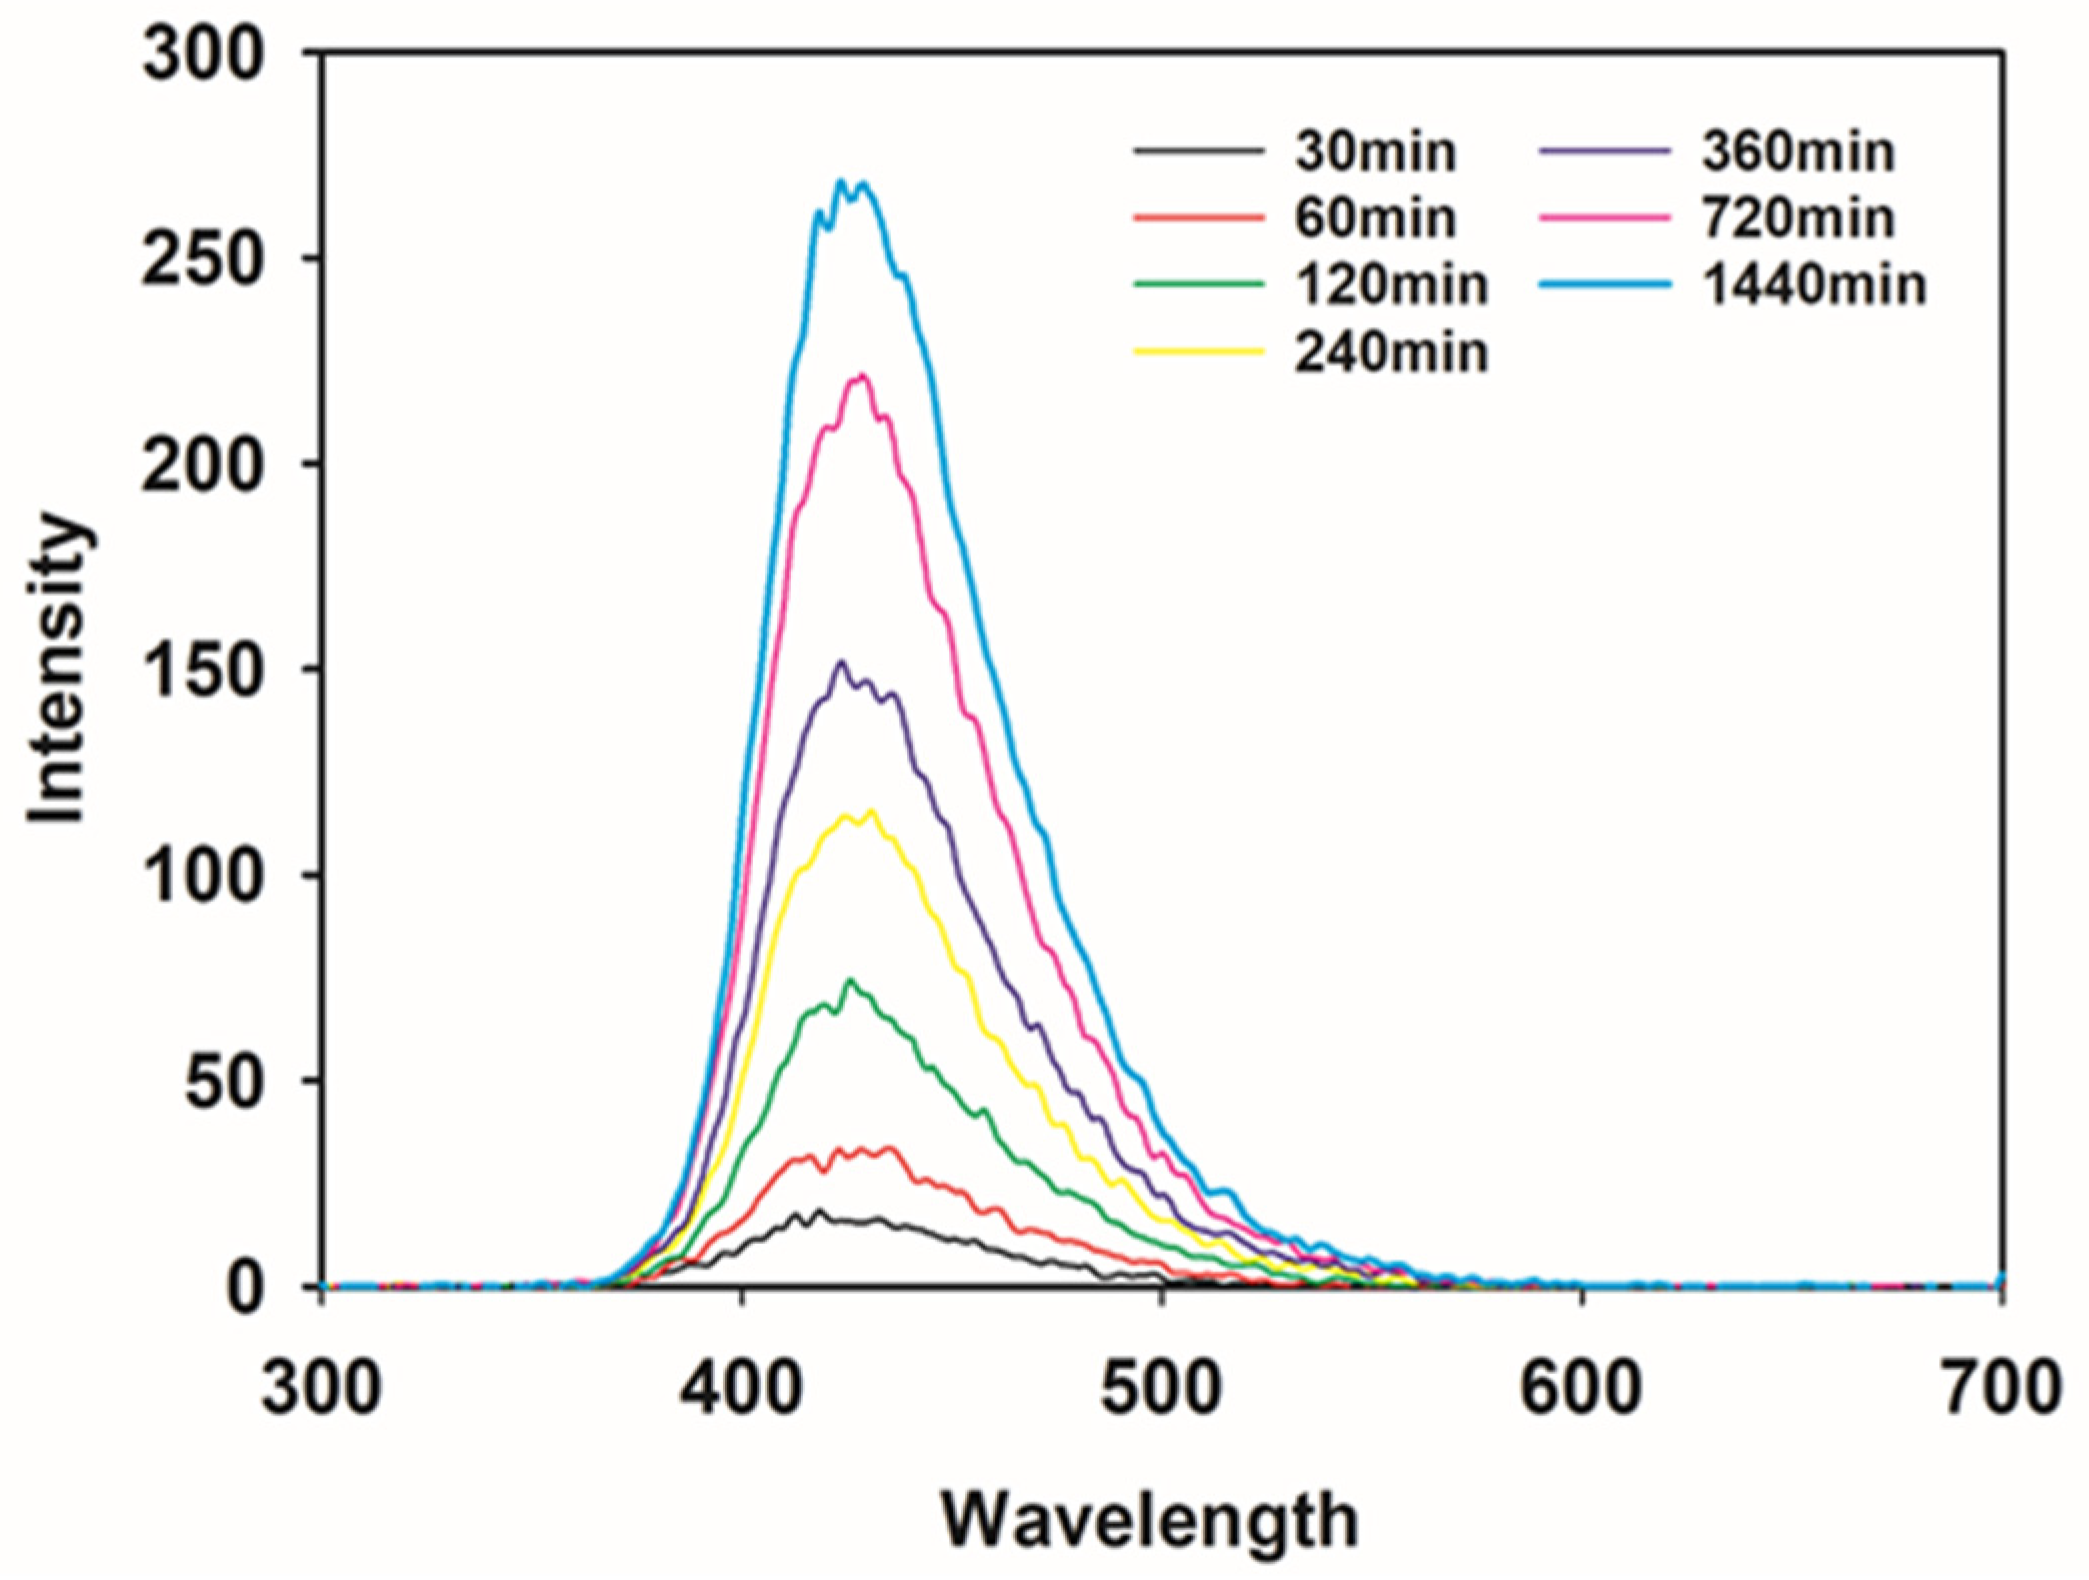
Figure 2 illustrates the assessment of OH radical generation in TA solution over different treatment durations. The fluorescence intensity exhibited a progressive increase over time, evidencing the increase in the total amount of OH radicals facilitated by TA. Additionally, Figure 2 depicts the result of fluorescence spectrophotometer analysis conducted at a wavelength of 310 nm, revealing maximal sensitivity to 425 nm. Consequently, HTA was quantified based on the intensity observed at 425 nm.

Figure 2.
Obtained intensities of fluorescence as a function of the wavelength spectrum from 300 to 700 nm. Different colors indicate the variations of fluorescence intensities at the specific treatment time during CP application.
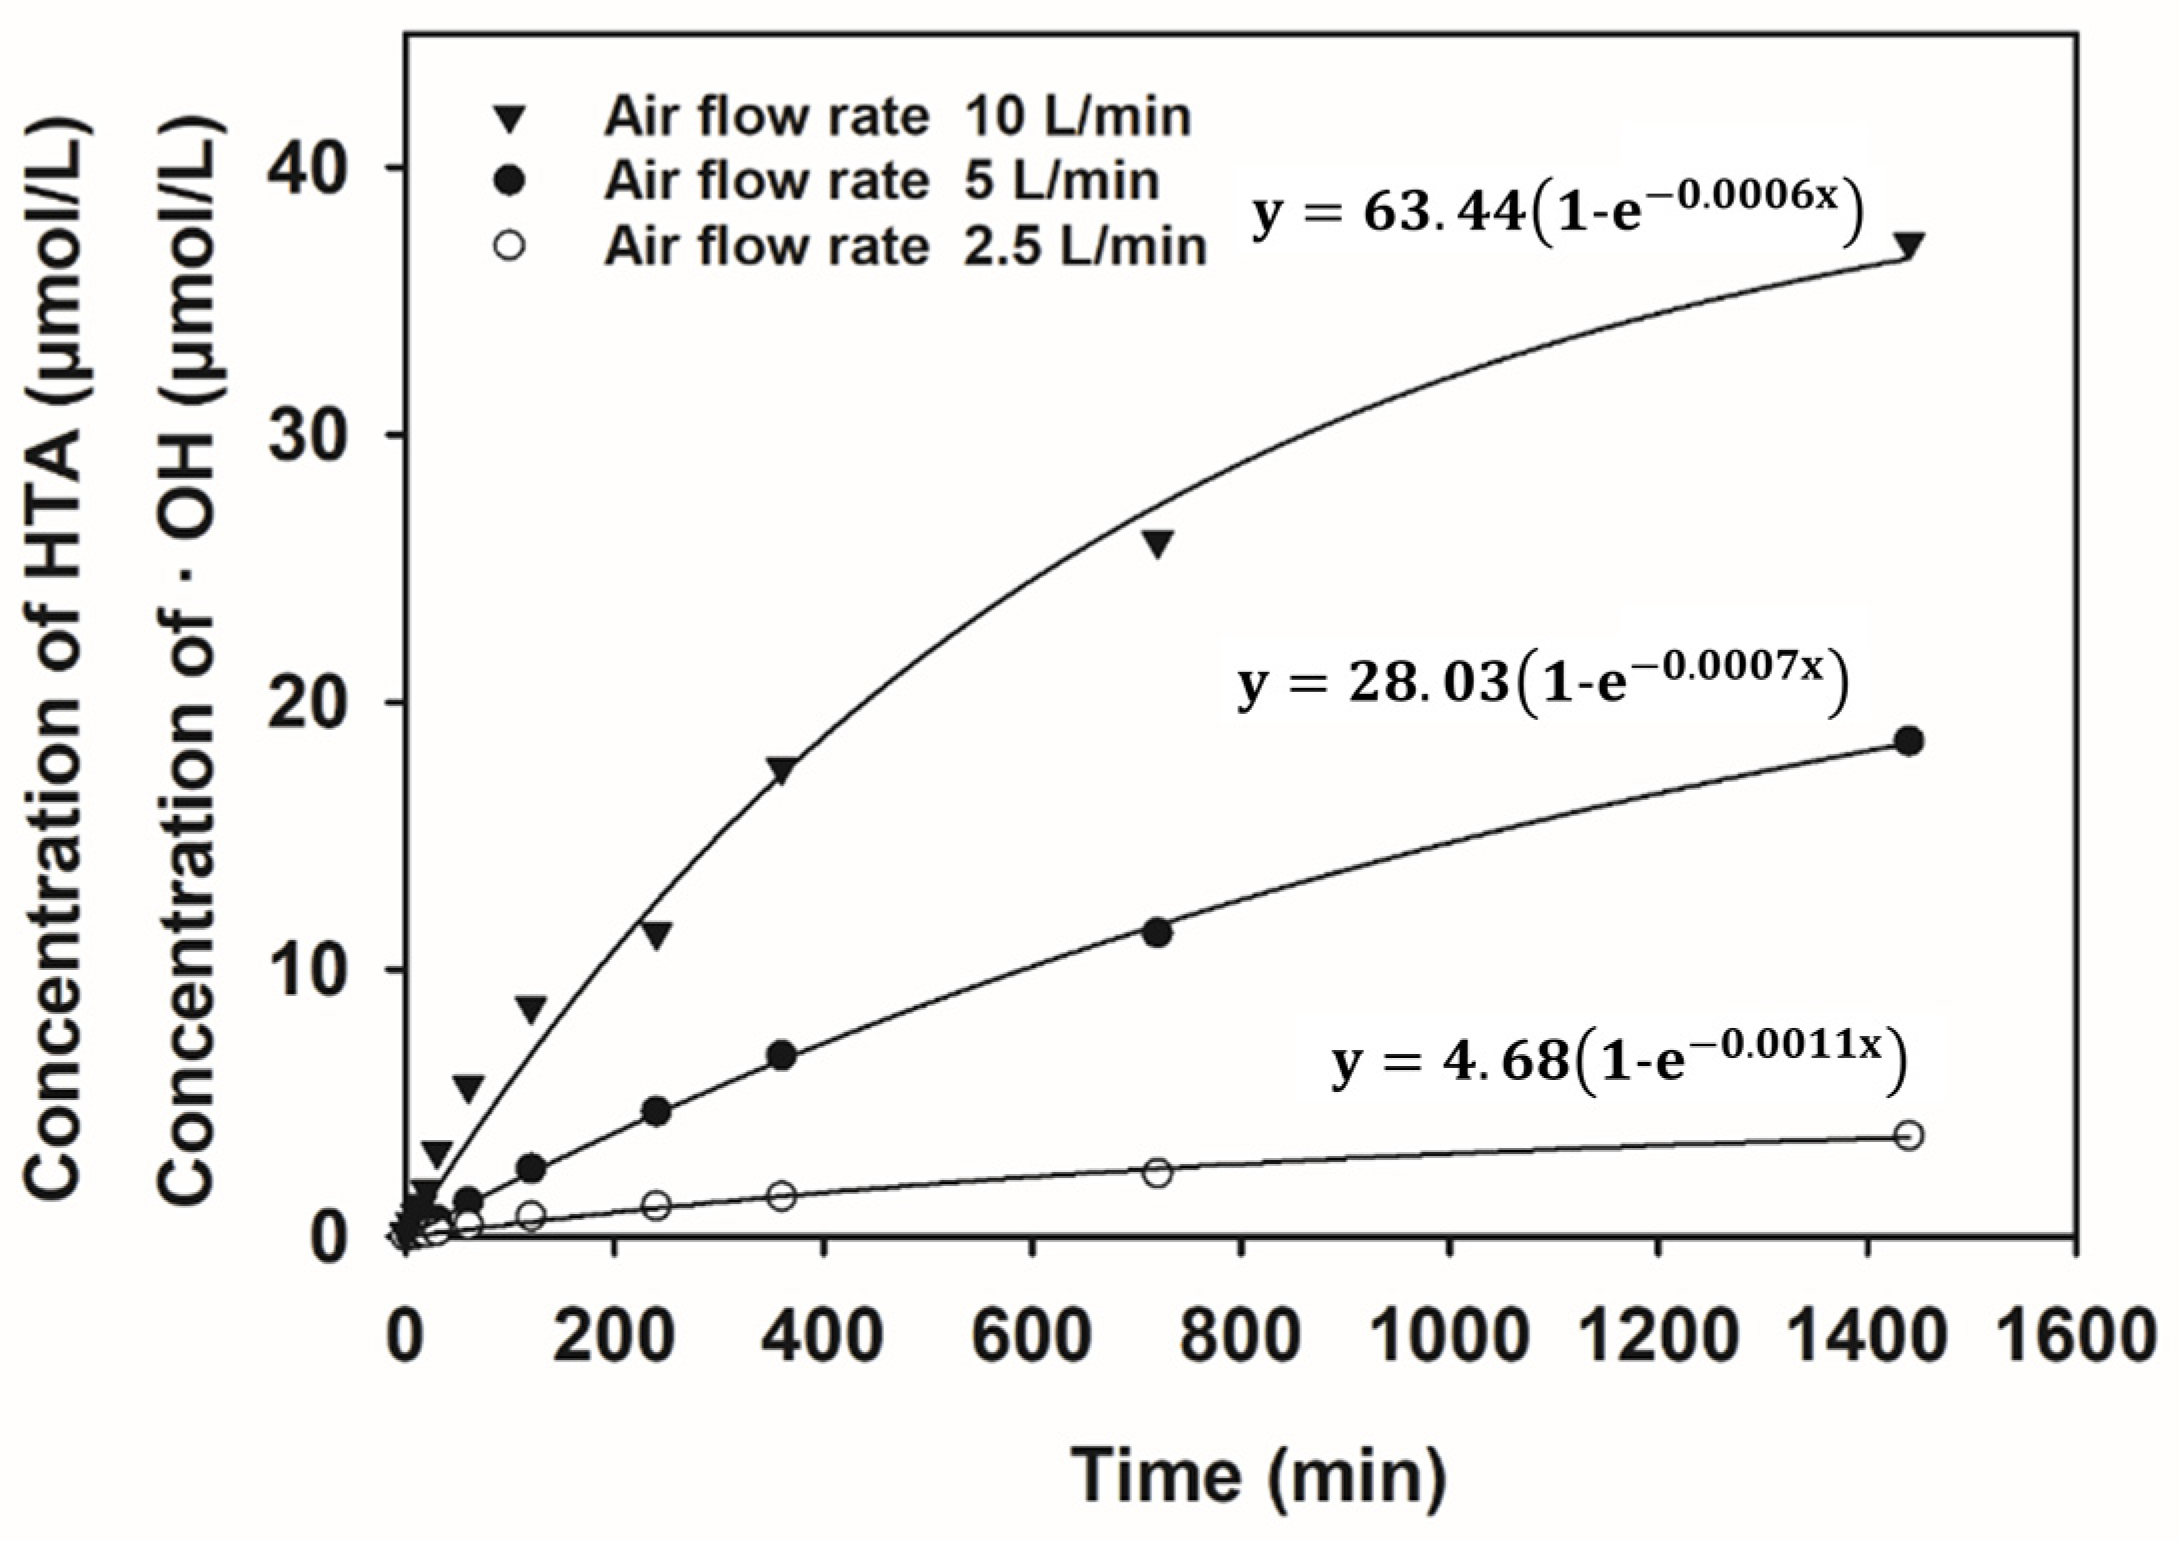
We quantified the concentration of OH radicals in the solution by measuring the intensity of HTA. In various experimental scenarios, the HTA reaction was assumed to account for 35% of the overall reaction, acknowledging that besides the trapping of OH radicals by TA, other reactions that consume OH radicals also transpired [42,43]. As a result, the actual quantity of generated OH radicals may have been underestimated. Nevertheless, Figure 3 clearly illustrates that the production of OH radicals escalates with increasing air flow rates.
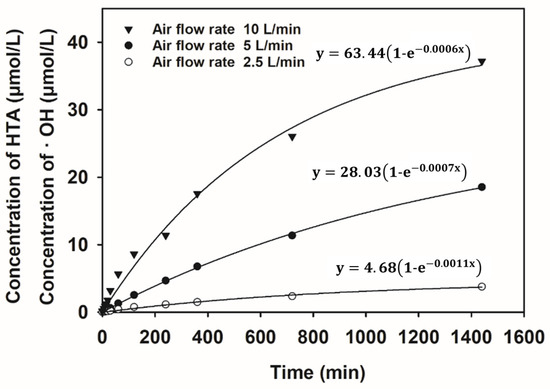
Figure 3.
Variations of HTA concentrations, which directly correlate to the amount of OH radical (·OH), at air flow rates of 10 L/min, 5 L/min, and 2.5 L/min. Regression models demonstrate the values of HTA accumulation as a function of time in the CP process.
3.2. SDBS Degradation by CP According to Air Flow Rate
3.2.1. SDBS and TOC Removal in CP Treatment
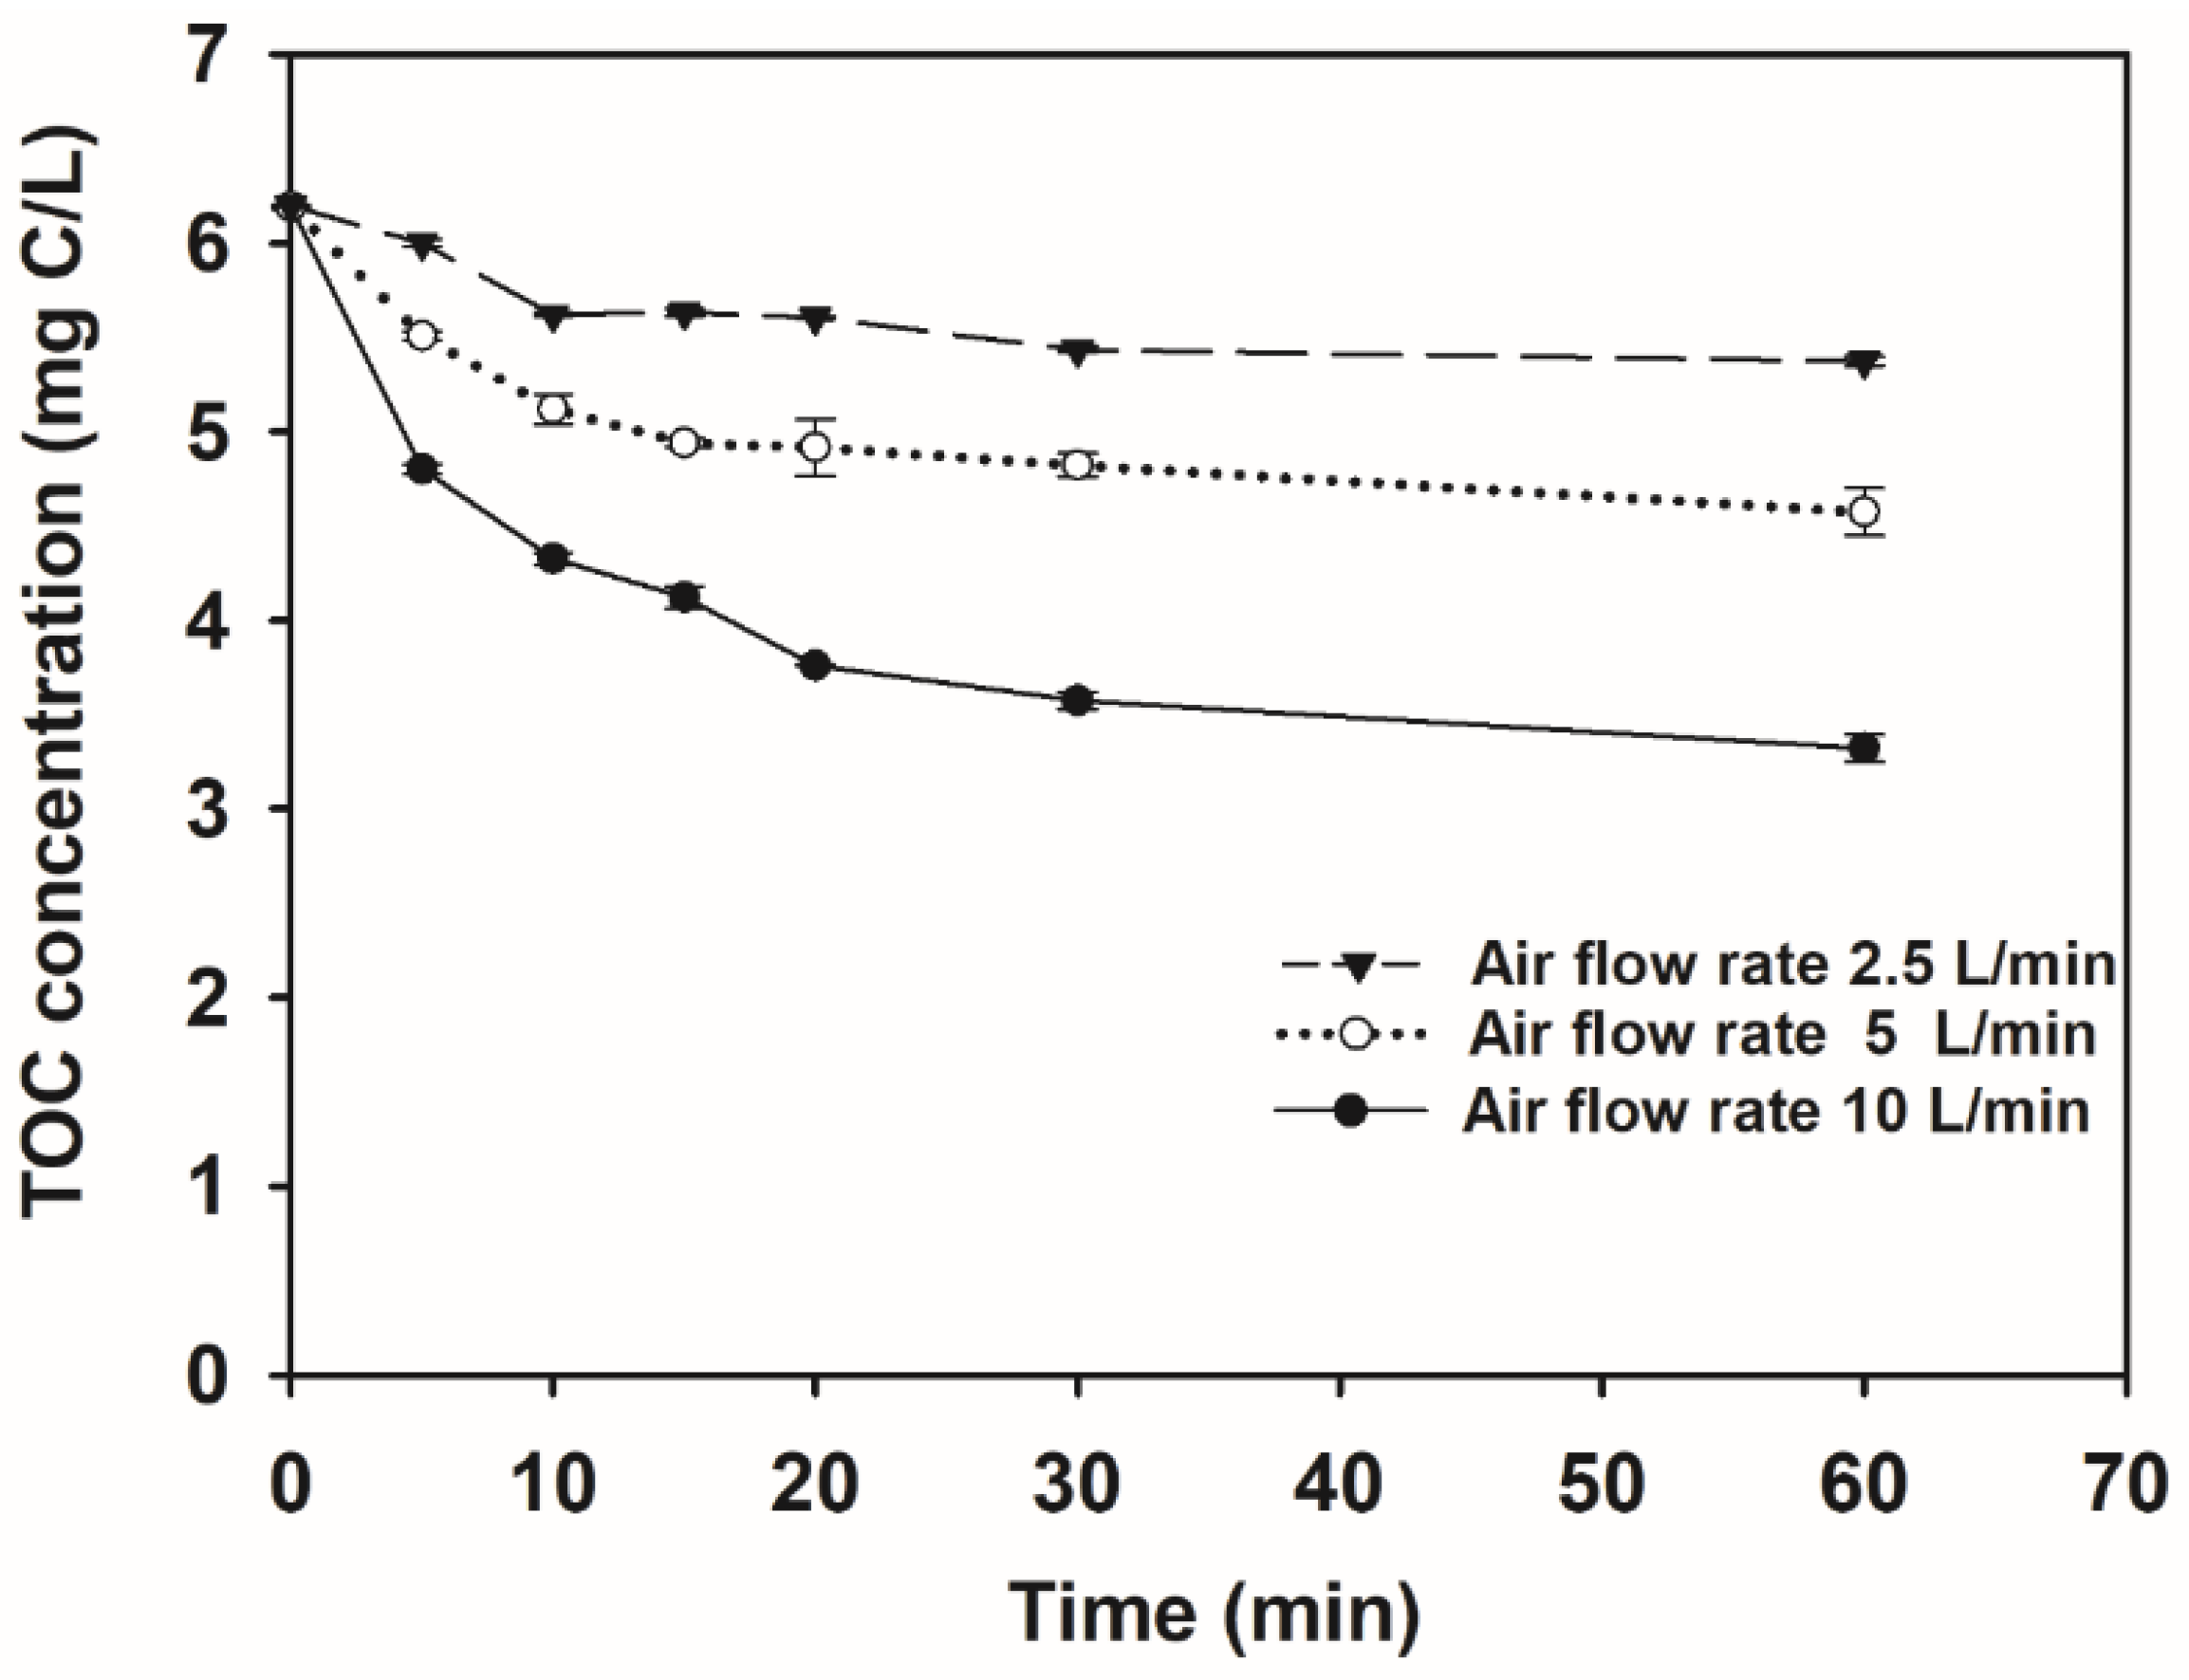
In Figure 4, the efficacy of total organic carbon removal is depicted relative to different air flow rates. Initially, the TOC concentration stood at 6.19 mg C/L. Under a 10 L/min air flow rate for TOC removal, a removal efficiency of 47% was attained after 60 min of treatment. At air flow rates of 5 L/min and 2.5 L/min for TOC removal, the removal efficiencies were 26% and 14%, respectively. These findings affirm that the efficiency of TOC treatment is dependent upon the air flow rate.
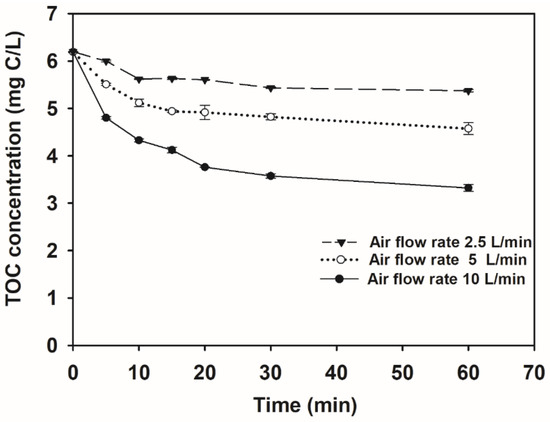
Figure 4.
Variation of TOC concentration in the CP process, treating SDBS as a function of air flow rates.
To assess the efficacy of SDBS removal concerning the air flow rate of CP, the degradation performance of SDBS was investigated. SDBS quantification was achieved utilizing a standard curve exhibiting a coefficient of determination (R2) exceeding 99%. The analysis of processing efficiency, as determined by the standard curve, revealed a pronounced acceleration in SDBS removal with increased air flow rates. Notably, after 60 min of treatment, the degradation efficiency for SDBS was only 64% and 66% at air flow rates of 2.5 L/min and 5 L/min, respectively. In contrast, a substantial enhancement was observed at 10 L/min, where the SDBS degradation efficiency reached as high as 72% (Table 2). These findings, in conjunction with prior results, underscore the significant impact of air flow rate on the generation of ROS such as OH radicals, H2O2, and O3. The heightened production of ROS with increased air flow rates correlates positively with improved SDBS removal efficiency.
Table 2.
Initial SDBS concentration, final SDBS concentration, and overall removal efficiency in the CP process as a function of air flow rate.
3.2.2. Sulfate Concentration Variations during CP Treatment
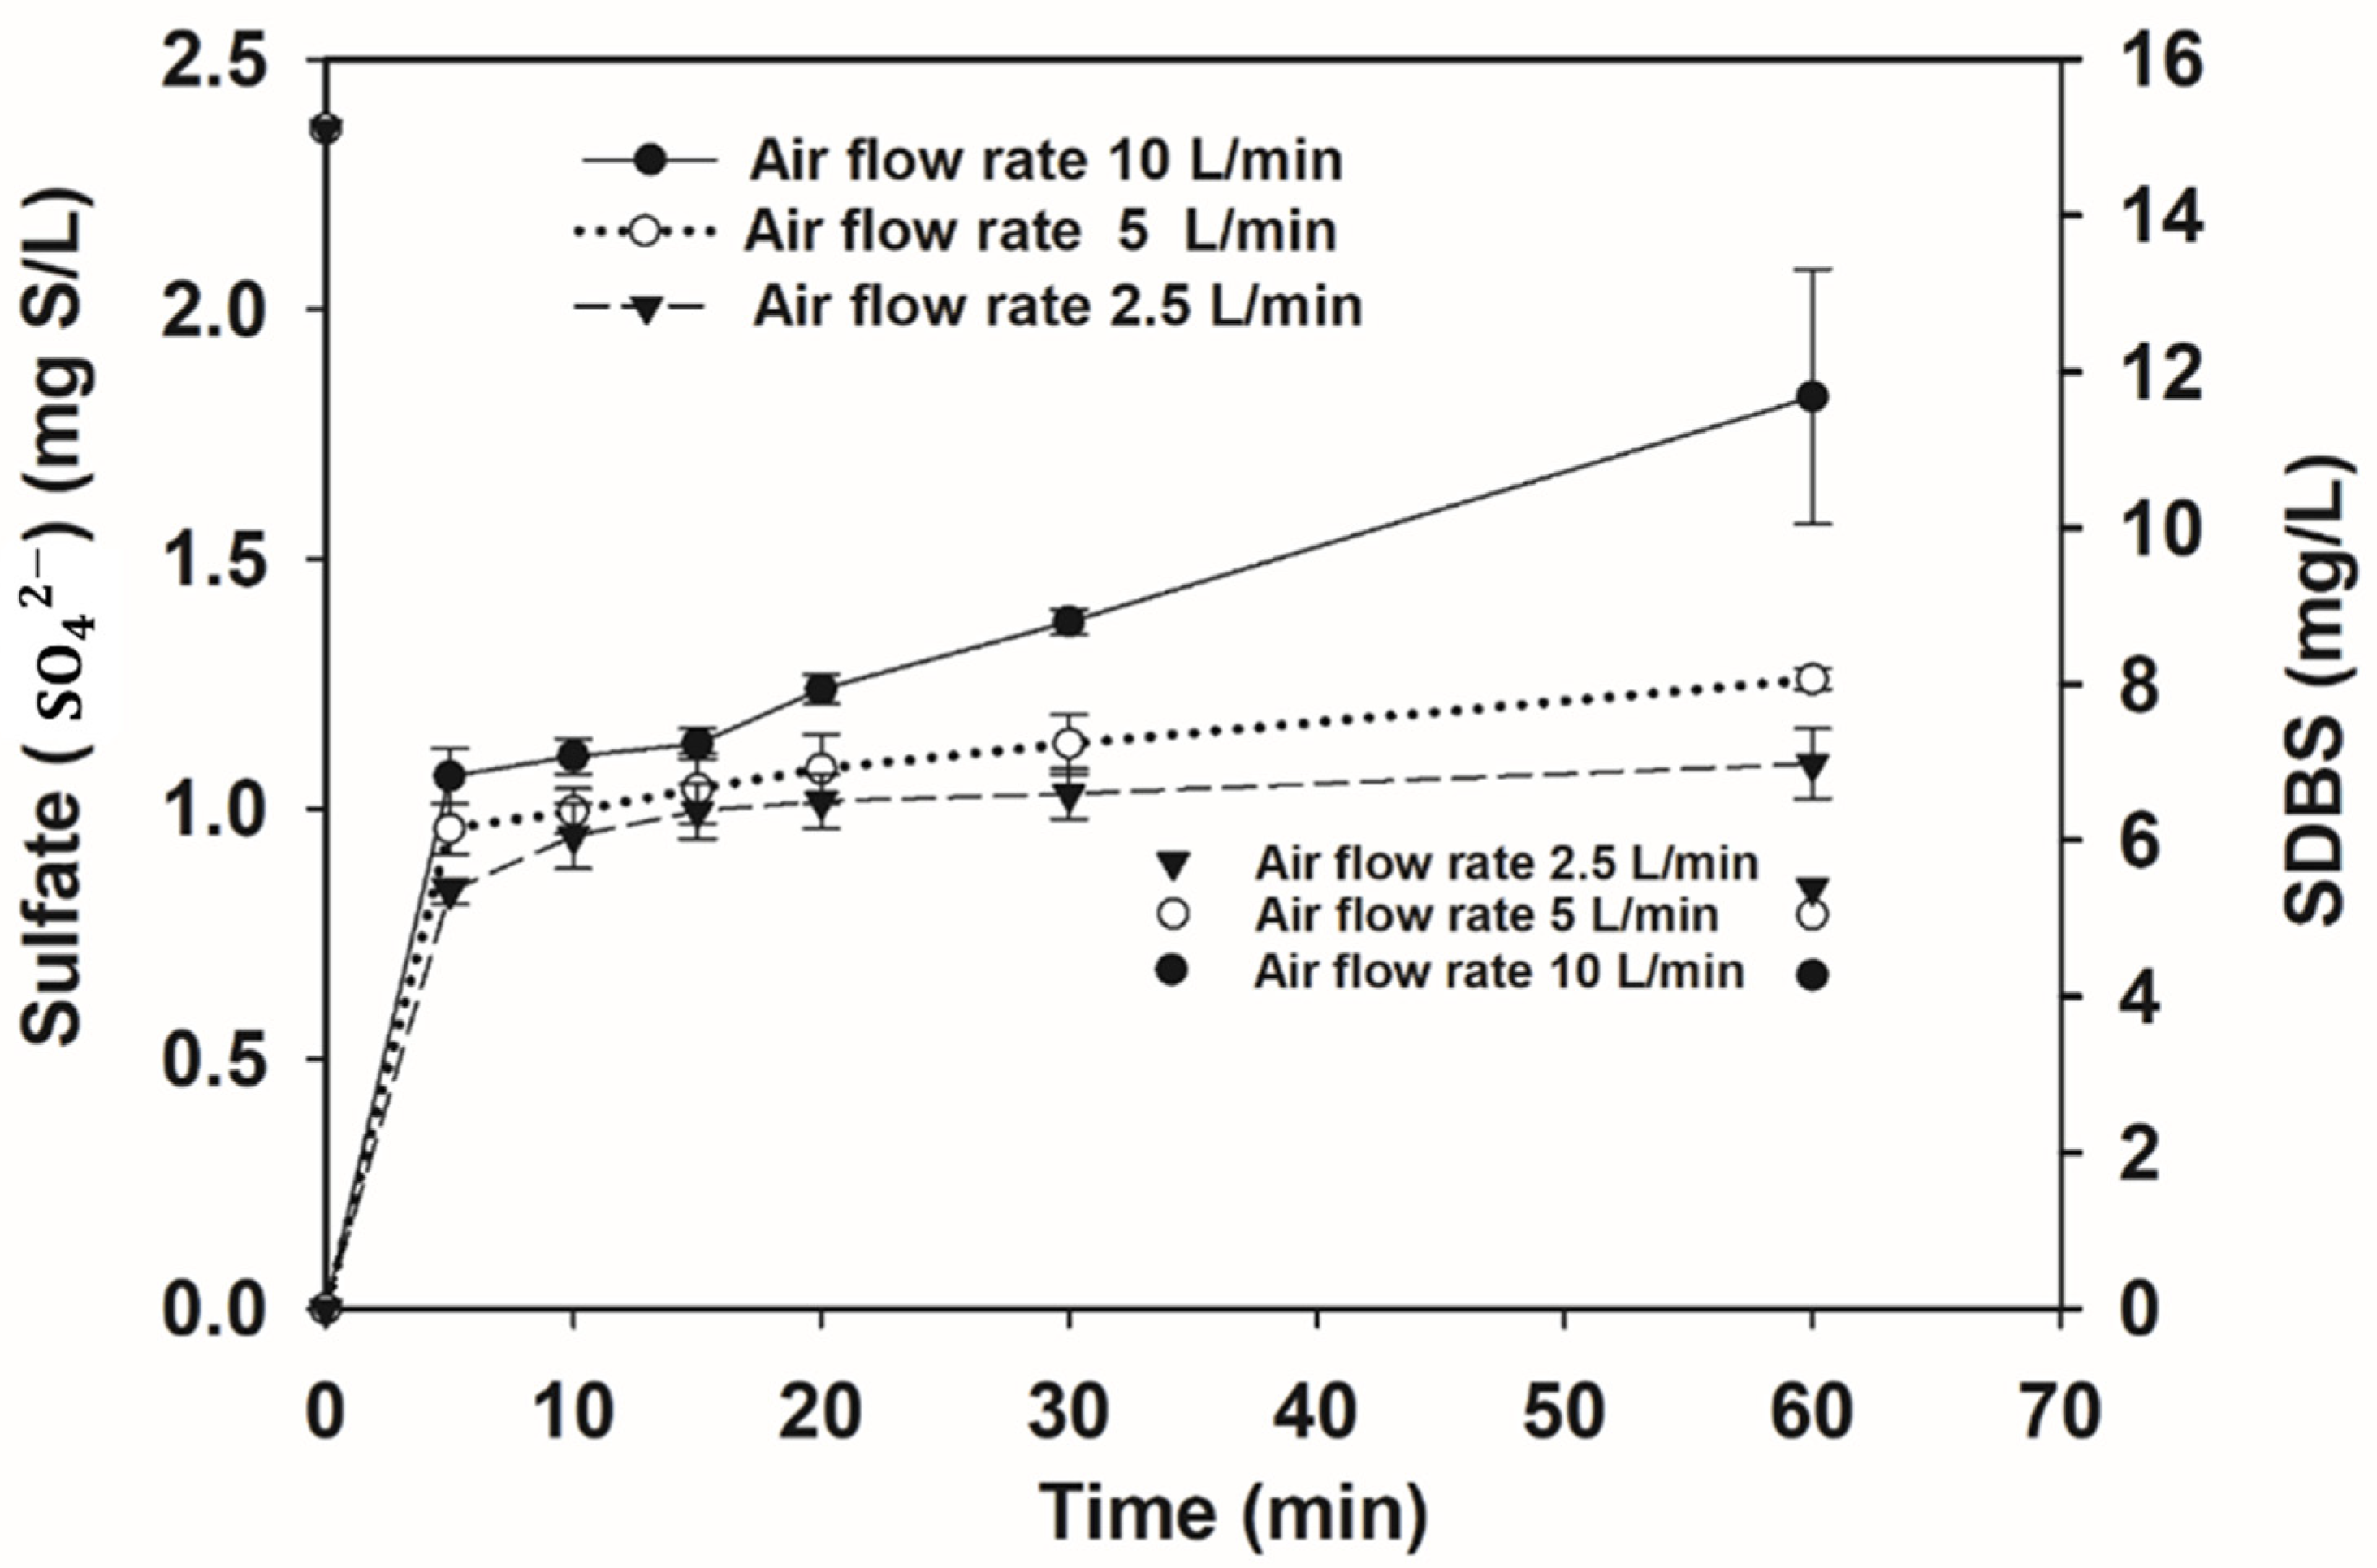
The SDBS and OH radical reactions yielded confirmation of SO42−, CO2, and O2 as the resultant products [44]. Figure 5 illustrates the fluctuation of sulfate during SDBS removal, demonstrating the oxidation of sulfur within the SDBS molecule to SO42−. Furthermore, as depicted in Figure 3, an increase in air flow rate corresponds to increased OH radical production. Consequently, it is evident that the generation of SO42− steadily escalates with extended operation duration.
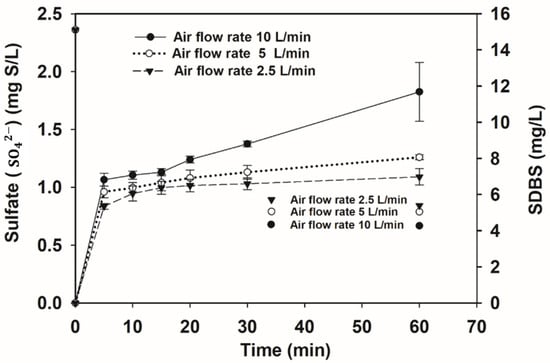
Figure 5.
Variation of SO42− and SDBS concentrations in the CP process as a function of air flow rates.
3.2.3. Evaluation of Acute Toxicity on the SDBS
The initial TU value of the SDBS sample was 11.3, with an EC50 value of 8.84 within a 95% confidence interval, aligning closely with the range of 6.3~9.5 mg/L as specified in the Material Safety Data Sheets for SDBS. Following a 1-h exposure period, toxicity assessments indicated a TU of 0 for samples treated with CP air flow rates of 10 L/min at the initial 15 mg/L, a concentration level associated with 0 to 10% swimming inhibition or death of Daphnia magna in 100% SDBS sample conditions.
Subsequent toxicity evaluations after a 1-h treatment period revealed TU values of 0.4 and 0.5 with CP air flow rates of 5 L/min and 2.5 L/min, respectively, also at the initial concentration of 15 mg/L. These levels correspond to the range where 10 to 49% of Daphnia magna exhibit adverse effects, with TU calculated by multiplying the percentage of affected organisms by 0.02. These findings are consistent with earlier studies, which demonstrated that ozone treatment effectively mitigated acute toxicity initially, while the intermediates formed during the process [45], including oxalate, formate, and sulfate, had negligible impacts on Daphnia magna. The primary source of toxicity toward Daphnia magna during treatment remained the residual SDBS [46].
3.3. Performances of Machine Learning
3.3.1. Unsupervised Learning in Machine Learning
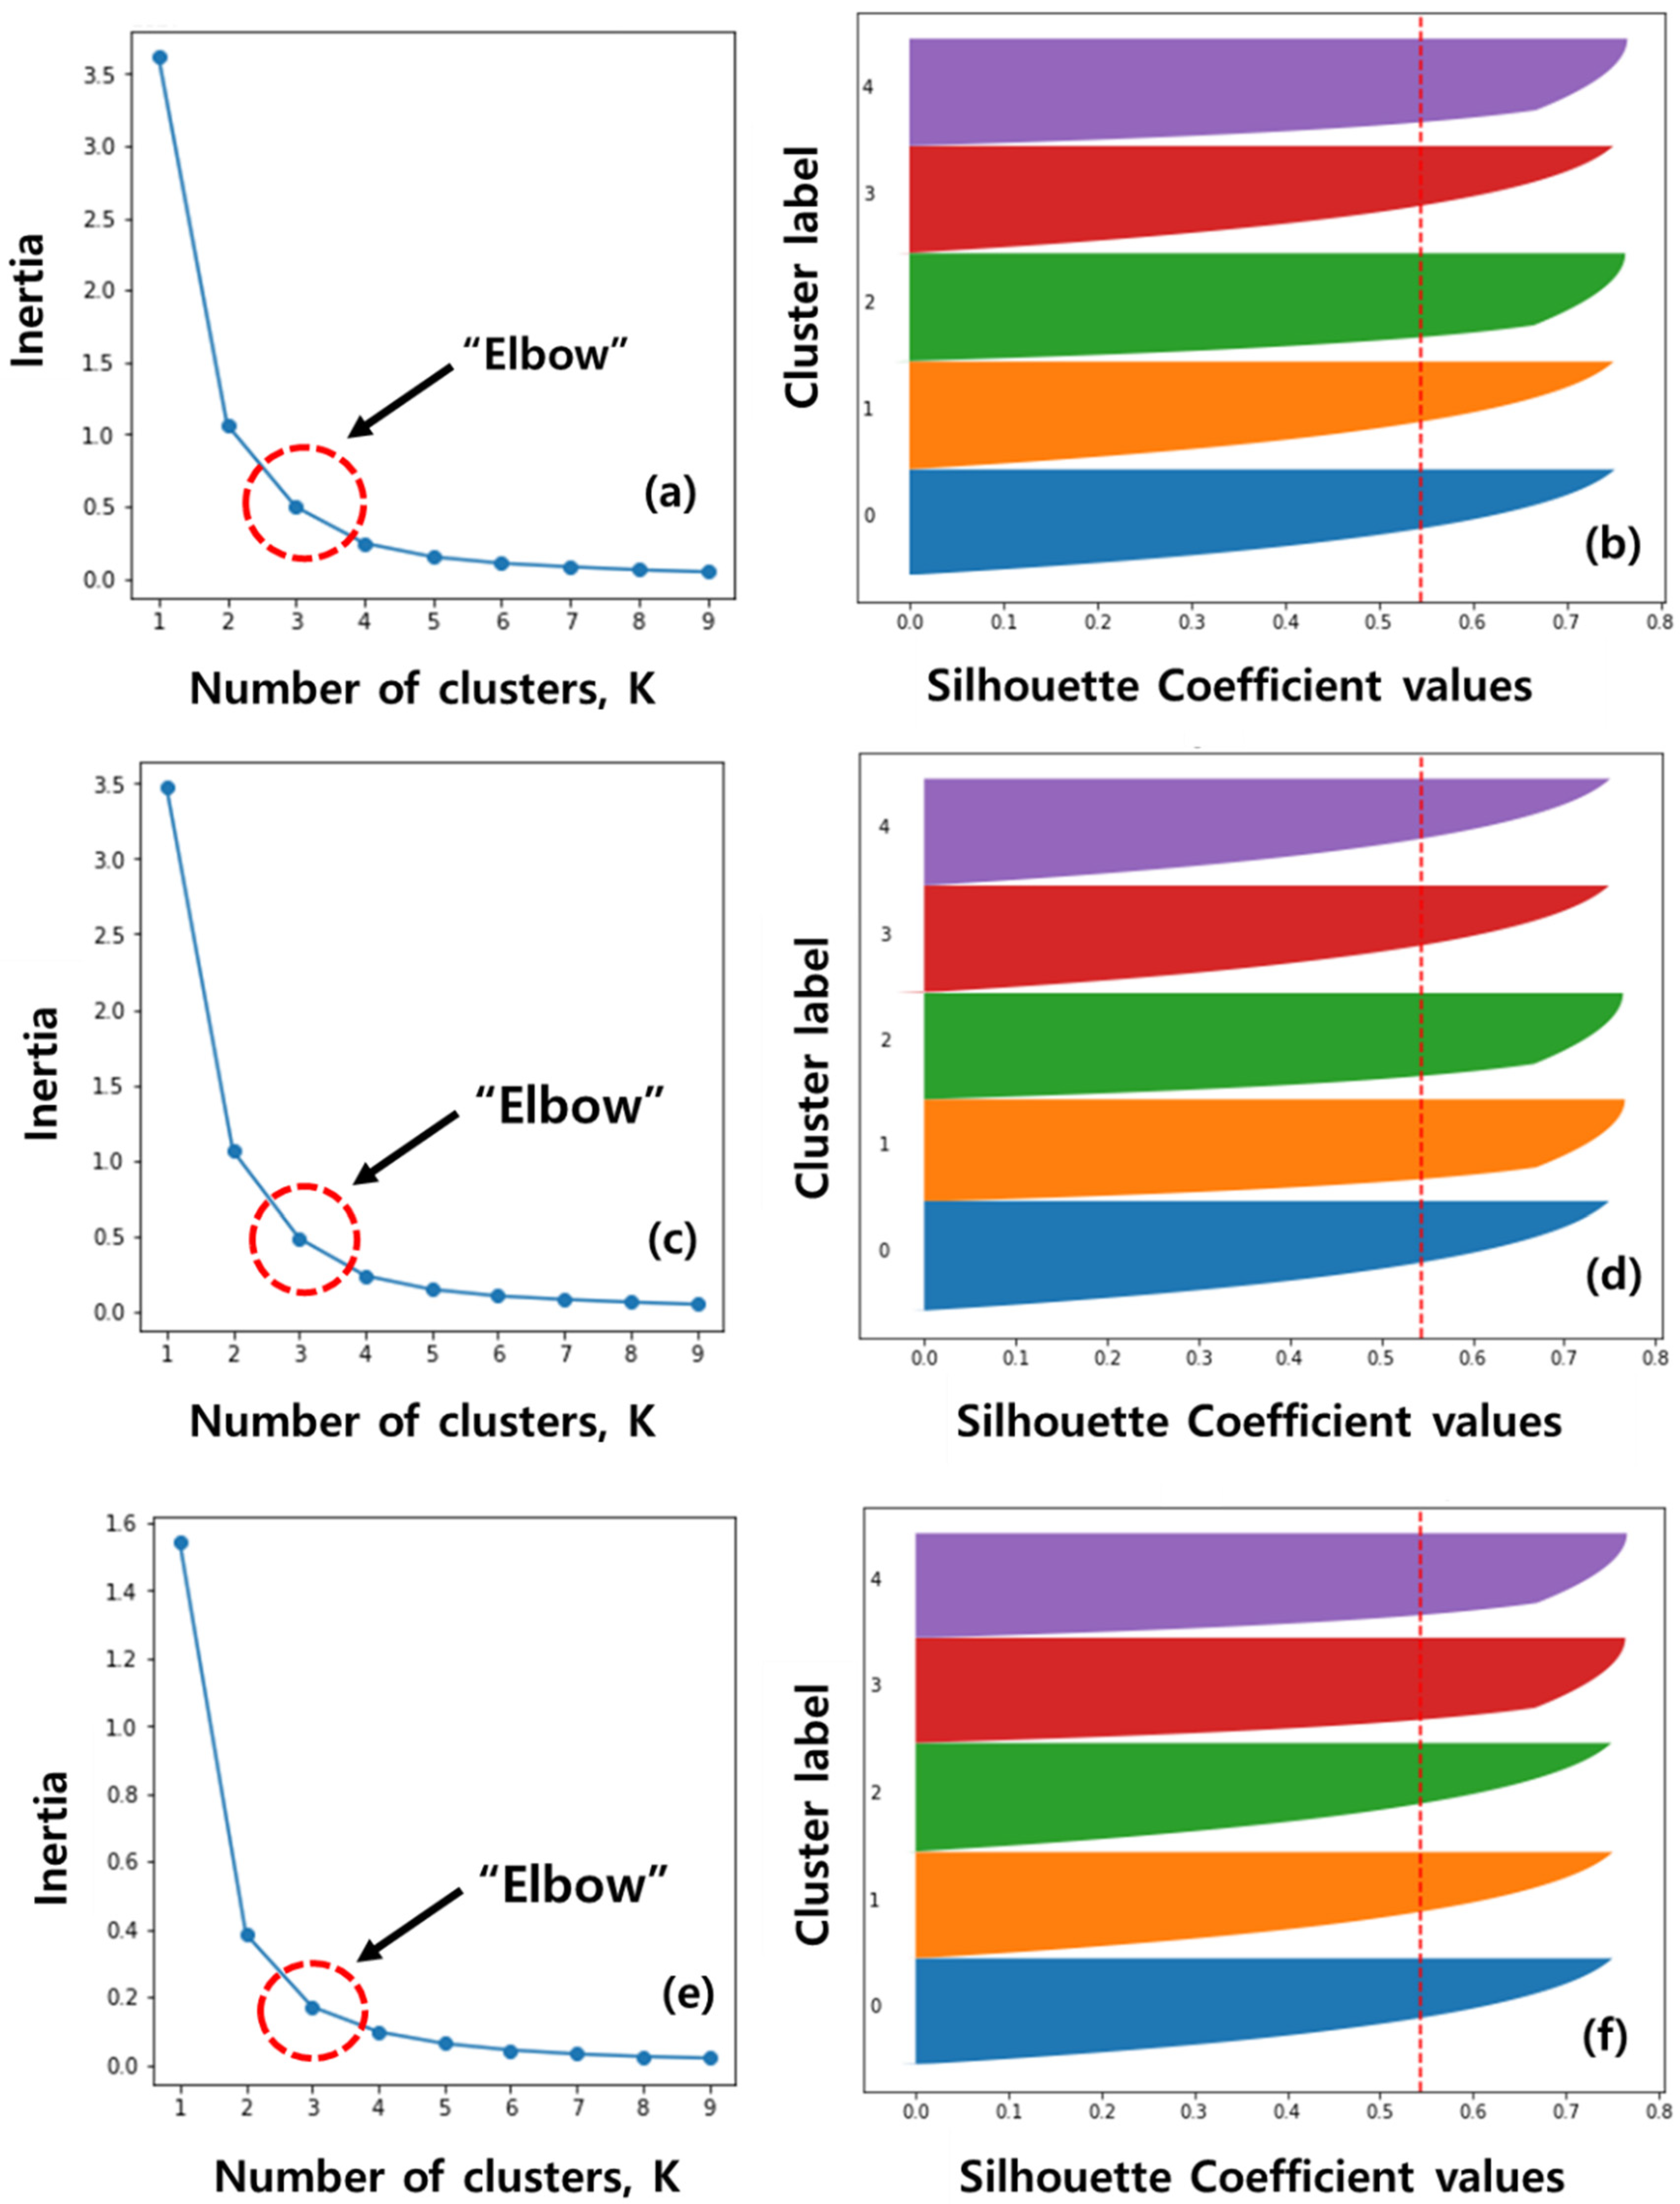
The determination of an optimal count of clusters crucially impacts the efficacy of unsupervised learning. Employing the elbow method facilitates the identification of the most suitable number of clusters for robust analysis. In our study, employing the elbow method revealed an optimal K value of 3. Figure 6 visually illustrates a marked decrease in variance from two to three clusters, prompting the selection of K = 3 for our dataset. However, we further conducted silhouette analysis to explore K values with five clusters.
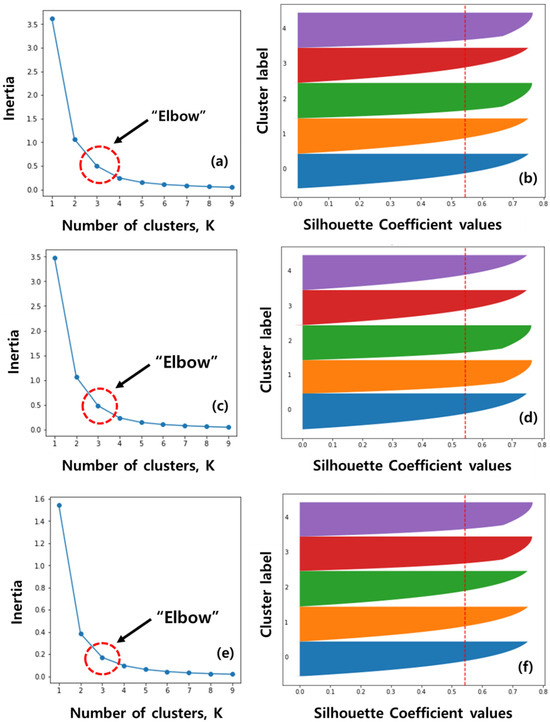
Figure 6.
Elbow graph and silhouette diagram for selecting the optimal K number: (a) elbow and (b) silhouette of air flow rate 10 L/min; (c) elbow and (d) silhouette of air flow rate 5 L/min; (e) elbow and (f) silhouette of air flow rate 2.5 L/min.
The silhouette method supports a reliable means to assess the appropriateness of cluster numbers. The silhouette coefficient (SC) characterizes the degree of cohesion within clusters, with values ranging between −1 and 1 [47]. Negative SC values indicate poor clustering, while positive values suggest well-defined clusters. SC equaling zero signifies a mismatch between data points and their assigned clusters [48]. Figure 6 depicts the SC values for individual data points across clusters, alongside the average SC represented by the red line. Valid clustering is indicated when the average SC aligns closely with the SC of each group. A threshold of 0.5 or higher for the average SC is typically indicative of satisfactory clustering [49]. Across all air flow rates, the average SC consistently exceeded 0.5, with uniform SC values observed within each group. Consequently, a K value of 5 was deemed appropriate across all air flow rates.
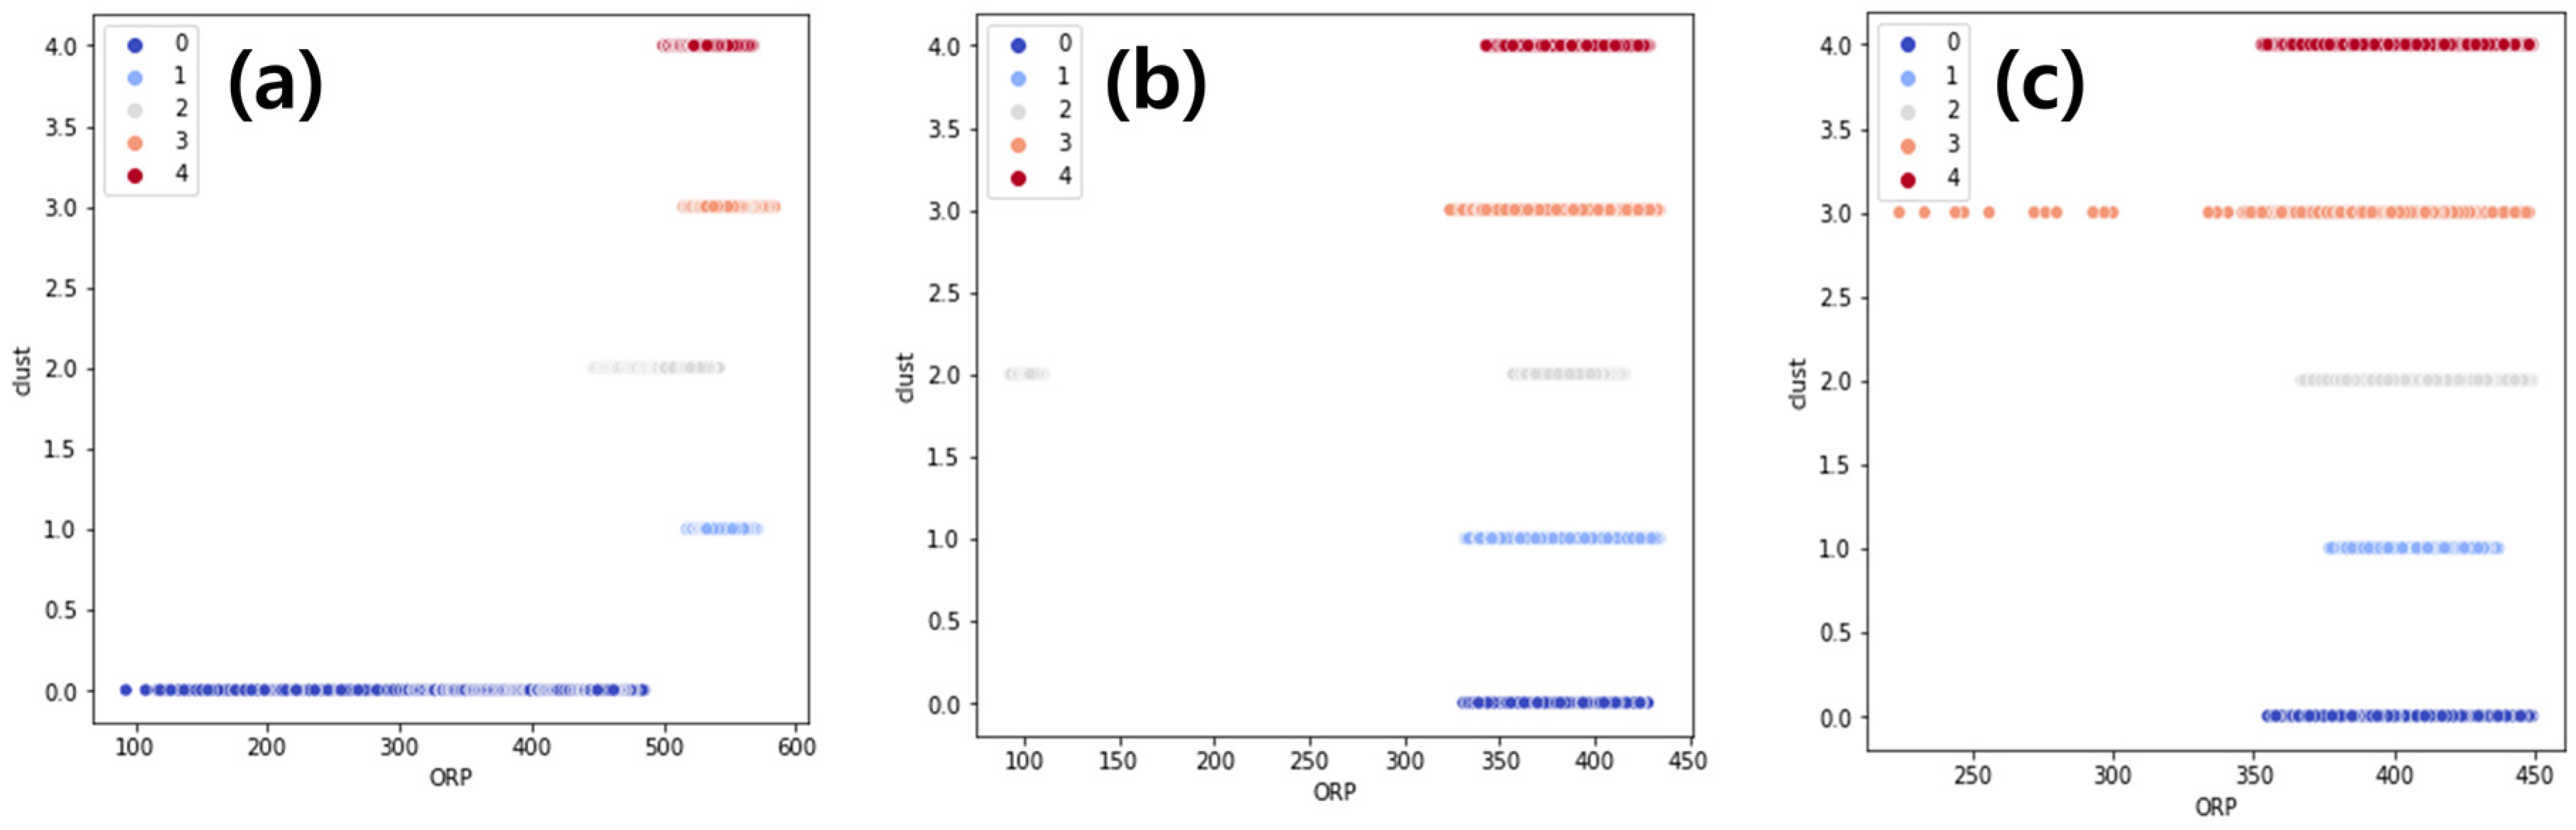
The cluster analysis yielded five distinct groups, encompassing 99% to 100% of the dataset across all air flow rates. The distribution of cases within clusters varied, comprising 20% of cases at 2.5 L/min and ranging from 9% to 31% at 5 L/min and 10 L/min. Additionally, ORP exhibited a consistent upward trend across all air rates over time.
Figure 7 illustrates the fluctuation of individual principal clusters as a function of ORP. Also, it demonstrates the distribution of the corresponding ORP for each cluster at the same time. Within the framework of linear regression analysis aimed at elucidating the relationship between TOC and ORP, these ORP clusters play an independent parameter role in predicting the dependent variable value of TOC.

Figure 7.
Visualization of ORP clustering results using principal component analysis (PCA): (a) air flow rate of 10 L/min; (b) air flow rate of 5 L/min; (c) air flow rate of 2.5 L/min.
3.3.2. Supervised Learning in Machine Learning
The investigation into the relationship between ORP and TOC concentration utilized K-means clustering, linking TOC concentration with ORP values. Table 3 provides a summary of the linear correlation between TOC and ORP. To elucidate this association, ORP in SDBS was used as the independent variable, while TOC concentration in SDBS was designated as the dependent variable across all air flow rates. Statistical significance was determined by a p-value below 0.05, which was consistently observed in our study, affirming its validity.
Table 3.
Linear regression models to predict TOC as a function of ORP at each air flow rate. The coefficient of determination (R2), p-value, and SE demonstrate the accuracy and precision of the models.
In particular, for the regression analysis model conducted at an air flow rate of 5 L/min, an R2 value of 0.9 was obtained. This indicates that this model explains 90% of the variability in TOC concentrations. Similarly, the model at 10 L/min exhibited an R2 value of 0.8, followed by the 2.5 L/min group with an R2 value of 0.7. These findings underscore the robustness of the regression models in explaining variations in TOC concentrations across different air flow rates.
The proposed strategic management for the CP, rooted in the correlation between ORL and TOC, promises cost-effectiveness. This management strategy advocates for activating CP operations only when forecasted effluent quality deterioration is anticipated. Consequently, it facilitates a notable reduction in the operational duration of CP as a post-treatment measure. Additionally, it enables precise control over the air flow rate of CP, a significant component contributing to the management costs of publicly owned treatment work.
4. Conclusions
The CP process demonstrates that the variations in the generation of OH radicals depend on the air flow rate, as evidenced by OH radical quantification. Furthermore, we observed corresponding fluctuations in SDBS removal efficiency. This study validates that employing machine learning facilitates the statistically predictable performance of the CP process. K-mean cluster analysis was used to determine the ORP trend, revealing a consistent increase across all air flow rates during SDBS removal. Simple linear regression analysis of ORP and TOC demonstrated the predictive capability of ORP for TOC concentration (R2 = 0.7–0.9, p < 0.05). Additionally, we established that controlling the air flow rate in CP is feasible through TOC concentration prediction via ORP monitoring. In summary, the proposed simple linear regression-based TOC prediction model effectively forecasts TOC levels based on ORP values during CP operations. This predictive capability enables cost-effective CP operation by controlling the air flow rate of CP through ORP monitoring.
Author Contributions
Conceptualization, H.-W.K.; methodology, Y.L. and I.L.; validation, H.-J.K.; formal analysis, Y.L. and I.L.; investigation, Y.L. and I.L.; resources, Y.L.; data curation, Y.L. and H.-J.K.; writing—original draft preparation, Y.L., I.L. and H.-J.K.; writing—review and editing, Y.L. and I.L.; visualization, H.-W.K.; supervision, H.-W.K.; project administration, I.L. and H.-W.K.; funding acquisition, I.L. and H.-W.K. All authors have read and agreed to the published version of the manuscript.
Funding
This research was supported by a grant (22-04-10-16-09) from the 2022 Research Development Program funded by the Jeonbuk Green Environment Center. This work was also supported by the National Research Foundation of Korea (NRF) grant funded by the Korea government (MSIT) (No. 2022R1F1A1073198). This work is financially supported by the Korea Ministry of Environment (MOE) as ⌈WastetoEnergy—Recycling Human Resource Development Project (YL-WE-23-001)⌋. This work was supported by the R&D grant of the Jeollabukdo business agency.
Data Availability Statement
Data are contained within the article.
Conflicts of Interest
The authors declare no conflicts of interest.
References
- Garrido-Cardenas, J.A.; Esteban-García, B.; Agüera, A.; Sánchez-Pérez, J.A.; Manzano-Agugliaro, F. Wastewater treatment by advanced oxidation process and their worldwide research trends. Int. J. Environ. Res. Public Health 2020, 17, 170. [Google Scholar] [CrossRef]
- Oturan, M.A.; Aaron, J.-J. Advanced oxidation processes in water/wastewater treatment: Principles and applications. A review. Crit. Rev. Environ. Sci. Technol. 2014, 44, 2577–2641. [Google Scholar] [CrossRef]
- Sun, H.; He, F.; Choi, W. Production of reactive oxygen species by the reaction of periodate and hydroxylamine for rapid removal of organic pollutants and waterborne bacteria. Environ. Sci. Technol. 2020, 54, 6427–6437. [Google Scholar] [CrossRef] [PubMed]
- Boczkaj, G.; Fernandes, A. Wastewater treatment by means of advanced oxidation processes at basic pH conditions: A review. Chem. Eng. J. 2017, 320, 608–633. [Google Scholar] [CrossRef]
- Sarangapani, C.; Misra, N.; Milosavljevic, V.; Bourke, P.; O’Regan, F.; Cullen, P. Pesticide degradation in water using atmospheric air cold plasma. J. Water Process Eng. 2016, 9, 225–232. [Google Scholar] [CrossRef]
- Aggelopoulos, C.A. Recent advances of cold plasma technology for water and soil remediation: A critical review. Chem. Eng. J. 2022, 428, 131657. [Google Scholar] [CrossRef]
- Gururani, P.; Bhatnagar, P.; Bisht, B.; Kumar, V.; Joshi, N.C.; Tomar, M.S.; Pathak, B. Cold plasma technology: Advanced and sustainable approach for wastewater treatment. Environ. Sci. Pollut. Res. 2021, 28, 65062–65082. [Google Scholar] [CrossRef] [PubMed]
- Kim, H.-J.; Won, C.-H.; Hong, Y.-P.; Lee, I.H.; Kim, H.-W. Energy-effective elimination of harmful microcystins by a non-thermal plasma process. Chemosphere 2021, 284, 131338. [Google Scholar] [CrossRef]
- Gao, Y.; Francis, K.; Zhang, X. Review on formation of cold plasma activated water (PAW) and the applications in food and agriculture. Food Res. Int. 2022, 157, 111246. [Google Scholar] [CrossRef] [PubMed]
- Yu, R.-F.; Chen, H.-W.; Cheng, W.-P.; Lin, Y.-J.; Huang, C.-L. Monitoring of ORP, pH and DO in heterogeneous Fenton oxidation using nZVI as a catalyst for the treatment of azo-dye textile wastewater. J. Taiwan Inst. Chem. Eng. 2014, 45, 947–954. [Google Scholar] [CrossRef]
- Suslow, T.V. Oxidation-Reduction Potential (ORP) for Water Disinfection Monitoring, Control, and Documentation; University of California, Division of Agriculture and Natural Resources: Davis, CA, USA, 2004. [Google Scholar]
- Tanwar, P.; Nandy, T.; Ukey, P.; Manekar, P. Correlating on-line monitoring parameters, pH, DO and ORP with nutrient removal in an intermittent cyclic process bioreactor system. Bioresour. Technol. 2008, 99, 7630–7635. [Google Scholar] [CrossRef]
- Son, C.-Y.; Kang, J.-K.; Lee, Y.-J.; Lee, C.-G.; Kim, J.; Park, S.-J.; Cho, Y.-M.; Shin, G.-A. Degradation of residual dyes in actual textile wastewater using UV/H 2 O 2: Evaluation of the impact of operating variables through multi-layer perceptron analysis. Environ. Eng. Res. 2024, 29, 230716. [Google Scholar] [CrossRef]
- Mahesh, B. Machine learning algorithms-a review. Int. J. Sci. Res. 2020, 9, 381–386. [Google Scholar]
- Aytaç, E. Unsupervised learning approach in defining the similarity of catchments: Hydrological response unit based k-means clustering, a demonstration on Western Black Sea Region of Turkey. Int. Soil Water Conserv. Res. 2020, 8, 321–331. [Google Scholar] [CrossRef]
- Bonaccorso, G. Machine Learning Algorithms; Packt Publishing Ltd.: Birmingham, UK, 2017. [Google Scholar]
- Osisanwo, F.; Akinsola, J.; Awodele, O.; Hinmikaiye, J.; Olakanmi, O.; Akinjobi, J. Supervised machine learning algorithms: Classification and comparison. Int. J. Comput. Trends Technol. 2017, 48, 128–138. [Google Scholar]
- Rauf, A.; Sheeba, S.M.; Khusro, S.; Javed, H. Enhanced k-mean clustering algorithm to reduce number of iterations and time complexity. Middle East J. Sci. Res. 2012, 12, 959–963. [Google Scholar]
- Likas, A.; Vlassis, N.; Verbeek, J.J. The global k-means clustering algorithm. Pattern Recognit. 2003, 36, 451–461. [Google Scholar] [CrossRef]
- Tang, R.; Fong, S.; Yang, X.-S.; Deb, S. Integrating nature-inspired optimization algorithms to K-means clustering. In Proceedings of the Seventh International Conference on Digital Information Management (ICDIM 2012), Macao, China, 22–24 August 2012; pp. 116–123. [Google Scholar]
- Sinaga, K.P.; Yang, M.-S. Unsupervised K-means clustering algorithm. IEEE Access 2020, 8, 80716–80727. [Google Scholar] [CrossRef]
- Zada, I.; Ali, S.; Khan, I.; Hadjouni, M.; Elmannai, H.; Zeeshan, M.; Serat, A.M.; Jameel, A. Performance evaluation of simple K-mean and parallel K-mean clustering algorithms: Big data business process management concept. Mob. Inf. Syst. 2022, 2022, 1277765. [Google Scholar] [CrossRef]
- Ezugwu, A.E.; Ikotun, A.M.; Oyelade, O.O.; Abualigah, L.; Agushaka, J.O.; Eke, C.I.; Akinyelu, A.A. A comprehensive survey of clustering algorithms: State-of-the-art machine learning applications, taxonomy, challenges, and future research prospects. Eng. Appl. Artif. Intell. 2022, 110, 104743. [Google Scholar] [CrossRef]
- Ahmad, A.; Dey, L. A k-mean clustering algorithm for mixed numeric and categorical data. Data Knowl. Eng. 2007, 63, 503–527. [Google Scholar] [CrossRef]
- Tan, X.; Fang, M.; Chen, C.; Yu, S.; Wang, X. Counterion effects of nickel and sodium dodecylbenzene sulfonate adsorption to multiwalled carbon nanotubes in aqueous solution. Carbon 2008, 46, 1741–1750. [Google Scholar] [CrossRef]
- Rebello, S.; Asok, A.K.; Mundayoor, S.; Jisha, M. Surfactants: Toxicity, remediation and green surfactants. Environ. Chem. Lett. 2014, 12, 275–287. [Google Scholar] [CrossRef]
- Han, W.; Tan, J.; Peng, L.; Liu, L.; Zhou, X.; Zhang, W.; Shi, B. Ecotoxicity and micellization behavior of anionic surfactant sodium dodecylbenzene sulfonate (SDBS) and its mixtures with nonionic surfactant fatty alcohol-polyoxyethylene ether (AEO). Aquat. Toxicol. 2019, 216, 105313. [Google Scholar] [CrossRef] [PubMed]
- Olajire, A.A. Review of ASP EOR (alkaline surfactant polymer enhanced oil recovery) technology in the petroleum industry: Prospects and challenges. Energy 2014, 77, 963–982. [Google Scholar] [CrossRef]
- Badamasi, Y.A. The working principle of an Arduino. In Proceedings of the 2014 11th International Conference on Electronics, Computer and Computation (ICECCO), Abuja, Nigeria, 29 September–1 October 2014; pp. 1–4. [Google Scholar]
- Nayyar, A.; Puri, V. A review of Arduino board’s, Lilypad’s & Arduino shields. In Proceedings of the 2016 3rd International Conference on Computing for Sustainable Global Development (INDIACom), New Delhi, India, 16–18 March 2016; pp. 1485–1492. [Google Scholar]
- Arduino LLC. Arduino. Available online: https://search.iczhiku.com/paper/TFzDJhGhd6VMaDsI.pdf (accessed on 21 February 2024).
- Ismailov, A.S.; Jo‘Rayev, Z.B. Study of arduino microcontroller board. Sci. Educ. 2022, 3, 172–179. [Google Scholar]
- Abdullahi, S.I.; Habaebi, M.H.; Gunawan, T.S.; Islam, M.R. Miniaturized Water Flow and Level Monitoring System for Flood Disaster Early Warning. In Proceedings of the IOP Conference Series: Materials Science and Engineering; IOP Publishing: Bristol, UK, 2017; p. 012019. [Google Scholar]
- Badmus, K.; Tijani, J.; Eze, C.P.; Fatoba, O.; Petrik, L.F. Quantification of radicals generated in a sonicator. Anal. Bioanal. Chem. Res. 2016, 3, 139–147. [Google Scholar]
- Villeneuve, L.; Alberti, L.; Steghens, J.-P.; Lancelin, J.-M.; Mestas, J.-L. Assay of hydroxyl radicals generated by focused ultrasound. Ultrason. Sonochem. 2009, 16, 339–344. [Google Scholar] [CrossRef] [PubMed]
- Liu, X.; Xiao, L.; Zhang, Y.; Sun, H. Significantly enhanced piezo-photocatalytic capability in BaTiO3 nanowires for degrading organic dye. J. Mater. 2020, 6, 256–262. [Google Scholar] [CrossRef]
- Kanazawa, S.; Furuki, T.; Nakaji, T.; Akamine, S.; Ichiki, R. Measurement of OH radicals in aqueous solution produced by atmospheric-pressure LF plasma jet. Int. J. Plasma Environ. Sci. Technol. 2012, 6, 166–171. [Google Scholar]
- Sahni, M.; Locke, B.R. Quantification of hydroxyl radicals produced in aqueous phase pulsed electrical discharge reactors. Ind. Eng. Chem. Res. 2006, 45, 5819–5825. [Google Scholar] [CrossRef]
- Li, H.; Yang, Y.; Gao, J.; Li, X.; Zhou, Z.; Wang, N.; Du, P.; Zhang, T.; Feng, J. Degradation of sodium dodecyl benzenesulfonate by vacuum ultraviolet irradiation. J. Water Process Eng. 2020, 34, 101172. [Google Scholar] [CrossRef]
- Marutho, D.; Handaka, S.H.; Wijaya, E. The determination of cluster number at k-mean using elbow method and purity evaluation on headline news. In Proceedings of the 2018 International Seminar on Application for Technology of Information and Communication, Semarang, Indonesia, 21–22 September 2018; pp. 533–538. [Google Scholar]
- Yu, S.I.; Rhee, C.; Cho, K.H.; Shin, S.G. Comparison of different machine learning algorithms to estimate liquid level for bioreactor management. Environ. Eng. Res. 2023, 28, 220037. [Google Scholar] [CrossRef]
- Fang, X.; Mark, G.; von Sonntag, C. OH radical formation by ultrasound in aqueous solutions Part I: The chemistry underlying the terephthalate dosimeter. Ultrason. Sonochem. 1996, 3, 57–63. [Google Scholar] [CrossRef]
- Kanazawa, S.; Furuki, T.; Nakaji, T.; Akamine, S.; Ichiki, R. Application of chemical dosimetry to hydroxyl radical measurement during underwater discharge. J. Phys. Conf. Ser. 2013, 418, 012102. [Google Scholar] [CrossRef]
- Beltran, F.J.; Garcia-Araya, J.F.; Alvarez, P.M. Sodium dodecylbenzenesulfonate removal from water and wastewater. 1. Kinetics of decomposition by ozonation. Ind. Eng. Chem. Res. 2000, 39, 2214–2220. [Google Scholar] [CrossRef]
- Méndez-Díaz, J.; Sánchez-Polo, M.; Rivera-Utrilla, J.; Bautista-Toledo, M. Effectiveness of different oxidizing agents for removing sodium dodecylbenzenesulphonate in aqueous systems. Water Res. 2009, 43, 1621–1629. [Google Scholar] [CrossRef] [PubMed]
- Yuan, C.; Yang, H. Research on K-value selection method of K-means clustering algorithm. J 2019, 2, 226–235. [Google Scholar] [CrossRef]
- Kodinariya, T.M.; Makwana, P.R. Review on determining number of Cluster in K-Means Clustering. Int. J. 2013, 1, 90–95. [Google Scholar]
- Shi, C.; Wei, B.; Wei, S.; Wang, W.; Liu, H.; Liu, J. A quantitative discriminant method of elbow point for the optimal number of clusters in clustering algorithm. Eurasip J. Wirel. Commun. Netw. 2021, 2021, 31. [Google Scholar] [CrossRef]
- Dalmaijer, E.S.; Nord, C.L.; Astle, D.E. Statistical power for cluster analysis. BMC Bioinform. 2022, 23, 205. [Google Scholar] [CrossRef] [PubMed]
Disclaimer/Publisher’s Note: The statements, opinions and data contained in all publications are solely those of the individual author(s) and contributor(s) and not of MDPI and/or the editor(s). MDPI and/or the editor(s) disclaim responsibility for any injury to people or property resulting from any ideas, methods, instructions or products referred to in the content. |
© 2024 by the authors. Licensee MDPI, Basel, Switzerland. This article is an open access article distributed under the terms and conditions of the Creative Commons Attribution (CC BY) license (https://creativecommons.org/licenses/by/4.0/).