Article

Feasibility Study of Material Deformation and Similarity of Spatial Characteristics of Standard Coal Rocks

1
Heilongjiang Ground Pressure and Gas Control in Deep Mining Key Laboratory, Heilongjiang University of Science and Technology, Harbin 150022, China
2
College of Mining Engineering of Hust, Heilongjiang University of Science and Technology, Harbin 150022, China
*
Author to whom correspondence should be addressed.
Processes 2024, 12(3), 454; https://doi.org/10.3390/pr12030454
Submission received: 15 January 2024 / Revised: 16 February 2024 / Accepted: 20 February 2024 / Published: 23 February 2024
(This article belongs to the Topic New Advances in Mining Technology)

Abstract

:
The comparison between similar materials and original coal rock is the basis for similar simulation experiments in coal mines. The differences in mechanical properties, acoustic characteristics, and damage laws between similar materials and the original coal rock are of great significance for similar simulation research, to reveal objective laws. First, materials similar to coal rock with similar theoretical ratios were taken as the object of research, and the sand–cement ratio, the carbon paste ratio, and the water content were determined by multivariate linear regression to accurately match the ratios. Second, by using acoustic emission and digital scattering technology to explore the acoustic law, deformation characteristics, and spatial feature similarities of the materials similar to coal rock, the acoustic emission evolution law of the original rock was found to be the same as that of the similar materials. Digital scattering was able to describe the localization of strain in the similar materials, and the correlation between the overall deformation and the local deformation was explored. This indicates that materials similar to coal rock can effectively simulate the deformation of actual coal rocks. Lastly, these materials were found to allow effectively simulating the deformation characteristics and spatial properties of actual coal rock, which provides an important experimental means and method for similar research in the field of coal rock engineering.

1. Introduction

As a typical non-homogeneous material, the deformation properties and spatial characteristics of coal rock have important impacts on coal mining and coalfield geological protection and have a wide range of applications in the fields of energy, coal chemistry, and the environment. However, due to the complexity and diversity of coal rocks, it is often difficult and risky to directly conduct research on coal rock engineering locations, and mining and utilization processes often face severe technical challenges. In order to better understand the mechanical properties and deformation mechanisms of coal rock, to provide methods and bases for feasibility studies for related engineering, and to bridge the gap between actual engineering and experimental conditions, the study of materials similar to coal rock has become an important tool and has attracted widespread attention. Due to a lack of sampling conditions or an inability to prepare standard samples, it is necessary to carry out comparative studies on the physical and mechanical properties of similar samples and coal rock samples. It is necessary to master the mechanical properties of similar materials in the process of mine simulation experiments. Both of these needs indicate that it is of great significance to study the fracture characteristics and mechanical properties of similar materials.
Acoustic emission technology is an important means of characterizing the damage and precursor information of materials, and the digital scattering method is widely used in characterizing the full-field deformation damage of materials, and both methods have achieved fruitful results in the study of coal rock bodies. With the maturity of similarity theory and methods in underground engineering, scholars have adopted acoustic emission technology and digital scattering methods for similar materials and similarity simulations. Among them, in terms of materials similar to coal rock, the digital scattering technique has been utilized to study the uniaxial compression deformation of similar materials [1,2], rockburst propensity [3], coplanar bifurcation tensile [4], multimineral main perturbation loading [5], and Brazilian discs with filled and unfilled fissures [6]; the acoustic emission technique has been utilized to study the damage of prefabricated unifurcated sandstones with similar materials, the damage of uniaxial compression deformation [7], different ratios of the event and energy evolution laws of materials [8], true triaxial loading and unloading [9], uniaxial damage evolution [10], and the mechanical properties of combined coal rocks [11]. In terms of similar simulations, digital technology has been used to study the deformation damage of overburdened rock layers [1], surface subsidence [12], the excavation of oversized chamber groups [13], shock wave tunnel damage [14], protective layer mining [15], overburdened three-zone evolution [16], overburdened rock movement at different inclinations of mining [17], fissure evolution [18], the dynamic damage of shock-loaded tunnels [19], and seismic weak-face slope sliding [20]; and acoustic emission technology has been used to study the excavation of oversized section chamber groups [13], rockburst damage [19], and coal seam drilling instability [21]. Although scholars have carried out studies on similar materials and similar simulations using digital scattering and acoustic emission, more systematic studies combining the two have rarely been reported. Therefore, the authors intended to start from a feasibility analysis of digital scattering and acoustic emissions of similar materials, first, to study the acoustic emission evolution law and the change rule of the deformation field of digital scattering characterization in the loading and damage process of similar materials in proportion, and then to monitor the unloading process under complex stress paths by using digital scattering and acoustic emissions, as well as to analyze the deformation field and acoustic field evolution law of the enclosing rock during the excavation process of a roadway under elasticity, plasticity, and post-peak stress levels. The deformation field and acoustic field evolution law were analyzed.
Materials similar to coal rock are studied with the help of synthetic materials to simulate the physical properties and mechanical behaviors of real coal rocks, in order to achieve controllable observations and studies under laboratory conditions. The similar materials research method has been widely used in various engineering fields, such as rock mechanics, geotechnics, and concrete materials. In recent decades, there have been various research reports on materials similar to coal rock, mainly focusing on the mechanical properties of the materials, such as their compressive strength and deformation properties [22,23,24]. However, there have been relatively few studies on similar materials in terms of deformation properties and spatial characteristics of coal rocks, which is mainly due to the difficulty in modelling and reproducing the spatial distribution and variability caused by the inhomogeneity of coal rocks. Feasibility studies on this area have not been explored in depth. Therefore, there is a need for in-depth studies on the feasibility of coal rock similarity materials, in terms of spatial characteristics and their similarity to real coal rocks.
Based on this, the authors used orthogonal tests to obtain similar simulated materials to coal and rock, combined acoustic emission and digital scattering techniques to distinguish the mechanical behavior of coal and rock, and studied the deformation characteristics and spatial feature similarity of the similar materials coal and rock. Through an in-depth study of the deformation and spatial feature similarity of coal rock similar materials, we can further understand the mechanical behavior and engineering response law of coal rock, which will provide a more scientific and reliable basis for the design, construction, and monitoring of coal-rock-related projects. The research results of this paper can predict the deformation and failure caused by coal excavation, which is of great significance for mine disaster prevention.

2. Principles and Methods of Similar Experiments

2.1. Similarity Principle

A similar system is characterized by its structure, size, and shape having similarities. The analysis of a system reveals that there is a certain correspondence in its law of change. This means that if the structural model and the prototype can maintain this systematic similarity, the experimental results obtained from the model should align with the experimental results of the prototype. This concept underlies the three major laws of similar systems [25].
(1)
First theorem of similarity [26]
In 1686, Isaac Newton formulated the first theorem of similarity, which focuses on the consistency of the objective laws derived from similar systems. This is mathematically expressed as a similarity index of 1. This was demonstrated by the French scholar Beltrán in 1848. The first theorem of similarity reveals the essential characteristics of similar systems. It involves studying the similarity constants of physical quantities in a system to calculate similarity quasi-numbers.
(2)
Second Theorem of Similarity [27]
In 1911, the Russian scientist Feitelman first deduced the second law of similarity, also known as the “π theorem”, which can be used to obtain the physical equations of similar systems using similar quasi-numerical equations synthesized, where the similarity of the phenomena can be seen in the consistency of the equations, due to all the equations of the cause of each of the items being chi-squared, in which the physical equations φ i = ( a 1 , a 2 , , a k ) = 0 can be converted into an unfactored equation.
F i ( Π 1 , Π 2 , , Π k , ) = 0
where Π 1 , Π 2 ,   Π k —similar quasi-numbers.
It is composed of Π 1 , Π 2     , similarity quasi-numbers. The similarity quasi-count can be obtained through similar modeling tests, and thus the relationship between physical quantities in the prototype can be obtained.
(3)
The Third Theorem of Similarity
The third theorem of similarity was proposed in 1930 by Kirpichov and Guhlman. It states that, in geometric systems with the same or similar characteristics of a phenomenon, when the system’s geometric properties, physical properties, boundary conditions, and starting conditions are similar, the similarity quasi-counts consisting of single-valued conditional physical quantities are equal. This indicates that the phenomena must exhibit similarity.

2.2. Similarity Conditions and Similarity Ratios of Models

Similarity simulation, as an effective method for studying the characteristics of peripheral rock rupture and stress-displacement evolution caused by tunnel excavation, is a well-developed similarity theoretical system. Similarity simulation experiments should be conducted to ensure similarity in stress, geometry, material, time, and other aspects. The ratio of the mining roadway excavation prototype to the reduced indoor similar model is called the similarity ratio. The loading table can be filled with actual material with dimensions of 1000 mm × 1000 mm × 200 mm (length × width × height). To study the movement and damage patterns of the perimeter rock induced by excavation and unloading of the roadway under complex stress paths, a similarity simulation was conducted. It was essential to simulate the perimeter rock influence area of the -500 backwind stone door in the Dongguang first mining area. This area features a straight-walled circular arch with a round arch. The roadway is in the shape of a straight wall and round arch, and the width and height of the roadway are 4000 mm and 3500 mm, respectively. The range of the simulated underground space was 50 m × 50 m × 10 m, and the simulated range was larger than 12.2 times the roadway, which met the requirement of the influence range of the excavation, and the specific correlation and the basis of calculation were as follows:
where C L is the geometric similarity ratio, and where the subscripts p and m denote the prototype and model.
C L = δ p δ m = L p L m = 50 1 = 50
where
  • C L —geometric similarity ratio;
  • δ p —density of rock sample prototypes;
  • δ m —density of rock sample models;
  • L p —length of rock sample prototype;
  • L m —length of rock sample model.
Material similarity mainly refers to the resemblance between the model material in physical mechanics and the coal rock at the site, which significantly impacts the damage range, stress, and deformation distribution in the roadway excavation process. The key parameters include bulk weight, stress, elastic modulus, and Poisson’s ratio, as the deformation characteristics of the prototype and the model are consistent. The Poisson’s ratio, C μ , is similar to 1.
{ C σ = σ p σ m C E = E p E m C γ = γ p γ m C μ = μ p μ m
where
  • C σ —stress similarity ratio;
  • C E —similar ratio of modulus of elasticity;
  • C γ —similarity ratio of capacity to weight;
  • γ p —tolerance of rock sample prototypes;
  • γ m —tolerance of the rock sample model;
  • E p —modulus of elasticity of prototype rock samples;
  • E m —modulus of elasticity of rock sample model;
  • σ p —stress in rock sample prototypes;
  • σ m —stresses in rock sample models;
  • C μ —Poisson’s ratio similarity ratio.
The East Defence Coal Mine is dominated by sandstone with thin coal seams. The bulk density of coarse sandstone, medium sandstone, fine sandstone, siltstone, and coal was determined in accordance with the National Standard Specification, and the density of coal was 1.34 g/cm3, the density of coarse sandstone was 2.35 g/cm3, the density of medium sandstone was 2.44 g/cm3, the density of fine sandstone was 2.58 g/cm3, and the density of siltstone was 2.69 g/cm3. Due to the close density of sandstone, the average capacity was 25.69 g/cm3. The density was 2.58 g/cm3, and the siltstone density was 2.69 g/cm3, due to the density of sandstone being close to the average bulk weight of 25.2 KN/m3. The test used fine sand with a particle size less than 0.5 mm as aggregate, with gypsum and lime as cement, where the density of dried bulk particles of sand was 1.45 g/cm3, the density of gypsum was 2.3 g/cm3, and the density of lime powder was 3.25 g/cm3, while the average bulk weight of the formulated similar materials was 18.5 KN/m3, and the preliminary calculation of the bulk weight similarity ratio was
C γ = γ p γ m = 25.2 18.5 = 1.4
where
  • C γ —similarity ratio of capacity to weight;
  • γ p —tolerance of rock sample prototypes;
  • γ m —tolerance of the rock sample model.
And the stress similarity ratio was calculated as
C σ = σ p σ m = C γ C L = 50 × 1.4 = 70
where
  • C σ —stress similarity ratio;
  • σ p —stress in rock sample prototypes;
  • σ m —stresses in rock sample models;
  • C γ —similarity ratio of capacity to weight;
  • C L —geometric similarity ratio.
The average value of modulus of elasticity of the sandstone was determined to be 24.83 GPa through indoor experiments, the average value of the modulus of elasticity of the similar materials was determined to be 0.21 GPa through uniaxial compression experiments, and the similarity ratio of modulus of elasticity was calculated as follows:
C E = E p E m = 18.83 0.21 = 90
where
  • C E —similar ratio of modulus of elasticity;
  • E p —modulus of elasticity of prototype rock samples;
  • E m —modulus of elasticity of rock sample model.
The motion similarity ratio mainly included the damage process of the surrounding rock caused by unloading of the roadway excavation, which mainly included gravity acceleration and unloading time, and the similarity ratio is
{ C g = g p g m C t = t p t m
where
  • C g —similar ratio of gravitational acceleration;
  • C t —similar ratio of unloading time;
  • g p —gravitational acceleration of rock sample prototypes;
  • g m —gravitational acceleration of the rock sample model;
  • t p —prototype unloading time for rock samples;
  • t m —unloading time of the rock sample model.
Since the gravitational acceleration was equal in the prototype and the model, Cg = 1.
In similarity theory, the geometric similarity ratio satisfies the mathematical relationship with the time similarity ratio, so the time similarity ratio is
C t = t p t m = C L = 8.37
where
  • C t —similar ratio of unloading time;
  • t p —prototype unloading time for rock samples;
  • t m —unloading time of the rock sample model;
  • C L —geometric similarity ratio.

2.3. Determination of Physical and Mechanical Parameters of Coal Rock Samples

The determination of basic physical and mechanical parameters is the basis for unloading theoretical calculations, the design of similar simulation ratios, and numerical simulation studies. Samples were cut and milled using an SCQ-A automatic rock cutter, an SHM-200 double-end face grinder, and an SC-300 automatic corer, while the uniaxial compressive strength and bulk density were measured using a 50 mm × 50 mm × 100 mm specimen and a φ50 mm × 50 mm × 100 mm specimen. A 100 mm specimen and φ50 mm × 100 mm standard specimen were used, tensile strength adopted a φ50 mm × 25 mm standard specimen, shear strength adopted a 50 mm × 50 mm × 50 mm specimen and φ50 mm × 50 mm standard specimen, the deviation of the diameter of the specimen at the upper and lower ends was not be more than 0.3 mm, and the deviation of the axial direction was not be more than 0.25°. The experimental process is shown in Figure 1, and the calculation results are shown in Table 1. Accurate basic data are provided for the subsequent similar simulation ratio optimization and numerical calculation.

3. Experimental Study of Orthogonal Matching of Similar Materials

3.1. Selection of Similar Materials

Coal mine roadway excavation sites have highly varied working conditions, and the alteration of surrounding rock lithology significantly impacts the rupture characteristics of roadway excavation. Therefore, it is crucial to emphasize key research areas and de-emphasize areas with minimal far-field influence. Reasonable selection and proportioning of similar materials is key to restoring the stress redistribution in the surrounding rock induced by roadway excavation. However, there is a lack of experimental research that completely satisfies the three laws of similarity. Therefore, it is important to ensure that the main parameters meet similar conditions. Since the simulation object is sedimentary rock, which is essentially composed of aggregate and cement, the most suitable material for simulating sedimentary rock would be a similar material composed of aggregate and cement. The main bearing system in similar materials is determined by the mechanical properties of the cement. The damage process of gypsum and calcium carbonate is characterized by brittle damage, and their proportionality strongly influences the regulation of strength and elastic modulus of similar materials, making this one of the main components. Considering that the source of the material needed to be easily accessible and as the strength requirements were low, river sand with particle sizes less than 0.5 mm was selected as the aggregate. The effects of the sand–cement ratio, gypsum and calcium carbonate ratio, and water content on strength and elastic modulus could be determined by varying the ratios. Subsequently, similar ratios of siltstone, fine sandstone, medium sandstone, coarse sandstone, and coal could be identified.

3.2. Orthogonal Test Protocol

It is important to select reasonable and simple test methods to quickly achieve the desired goals in similar proportioning experiments. Therefore, it is necessary to study the advantages and disadvantages of various experimental design methods, in order to be able to better study the properties of similar materials and quickly select reasonable ratios [28]. At present, the orthogonal test method is the most widely used in multifactor analysis, especially in the mixing design with incomparable superiority.
Sand, gypsum, calcium carbonate, and water play different roles in the proportion of similar materials, and the different properties of rocks can be blended through the proportionality of several materials: sand is a kind of hard, wear-resistant, chemically stable cinnamate mineral, which can act as a skeleton structure and regulate the density of the proportion of materials [29]; gypsum and calcium carbonate with different bonding strengths could be blended with the mechanical properties of the similar materials [30]. Therefore, the sand-to-cement ratio (aggregate and cementing material), carbon paste ratio (calcium carbonate and gypsum), and moisture content were taken as the three main factors to be considered in the test, and four levels were selected for each factor. The L16(44) orthogonal test table was chosen to arrange the test, and the results obtained by conducting the test according to this serial number are shown in Table 2.

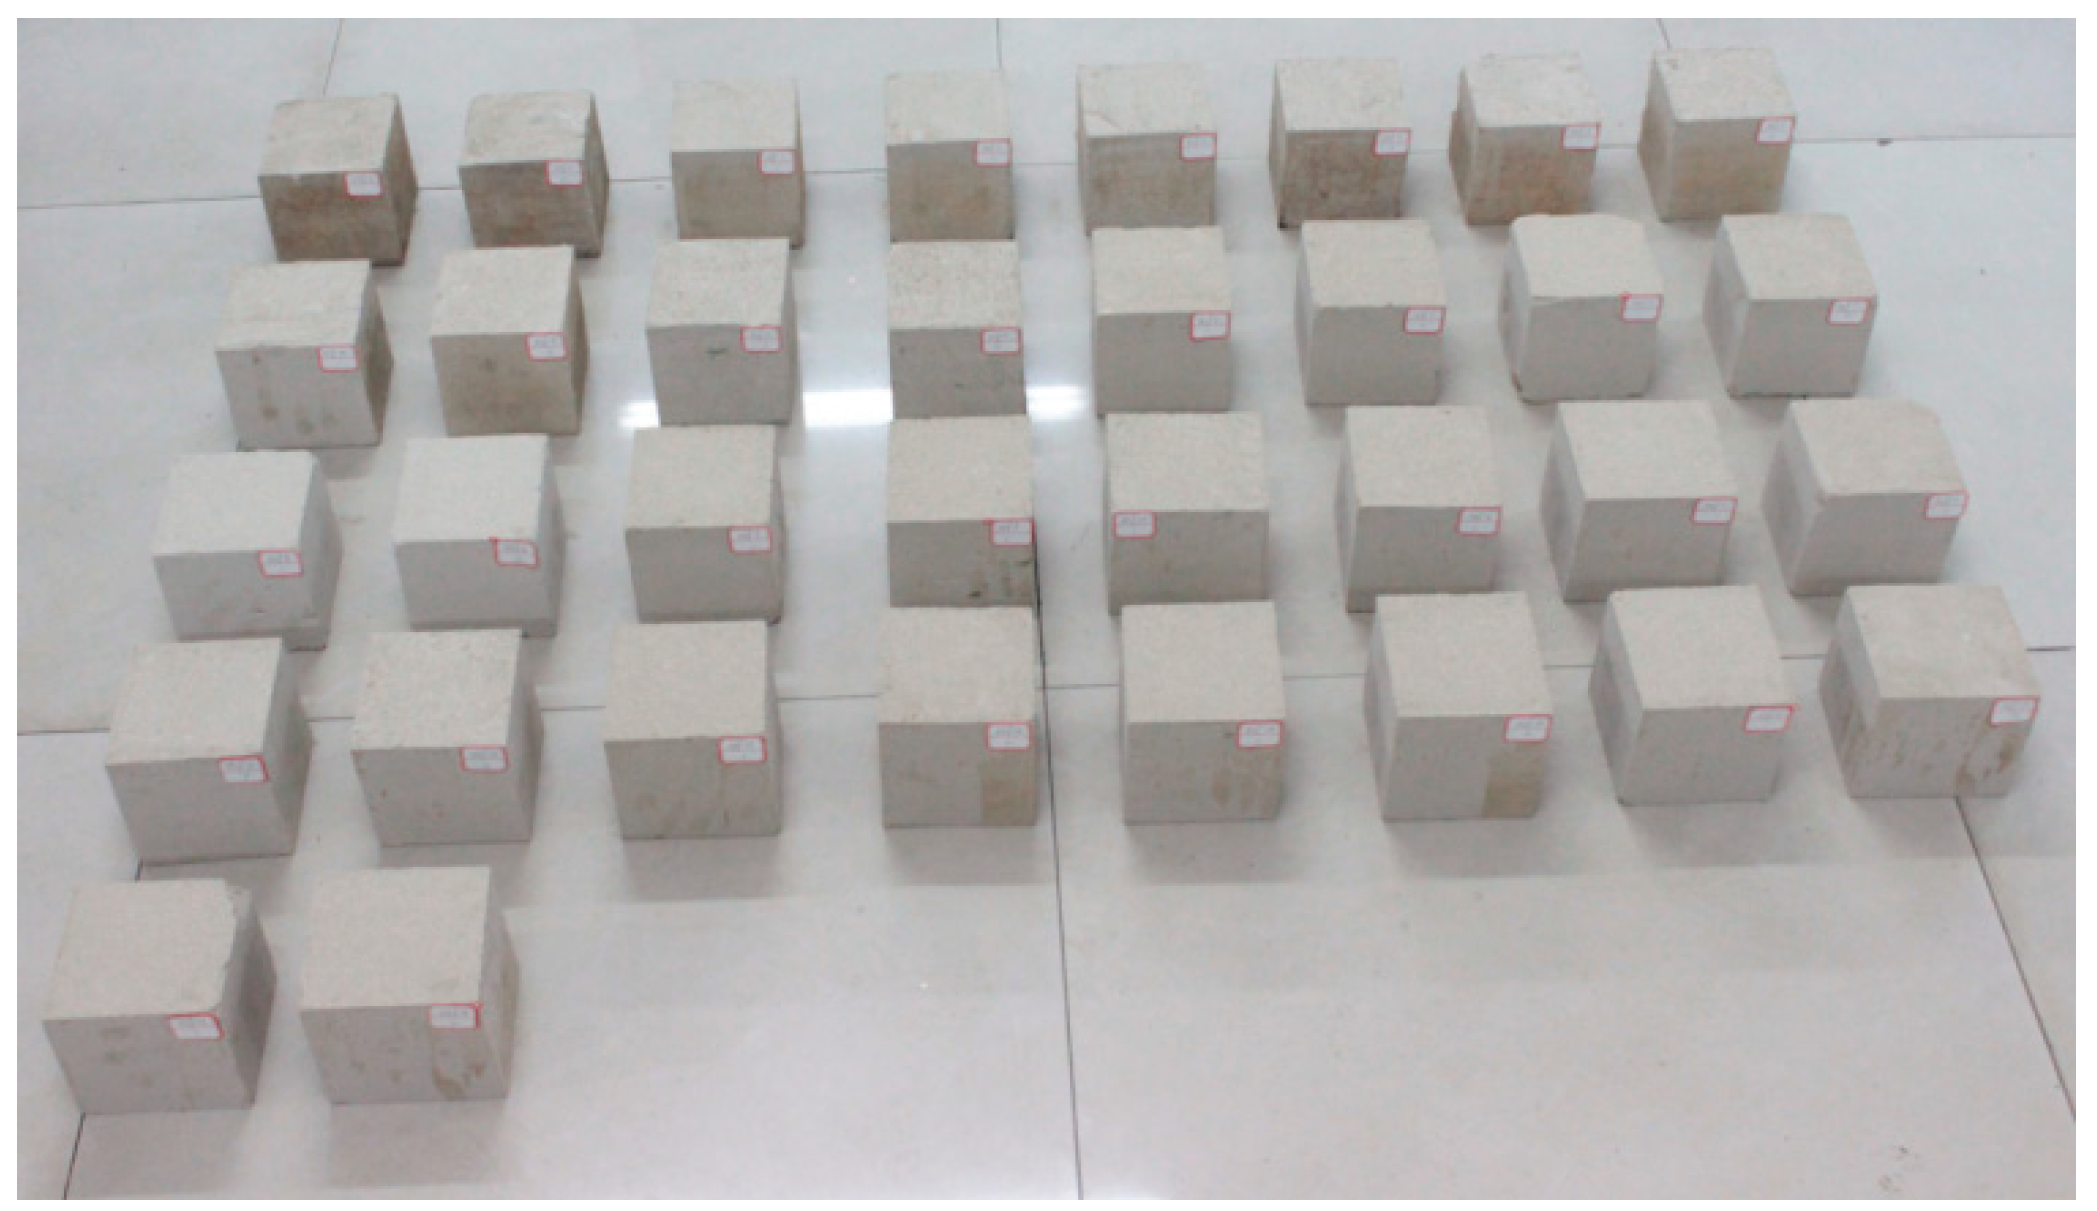
3.3. Similar Material Production Method and Experimental System

The mass of the sand, gypsum, calcium carbonate, and water was weighed according to the similar proportioning scheme in Table 3, with a weighing accuracy of 0.01 kg. Two specimens were prepared for each experimental group because of the high homogeneity and low dispersion of the mixed materials. The dry material consisting of sand, gypsum, and calcium carbonate was mixed well.
The homogeneous dry material was poured into the mixing drum, using a low-speed mixing mode and adding water slowly. When all the water had been added to the mixture, high-speed mixing mode was used, and the mixing time was more than 2 min. After mixing, the mixture was taken out.
A 100 mm × 100 mm × 100 mm square mold was used to produce specimens. In order to prevent sticking to the mold, the four walls of the mold and the bottom surface of the adhesive tape were pounded in layers. After pounding, the upper part of the mixture was 2 cm.
In order to ensure that the specimen was dense, the mold was left in the loading device, with a loading stress of 10 MPa, for the full load time of 5 min.
The full load was achieved after the end of the static 30 min. Demolding first removed the bottom screws, and then the screws of the four sides were removed and the specimen was numbered.
The specimen was placed in an oven at 120° for 24 h for drying, it was then removed and placed in a desiccator for experimental use. The similar material specimen preparation process is shown in Figure 2, and the preparation results are shown in Figure 3.
A TYJ-500 microcomputer-controlled electro-hydraulic servo rock shear creep testing machine was used for mechanical experiments on the similar materials, supported by an XTDIC three-dimensional optical digital scattering system to capture the changes in the scattering field of the end face, with an SH-II all-weather acoustic emission health monitoring system to gather the acoustic characteristics of the rupture process of similar materials. The primary aim of employing the digital scattering and acoustic emission systems was to assess the feasibility of similar simulation experiments in the subsequent phase. An axial load was applied to the specimen in similar proportions using a press. The loading rate was 0.05 mm/s, and the accuracy of the load and displacement were 0.001 kN and 0.001 mm, respectively. The frequency of the acoustic emission system was 1 kHz. The frequency was 3 MHz, and the model of the acoustic emission probe was Nano 30, with a resonance frequency of 125 KHz. The acoustic emission system was utilized at 750 KHz, with a threshold of 40 dB for acoustic emission and a sample rate of 1 MSPS, to gather the acoustic properties of various materials during the rupture process. The experimental system operated at 1 MSPS and was designed to monitor surface spraying scattering spots (black self-painting) for various specimen ratios. It utilized a digital bulk system to track the deformation process of scattering spots, with a strain measurement accuracy of 0.005% of the amplitude. The measurement range spanned from 0.01% to 1000% of the amplitude, with a maximum measurement amplitude of 4 m. The experimental setup is illustrated in Figure 4.

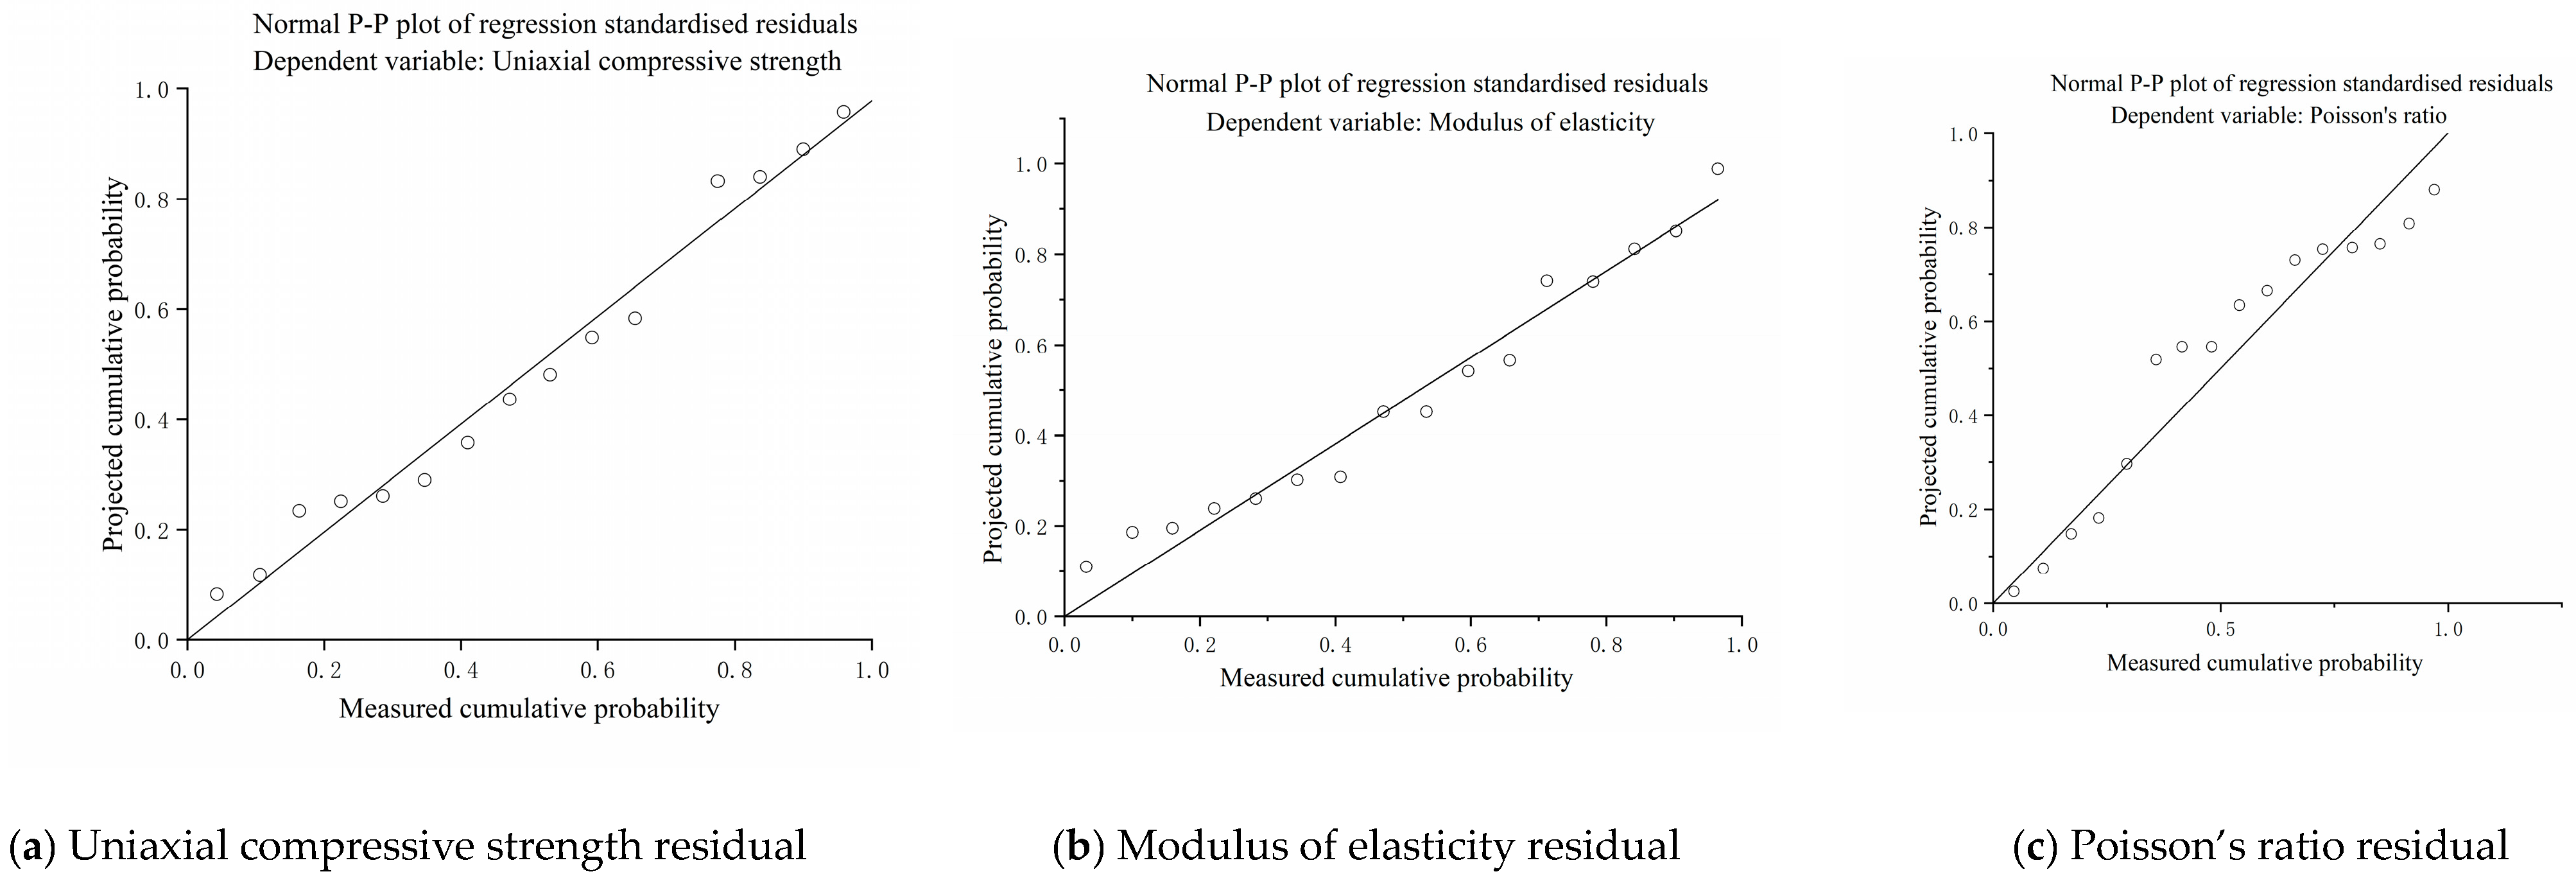
3.4. Analysis of Experimental Results

(1)
Calculation and analysis of stress–strain curves.
Through compression testing to determine the load and displacement of specimens with different ratios, the stress and strain of the specimen were calculated and curves were plotted. Since the experimental curves were similar, the stress–strain curve of the xsf9-2 specimen was selected for analysis, as shown in Figure 5. The peak point of stress was identified to determine the uniaxial compressive strength, which was 0.326 MPa for the xsf9-2 specimen. The modulus of elasticity was calculated during the linear phase of stress–strain using Formula (9), resulting in an elastic modulus of 35 MPa for the xsf9-2 specimen.
E = σ 1 σ 2 ε 1 ε 2 = 0.269 0.144 1.659 1.305 = 0.125 0.354 = 0.35
where
  • E —modulus of elasticity;
  • σ 1 , σ 2 —stress at the corresponding points 1,2 in the figure;
  • ε 1 , ε 2 —strain at the corresponding points 1,2 in the figure.
The xsf9-2 stress–strain curve could be divided into four typical stages. Stage I was the compaction stage, Stage II was the elastic deformation stage, Stage III was the plastic deformation stage, and Stage IV was the post-peak stage. This division aligns with the four typical stress–strain stages of rock [31], suggesting that employing similar simulated materials in strength and deformation analyses is highly reliable. Through comparative analysis, it was found that the trends and laws of the two materials before reaching the peak were essentially the same. After the peak, the coarse sandstone (soft rock) and similar material proportions of the specimens exhibited characteristics of slow plastic flow destruction. In contrast, the siltstone, fine sandstone, and medium sandstone (hard rock) showed distinct brittle failure characteristics after the peak. This suggests that using similar material proportions can more accurately replicate the post-peak behavior of soft rock and, to some extent, reflect the evolution process of hard rock.
(2)
Calculation of the Poisson’s ratio of the similar material proportion specimens.
A digital speckle pattern interferometry system was used to monitor the complete deformation field on the surface of the materials with similar proportions, as illustrated in Figure 6a. An information point was added in the middle of the specimen, and the displacement information in the x and y directions of the point was extracted. The transverse deformation and longitudinal deformation was calculated based on the length and height of the specimen. The relationship curve between the relative time and transverse strain and axial strain was plotted, as illustrated in Figure 6b. Finally, the Poisson’s ratio of the specimen with a similar material composition was determined using the Poisson’s ratio calculation formula. According to Formula (2), the Poisson’s ratio of the xsf9-2 specimen was 0.27.
υ = ε 1 ε 2 ε 3 ε 4 = 0.116 0.059 1.107 0.888 = 0.057 0.219 = 0.26
where
  • υ —Poisson’s ratio;
  • ε 1 , ε 2 —strain at the corresponding points 1,2 in the figure;
  • ε 3 , ε 4 —strain at the corresponding points 3,4 in the figure.
(3)
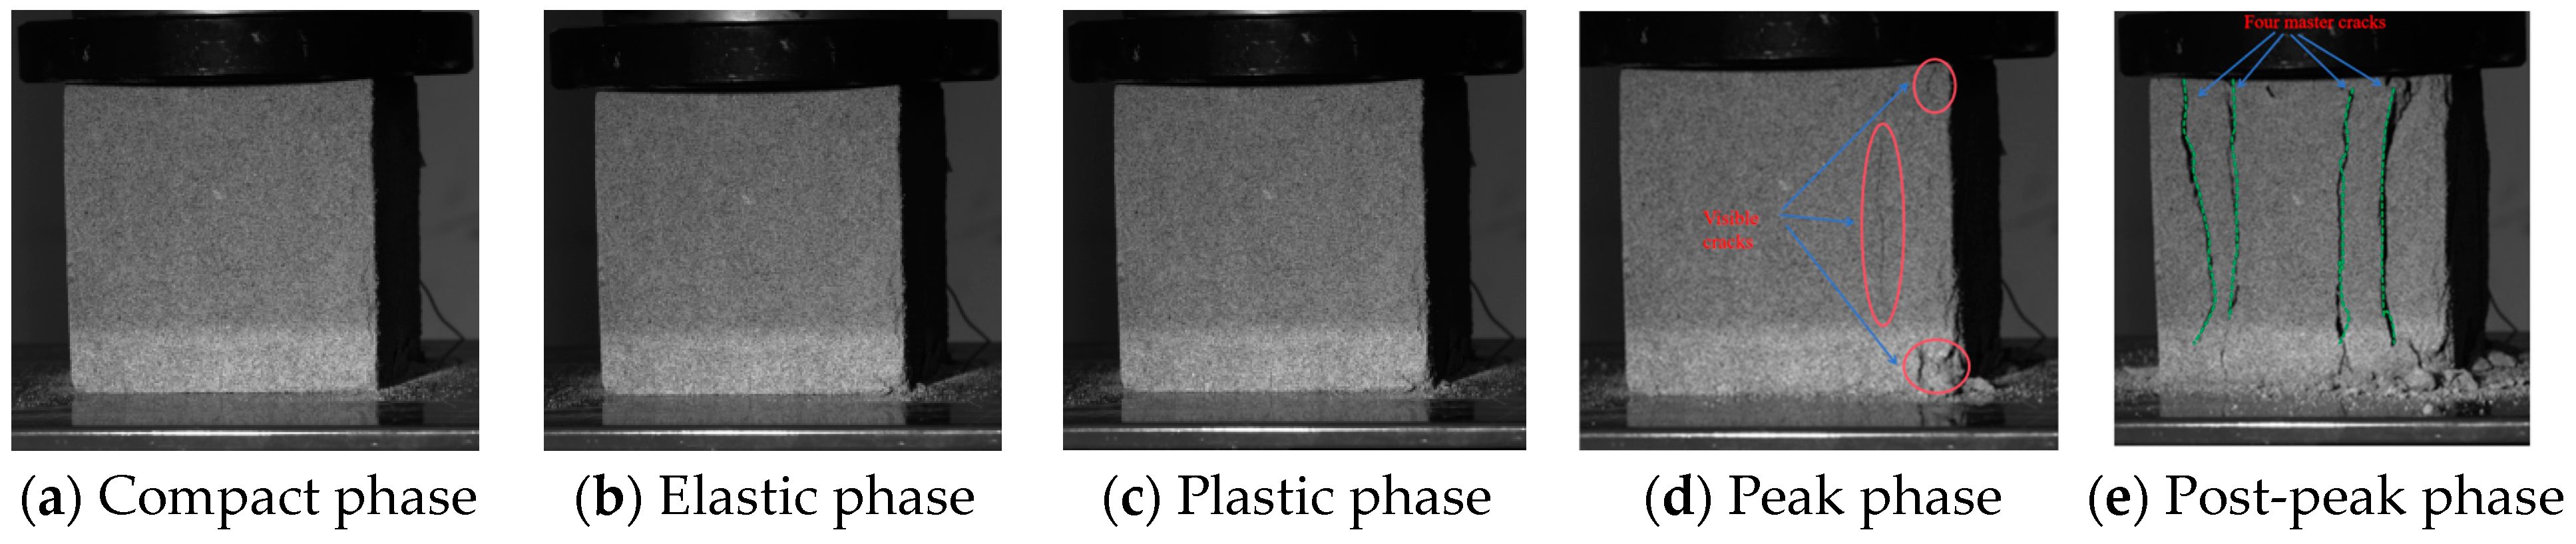
Rupture analysis of specimens with similar material ratios.
Figure 7 illustrates the corresponding specimen changes in different typical stages. From the figure, it can be observed that in the compression stage, elasticity stage, and plasticity stage, there were no obvious changes on the specimen surface. However, in the peak stage, on the right side, there was a local area of obvious rupture, leading to a complete loss of load-bearing capacity. After the peak stage, the specimen formed four main control cracks, with longitudinal cleavage dominating and shear damage existing. There was also local cleavage and typical rupture forms present. The fracture form aligned with the typical rupture form, suggesting the feasibility of studying rupture morphology using materials with similar ratios.
(4)
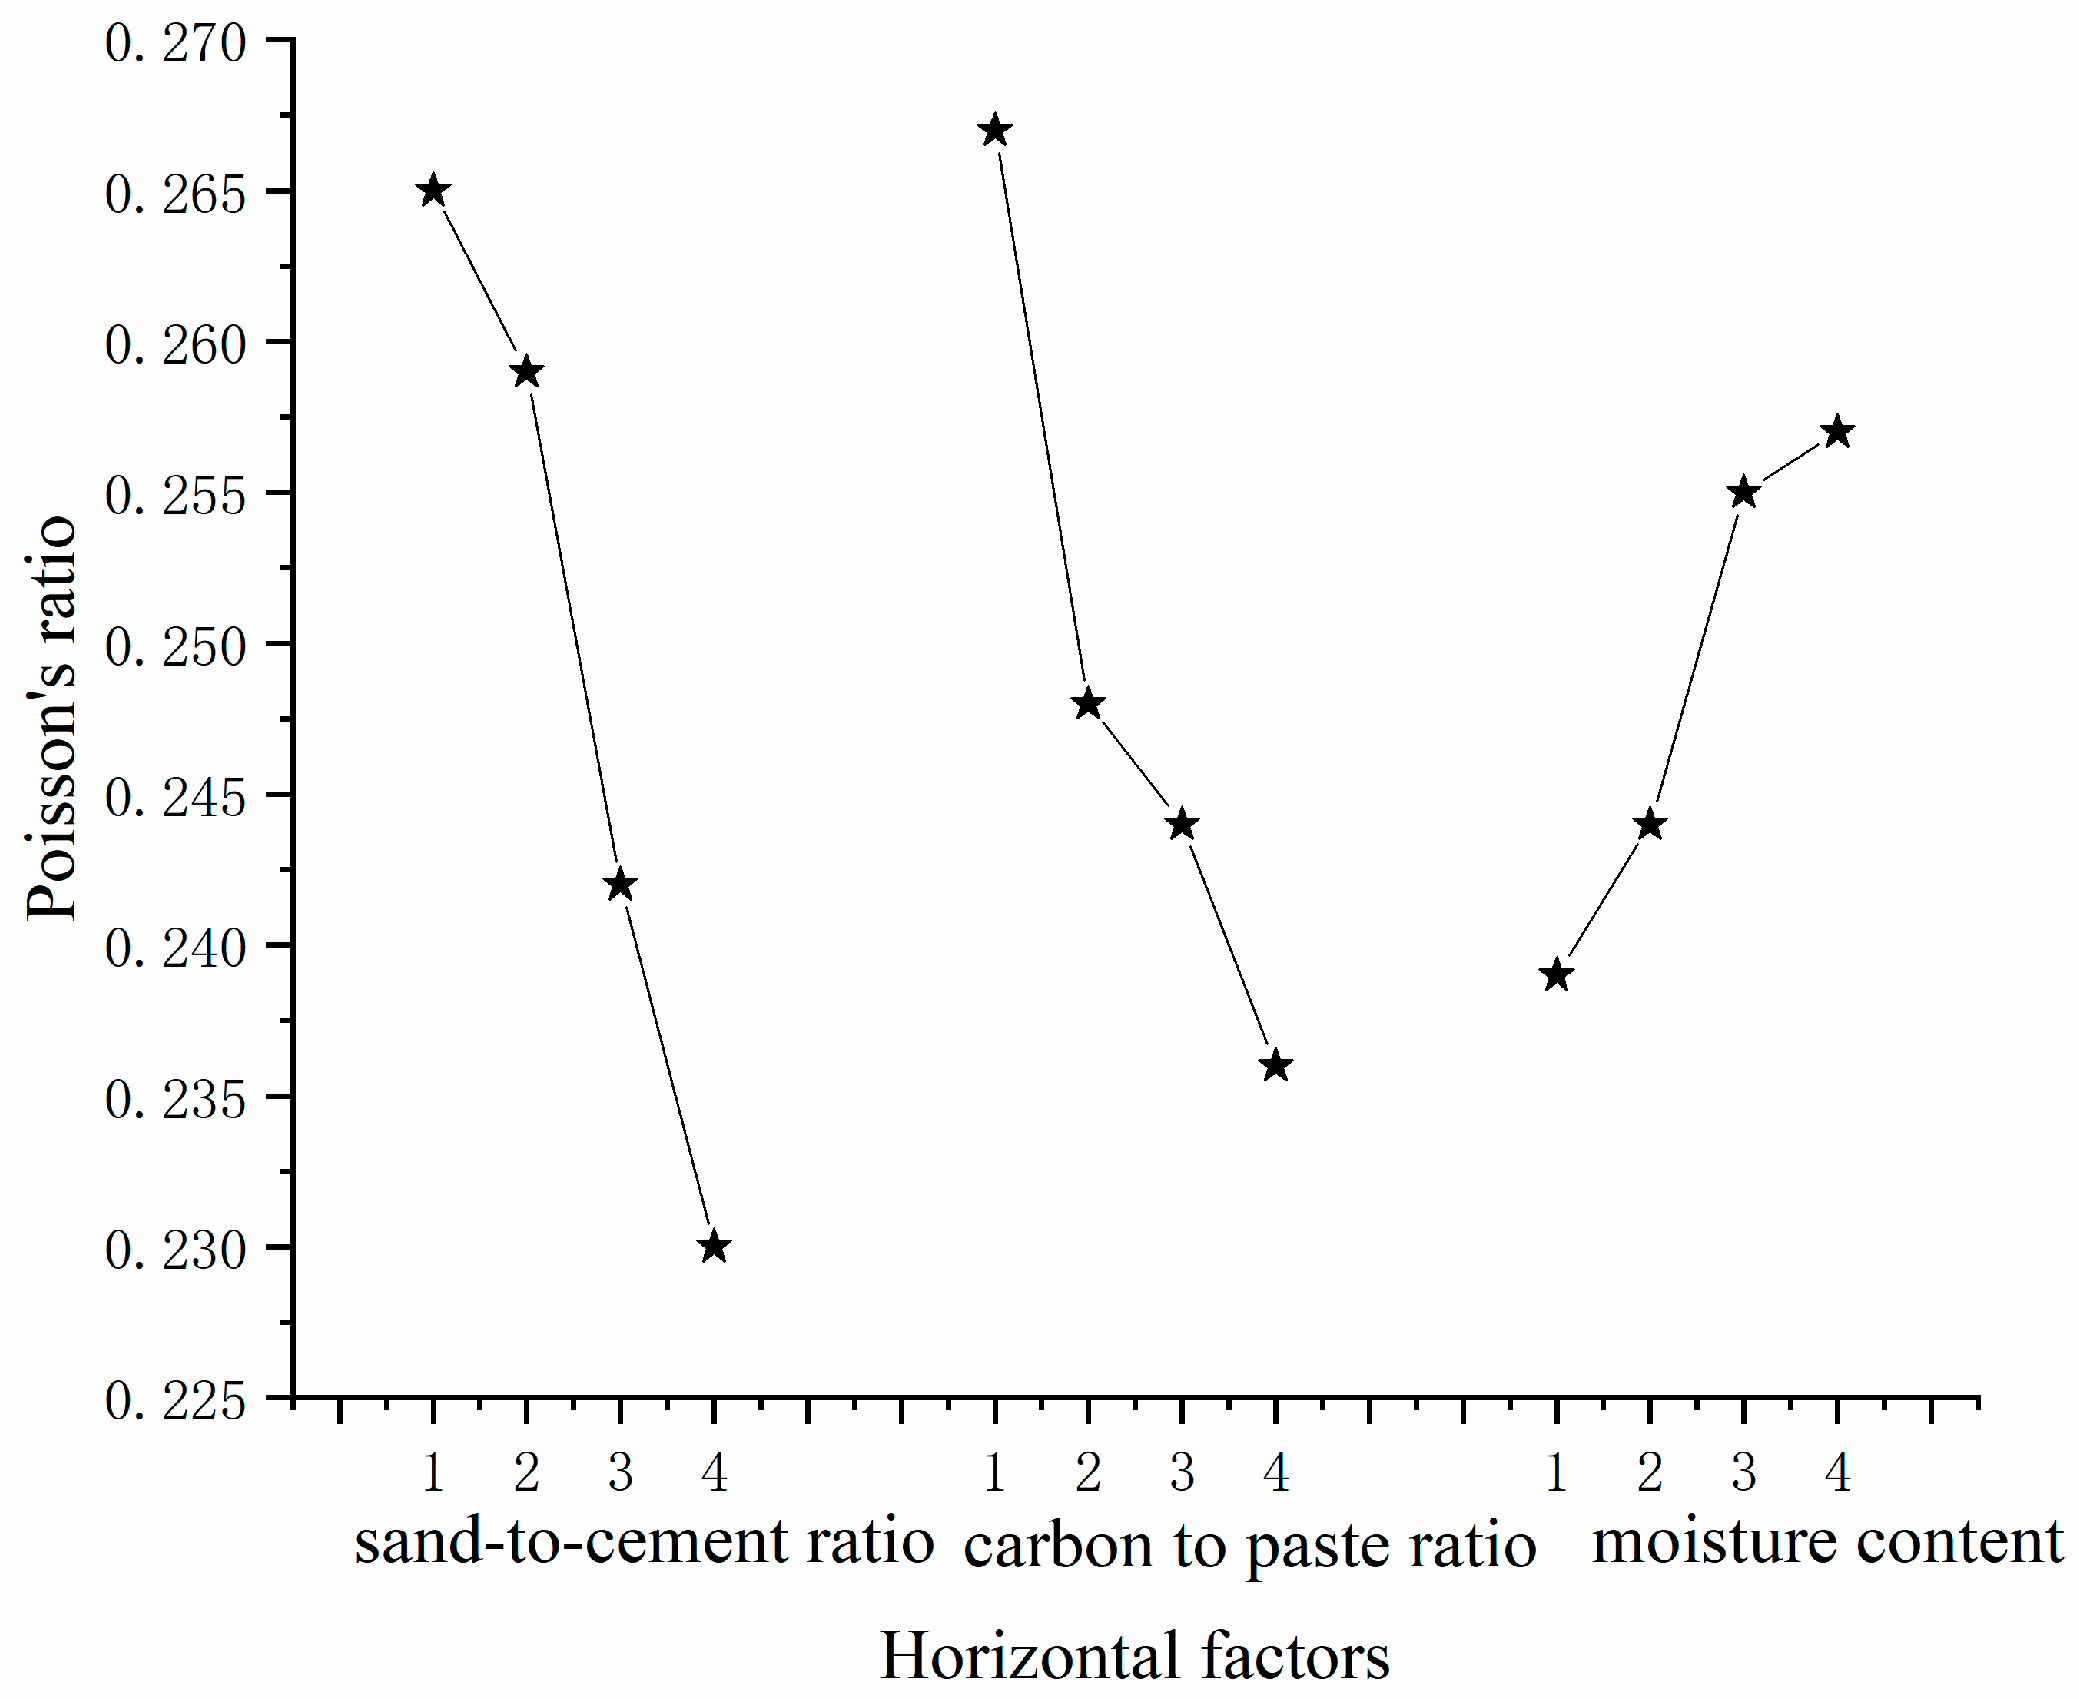
Sensitivity analysis of factors.
Based on the methods described above, 16 sets of uniaxial compressive strength, elastic modulus, and Poisson’s ratio values for specimens with different ratios are presented in Table 4. The analysis revealed that the uniaxial compressive strength values for specimens with different ratios ranged from 0.13 MPa to 0.46 MPa, the elastic modulus ranged from 0.1 GPa to 0.6 GPa, and Poisson’s ratio ranged from 0.2 to 0.29. By considering the uniaxial compressive strength, modulus of elasticity, Poisson’s ratio, and similarity ratio of the specimens on site, it was determined that the proportioning material could replicate siltstone, fine sandstone, medium sandstone, coarse sandstone, and coal. In order to accurately determine the necessary proportions of similar materials, orthogonal experiments were conducted to analyze the sand/gum ratio, carbon paste ratio, and water content.
First of all, each factor was analyzed using the polar deviation method. The size of the polar deviation characterizes the effect of a factor on the characteristic indexes under a change in level. The magnitude of the polar deviation reflects the sensitivity of the parameters and their ability to regulate the mechanical parameters [32]. The relationship between the sand-cement ratio, carbon paste ratio, and moisture content, as well as their respective characteristic indexes, were thoroughly analyzed using extreme deviation. Table 4 presents the polar deviation of uniaxial compressive strength. The analysis revealed that the carbon paste ratio exhibited the highest polar deviation, followed by the sand glue ratio and then the water content. This indicates that the sensitivity to the influence of the uniaxial compressive strength decreased in the order B > A > C. The strength differences were most affected by adjustments to the carbon paste ratio, followed by the sand glue ratio, and lastly by adjustments to the water content. In order to analyze the relationship between the factors, levels, and uniaxial compressive strength more intuitively, a parametric graph showing the sensitivity of uniaxial compressive strength was drawn, as depicted in Figure 8. Through this analysis, it was evident that as the sand glue ratio in the specimen increased, the uniaxial compressive strength gradually decreased. Similarly, as the carbon paste ratio in the specimen increased, the uniaxial compressive strength also gradually decreased. On the other hand, an increase in water content initially led to a growth in uniaxial compressive strength, followed by a decrease. The influence of the sand-to-glue ratio and carbon paste ratio on the strength of the specimen was significant. However, the influence of the carbon paste ratio on the strength was greater than that of the sand-to-glue ratio. Therefore, the most crucial influencing factor was the carbon paste ratio. The water content had a limited influence on the strength and was not directly correlated. Within a specific range of values, water content can maximize strength, known as the optimal water content. Any deviation from this range, whether excess or insufficient water, will result in a decrease in strength. When adjusting the uniaxial compressive strength using water content, it is crucial to consider the pattern and regulations.
The extreme difference in elastic modulus is shown in Table 4. Through the analysis, it was found that the extreme difference in sand glue ratio was the largest, followed by carbon paste ratio and water content again, which indicates that the influence on the sensitivity of elastic modulus was in the order A > B > C, from large to small. The first adjustment to the sand–glue ratio was made when there was a large difference in elastic modulus, the carbon paste ratio was adjusted when there was a small difference, and the water content was adjusted when the difference was very small. In order to analyze the relationship between factors, levels, and elastic modulus more intuitively, an elastic modulus sensitivity covariance diagram was drawn, as shown in Figure 9. It can be seen from the analysis that the elastic modulus of the specimen decreased gradually with the increase in the sand–cement ratio; the elastic modulus of the specimen decreased gradually with the increase in the carbon paste ratio; and the elastic modulus of the specimen decreased gradually with the increase in the water content. Both the sand–glue ratio and carbon paste ratio had a greater influence on the elastic modulus of the specimens, but the influence of the sand–glue ratio on the elastic modulus was greater than that of carbon paste–ratio; thus, the most important influencing factor was the carbon paste ratio, and the influence of the water content on the modulus of elasticity was very small, which indicates that the sensitivity was the lowest.
Table 4 gives the extreme difference in Poisson’s ratio. Through the analysis, it was found that the extreme difference in the sand–glue ratio was the largest, followed by the carbon paste ratio, and again the water content, which indicates that the influence on the sensitivity of Poisson’s ratio was in the order of A > B > C, from the largest to the smallest. In the case of a large difference in Poisson’s ratio, the first adjustment was the sand–glue ratio, with smaller difference adjustment for the carbon paste ratio, and a very small difference in the adjustment of the water content. In order to analyze the relationship between factors, levels, and Poisson’s ratio more intuitively, a Poisson’s ratio sensitivity parametric plot was drawn, as shown in Figure 10. Through this analysis, it can be seen that with the increase in the sand–glue ratio of the specimen, the Poisson’s ratio gradually decreased; with the increase in the carbon paste ratio of the specimen, the Poisson’s ratio gradually decreased; and with the increase in the water content of the specimen, the Poisson’s ratio gradually increased.
(5)
Multivariate linear regression analysis.
Multiple linear regression was used to investigate the following relationships between the dependent and independent variables in the similar material ratios, which first requires an understanding of its mathematical model, which has the following generalized form of expression:
y = b 0 + b 1 x i 1 + b 2 x i 2 + + b m 1 x i m 1 , i = 1 , 2 , , n
where
  • y —implicit variable;
  • x i 1 , x i 2 x i m 1 —independent variable;
  • b 0 , b 1 , b 2 + b m 1 —correlation ratio coefficient.
Through the sensitivity analysis, it was found that the sand–glue ratio, carbon paste ratio, and water content presented a linear relationship with the mechanical properties of the material, and only the water content presented a nonlinear relationship with the uniaxial compressive strength, which was negligible in the overall linear analysis due to the low sensitivity and small range of influence. Thus, the independent variable had three factors, the sand glue ratio was x1, the carbon paste ratio was x2, and the water content was x3, and there were three indexes caused by the change in the independent variable to the change of the dependent variable: the uniaxial compressive strength y1, the modulus of elasticity y2, and the Poisson’s ratio y3, and their equations are as follows:
Y = ( y 1 y 2 y 3 ) 3 × 1 , X = ( 1 x 1 x 2 x 3 ) , β = ( b 01 b 02 b 03 b 11 b 12 b 13 b 21 b 22 b 23 b 31 b 32 b 33 ) 4 × 1
where
  • Y —vector of characteristic indicators;
  • X —proportionality matrix for similar ratios;
  • b 0 , b 1 , b 2 + b m 1 —correlation ratio coefficient;
  • x 1 —sand-to-cement ratio;
  • x 2 —carbon-to-paste ratio;
  • x 3 —moisture content;
  • y 1 —uniaxial compressive strength;
  • y 2 —modulus of elasticity;
  • y 3 —Poisson’s ratio.
Then, the regression model is
Y = β X
where
  • Y —vector of characteristic indicators;
  • X —proportionality matrix for similar ratios;
  • β —correlation coefficient.
Where X is the ratio matrix of similar ratios and Y is the vector of characteristic indexes, the matrix of X is determined when the ratios are determined, and the characteristic indexes Y are also determined.
Based on the above theory, SPASS was used to carry out multivariate linear regression. The linear regression equation was as follows, and in Figure 11 it can be seen that the standardized residuals were basically in line with the normal distribution, the P–P plot was basically on a straight line, and the formula fitted using multiple regression was meaningful.
y 1 = 0.684 0.058 x 1 + 0.026 x 2 + 0.058 x 3 y 2 = 0.131 0.014 x 1 + 0.016 x 2 + 0.008 x 3 y 3 = 0.309 0.007 x 1 + 0.010 x 2 + 0.120 x 3 }
where
  • x 1 —sand-to-cement ratio
  • x 2 —carbon-to-paste ratio
  • x 3 —moisture content
  • y 1 —uniaxial compressive strength
  • y 2 —modulus of elasticity
  • y 3 —Poisson’s ratio
In the practical application of the above formula, the similarity ratio was used to be able to determine the mechanical parameters of the proportion of the material, so that the dependent variable became the proportion of the sand–glue ratio, carbon paste ratio, and water content. MATLAB was on the inverse of the matrix to obtain the following formula:
x 1 = 27.828 y 1 + 38.415 y 2 + 10.889 y 3 + 13.577 x 2 = 24.561 y 1 + 99.123 y 2 + 5.263 y 3 + 3.609 x 3 = 0.423 y 1 6.019 y 2 + 8.529 y 3 + 0.167 }
where
  • x 1 —sand-to-cement ratio;
  • x 2 —carbon-to-paste ratio;
  • x 3 —moisture content;
  • y 1 —uniaxial compressive strength;
  • y 2 —modulus of elasticity;
  • y 3 —Poisson’s ratio.
In this formula, the sand–cement ratio, carbon paste ratio, and water content are between 0 and 1, meaning that the proportion of siltstone, fine sandstone, medium sandstone, coarse sandstone, and coal are within the required range. If the calculated value is more than the ratio, this indicates that the sand, calcium carbonate, gypsum, and water ratios are not able to meet the requirements of the experiment, requiring the addition of additives or choosing other materials for mixing.

4. Feasibility Analysis of Similar Analog Materials for Acoustic Emission and Digital Scattering Studies

In this experiment, the excavation and unloading of the −500 backwind stone gate in the first mining area of Dongguang coal mine was taken as a prototype, and the acoustic emission characteristics of the original rock specimen were compared with those of the similar material specimen, and the overall deformation of the similar material specimen was compared with the deformation of the press encoder, so as to validate the scientific feasibility of the acoustic emission and digital scattering in the similarity simulation study.

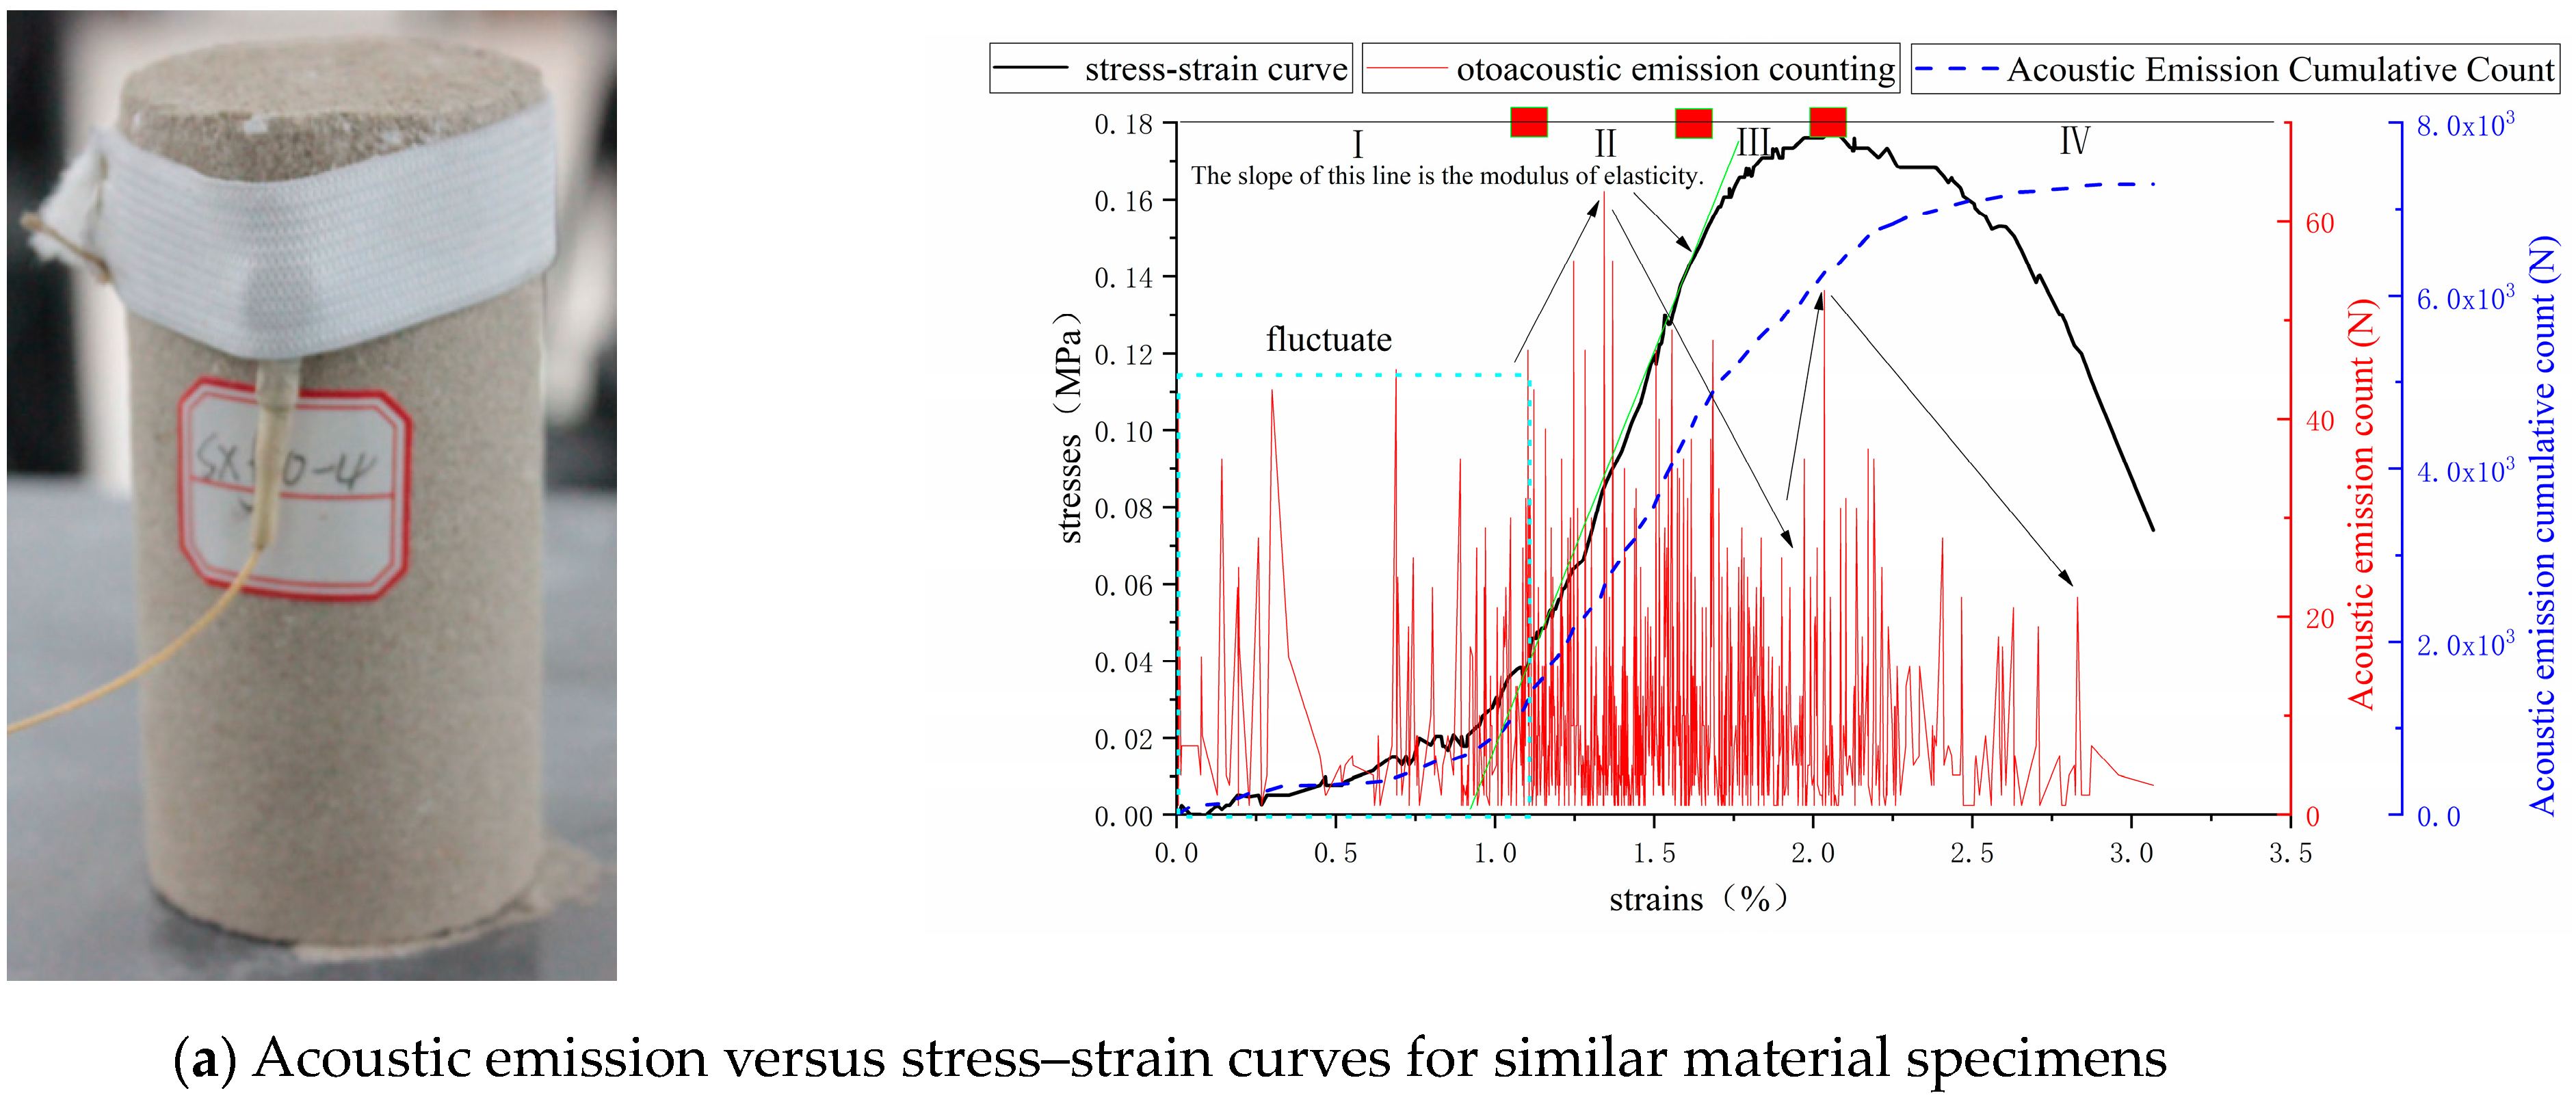
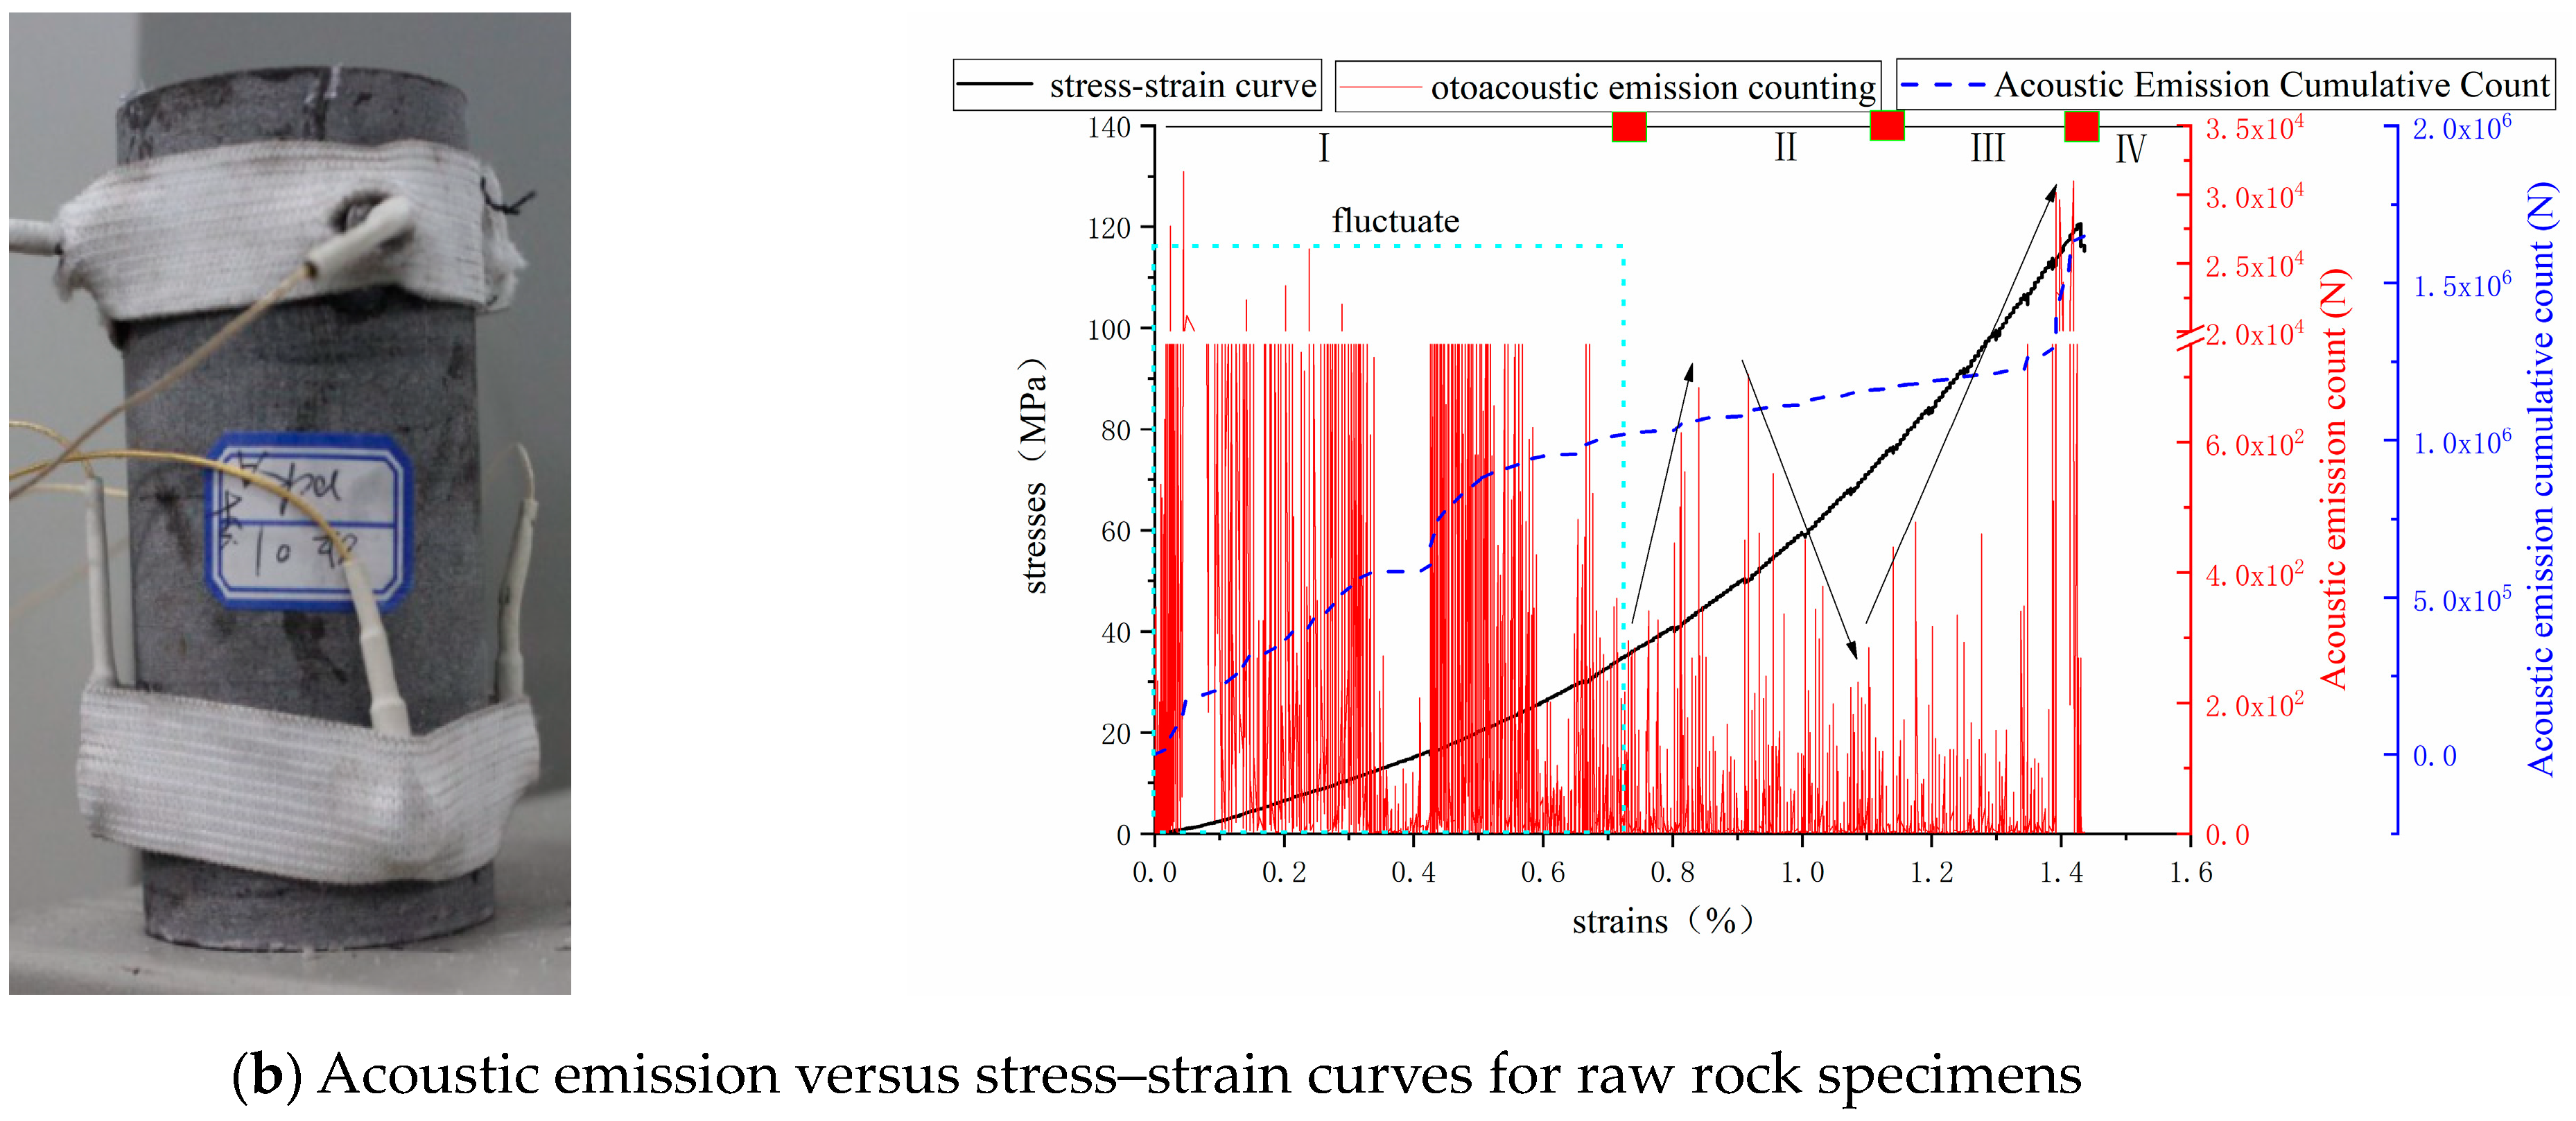
4.1. Feasibility Analysis of Similar Analog Materials for Acoustic Emission Studies

Under the action of stress, a coal rock body will undergo phase misalignment, friction sliding, cracking, and breaking. In this process, elastic waves are generated, which are an acoustic emission phenomenon, and the damage process is investigated by receiving elastic waves generated by the deformation of the coal rock body. The coal rock body is mainly sedimentary rock, which is cemented together by loose sediments, mainly composed of particles and cement. The similar material consisted of a skeleton (sand) and cement (calcium carbonate and gypsum), and the two had high similarity from the perspective of material composition. Accordingly, in order to verify the feasibility of using acoustic emission technology to study the deformation, damage, and destruction law of similar simulated surrounding rock under the complex stress paths of roadway excavation, uniaxial compression acoustic emission experiments of similar materials were designed, to explore the acoustic properties of similar materials during the loading to destruction process, and to compare and analyze the differences in acoustic emission parameters between the similar specimens and the original rock specimens.
The acoustic emission study of the uniaxial compression deformation of the similar materials was carried out using the basic mechanical experimental system in Figure 4, with a loading rate of 0.03 mm/s and synchronized opening of the acoustic emission system and the press system. Three acoustic emission probes were arranged at a distance of 2 cm each from the top and bottom of the original rock specimen and the similar material specimen, and these three probes were placed at equal distances from each other along the surface of the specimen. The relationship between the acoustic emission counts and the stress–strain curves of the similar material specimens was plotted, as shown in Figure 12a. With the increase in stress, the cumulative acoustic emission counts of the similar material specimens showed an increasing trend, with a slow growth in the compression-density stage, a faster growth in the elastic stage, a slower growth in the plastic stage than in the elastic stage, and a gradual stabilization in the post-peak stage. As shown in Figure 12b, with the increase in stress, the cumulative counts of acoustic emission of the original rock specimen showed a growing trend, with a faster growth in the compaction stage, a slower growth in the elastic stage, a similar growth rate in the pre-plastic stage and the elastic stage, accelerated growth in the post-plastic stage, and the maximum value in the rupture stage. There were obvious differences between the two in the compression stage, mainly because the original rock specimen under pressure had primary cracks, pores, and other defects that gradually closed, with a larger number of acoustic emission counts, while the similar material specimen was more homogeneous. The compression stage of the overall compression dominated by cracks did not occur in the evolution of the particles and the slippage of the acoustic emission signals was weaker. Other stages in the original rock specimens and similar material specimens were basically the same.
As shown in Figure 12a, for the similar material specimens in the compression (I) stage, the peak acoustic emission counts showed a fluctuating trend, during which there was a local calm period; in the elasticity (II) stage, the peak acoustic emission counts had the characteristic of presenting two intervals, the elasticity stage of the first half of the interval showed a trend of growth, the elasticity stage of the second half of the interval showed a decreasing trend. In the plastic (III) phase, the peak acoustic emission count reached a minimum and then started to grow, and the peak acoustic emission count had a high value when the peak moment was reached; in the post-peak (IV) phase, the peak acoustic emission count decreased in a continuous manner. As shown in Figure 12b, for the original rock specimen in the pressure density (I) stage, the peak acoustic emission counts showed fluctuations in the decreasing trend, during which there was a local calm period, and the rule of change was basically the same as for the similar materials; in the elasticity (II) stage, the peak acoustic emission counts also showed a growth and decline in the trend; in the plasticity (III) stage, the peak acoustic emission counts changed slowly and then accelerated when the peak acoustic emission counts reached a high value. The peak acoustic emission counts reached a high value at the peak moment. Comparing the two, it was found that the peak acoustic emission counts before the peak showed the trend of growth–decline–growth, so this shows that the similar material samples could reflect the pattern of change of the original rock samples, and again this also proves that the law obtained by the similar material has a certain reference value.

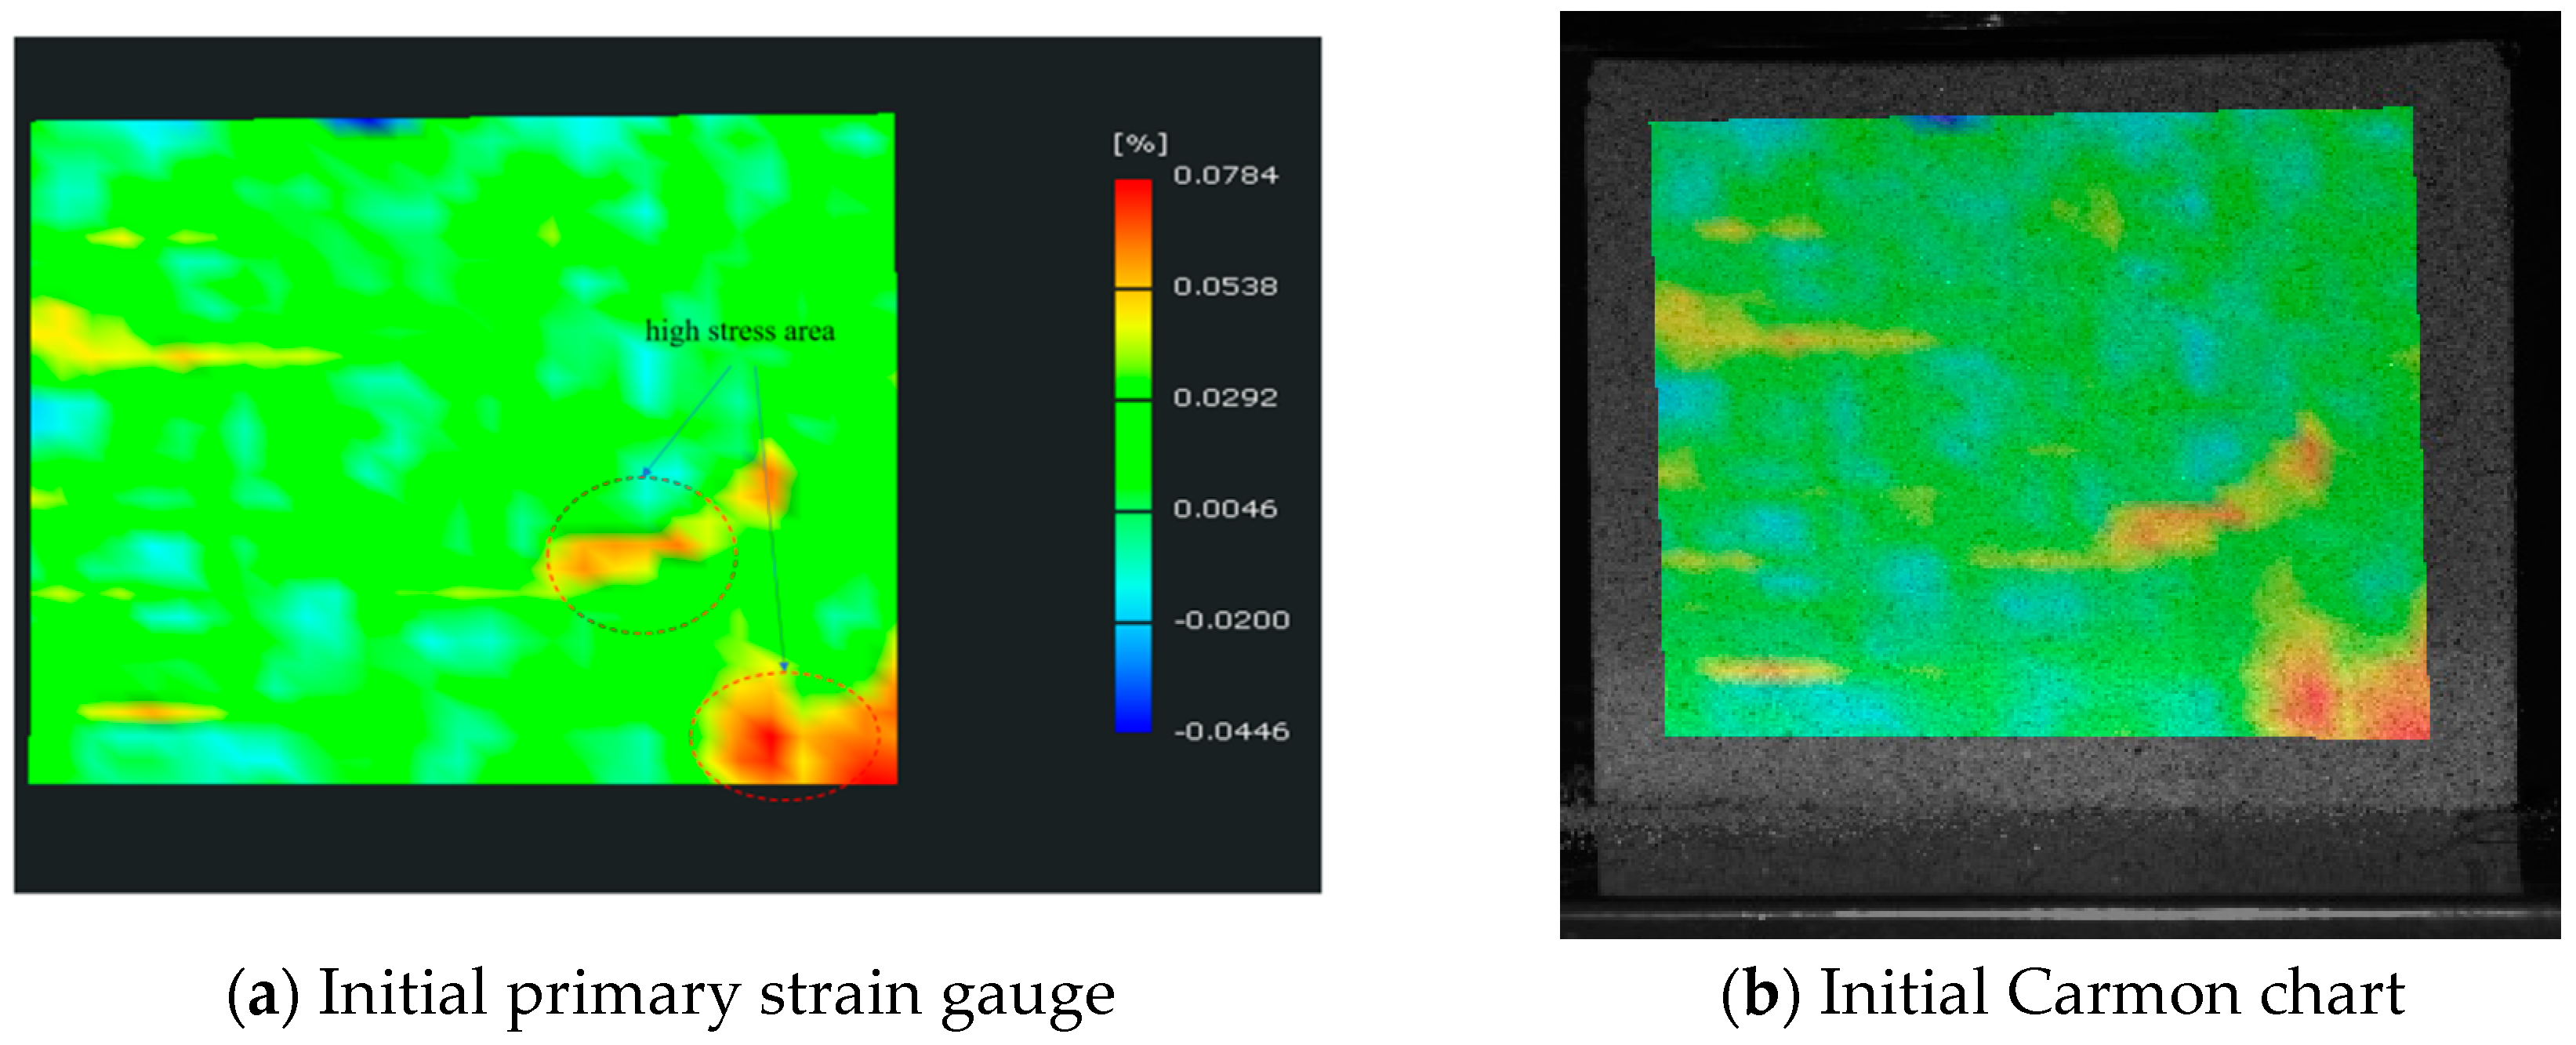
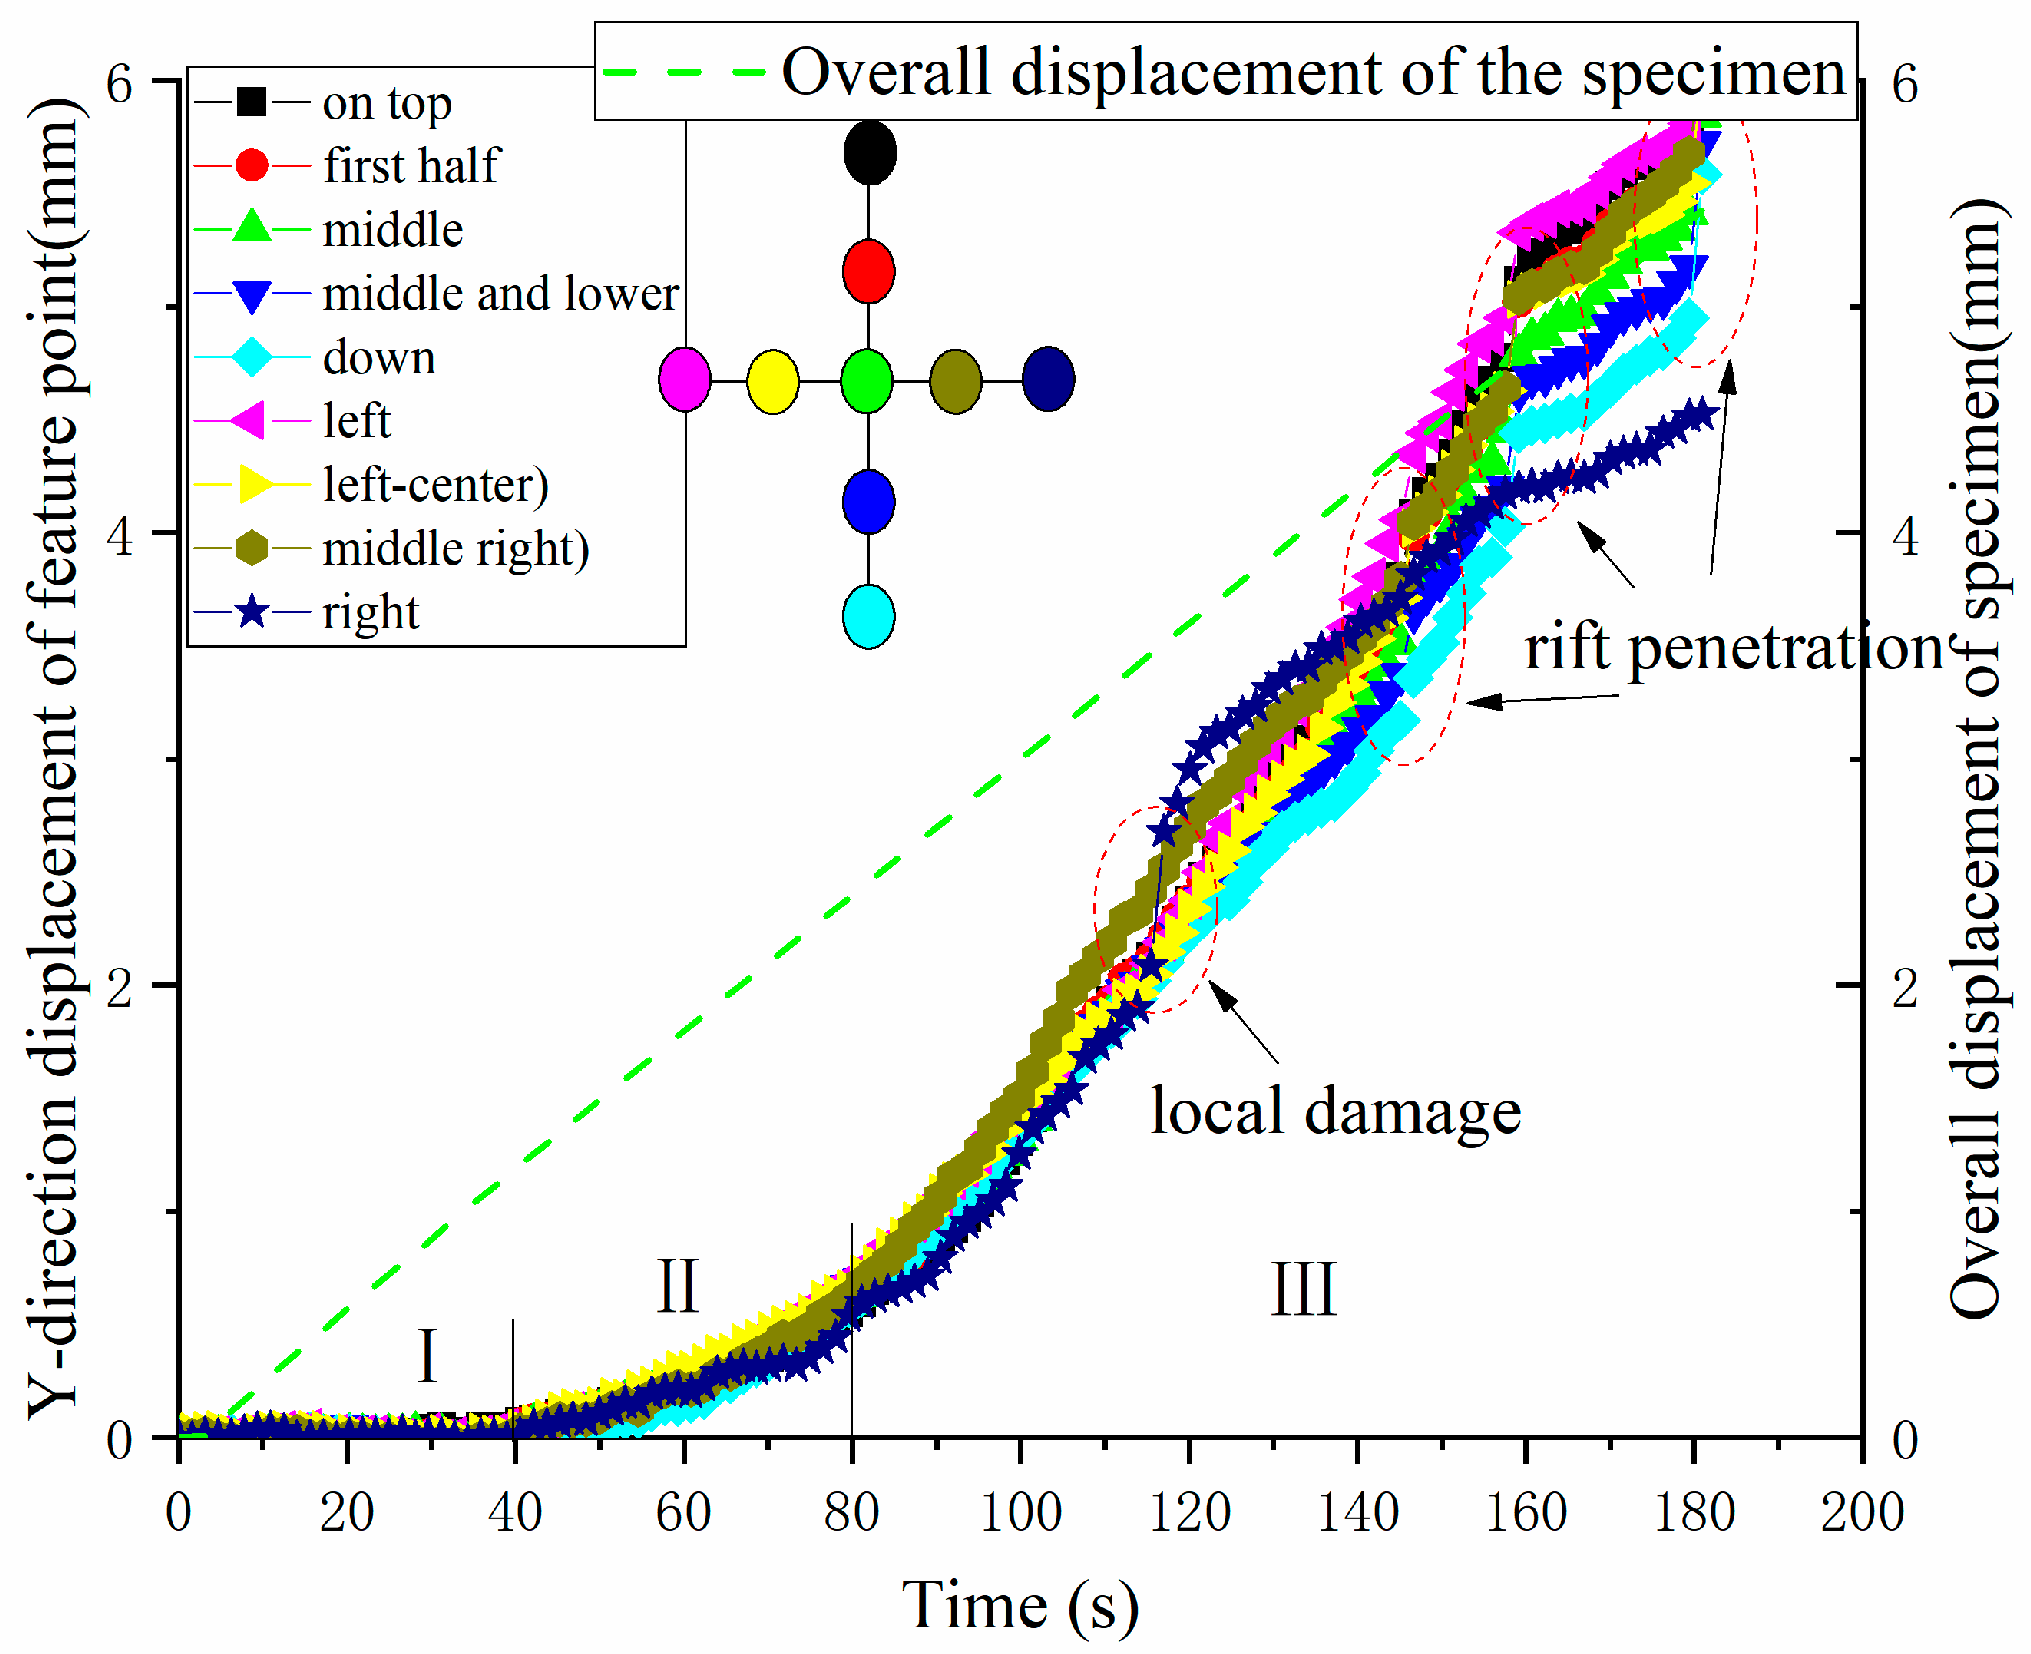
4.2. Feasibility Analysis of Similar Analog Materials for Digital Scattering Studies

Similar materials have certain differences with original rock materials, and the digital scattering method is reliable for characterizing the deformation and damage of similar materials. Accordingly, in order to verify the feasibility of the digital scattering method for studying the evolution of deformation field of similar simulated surrounding rock under complex stress paths, a uniaxial compression digital scattering experiment of similar materials was designed, to explore the change in the deformation field of similar materials during the process of loading to destruction, and to compare and analyze the difference between the measured deformation and the actual deformation.
Scattering spraying quality, complementary light effect, experimental environment, and equipment can have a certain impact on the measurement accuracy of scattering, and the surface of the similar material specimen was sprayed with scattering spots, and pre-acquisition was carried out to test the effect of seed point recognition. If the recognition effect was poor, the end surface was polished and then sprayed with scattering spots for a second time until the seed point recognition effect was better. To prevent the influence of temperature, light, environment, and other changes on the experiment, the laboratory was kept in a closed state during the experiment. An adjacent search method was used to find the grayed-out natural scattering area and then determine the movement law of the sub-area. In order to improve the measurement accuracy of the deformation, the sub-pixel localization method of correlation coefficient interpolation was used for the analysis. The search range could be determined autonomously according to the amount of deformation, which was initially 40 × 40 pixels; the subregion was 20 × 20 pixels. The correlation coefficient was calculated as follows:
C ( u , v ) = x , y [ f ( x , y ) f u , v ¯ ] [ t ( x u , y v ) t ¯ ] { x , y [ f ( x , y ) f u , v ] 2 x , y [ t ( x u , y v ) t ] 2 } 0.5
where
  • t —gray scale value of a single pixel in the pre-deformation sub-area;
  • t —average value of individual pixels in the subarea before deformation;
  • f —gray scale value of a single pixel within the deformed sub-area;
  • f —average value of individual pixels in the subregion after deformation;
  • u —displacement in x-direction before and after deformation;
  • v —displacement in y-direction before and after deformation.
where t and t are the gray value of a single pixel within the subarea before deformation and the average value of the pixel within the subarea, f and f are the gray value of a single pixel within the subarea after deformation and the average value of the pixel within the subarea; u and v are the displacement in the x-direction and y-direction before and after deformation.
In order to analyze the strain change and damage of the similar materials under uniaxial compression conditions, the xsf16-1 principal strain cloud and a Carmon sheet diagram of strain and specimen superposition are given, which can visually show the strain distribution characteristics of the similar material specimens and specimen cleavage distribution, as shown in Figure 13.
In the initial loading stage, the distribution of the principal strain field had randomness and there were relatively high principal strains locally (Figure 13a). It was analyzed that the stress level was low at this time, the internal stress was redistributed, and the inhomogeneity of the similar material led to the local existence of low and high stress zones, corresponding to low and high strains. In fact, the strain field at this time was in the process of regulating from disordered to ordered, and the high strains failed to reach the ultimate strains, while the surface of the similar material specimen was not damaged (Figure 13b).
In the loading stage before rupture, the similar material specimen showed an obvious main strain concentration area, and formed two obvious strip areas, such as in Figure 13c in the a, b region, with the a region in the right side of the specimen boundary, the strip is vertically downward and then shifted to the lower right corner; the b region with the specimen centerline as a demarcation point from the left side of the specimen extends to the lower boundary of the right side. The change in principal strain in region a was larger than that in region b, which indicates that the damage in region a may have occurred prior to that in region b. From the trajectories of regions a and b, it can be seen that longitudinal tensile cracks may have been formed in region a, and shear cracks may have been formed in region b. From Figure 13d, it can be seen that no damage was found in the high principal strain region and other regions on the surface of the similar material specimen, indicating that cracks would occur in regions a and b, which is favorable for prediction forecasts. Cracks are not formed when the appropriate management measures can effectively prevent the occurrence and spread of damage, and when cracks occur, it is difficult to prevent the expansion of cracks and repair cracks, to return to the state before the rupture.
Figure 13e shows the principal strain cloud at the beginning of the damage, where regions c and d have been strengthened compared with regions a and b in Figure 13c, i.e., the values of the principal strains have increased. From the color distribution of the strip region in the figure, it can be determined that the growth rate of the principal strain in region c was significantly larger than that in region d, which also indicates that a rupture had occurred in region c and no crack initiation had occurred in region d. From Figure 13f, the location and direction of the crack can be clearly observed, and the change rule of the principal strain field in region c is completely consistent, which indicates that the principal strain can accurately reflect the crack evolution process, and also indicates the accuracy of the prediction of region a. Tensile rupture of the similar material specimen did occur. The main strain on both sides of the crack showed symmetrical characteristics, and along the vertical direction of the crack, the main strain gradually decreased, and after reaching a certain region, the main strain remained unchanged, which indicates the localized characteristics of the rupture of the similar material specimen. The uniaxial compression digital scattering experiment revealed the distribution of the strain field and the mechanism of rupture, and could accurately predict and forecast the possible location and form of damage.
Figure 13g shows the main strain cloud map after the damage, in which an unrecognizable local blank area was formed, and comparing with Figure 13h, it can be seen that a larger fissure was formed in this area. The main reason for this was that the digital scattering correlation calculation method searches the pixel points in a small range, which is aimed at the problem of small deformation. Coal rock is damaged when small deformation occurs, so the pixel points will not be tracked when large deformation occurs, exceeding the correlation coefficient threshold, so this is displayed in the form of blank, which is the blank area is the large deformation area. From Figure 13h, it can be seen that another crack spread across the b and d areas, but the value of the main strain shows that the crack started from the upper part and extended to the lower part, which verifies the shear rupture form and rupture location of the analyzed cracks above, while the final damage form showed an inverted “Y” shape, having both tensile and shear damage. The above discussion illustrates the feasibility of using the digital scattering method to study the deformation and rupture of similar materials.
In the uniaxial compression of similar materials, the press can record the overall displacement of the specimen in the longitudinal direction, and digital scattering can record the displacement of the whole field. In order to quantitatively verify the consistency between the displacement calculated by the digital scattering and that of the actual specimen, the scattering cloud of the specimen in the Y direction was extracted, as shown in Figure 14. In order to prevent the influence of the boundary effect, 9 feature points were placed in the middle in the form of a cross, and the displacement change rule in the Y-direction of the extracted feature points was compared and analyzed with the press curve.
A noticeable difference can be observed in Figure 15 between the Y-direction displacement curves of the feature points determined using the digital scattering correlation method and the overall displacement curves of the similar material obtained through pressing. The difference between the overall displacement (encoder) and local displacement (digital scattering) was significant. The overall displacement reflects the total movement of the specimen, while the local displacement was influenced by the non-homogeneous and anisotropic nature of the material specimen. The distribution of the spatial displacement field varied in each region, resulting in differences in the curves of the characteristic points. The press was controlled through displacement, which is linearly related to time. The general pattern of change in the feature points selected from the similar material specimens was consistent, all exhibiting three distinct stages. The first stage involved micro-changes in displacement, the second stage showed a rapid growth in displacement, and the third stage demonstrated an accelerated growth in displacement. Due to the wide area occupied by the selected feature points, the fissure was likely to pass through the area of the feature points. A sudden growth occurred at the right feature point in the early stage III, indicating that at this time the tensile crack in the c-region propagated, and also suggesting the initiation of local damage. In the middle and late stages of stage III, three sets of nine feature points experienced sudden jumps, indicating that crack penetration occurred during this period, leading to unsteady growth in the entire displacement field. The overlap between the total displacement of the specimen and the displacements of the characteristic points late in the stage III suggests that the final digital scattering spot displacement could represent the specimen’s displacement. In summary, the digital image correlation in the Y-direction displacement could more effectively capture the compression damage process of the specimen. The final displacement could also reflect the total displacement of the specimen. This suggests that utilizing digital image correlation to analyze the deformation, movement, damage, and rupture characteristics of the surrounding rock in similar simulation experiments of unloading complex stress path roadway excavation is reliable.

5. Conclusions

The similarity in the mechanical behavior and rupture characteristics between similar materials and the original coal rock can forms the basis for conducting similar simulation laboratory tests. The similarity ratios were determined through an orthogonal test. This study focused on the similarity of stress–strain curves, elastic modulus, Poisson’s ratio, and rupture characteristics. The influencing factors were analyzed to investigate the similarity of acoustic properties and strain localization in similar materials. The specific conclusions are as follows:
The geometric similarity ratio, Poisson’s similarity ratio, volumetric similarity ratio, stress similarity ratio, modulus of elasticity similarity ratio, gravitational acceleration, and unloading similarity ratio were derived based on the principles of similarity theory. The physico-mechanical parameters of various coal rocks from the Dongguan Coal Mine were provided, serving as the foundation for similarity proportioning.
Orthogonal tests with three factors (sand–cement ratio, carbon paste ratio, and water content) and four levels were established, and the stress–strain curves of the specimens of the similarly proportioned materials were consistent with the four typical phases of the rock, which indicated that the use of similar simulated materials in strength and deformation analyses had strong reliability. Relative time, transverse strain, and axial strain relationship curves were drawn and then Poisson’s ratio formula was used to obtain a similar material ratio specimen Poisson ratio of 0.26. The similar material showed longitudinal cleavage to the main, and the local existence of shear damage, cleavage form, and typical rupture forms were consistent, indicating that the use of similar ratios of materials to study rupture morphology is feasible.
In-depth analysis of the relationship between the sand–cement ratio, carbo paste ratio, and water content, and characteristic indexes using the polar deviation, revealed that the sensitivity of uniaxial compressive strength was B > A > C in the order of large to small, the sensitivity of modulus of elasticity was A > B > C in the order of large to small, and the sensitivity of Poisson’s ratio was A > B > C in the order of large to small.
Through the sensitivity analysis, it was found that the sand–glue ratio, carbon paste ratio, and water content exhibited a linear relationship with the mechanical properties of the materials. Only the water content showed a nonlinear relationship with the uniaxial compressive strength. Multivariate linear regression was conducted using SPSS to determine the precise proportion of similar materials required, combining the mechanical properties of the coal rock and the similarity ratio. The standardized residuals conformed to a normal distribution, and the P–P plot aligned closely with a straight line. MATLAB was used to invert the matrix to obtain the equation for the ratio relationship.
Comparing the two, it was found that the peak acoustic emission counts in the pre-peak showed a trend of growth, decline, and growth again. This indicated that the similar material specimens could reflect the changing pattern of the original rock specimens.
The localization characteristics of the rupture of the similar material specimen were illustrated using a digital scattering spot main strain cloud map and a Carmon sheet map of the strain superimposed on the specimen. Through uniaxial compression digital scattering experiments, it was possible to reveal the distribution of the strain field in the specimen and the mechanism of rupture. This method can accurately predict and forecast the potential location of damage and the form of occurrence.
The overall pattern of change in the selected feature points of the similar material specimens was consistent, all exhibiting characteristics in three stages. The digital scattering Y-direction displacement could more effectively reflect the compression damage process of the specimen. Additionally, the final displacement could also be used to provide feedback on the total displacement of the specimen.

Author Contributions

G.L. and D.W. wrote the main text of the manuscript and the experimental data processing and summaries, while Y.Z., S.W. and Q.Z. were the co-authors responsible for collecting relevant information to organize the structure of the paper. All authors have read and agreed to the published version of the manuscript.

Funding

This research was funded by University Nursing Program for Young Scholars with Creative Talents in Heilongjiang Province, grant number UNPYSCT-2020029; Natural Science Foundation of Heilongjiang Province, grant number YQ2023E039; Basic Scientific Research Operating Expenses of Heilongjiang Provincial Universities and Colleges of China, grant number 2022-KYYWF-0554; Scientific and Technological Key Project of “Revealing the List and Taking Command” in Heilongjiang Province, grant number 2021ZXJ02A03, 2021ZXJ02A04.

Data Availability Statement

The datasets used and analyzed in this study can be provided by the authors Gang Liu and Dongwei Wang according to reasonable requirements.

Acknowledgments

This research was supported by the Heilongjiang Ground Pressure and Gas Control in Deep Mining Key Laboratory, Heilongjiang University of Science and Technology.

Conflicts of Interest

The authors declare no conflicts of interest.

References

  1. Yang, Y.; Hu, F. Research on deformation and damage law of similar model based on digital scattering technology. Min. Technol. 2020, 20, 146–148+152. [Google Scholar]
  2. Yang, Y. Study and Application of Digital Speckle Technique in Physical Similar Simulation Experiment of Protective Layer Mining. Master’s Thesis, Chongqing University, Chongqing, China, 2017. [Google Scholar]
  3. Chen, Z.; Zhang, Y.; Zhou, J. Experimental study of deep tunnel surrounding rock rockburst proneness with similarity material simulating method based on digital speckle correlation technique. Geotechnics 2011, 32 (Suppl. S1), 141–148. [Google Scholar]
  4. Dong, J.; Yang, S.; Li, B.; Hu, Y. Experimental study on the tensile strength of rock-like materials containing two pre-existing coplanar flissures. Eng. Mech. 2020, 37, 188–201. [Google Scholar]
  5. Zhou, Z.L.; Wang, H.Q.; Cai, X.; Zang, H.Z.; Chen, L.; Liu, F. Bearing characteristics and fatigue damage mechanism of multi-pillar system subjected to different cyclic loads. J. Cent. South Univ. Sci. Technol. Min. Metall. 2020, 27, 542–553. [Google Scholar] [CrossRef]
  6. Li, B.; Yang, S.; Tian, W. Experimental study on mechanical behavior of brazilian disk with two filled and unfilled fissures. J. Appl. Basic Eng. Sci. 2019, 27, 628–645. [Google Scholar]
  7. Wang, Z.; Sun, Y.; Zhang, S.; Song, W.; Wang, Y. Study on failure evolution of in-seam boreholes under cycle constant vertical loadings. J. Rock Mech. Eng. 2020, 39, 262–271. [Google Scholar]
  8. Du, X. Experimental Study on the Effect of Loading Rate and Ratio on the Failure Characteristics of Similar Materials. Master’s Thesis, Xi’an University of Science and Technology, Xi’an, China, 2019. [Google Scholar]
  9. Yu, Y. Research on the Mechanical Properties of Rock-like Materials under the Loading and Unloading Conditions. Master’s Thesis, Kunming University of Science and Technology, Kunming, China, 2018. [Google Scholar]
  10. Li, S.; Cheng, X.; Liu, C.; Cheng, C.; Yang, M. Damage characteristics and space-time evolution law of rock similar material under uniaxial compression. J. Coal 2017, 42 (Suppl. S1), 104–111. [Google Scholar]
  11. Liu, X.; Ye, Y.; Wang, Q.; Zhang, H.; Liu, Y.; Liu, Y. Mechanical properties of similar material specimens of composite rock masses with different strengths under uniaxial compression. Geotechnics 2017, 38 (Suppl. S2), 183–190. [Google Scholar]
  12. Wang, H.W.; Zhou, H.W.; Zuo, J.P.; Wang, Z.G.; Xie, H.P. Application of optical measurement method in strata movement smiulation expermient. J. Coal 2006, 31, 278–281. [Google Scholar]
  13. Liu, X.J.; Song, S.L.; Fan, D.Y.; Fan, W.C. Experimental study on deformation and failure evolution of surrounding rock for deep super-large section chamber group. J. Min. Saf. Eng. 2020, 37, 40–49. [Google Scholar]
  14. Lu, X.F.; Pan, Y.S.; Li, Z.H.; Dai, S.H. Similarity-simulation tests for failure law of a rock burst roadway under shock wave. Vib. Shock 2011, 30, 212–215+235. [Google Scholar]
  15. Bi, D. Application of Digital Scatter Correlation Method in Similar Simulation of Underground Engineering. Master’s Thesis, Shandong University of Science and Technology, Qingdao, China, 2017. [Google Scholar]
  16. Wang, Z.G.; Zhou, H.W.; Xie, H.P.; Zuo, J.P.; Wang, H.W. Experimental study of the rule of overlying strata movement and breakage in deep mining. Exp. Mech. 2008, 23, 503–510. [Google Scholar]
  17. Shi, F.; Wang, H.; Shu, C. Similar simulation study on the influence of seam angle change ondeformation law of overburden strata in coal seam mining. J. Chongqing Univ. 2018, 41, 36–45. [Google Scholar]
  18. Wei, G. Similarity experiment of rock fracture evolution after covering layer exploitation in hongling coal mine. J. Liaoning Univ. Eng. Technol. 2012, 31, 185–188. [Google Scholar]
  19. Pan, Y.; Lu, X.; Li, Z.; Dai, S. Experimental study of dynamic failure process of roadway under high velocity impact loading. Geotech. Mech. 2011, 32, 1281–1286. [Google Scholar]
  20. Wang, L.; Yan, J.; Ma, L.; Feng, H.E. Experimental study of deformation and failure forslopes with weak planes under earthouake effect. J. Eng. Geol. 2012, 20, 471–477. [Google Scholar]
  21. Li, T.; Zhong, Y.; Pan, H.; Chen, G. Failure Characteristics Analysis on Physical Model of Rock Burst in High In-situ Stress Tunnel. J. Undergr. Space Eng. 2019, 15, 1639–1645. [Google Scholar]
  22. Zhao, C.; Liu, J.; Lyu, C.; Chen, W.; Li, X.; Li, Z. Experimental study on mechanical properties, permeability and energy characteristics of limestone from through-coal seam (TCS) tunnel. Eng. Geol. 2022, 303, 106673. [Google Scholar] [CrossRef]
  23. Zhao, C.; Liu, J.; Lyu, C.; Xu, H.; Lin, H. Study on the shear-slip process and characteristics of fracture in shale. Eng. Geol. 2023, 319, 107097. [Google Scholar] [CrossRef]
  24. Gu, H.; Lai, X.; Tao, M.; Cao, W.; Yang, Z. The role of porosity in the dynamic disturbance resistance of water-saturated coal. Int. J. Rock Mech. Min. Sci. 2023, 166, 105388. [Google Scholar] [CrossRef]
  25. Zhang, Q. Similar Test and Numerical Simulation of Coal Seam Mining in Tarangaole Mining Area. Master’s Thesis, Jilin University, Changchun, China, 2019. [Google Scholar]
  26. Li, B. Study on Induced Mechanism of Roadway Floor Rock Burst under Super-Thick Conglomerate Stratum. Ph.D. Thesis, Henan University of Science and Technology, Luoyang, China, 2014. [Google Scholar]
  27. Tan, Y.; Wu, S.; Ning, J.; Zang, C.; Yin, Z.; Gu, S. Mining Pressure and Strata Control; Coal Industry Press: Beijing, China, 2008. [Google Scholar]
  28. Xiao, J. Selection of Similar Materials for Model Test & Research on Similar Material Proportioning Test. Master’s Thesis, Beijing Jiaotong University, Beijing, China, 2013. [Google Scholar]
  29. Gu, D. Similar Materials and Similar Models; China University of Mining and Technology Press: Xuzhou, China, 1995. [Google Scholar]
  30. Shi, X.; Liu, B.; Xiao, J. A method for determining the ratio of similar materials with cement and plaster as bonding agents. Geotechnics 2015, 36, 1357–1362. [Google Scholar]
  31. Cai, M. Rock Mechanics and Engineering, 2nd ed.; Science Press: Beijing, China, 2013. [Google Scholar]
  32. Zhu, H.; Xie, M. Orthogonal test route for determining similar material ratios. J. Wuhan Inst. Water Conserv. Electr. Power 1990, 23, 103–109. [Google Scholar]
Figure 1. Preparation process of rock standard specimen.
Processes 12 00454 g001
Figure 2. Similar material proportioning process.
Processes 12 00454 g002
Figure 3. Prepared specimens.
Processes 12 00454 g003
Figure 4. Basic mechanics of the experimental system.
Processes 12 00454 g004
Figure 5. xsf9-2 stress–strain curve.
Processes 12 00454 g005
Figure 6. Digital scattering method to calculate Poisson’s ratio for similar materials.
Processes 12 00454 g006
Figure 7. Variation in the xsf9-2 specimen in different stages.
Processes 12 00454 g007
Figure 8. Uniaxial compressive strength sensitivity analysis.
Processes 12 00454 g008
Figure 9. Modulus of elasticity sensitivity analysis.
Processes 12 00454 g009
Figure 10. Poisson’s ratio sensitivity analysis.
Processes 12 00454 g010
Figure 11. Normal P–P plot of regression standardized residuals.
Processes 12 00454 g011
Figure 12. Acoustic emission vs. stress–strain curve.
Processes 12 00454 g012aProcesses 12 00454 g012b
Figure 13. Digital scattering correlation method for principal strains with Carmon sheets.
Processes 12 00454 g013aProcesses 12 00454 g013b
Figure 14. Y-direction displacement cloud for the digital scattering correlation method.
Processes 12 00454 g014
Figure 15. Y-direction displacement profile of the digital scattering correlation method.
Processes 12 00454 g015
Table 1. Measurement results of physical and mechanical parameters of coal rock.
Coal RockDensity
(g·cm−3)
Tensile Strength
(MPa)
Compressive Strength
(MPa)
Modulus of Elasticity
(GPa)
Poisson’s Ratio
pulverized sandstone2.696.36148.0224.830.14
fine sandstone2.584.28122.9017.270.18
medium sandstone2.442.94109.5311.040.20
coarse sandstone2.351.2379.436.810.22
coal1.340.847.801.810.32
Table 2. Orthogonal levels of similar materials.
ConsiderationsSand-to-Cement
Ratio (A)
Carbon Paste Ratio (B)Water Content (C)Note
Level
17:14:61/8In order to ensure compactness, the full load of the jack (10 MPa, 5 min) was used
28:15:51/9
39:16:41/10
410:17:31/11
Table 3. Similar material proportioning schemes.
Column NumberSand
(kg)
Calcium Carbonate
(kg)
Gypsum
(kg)
Water Weight
(kg)
Note
11.820.110.160.19
21.820.130.130.26
31.820.160.110.23
41.820.180.080.21
51.860.110.160.26
61.860.130.130.23
71.860.160.110.21
81.860.180.080.19
91.880.110.160.23
101.880.130.130.21
111.880.160.110.19
121.880.180.080.26
131.900.110.160.21
141.900.130.130.19
151.900.160.110.26
161.900.180.080.23
Table 4. Analysis of test results for similar materials.
Test NumberABCUniaxial
Compressive Strength
(MPa)
Modulus of Elasticity
(MPa)
Poisson’s Ratio
11140.4590.0590.272
21210.3650.0430.269
31320.3270.0360.243
41430.2510.0320.275
52110.3740.0380.284
62220.3170.0320.272
72330.2860.0290.258
82440.2100.0260.222
93120.3260.0350.261
103230.2890.0320.246
113340.2000.0260.256
123410.2120.0200.203
134130.2990.0220.248
144240.2060.0270.207
154310.1880.0330.219
164420.1760.0210.245
K11.4021.4581.076compressive strength
K21.1871.1771.138
K31.0271.0011.145
K40.8680.8481.125
k10.3500.3650.269
k20.2970.2940.285
k30.2570.2500.286
k40.2170.2120.281
Polar deviation R0.1330.1520.017
order of priorityB > A > C
excellent levelA4B4C1
superior combinationB4A4C1
K10.1700.1540.138modulus of elasticity
K20.1250.1340.134
K30.1130.1240.124
K40.1030.0990.115
k10.0430.0390.035
k20.0310.0340.034
k30.0280.0310.031
k40.0260.0250.029
Polar deviation R0.0170.0140.006
order of priorityA > B > C
excellent levelA4B4C4
superior combinationA4B4C4
K11.0591.0660.958Poisson’s ratio
K21.0350.9930.976
K30.9670.9761.021
K40.9200.9461.027
k10.2650.2670.239
k20.2590.2480.244
k30.2420.2440.255
k40.2300.2360.257
Polar deviation R0.0350.0300.017
order of priorityA > B > C
excellent levelA4B4C1
superior combinationA4B4C1
Disclaimer/Publisher’s Note: The statements, opinions and data contained in all publications are solely those of the individual author(s) and contributor(s) and not of MDPI and/or the editor(s). MDPI and/or the editor(s) disclaim responsibility for any injury to people or property resulting from any ideas, methods, instructions or products referred to in the content.

