
Slurry Transportation Characteristics of Potash Mine Cemented Paste Backfills via Loop Test Processing


Abstract
1. Introduction
2. Materials and Methods
2.1. Materials
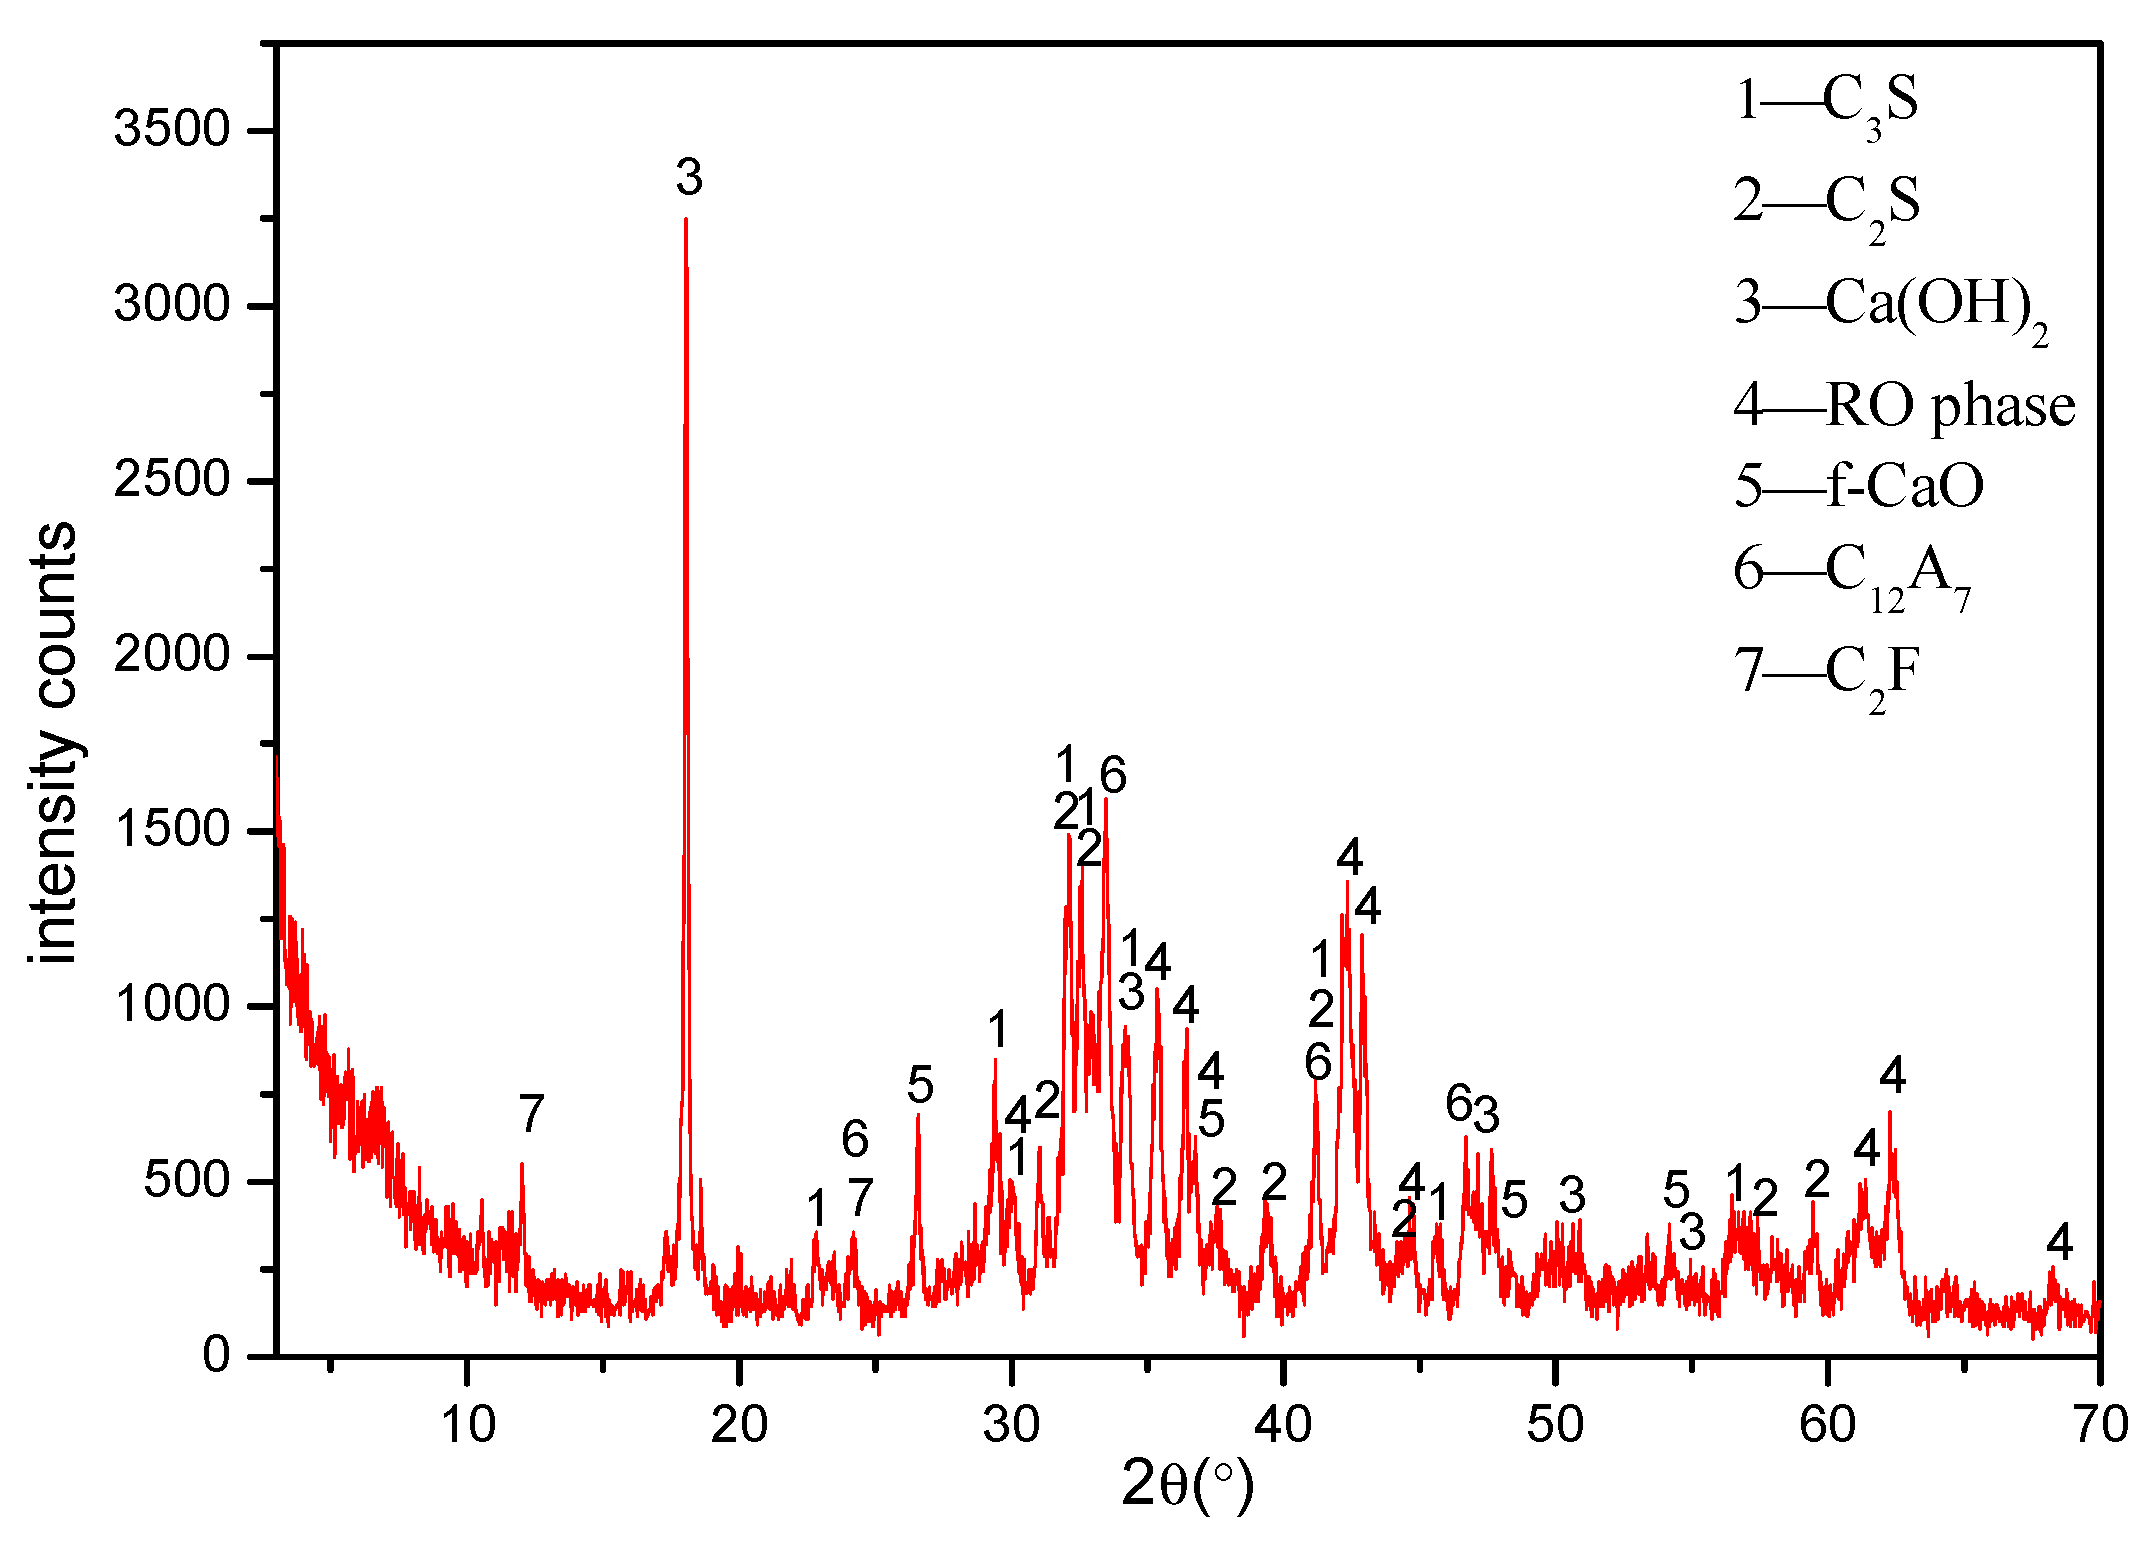
2.1.1. Steel Slag
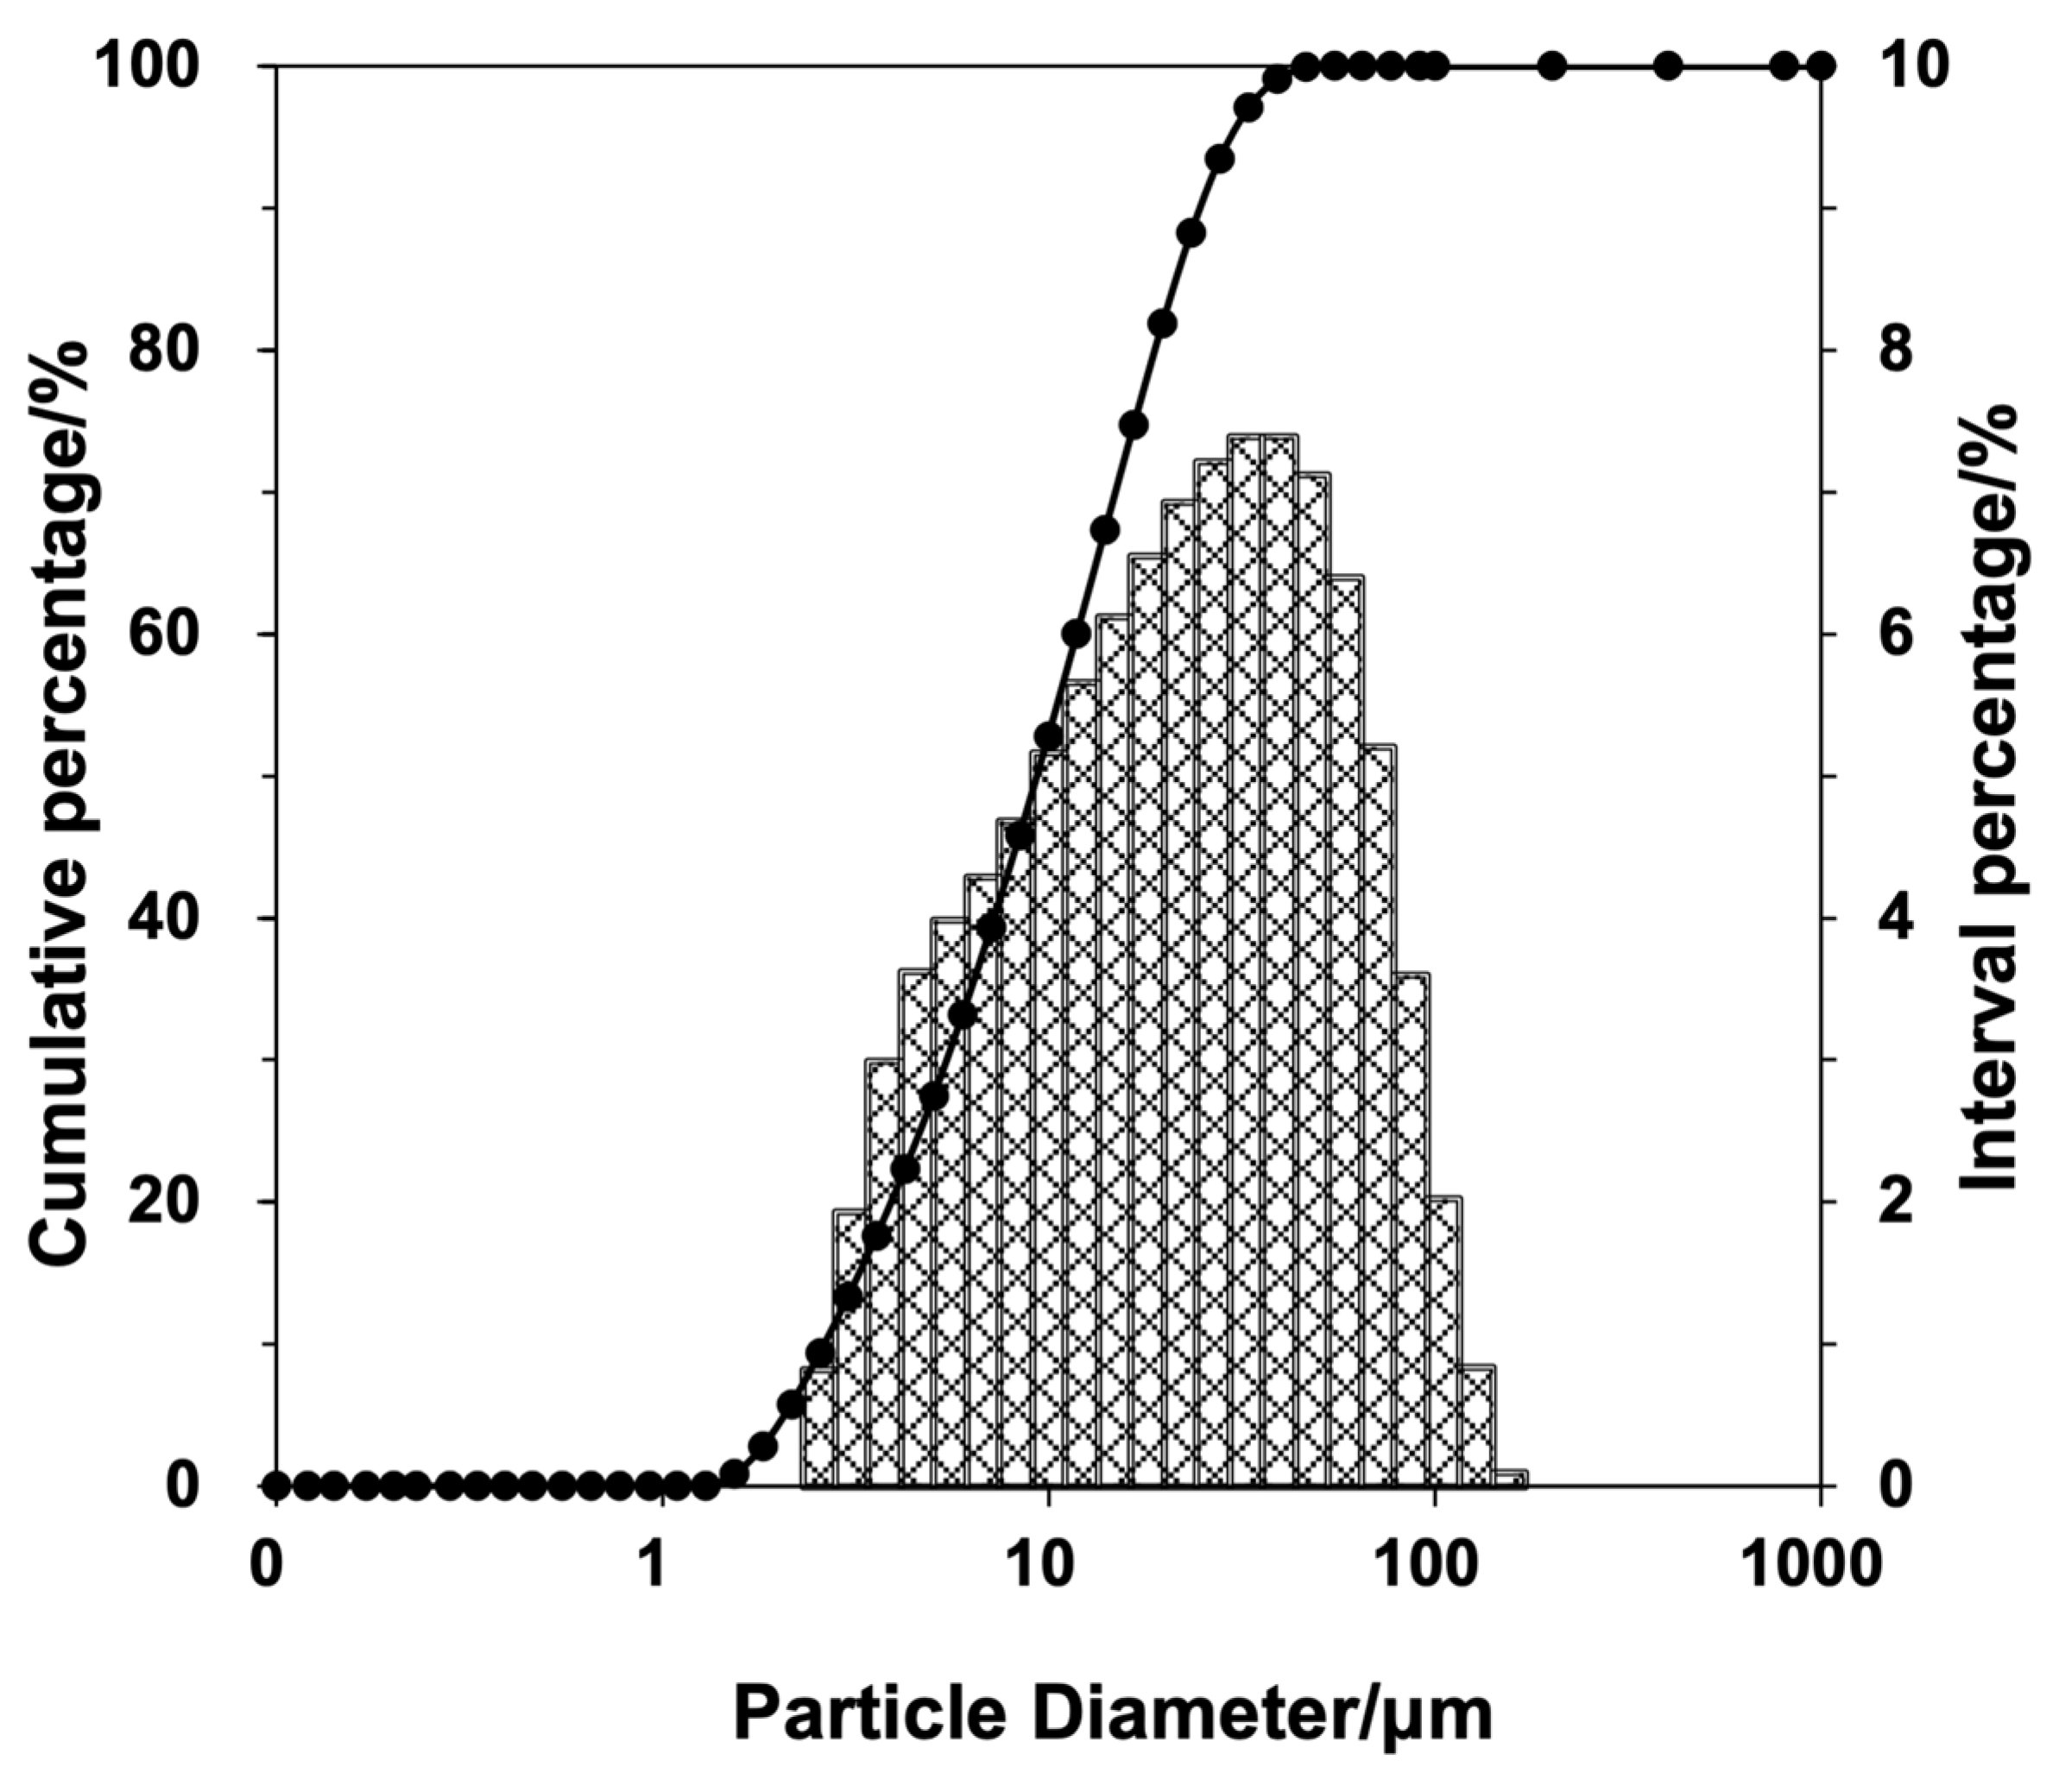
2.1.2. Tail Salt Aggregate
2.1.3. Waste Brine Water
2.2. Loop Test Scheme
2.3. Test Methods
3. Results
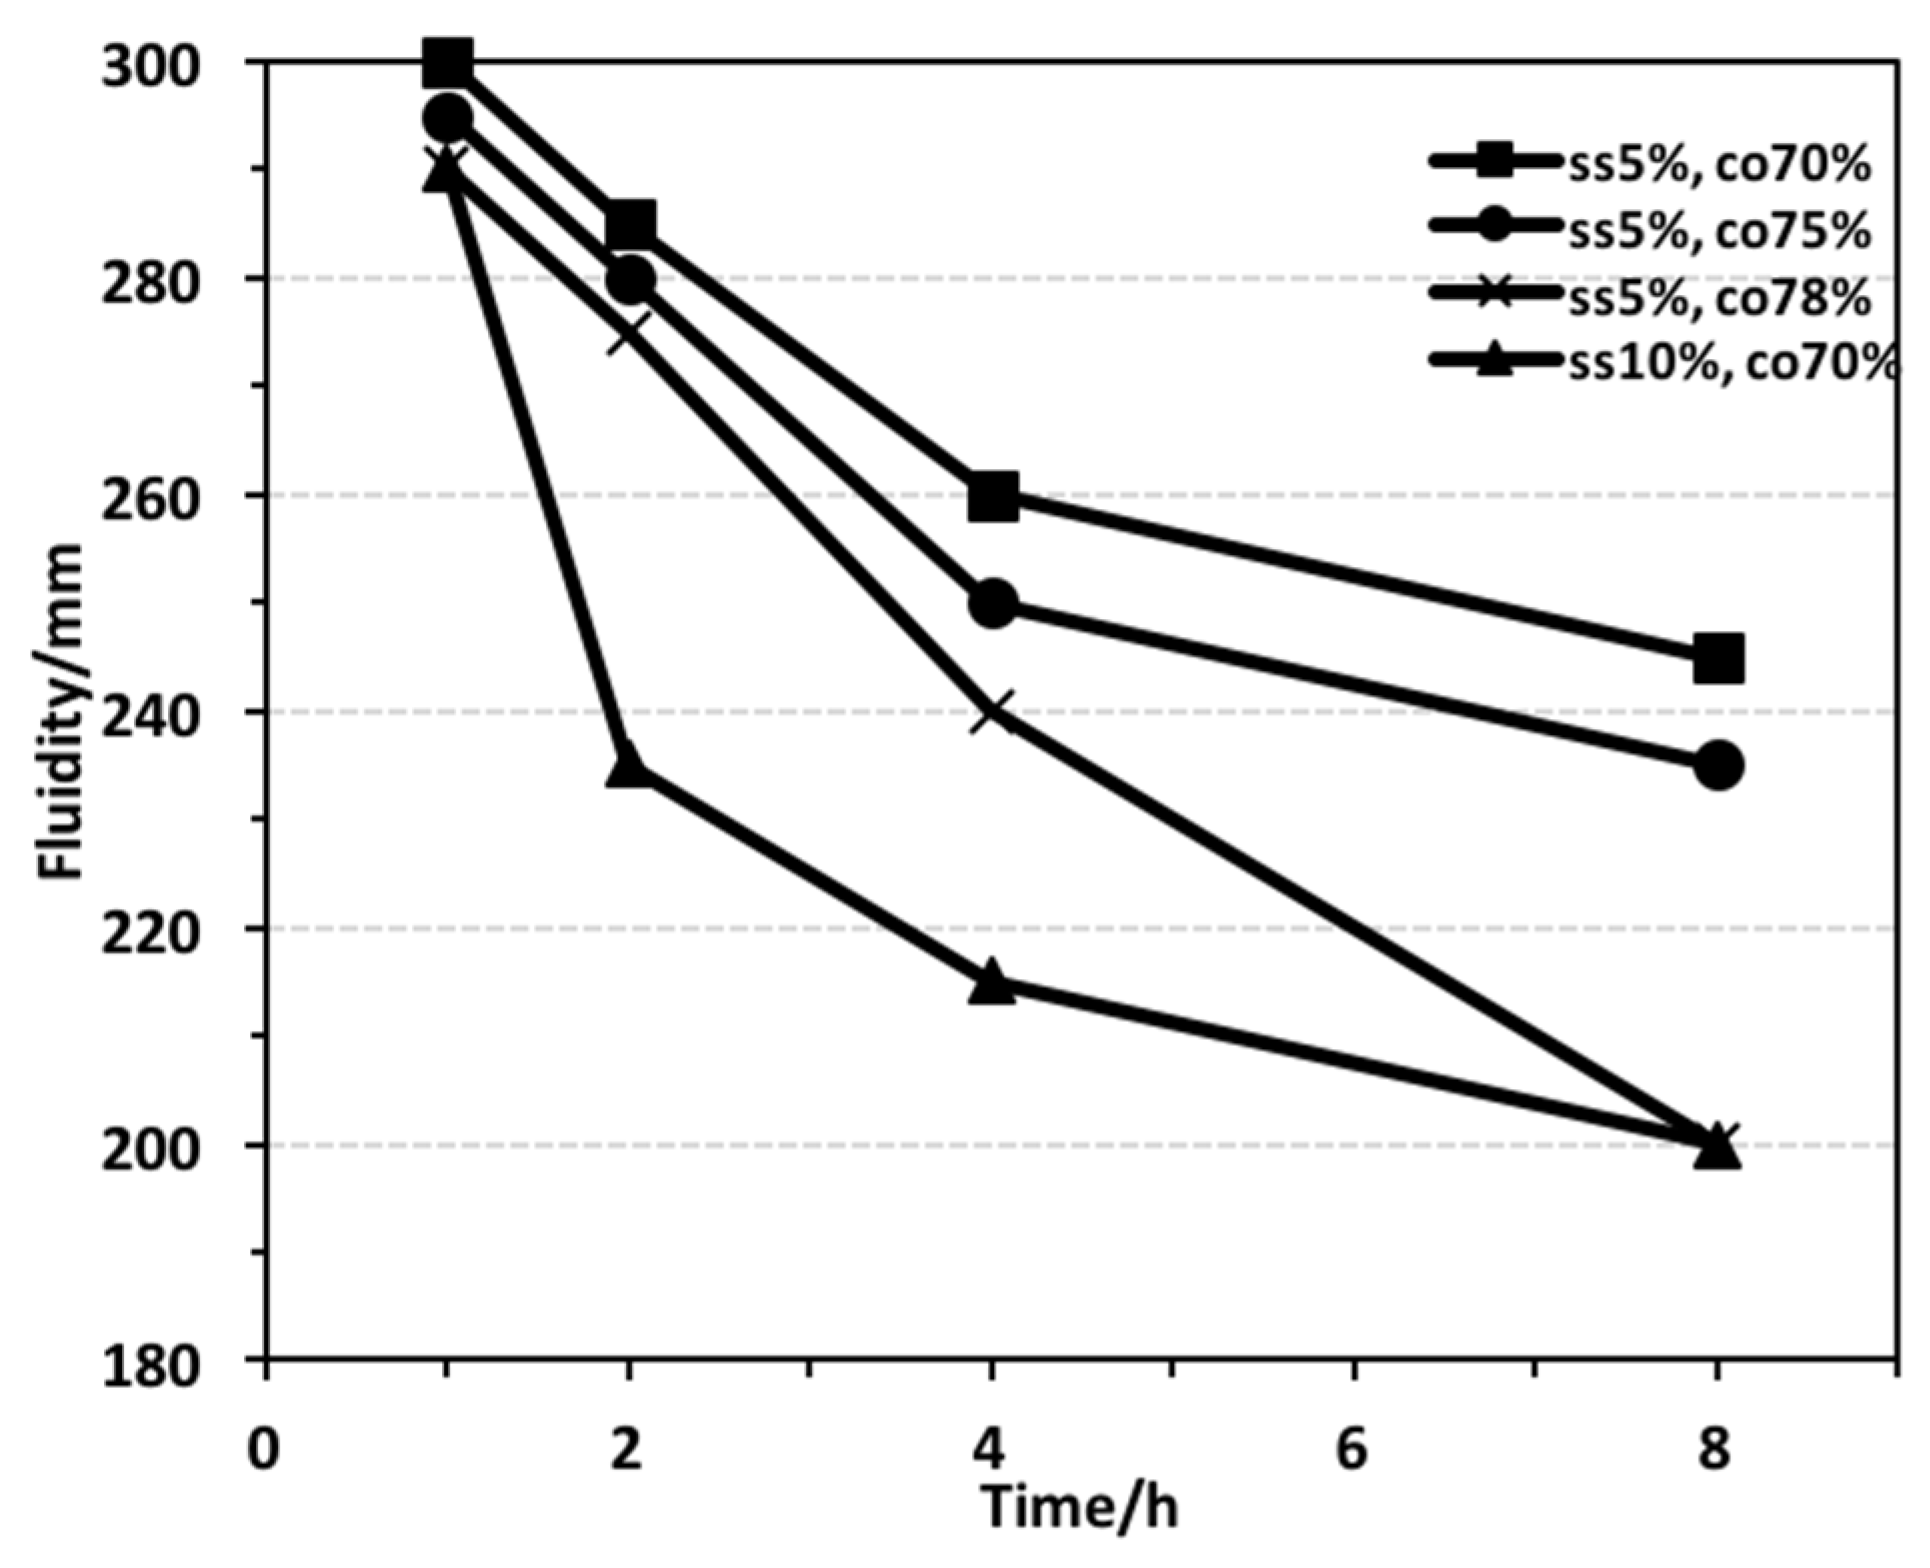
3.1. Results of Fluidity Performance Test
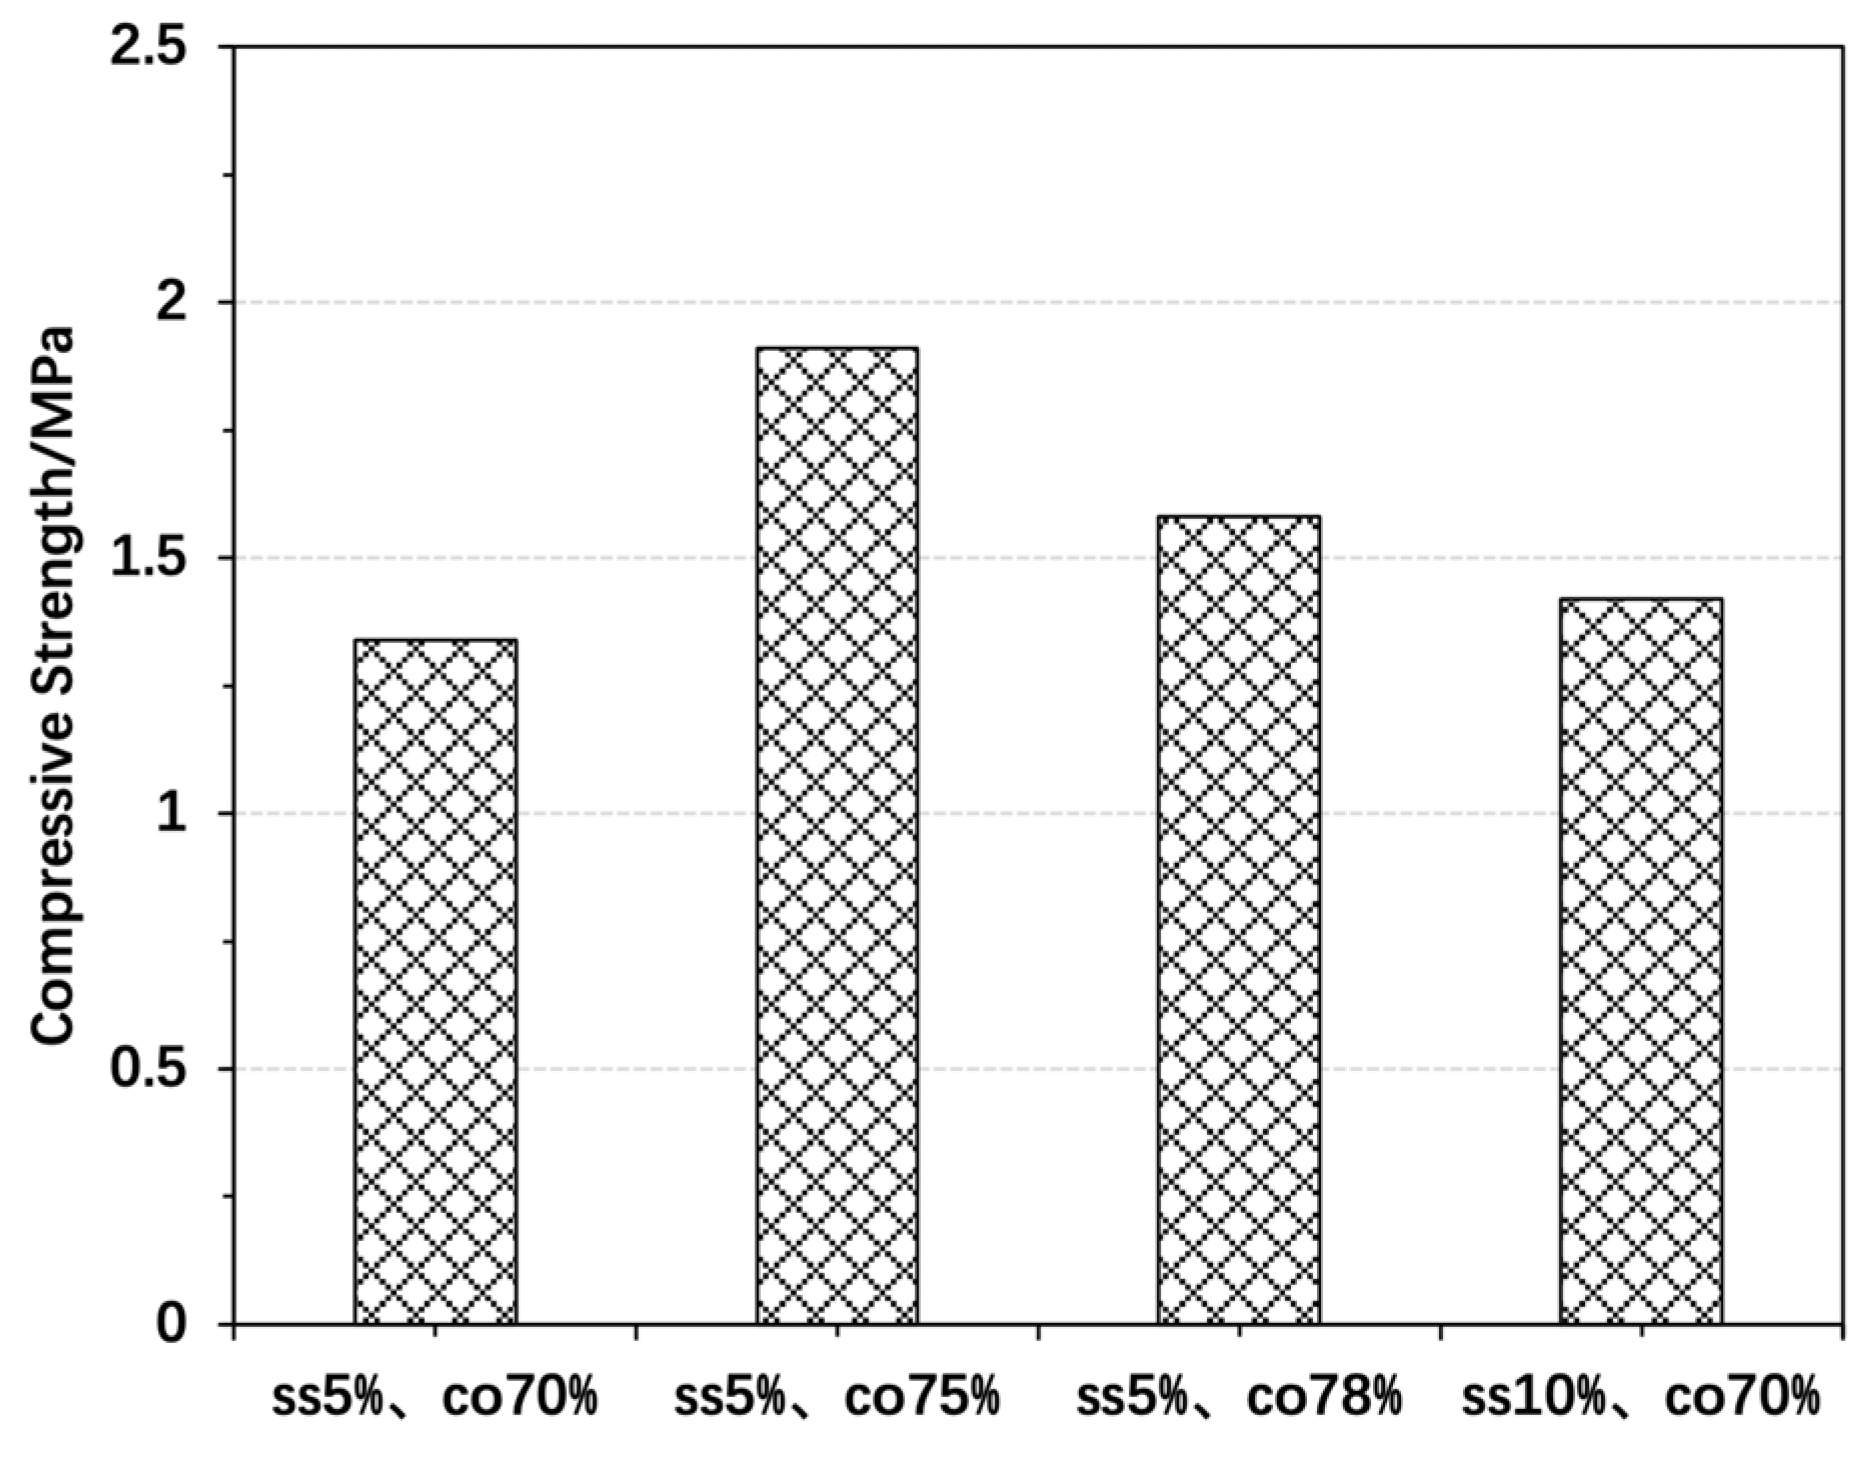
3.2. Mechanical Properties Results
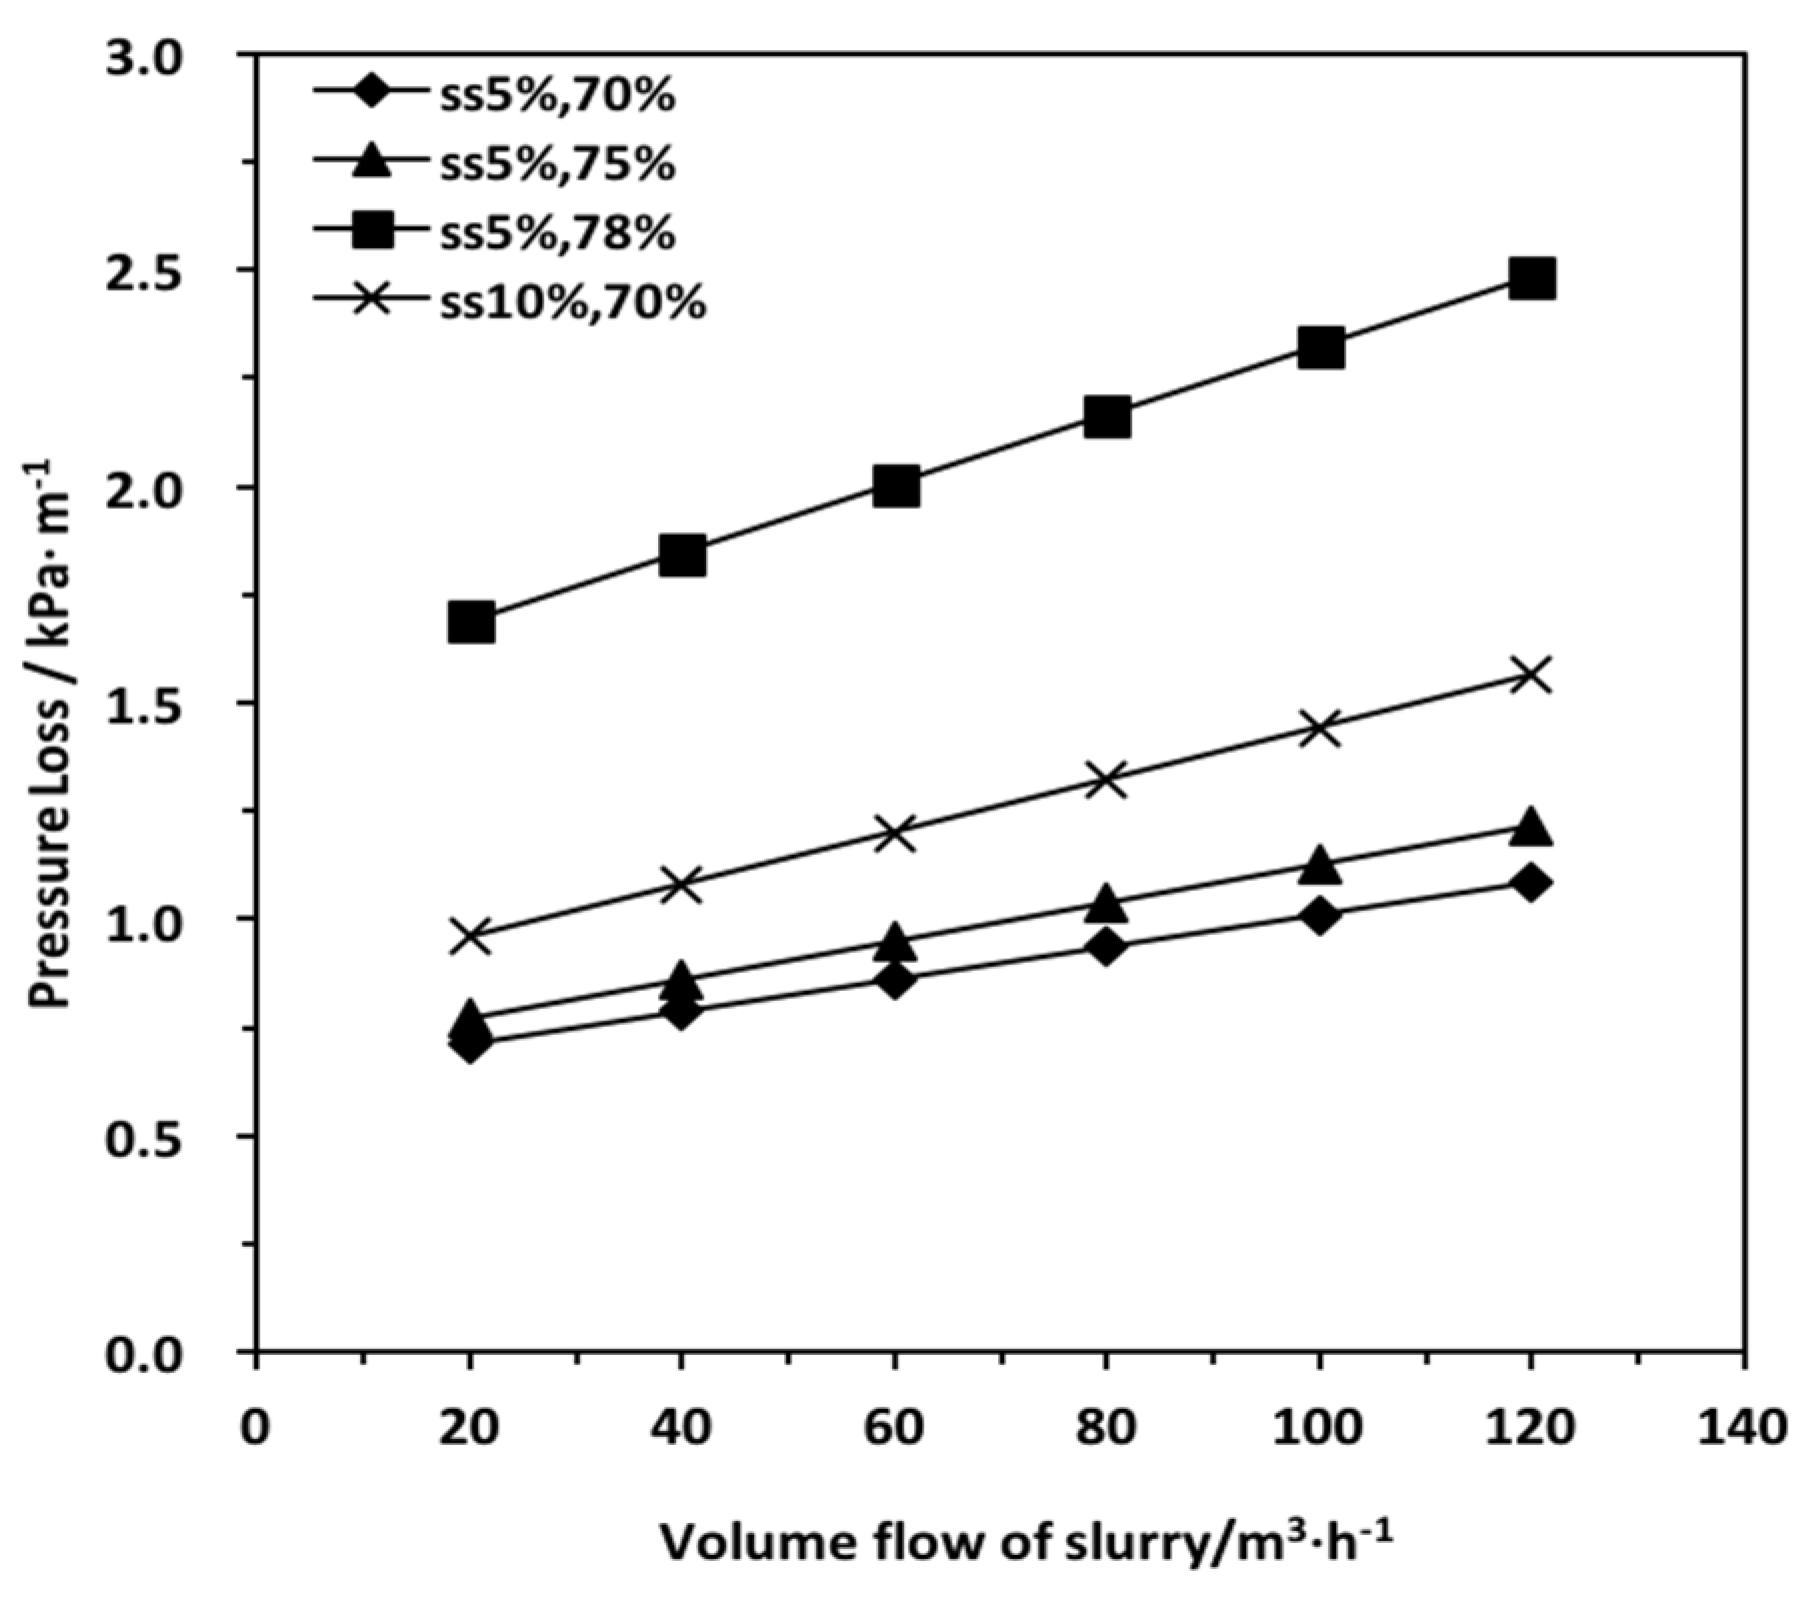
3.3. Results of Rheological Property Test
3.4. Determination of the Simulation Formula
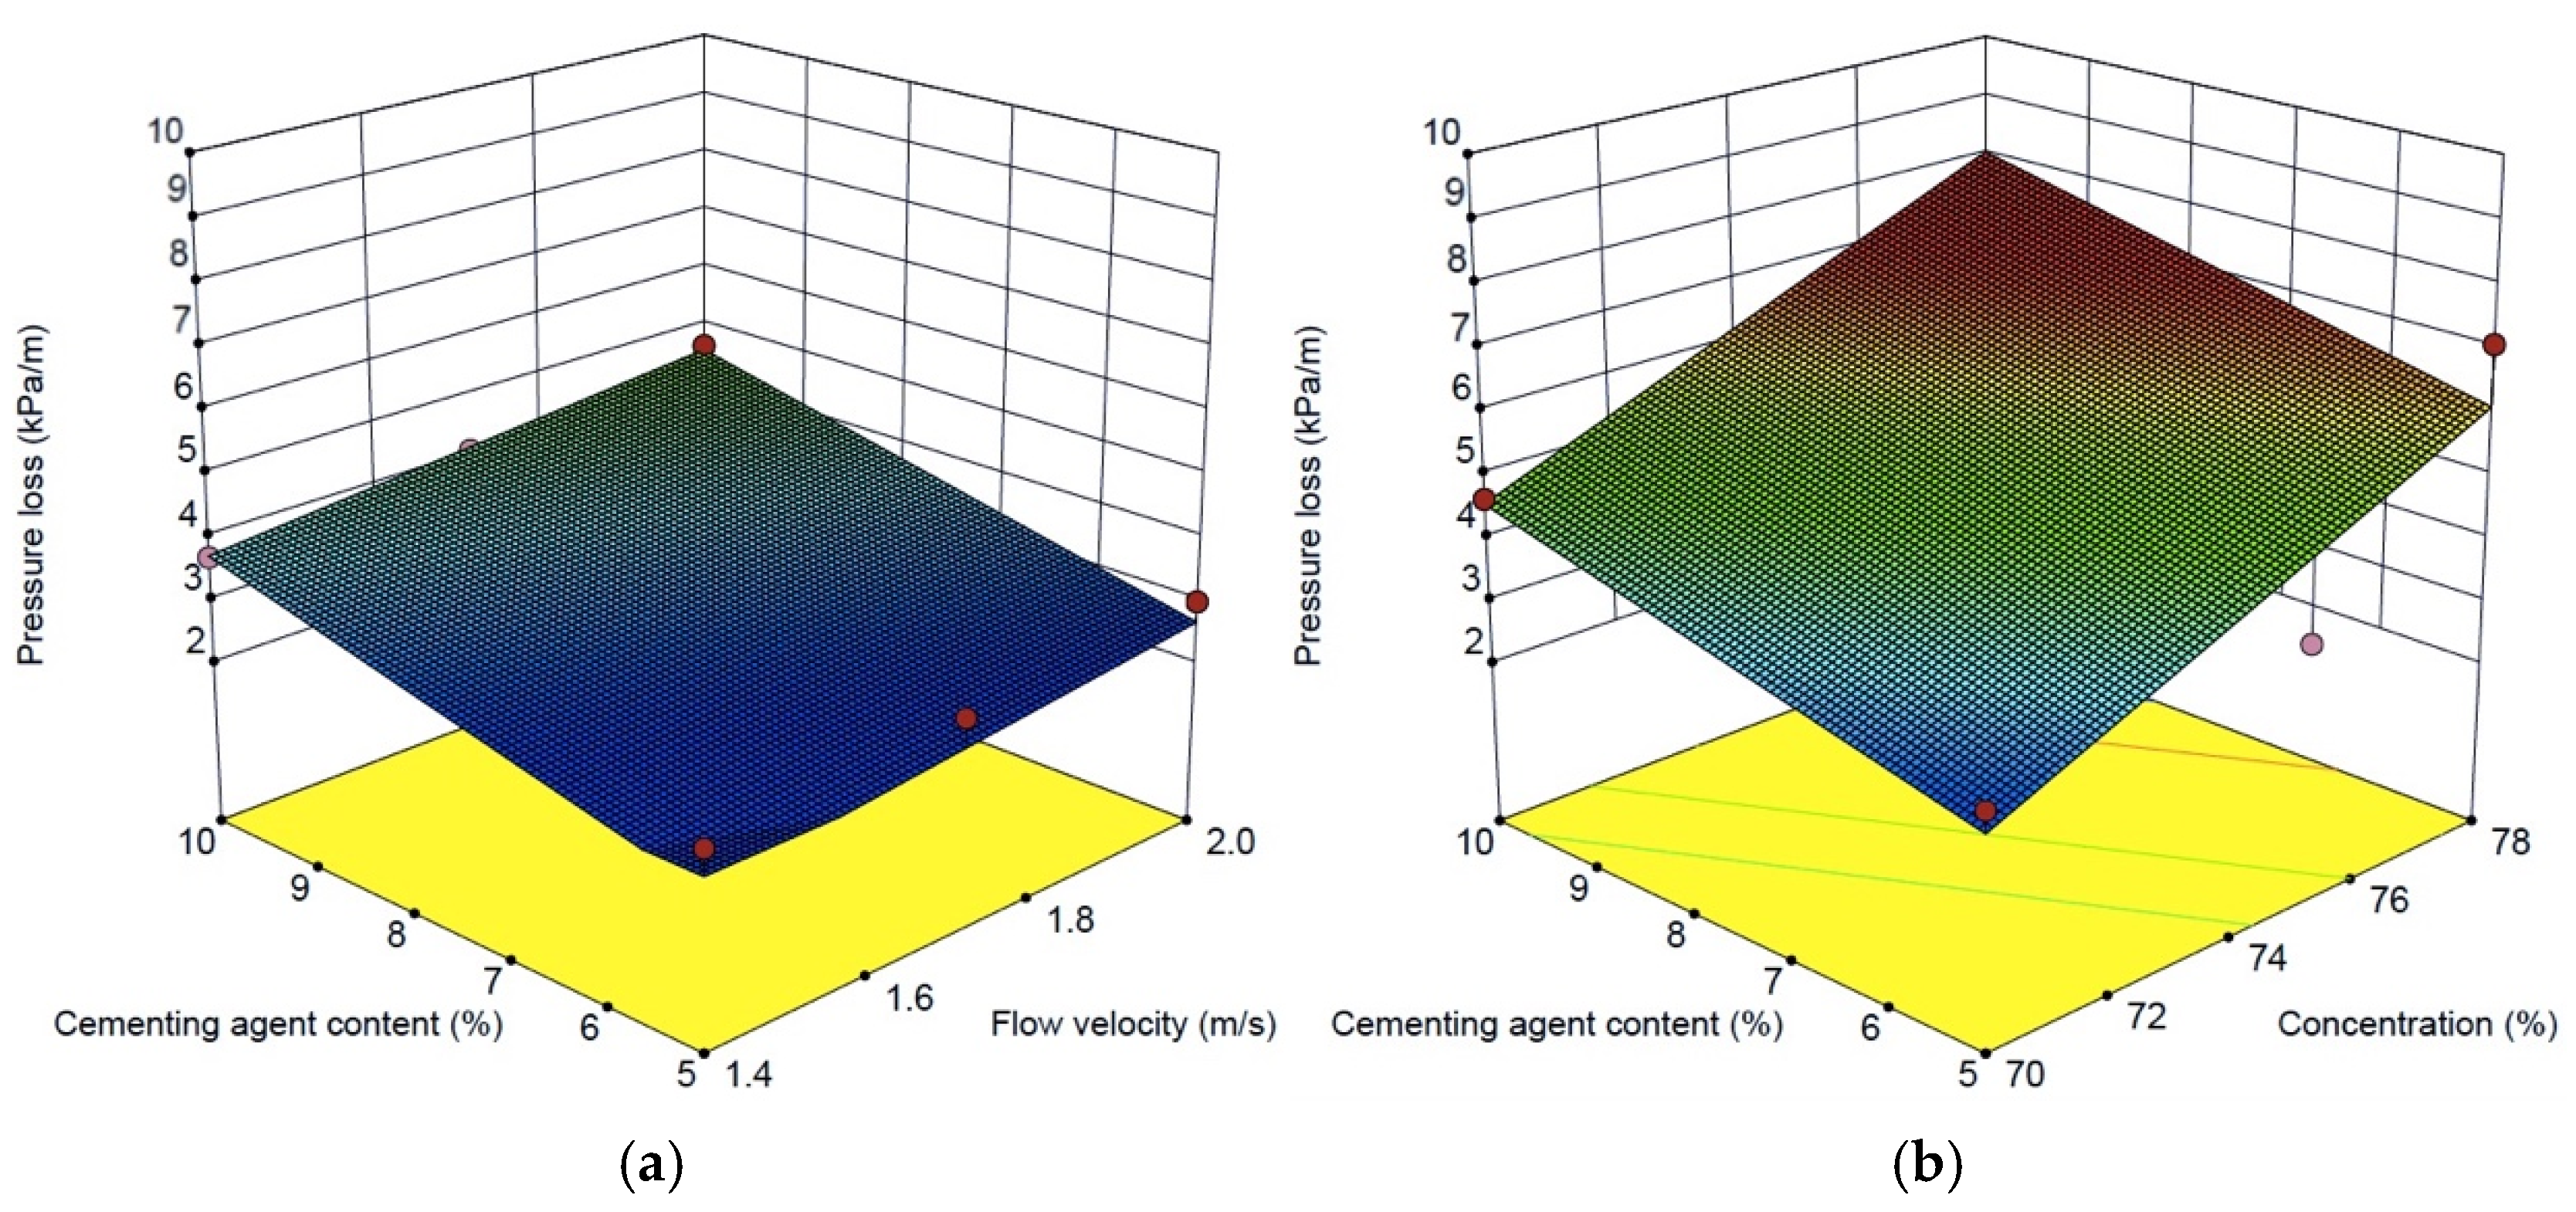
3.5. Response Surface Analysis
4. Conclusions
Author Contributions
Funding
Data Availability Statement
Conflicts of Interest
References
- Fall, M.; Benzaazoua, M. Modeling the effect of sulphate on strength development of paste backfill and binder mixture optimization. Cem. Concr. Res. 2005, 35, 301–314. [Google Scholar] [CrossRef]
- Fall, M.; Pokharel, M. Coupled effects of sulphate and temperature on the strength development of cemented tailings backfills: Portland cement-paste backfill. Cem. Concer. Compos. 2010, 32, 819–828. [Google Scholar] [CrossRef]
- Ghirian, A.; Fall, M. Coupled thermo-hydro-mechanical-chemical behaviour of cemented paste backfill in column experiments. Part I: Physical, hydraulic and thermal processes and characteristics. Eng. Geol. 2013, 164, 195–207. [Google Scholar] [CrossRef]
- Tariq, A.; Yanful, E.K. A review of binders used in cemented paste tailings for underground and surface disposal practices. J. Environ. Manag. 2013, 131, 138–149. [Google Scholar] [CrossRef] [PubMed]
- Xu, X.; Zeng, B. Study on the failings backfill technology of potash mine in Laos. Yunnan Chem. Technol. 2013, 40, 41–43. [Google Scholar]
- Liu, B.; Gao, Y.T.; Jin, A.B.; Wang, X. Influence of water loss on mechanical properties of superfine tailing–blast-furnace slag backfill. Constr. Build. Mater. 2020, 246, 118482. [Google Scholar] [CrossRef]
- Liu, B.; Gao, Y.T.; Jin, A.B.; Wang, X. Dynamic characteristics of superfine tailings-blast furnace slag backfill featuring filling surface. Constr. Build. Mater. 2020, 242, 118173. [Google Scholar] [CrossRef]
- Wang, X.; Wang, Q.; Zhang, B.; Ni, W.; Jin, R.; Zhao, K. Hydration mechanism of using steel slag as binder for backfill materials in potash mines. Chin. J. Eng. 2018, 40, 1177–1186. [Google Scholar]
- Wang, X.; Ni, W.; Jin, R.; Liu, B. Formation of Friedel’s salt using steel slag and potash mine brine water. Constr. Build. Mater. 2019, 220, 119–127. [Google Scholar] [CrossRef]
- Zheng, B.K.; Li, X.D.; Sheng, J. Study on transportation performance of high-density slurry based on round-pipe Experiment. Min. Res. Dev. 2012, 6, 31–34. [Google Scholar]
- Li, T. Dynamic Characteristics Analysis of Slurry; Wuhan University of Technology: Wuhan, China, 2013; pp. 269–270. [Google Scholar]
- Deng, D.Q.; Gao, Y.T.; Yang, Y.L.; Wu, S.C. Archaeological properties of full failings slurry in pipeline transportation based on the biomechanics theory. Chin. J. Eng. 2009, 31, 1380–1384. [Google Scholar]
- Wu, A.X.; Wang, H.J. Theory and Technology of Metal ore Paste Filling; Science Press: Beijing, China, 2015. [Google Scholar]
- Zhang, B.; Liu, X.H.; Wang, Y.M. Study on Archaeological Properties of the Paste Filling Slurry based on Inclined Pipeline Experiment. Met. Mine 2014, 32, 22–26. [Google Scholar]
- Liu, X.H.; Wang, G.L.; Zhao, Z.B.; Wang, S.Y. Study on the flow resistance characteristics of structure fluid backfilling slurry based on loop pipe testing. China Molybdenum Ind. 2016, 40, 20–23. [Google Scholar]
- Sun, P.; Guo, Z.C. Research progress on cementation activity and its activation of steel slag. Bull. Chin. Ceram. Soc. 2014, 33, 2230–2235. [Google Scholar]
- Huang, H. The excitation and application of the activity for steel slag. Fly Ash Compr. Util. 2012, 2, 51–54. [Google Scholar]
- Wang, Q.; Yan, P.Y. Hydration properties of basic oxygen furnace steel slag. Constr. Build. Mater. 2009, 24, 1134–1140. [Google Scholar] [CrossRef]
- Li, G.Z.; Yu, Y.C. Study of implementing computer simulation of filling slurry round pipe-e-test. Gold 2008, 29, 21–24. [Google Scholar]
- Wang, B.W.; Xiong, T.Y.; Gao, L.J.; Chai, Y.P.; Cui, X.Y.; Ding, W. Effects of failings gradation on rheological properties of filling slurry. Adv. Civ. Eng. 2019, 2019, 6873840. [Google Scholar] [CrossRef]
- GBT2419-2005; Standard for Test Method for Fluidity of Cement Mortar. The General Administration of Quality Supervision, Inspection and Quarantine of the People’s Republic of China and the Standardization Administration of the People’s Republic of China: Beijing, China, 2005.
- GBT50080-2016; Standard for Test Method of Performance on Ordinary Fresh Concrete. The Ministry of Housing and Urban-Rural Development of the People’s Republic of China: Beijing, China, 2016.
- GBT 50107-2010; Standard for Evaluation of Concrete Compressive Strength. The Ministry of Housing and Urban-Rural Development of the People’s Republic of China and the General Administration of Quality Supervision, Inspection and Quarantine of the People’s Republic of China: Beijing, China, 2010.
- Zhou, A.M. Cement Filling of Mining Waste; Metall. Ind. Press: Beijing, China, 2007; pp. 99–100. [Google Scholar]
- Shi, H.S.; Huang, K.S.; Wu, K.; Guo, X.L. Research advance on activation and mechanism of steel slag activity. Fly Ash Compr. Util. 2011, 1, 48–53. [Google Scholar]
- Shi, C. Steel slag-its production, processing, characteristics, and cementitious properties. J. Mater. Civ. Eng. 2004, 16, 230–236. [Google Scholar] [CrossRef]
- Wang, Q.; Yan, P.Y.; Yang, J.W.; Zhang, B. Influence of steel slag on mechanical properties and durability of concrete. Constr. Build. Mater. 2013, 47, 1414–1420. [Google Scholar] [CrossRef]
- Cui, X.W.; Ni, W. Effect of steel slag powder addition on properties of high strength tailings concrete. Met. Mine 2014, 9, 177–180. [Google Scholar]
- Xu, H.J.; Fu, G.Q.; Zhu, M.Y. Experiment on the distensibility of steel slag. Environ. Eng. 2006, 6, 62–64. [Google Scholar]
- Ma, H.J.; Wang, Y.M.; Wang, Y.Q.; Wang, Z.K. Research of Rheological Properties of Unclassified Tailings Paste Slurry in Tibet Jiama Copper Mine. Met. Mine 2017, 11, 6. [Google Scholar]
- Zhang, L.; Luo, T.; Zhu, Z.C.; Liu, H.; Xu, Y.D.; Chen, Z.X. Study on the rheological characteristics of high-concentration filling mixture and its resistance loss in pipeline transportation. China Min. Mag. 2014, S2, 301–304. [Google Scholar]
- Gao, F. Study on Affections of Pipeline Diameter to the Transportation Characteristics of Backfilling Slurry of Unclassified Tailing Inner Pipe; North China University of Science and Technology: Qinhuangdao, China, 2015. [Google Scholar]
- Xiao, L.B. Selection of pipe network parameters and pumping pressure in paste-like filling system. Met. Mine 2014, 8, 53–56. [Google Scholar]
- Li, D.; Feng, G.R.; Guo, Y.X.; Qi, T.Y.; Jia, X.Q.; Feng, J.R.; Li, Z. Analysis on the strength increase law of filling material based on response surface method. J. China Coal Soc. 2016, 41, 392–398. [Google Scholar]


| Chemical Composition | Content/% |
|---|---|
| SiO2 | 11–15 |
| Al2O3 | 4–8 |
| Fe2O3 | 11.2–14.2 |
| FeO | 5–7.5 |
| MgO | 11.5–15 |
| CaO | 35–40 |
| TiO2 | 0–1.5 |
| MnO | 0–1.7 |
| Loss | 5–7 |
| Solute | Content/% |
|---|---|
| MgCl2 | 25–35 |
| NaCl | 0.7–1.2 |
| CaCl2 | 0.1–0.25 |
| NO. | Steel Slag/% | Tail Salt Aggregate/% | Waste Brine Water/% | Solid Concentration/(wt.%) |
|---|---|---|---|---|
| 1 | 5 | 65 | 30 | 70 |
| 2 | 5 | 70 | 25 | 75 |
| 3 | 5 | 73 | 22 | 78 |
| 4 | 10 | 60 | 30 | 70 |
| Mixture Ratio | Fitting Formula | R2 | τ0/Pa | η/Pa·S−1 |
|---|---|---|---|---|
| ss5%, co70% | y = 0.1658x + 23.935 | 0.9115 | 17.951 | 0.1658 |
| ss5%, co75% | y = 0.1977x + 25.623 | 0.9641 | 19.217 | 0.1977 |
| ss5%, co78% | y = 0.3550x + 57.300 | 0.9394 | 42.975 | 0.3550 |
| ss10%, co70% | y = 0.2710x + 31.380 | 0.9735 | 23.535 | 0.2710 |
| Mixture Ratio | Empirical Formula of Pressure Loss | Error Rate |
|---|---|---|
| ss5%, co70% | 0.89% | |
| ss5%, co75% | 1.25% | |
| ss5%, co78% | 0.93% | |
| ss10%, co70% | 1.92% |
Disclaimer/Publisher’s Note: The statements, opinions and data contained in all publications are solely those of the individual author(s) and contributor(s) and not of MDPI and/or the editor(s). MDPI and/or the editor(s) disclaim responsibility for any injury to people or property resulting from any ideas, methods, instructions or products referred to in the content. |
© 2024 by the authors. Licensee MDPI, Basel, Switzerland. This article is an open access article distributed under the terms and conditions of the Creative Commons Attribution (CC BY) license (https://creativecommons.org/licenses/by/4.0/).
Share and Cite
Jin, R.; Wang, X.; Zhang, S.; Huo, H.; Li, J.; Ni, W. Slurry Transportation Characteristics of Potash Mine Cemented Paste Backfills via Loop Test Processing. Processes 2024, 12, 2929. https://doi.org/10.3390/pr12122929
Jin R, Wang X, Zhang S, Huo H, Li J, Ni W. Slurry Transportation Characteristics of Potash Mine Cemented Paste Backfills via Loop Test Processing. Processes. 2024; 12(12):2929. https://doi.org/10.3390/pr12122929
Chicago/Turabian StyleJin, Rongzhen, Xue Wang, Siqi Zhang, Huimin Huo, Jiajie Li, and Wen Ni. 2024. "Slurry Transportation Characteristics of Potash Mine Cemented Paste Backfills via Loop Test Processing" Processes 12, no. 12: 2929. https://doi.org/10.3390/pr12122929
APA StyleJin, R., Wang, X., Zhang, S., Huo, H., Li, J., & Ni, W. (2024). Slurry Transportation Characteristics of Potash Mine Cemented Paste Backfills via Loop Test Processing. Processes, 12(12), 2929. https://doi.org/10.3390/pr12122929