Article

Study on Dense Phase Separation of Associated Gas with High Carbon Dioxide Content

1
State Key Laboratory of Offshore Oil and Gas Exploitation, Beijing 100027, China
2
College of Pipeline and Civil Engineering, China University of Petroleum (East China), National Virtual Simulation, Qingdao 266580, China
*
Author to whom correspondence should be addressed.
Processes 2024, 12(12), 2924; https://doi.org/10.3390/pr12122924
Submission received: 1 November 2024 / Revised: 4 December 2024 / Accepted: 8 December 2024 / Published: 20 December 2024
(This article belongs to the Topic Carbon Capture Science and Technology (CCST), 2nd Edition)

Abstract

:
With the continuous exploitation of offshore natural gas, the content of CO2 produced gradually increases. It is not economical to separate more CO2 from natural gas after transportation, and more CO2 will aggravate the corrosion of pipelines. The commonly used decarburization process is not suitable for offshore platforms, and there are problems of high energy consumption and large space occupation. Therefore, dense phase separation of associated gas with high carbon dioxide content is a better separation method. In this paper, the equation of state is optimized by comparing the experimental and CO2 system phase characteristics simulation. Based on the selected equation of state (EOS), a three-level separation model of phase equilibrium characteristics is established. The separation efficiency is simulated to complete the separation of CO2 and methane. The separation process is optimized by a genetic algorithm, and the temperature and pressure under the best separation efficiency are determined. The PR-EOS was selected as the equation with the highest calculation accuracy. Through process simulation and algorithm optimization, the best separation efficiency was 72.23%.

1. Introduction

CO2 is a potential threat to human survival and development [1]. Carbon capture, utilization and storage technology achieve the goal of carbon neutrality by reducing CO2 in the atmosphere, which is of great significance for the construction of green energy systems. Therefore, it is necessary to focus on the development of efficient methods conducive to CCUS technology for the continuous development of existing decarbonization technologies [2,3]. In the middle and late stages of oil and gas field development, due to the large amount of CO2 produced in the process of natural gas mining and processing, the natural gas extracted has higher CO2 [4]. In the mining and processing of offshore platforms, the increase in CO2 content in mining may greatly affect the total power consumption in the mining and processing process [5]. Moreover, the produced gas has more CO2, which will aggravate the corrosion of the pipeline, and because the injection of CO2 into the oil and gas field can improve the recovery rate of the oil and gas field and can increase the production of CH4 by changing the temperature and pressure conditions [6], which also increases the content of CO2 in the produced gas. It can be seen that it is not economical and reliable to transport the extracted natural gas pipeline to land for deacidification and decarbonization, so it is also very necessary to complete the decarbonization process on the offshore platform [7]. In order to realize the separation and reinjection of CO2, the cost of technology and energy consumption is relatively expensive, and it may occupy most of the area of offshore production equipment [8]. At present, the commonly used decarburization processes are low-temperature separation technology, solvent absorption method, membrane separation method and pressure swing adsorption method [9,10]. The advantages and disadvantages of the different approaches are shown in Table 1 below. The oil and gas produced in some deep-water offshore oilfields have high concentrations of CO2. While treating natural gas, a high concentration of CO2 needs to be treated. The low-temperature separation process is suitable for the case of high CO2 content and reinjection, but the equipment investment cost is relatively high, and the energy consumption is relatively high. As a relatively mature decarburization technology, physical and chemical solvent absorption methods, such as the alcohol amine method, also have the disadvantage of high energy consumption. Membrane separation technology separates CH4 and CO2 through the pores of the membrane, but it has the problem of hydrocarbon loss and frequent replacement of the membrane and has a more complex natural gas purification membrane separation device, so it is not applicable to offshore platforms [11,12,13,14]. The pressure swing adsorption process usually requires more adsorption towers for high-purity CO2 and high hydrocarbon recovery. The adsorption film of different materials has different physical and chemical properties, so the material selection of the adsorption film can also determine the CO2 removal performance. Through the continuous distribution of concentration as a parameter to build a mathematical model, combined with the boundary conditions to obtain the theoretical results, the corresponding concentration distribution, different simulation software to study the decarbonization process model, and can perform better simulation and prediction [15]. It has large equipment investment and space occupation and is not suitable for offshore oil and gas separation [16]. The study of CO2 desorption by microwave heating using microporous granular activated carbon has a faster desorption rate than conventional heating desorption, but it is not suitable for high CO2 content and high-pressure oil production on offshore platforms [17]. Radiofrequency heated reactor systems, including post-combustion carbon capture, are more efficient and have shorter desorption times than conventionally heated benchtop reactors, but the high energy consumption and cost investment are also reasons why they are not suitable for this situation [18]. Therefore, for the decarburization process of offshore natural gas, the separation of system phase characteristics is used to enter people’s eyes, and the multi-component mixture is separated into different phases under different temperature and pressure conditions, and then different phases are separated to achieve the initial decarburization of offshore natural gas.
The characteristics of gas–liquid equilibrium are used for separation and recovery in practical engineering. For example, in the process of floating production, storage and transportation in Brazil, the content of CO2 may be as high as 40% [19]. Therefore, the HISEP seabed efficient separation technology proposed by Brazil, such as a high-pressure dense phase seabed separator, separates it into at least two phases. One is a liquid rich in hydrocarbons, and the other is a dense supercritical phase rich in carbon dioxide, which can make CO2 reinjection without reaching the ground [20,21], for example, for the separation of components in a liquid homogeneous system. The difference in phase characteristics of each component is usually used for separation. For example, the crude oil stabilization process is used to recycle the associated gas in the production of crude oil. In the process of crude oil production, the crude oil is initially separated. After flashing, pressurization and cooling, the components undergo phase change; the non-condensable gas is removed from the raw material gas tank, and the liquid hydrocarbon is removed from the light hydrocarbon recovery device [22,23]. Ahad Ghaemi et al. [15] numerically simulated the process of carbon dioxide absorption and capture. By increasing the axial position through the column, the temperature of the liquid phase and the concentration of CO2 in the liquid phase were reduced. Lin et al. [24] compared the positive pressure flash distillation and fractionation separation process of crude oil and used HYSYS to simulate and calculate the changes of C4 and below components with temperature and pressure during the stabilization of crude oil by PR equation. The light hydrocarbon recovery process also uses the difference in phase characteristics of the components to separate. Yang Wanyu et al. [25] separated lightly by the expansion refrigeration method and established a phase equilibrium model. The HYSYS was used to calculate the phase equilibrium characteristics of the CO2-CH4 system at different temperatures under a certain recovery pressure and to predict the CO2 freezing temperature at the top of the demethanizer. Lu et al. [26] further analyzed the influence of temperature and pressure on the light hydrocarbon recovery process based on the composition of feedstock gas. Through the sensitivity analysis of the light hydrocarbon process parameters, it is considered that the C2 recovery rate is mainly affected by the content of the C2 component.
Many scholars have also studied the phase characteristics of CO2-containing natural gas. Most of the studies on phase equilibrium can be calculated using software data and models, and it has been proved that these calculation models include most of the systems, including the CO2-CH4 system. Zhu Likai [27] studied the phase characteristics of the CH4-CO2 system in the process of low-temperature separation and modeled the phase equilibrium characteristics and situation of the system. In order to develop high-purity CO2, Xu et al. [28] studied the N2-CH4-CO2 ternary system and obtained the phase equilibrium characteristics in the near-critical region. Sterner et al. [29] also studied the phase equilibrium characteristics of the CH4-CO2 system at low temperatures and obtained the isobaric temperature composition diagram. Matcalfe et al. [30] established a mathematical model to study the effect of phase equilibrium on CO2 displacement in the process of CO2-enhanced oil recovery by numerical simulation. Ali et al. [31] established an artificial neural network to predict the low-temperature phase characteristics of the gas–liquid–solid equilibrium of the CH4-CO2 binary system. In order to obtain the relevant thermophysical properties and phase characteristics of multi-component mixtures with higher accuracy, some scholars have improved and selected the equation of state of the CO2-alkane system and obtained a model with higher calculation accuracy. Tsivintzelis et al. [32] established accurate thermodynamic models for pure gaseous, liquid and supercritical CO2 characteristics and mixtures of CO2 and hydrocarbons. They used the CPA equation of state to study and obtained good phase equilibrium characteristics. Abdolbaghi [33] studied the vapor–liquid equilibrium of the binary system of n-alkanes and CO2. The vapor–liquid equilibrium of the system was predicted by combining the software calculation model with the thermodynamic model, and reliable results were obtained. The error is lower than the conclusion of the PR equation and the WS mixing rule. Wu [34] studied the binary mixture of carbon dioxide and fluoroethane. The temperature and pressure of the mixture measured by the gas–liquid equilibrium system were analyzed using static constant temperature. The collected gas–liquid phase components were analyzed by gas chromatograph. The gas–liquid equilibrium data were fitted by the PR equation and WS mixing rule. Gui [35] studied the phase equilibrium data of CO2 and hydrocarbons under reservoir conditions through experimental analysis and tested the thermodynamic models under different temperatures, pressures and compositions by these data. PR and improved quartic equation of state were combined with different mixing rules to calculate, and a thermodynamic model for characterizing the phase equilibrium of multi-component systems was proposed. Abunahman et al. [36] used cubic and CPA equations of state to accurately predict the thermodynamic properties of light oil containing high concentrations of CO2.
Through the above scholars’ research on phase equilibrium separation, it is found that it is very necessary to study the phase equilibrium of multi-component systems containing CO2 and for offshore natural gas decarburization. It is necessary to consider the problems of equipment investment, operation management and space occupation at the same time. The research on phase equilibrium separation of multi-component mixed systems is also a common preliminary separation method. In this paper, through the study of phase characteristics of a CO2 mixed system, the optimal equation of state suitable for simulation is selected, and the phase equilibrium separation of a multi-component complex mixed system is studied.

2. Materials and Methods

2.1. Theoretical Formula

At present, the calculation methods of gas–liquid phase equilibrium usually include the equation of state method, activity coefficient method and so on. The equation of state method is usually suitable for the calculation under medium and high pressure and can obtain the corresponding thermodynamic properties. Therefore, the equation of state method is used to calculate the gas–liquid phase equilibrium of the binary mixed system.
The equation of state is used to describe the phase characteristics of different systems, and the equation of state selected for different system compositions is also very different. The commonly used equation of state includes cubic EOS, multi-parameter equation, etc. The equation of state commonly used for the CO2 system is shown in Table 2.
SRK-EOS corrects the gravitational term of the RK equation and improves the accuracy in the calculation of the phase equilibrium properties of the mixture. The PR equation is modified again, which is suitable for both the gas phase and the liquid phase. The calculation accuracy of VLE is higher than that of SRK, and it is one of the most commonly used EOS at present. However, the calculation accuracy of liquid phase density is not accurate. The GERG-2008 equation has good calculation accuracy for the VLE properties of pure component CO2 in gas, liquid and supercritical states. The BWRS equation is commonly used in natural gas process calculation and has good accuracy for the phase characteristics of methane under low temperature and high pressure. In this study, SRK, PR and GERG-2008 equations were compared with experiments, and the optimal equation of state was selected by error analysis to simulate the phase equilibrium separation process.

2.2. Experimental Introduction

2.2.1. Experimental Installation

The experimental device for measuring the phase characteristics of the CO2 mixed system is shown in Figure 1. The experimental device is mainly composed of a constant-speed, constant-pressure injection pump, an ethylene glycol temperature control tank and a variable-volume reactor. The variable-volume reactor is composed of a medium injection port, a pressure injection port, a sampling port, a piston and a displacement rod. The constant-speed constant-pressure injection pump applies axial pressure to the reactor to promote the movement of the reactor piston for a variable-volume process, while the ethylene glycol temperature control tank provides a stable temperature condition for the reactor and the mixing composition. The measurement principle of the experimental device is based on the P-V-T relationship of gas–liquid phase equilibrium. It can control the composition of the mixed system at different temperatures, observe the bubble point and dew point under this condition and then obtain the phase envelope of the system using the temperature–pressure relationship.

2.2.2. Instrument

The experimental instrument device includes a variable-volume reactor made of 316 L stainless steel, with a variable volume of 10–1000 mL, a working pressure of 20 Mpa and a working temperature range of −50 °C–60 °C. A displacement sensor (range: 0–300 mm, comprehensive accuracy of ±0.1% F.S.) and pressure sensor (range: 0–20 Mpa, accuracy of 0.1% F.S.) equipped with AI-7 series digital display instrument for pressure displacement data acquisition were installed; the experimental instrument device also includes a high- and low-temperature thermostatic bath. The temperature control range is −50 °C–90 °C, the temperature control accuracy is ±0.1 °C, the resolution is 0.01 °C and the temperature fluctuation is ±0.05 °C. The whole system also includes a data acquisition module and data acquisition software, which can monitor real-time data, record data and draw curves and reports.

2.3. Technical Route

Combined with the previous scholars’ research, it is found that it is very necessary to study the phase equilibrium of multi-component systems containing CO2. The research process of this paper is shown in Figure 2 below. Through the experimental study of the phase characteristics of a high CO2 mixed system and the simulation analysis of different EOS, the optimal equation of state suitable for simulation is selected to study the phase equilibrium separation of a multi-component complex mixed system. The phase equilibrium separation of natural gas containing CO2 adopts a three-stage separation method. Macromolecular alkanes, CO2 and small molecular hydrocarbons are separated by adjusting temperature and pressure through one-stage separation, and then the separated gas phase is separated by two-stage separation. The gas–liquid equilibrium separation of light hydrocarbon and CO2 was realized. Finally, the light component of the liquid phase containing the CO2 component of the secondary separation was recovered. The separation process found that the separation results and separation efficiency of the secondary separation and the tertiary separation were interrelated. The genetic algorithm was used to optimize it to determine the optimal separation temperature and separation pressure.

2.4. The Experimental Results Are Compared with the Simulation Results

The experimental device was used to measure the phase characteristics of the system containing CO2, and the results were compared with the simulation results of PR-EOS, SRK-EOS and GERG-2008 EOS. The EOS can be compared to verify the accuracy of each equation under different temperature, pressure and composition systems. The experimental simulation of the system containing 80% CO2 and 20% CH4 at −30 °C, −20 °C, −10 °C, 0 °C and 10 °C was carried out to compare the bubble dew point data, as shown in Figure 3. The experimental values are used to analyze the relative error of the bubble dew point of each equation of state. The results are shown in Figure 4. The relative errors of each equation of state are small at different temperatures and pressures. The average error of the system measured by PR-EOS is only 4.3%. Therefore, the analysis shows that the PR equation has good accuracy in the measurement of bubble dew point pressure and is superior to other equations of state.
The experimental simulation of the system containing 90% CO2 and 10% CH4 at −20 °C, −10 °C, 0 °C, 10 °C and 20 °C is carried out to compare the bubble dew point data, as shown in Figure 5. The relative error analysis of the bubble dew point of each equation of state is carried out by using the experimental values. The results are shown in Figure 6. It can be seen that the PR equation has good accuracy in the measurement of bubble dew point pressure and is superior to other equations of state.
Comparing the bubble and dew point experiments and simulations of the above two groups of mixed systems, it is found that in the high-carbon CO2 system, the experimental results are not much different from the simulated values of each equation of state in the range of −30 °C–20 °C. The average error of PR-EOS for bubble and dew point pressure is 7.07%. Therefore, it is considered that the simulation using the PR equation can basically meet the requirements of engineering.

3. Results

3.1. Multi-Component Separation Process of CO2 Containing Impurities

For the separation process, the common definition of separation efficiency is as follows (1).
η 1 = q o u t q i n
Among them, qout is the CO2 flow rate of the gas phase outlet of the separation gas, and qin is the CO2 flow rate of the feed gas.
It is found that the composition content and flow rate of CO2 are contradictory to each other due to the gas–liquid two-phase produced by phase equilibrium separation. That is, when the mass flow rate of the separation result is optimal, it is found that when the efficiency is 1, CO2 and other components are pure liquid phase. The two are in the same phase, and the separation efficiency of the separation result cannot be well described. Therefore, it is necessary to redefine the separation efficiency.
If the methane separation efficiency is still defined as the ratio of the mass flow rate of the outlet gas phase methane to the inlet methane, and the CO2 separation efficiency is the ratio of the mass flow rate of the outlet liquid phase CO2 to the inlet CO2, the weighted average of the two is as follows (2).
η 2 = ( q out q i n ) C O 2 + ( q out q i n ) C H 4 2
This definition considers the separation of methane and CO2 at the same time. For the gas–liquid two-phase mixed system, it can better consider the influence of the two on the phase equilibrium separation results. Therefore, the gas–liquid separation of phase equilibrium separation is described by this separation efficiency.
For the components of Baodao Oilfield, HYSYS simulation was used. Through the preliminary analysis of the simulation, the liquid phase components after separation were heavier and the CO2 content was less. The proportion of logistics components corresponding to the boarding platform is shown in Table 3 below.
The corresponding phase diagram of the corresponding platform component is shown in Figure 7 below. The separation is carried out in the two-phase region. Therefore, it is necessary to control the corresponding temperature and pressure conditions to meet the separation requirements and keep the temperature below the critical temperature. The following two schemes are carried out for the phase equilibrium separation simulation.
The temperature is 15–17 °C. After separation, before decarbonization, the proportion of decarbonization inlet components is shown in Table 4.
The three-stage separation process is used for separation, including the following two separation schemes.
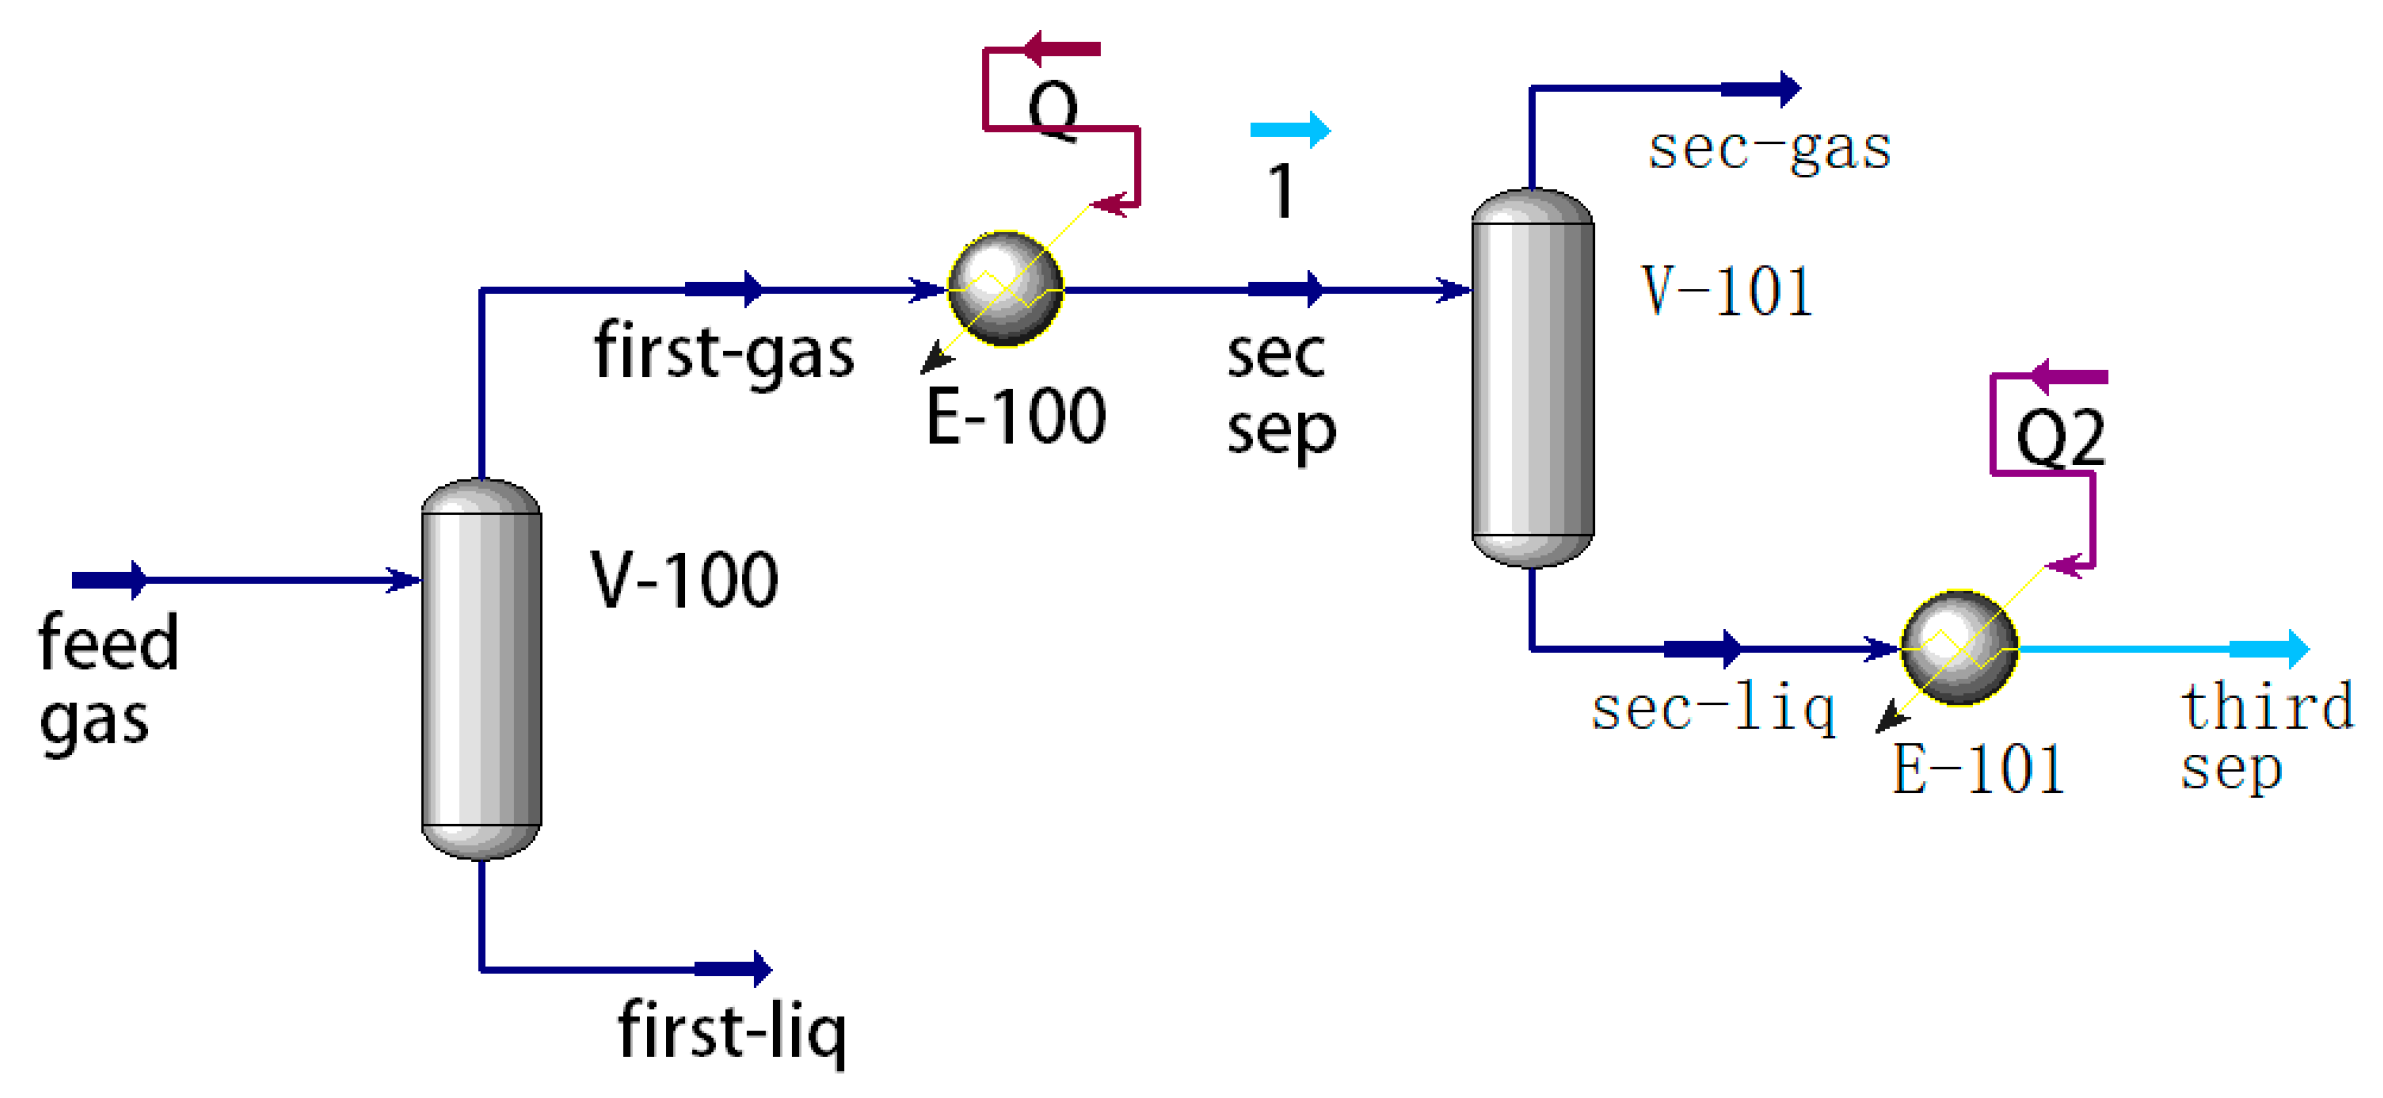
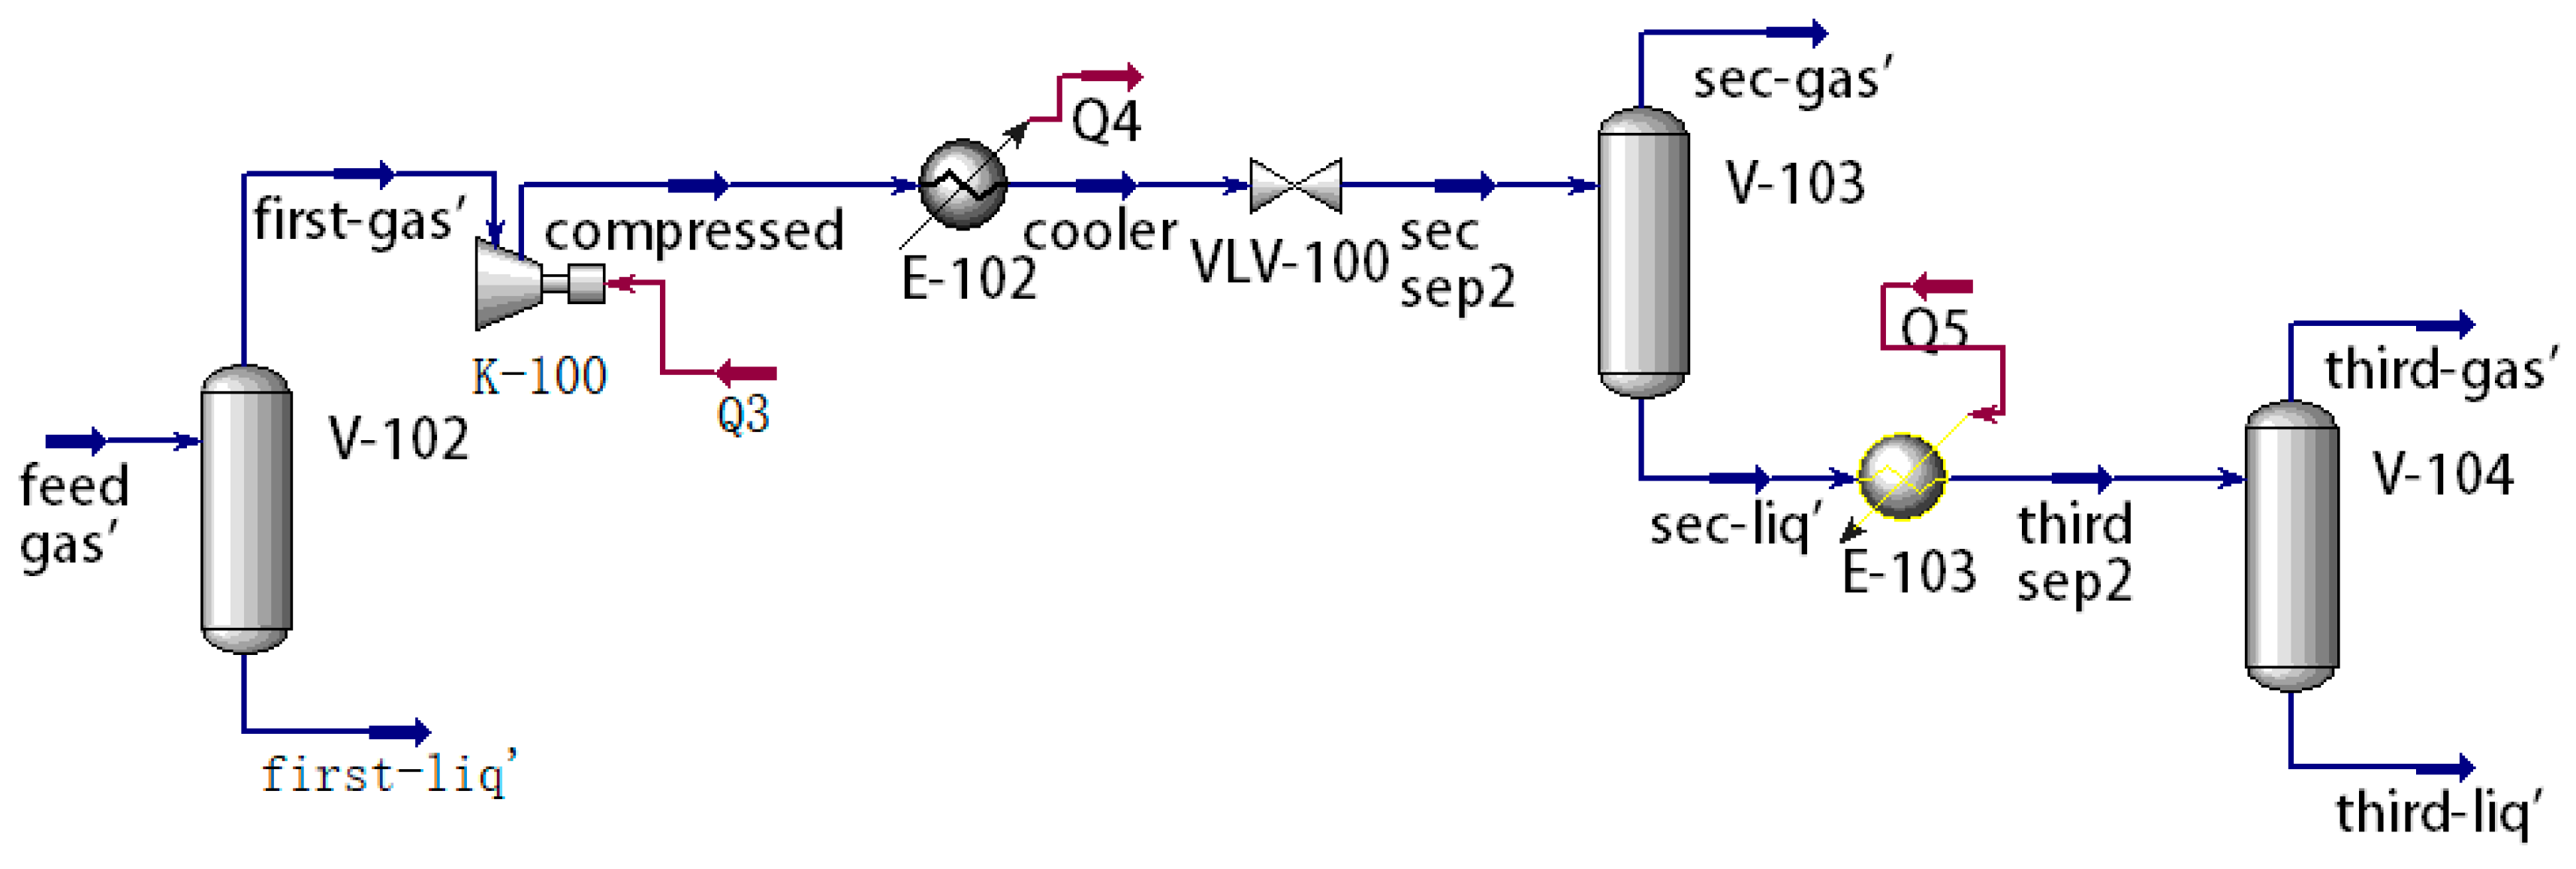
Scheme 1: After three separations, the first two-stage separation simulation is shown in Figure 8 below, including first-stage separation and second-stage separation. The first-stage separation is to separate most of the macromolecular alkanes in the liquid phase, and most of the CO2 and some small molecular alkanes are separated in the gas phase. The second-stage separation of the fluid at the outlet of the gas phase separates CO2, and then the CO2-rich phase is subjected to three-stage separation to separate the light components. The simulation results of the three separations will be carried out.
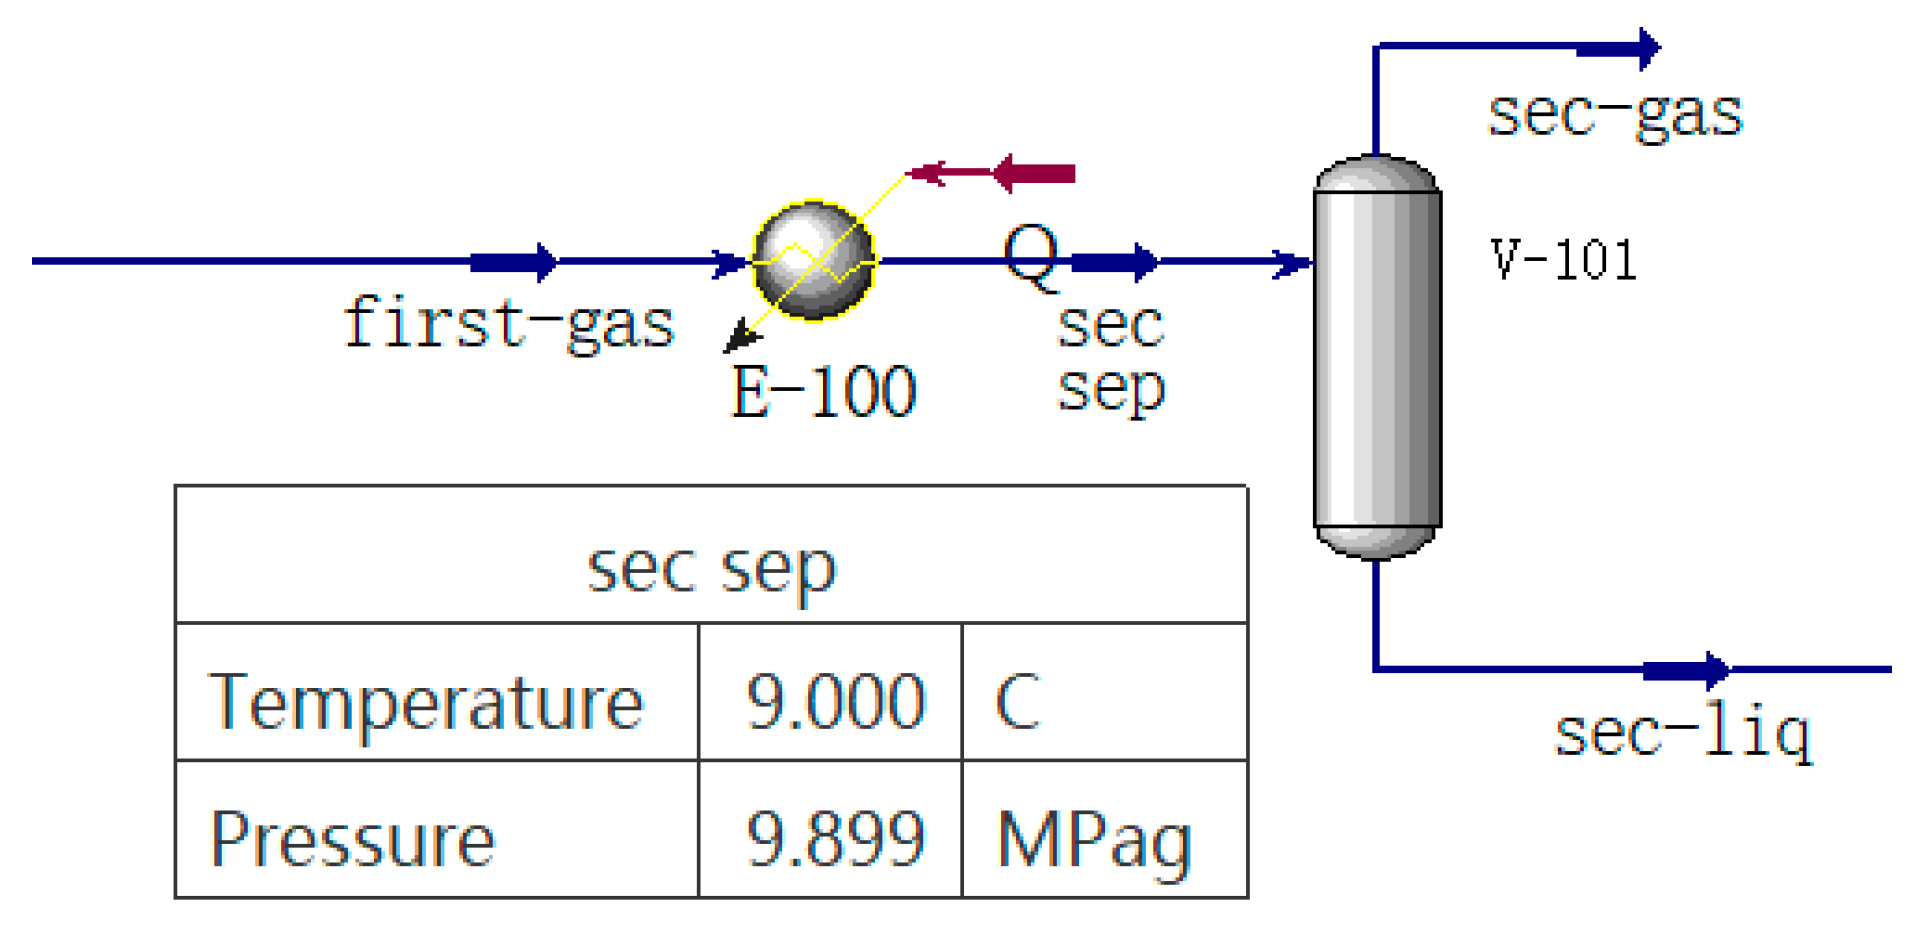
Scheme 2: After two separations, the separation simulation is shown in Figure 9 below, including primary separation and secondary separation. The results of the primary separation principle are the same as those of Scheme 1. For the secondary separation, the gas phase of the primary separation is condensed, and different temperatures and pressures are controlled to make the gas–liquid phase change. Observe the proportion of CO2 in the gas–liquid phase composition in the range of the gas–liquid two-phase region, that is, the degree of phase equilibrium separation.
Due to the same primary separation method of the two schemes, the feed gas enters the two-phase separator at a certain temperature and pressure to separate in the two-phase region. The separation results include the gas–liquid two-phase, and the corresponding component composition ratio is calculated by the separation simulation calculation so as to judge the proportion of CO2 in the gas phase component and calculate the separation efficiency of the primary separation.
Referring to the components of Baodao Oilfield, the separation under this component is simulated and analyzed, as shown in Table 5 below.
The phase equilibrium separation conditions were set at 15 °C and 3 MPa by hysys. The separation efficiency before and after the first-stage separation simulation separation was 98.4%. It can be seen that a large part of CO2 exists in the mixed gas phase in a gaseous form. Accordingly, most of the hydrocarbons with high carbon content exist in a liquid form. Therefore, the components in the liquid phase are heavier, and the CO2 content is less.

3.2. Study on Separation Mechanism Based on Temperature and Pressure Change

3.2.1. Simulation of Secondary Separation Based on Temperature and Pressure Change

On this basis, the phase equilibrium simulation calculation of multi-stage separation is carried out, the separation of light components such as methane and carbon dioxide is carried out in a deeper depth and the recovery of natural gas and the separation of CO2 gas are carried out. At present, the phase equilibrium separation effect of the binary composition of methane and carbon dioxide is not good, and the gas and liquid phases contain high CO2 and methane. After the first-stage separation, the components are separated in the second stage. The proportion of the second-stage separation components is shown in Table 3. The phase diagram of the second-stage separation components is shown in Figure 10. The critical temperature is −29.92 °C, and the critical pressure is 8.042 MPa. The above two separation process separation schemes are used to simulate the secondary separation.
Scheme 1: The simulation is shown in Figure 11 below. The gas at the outlet of the primary separation gas phase enters the secondary separation. After compression, cooling and throttling conditions, the gas is pressurized, cooled to 20 °C before separation and completely liquefied. The liquefied fluid is adjusted by adjusting the throttle valve to change the separation outlet conditions.
In the two-stage separation process, by controlling different pressure conditions, the corresponding two-stage separation efficiency curve is obtained, as shown in Figure 12. It can be seen that when the pressure is increased from 10 MPa to 30 MPa before throttling, the proportion of CO2 in the gas phase of the mixed fluid after throttling is greater than that in the liquid phase. With the increase in pressure before throttling, the component of CO2 in the liquid phase gradually increases, and the liquid phase component of CO2 is the most when the pressure is about 2.5 MPa after throttling. When the pressure is 30 MPa before throttling, the separation efficiency is 42.2% at 2.5 MPa and 20 MPa before throttling. When the separation efficiency is 32.4% at 2.5 MPa and 10 MPa before throttling, the separation efficiency is about 2.3% at 2.5 MPa.
Taking 30 MPa before throttling and 2.5 MPa after throttling as an example, the components of the secondary separation outlet are observed, as shown in Table 6.
Scheme 2: Two-stage separation simulation is shown in Figure 13 below. The content of CO2 in the outlet liquid phase composition is observed. Similarly, the corresponding efficiency–pressure curve is obtained by controlling different temperature and pressure conditions, and the separation pressure and separation temperature under the best separation efficiency are found.
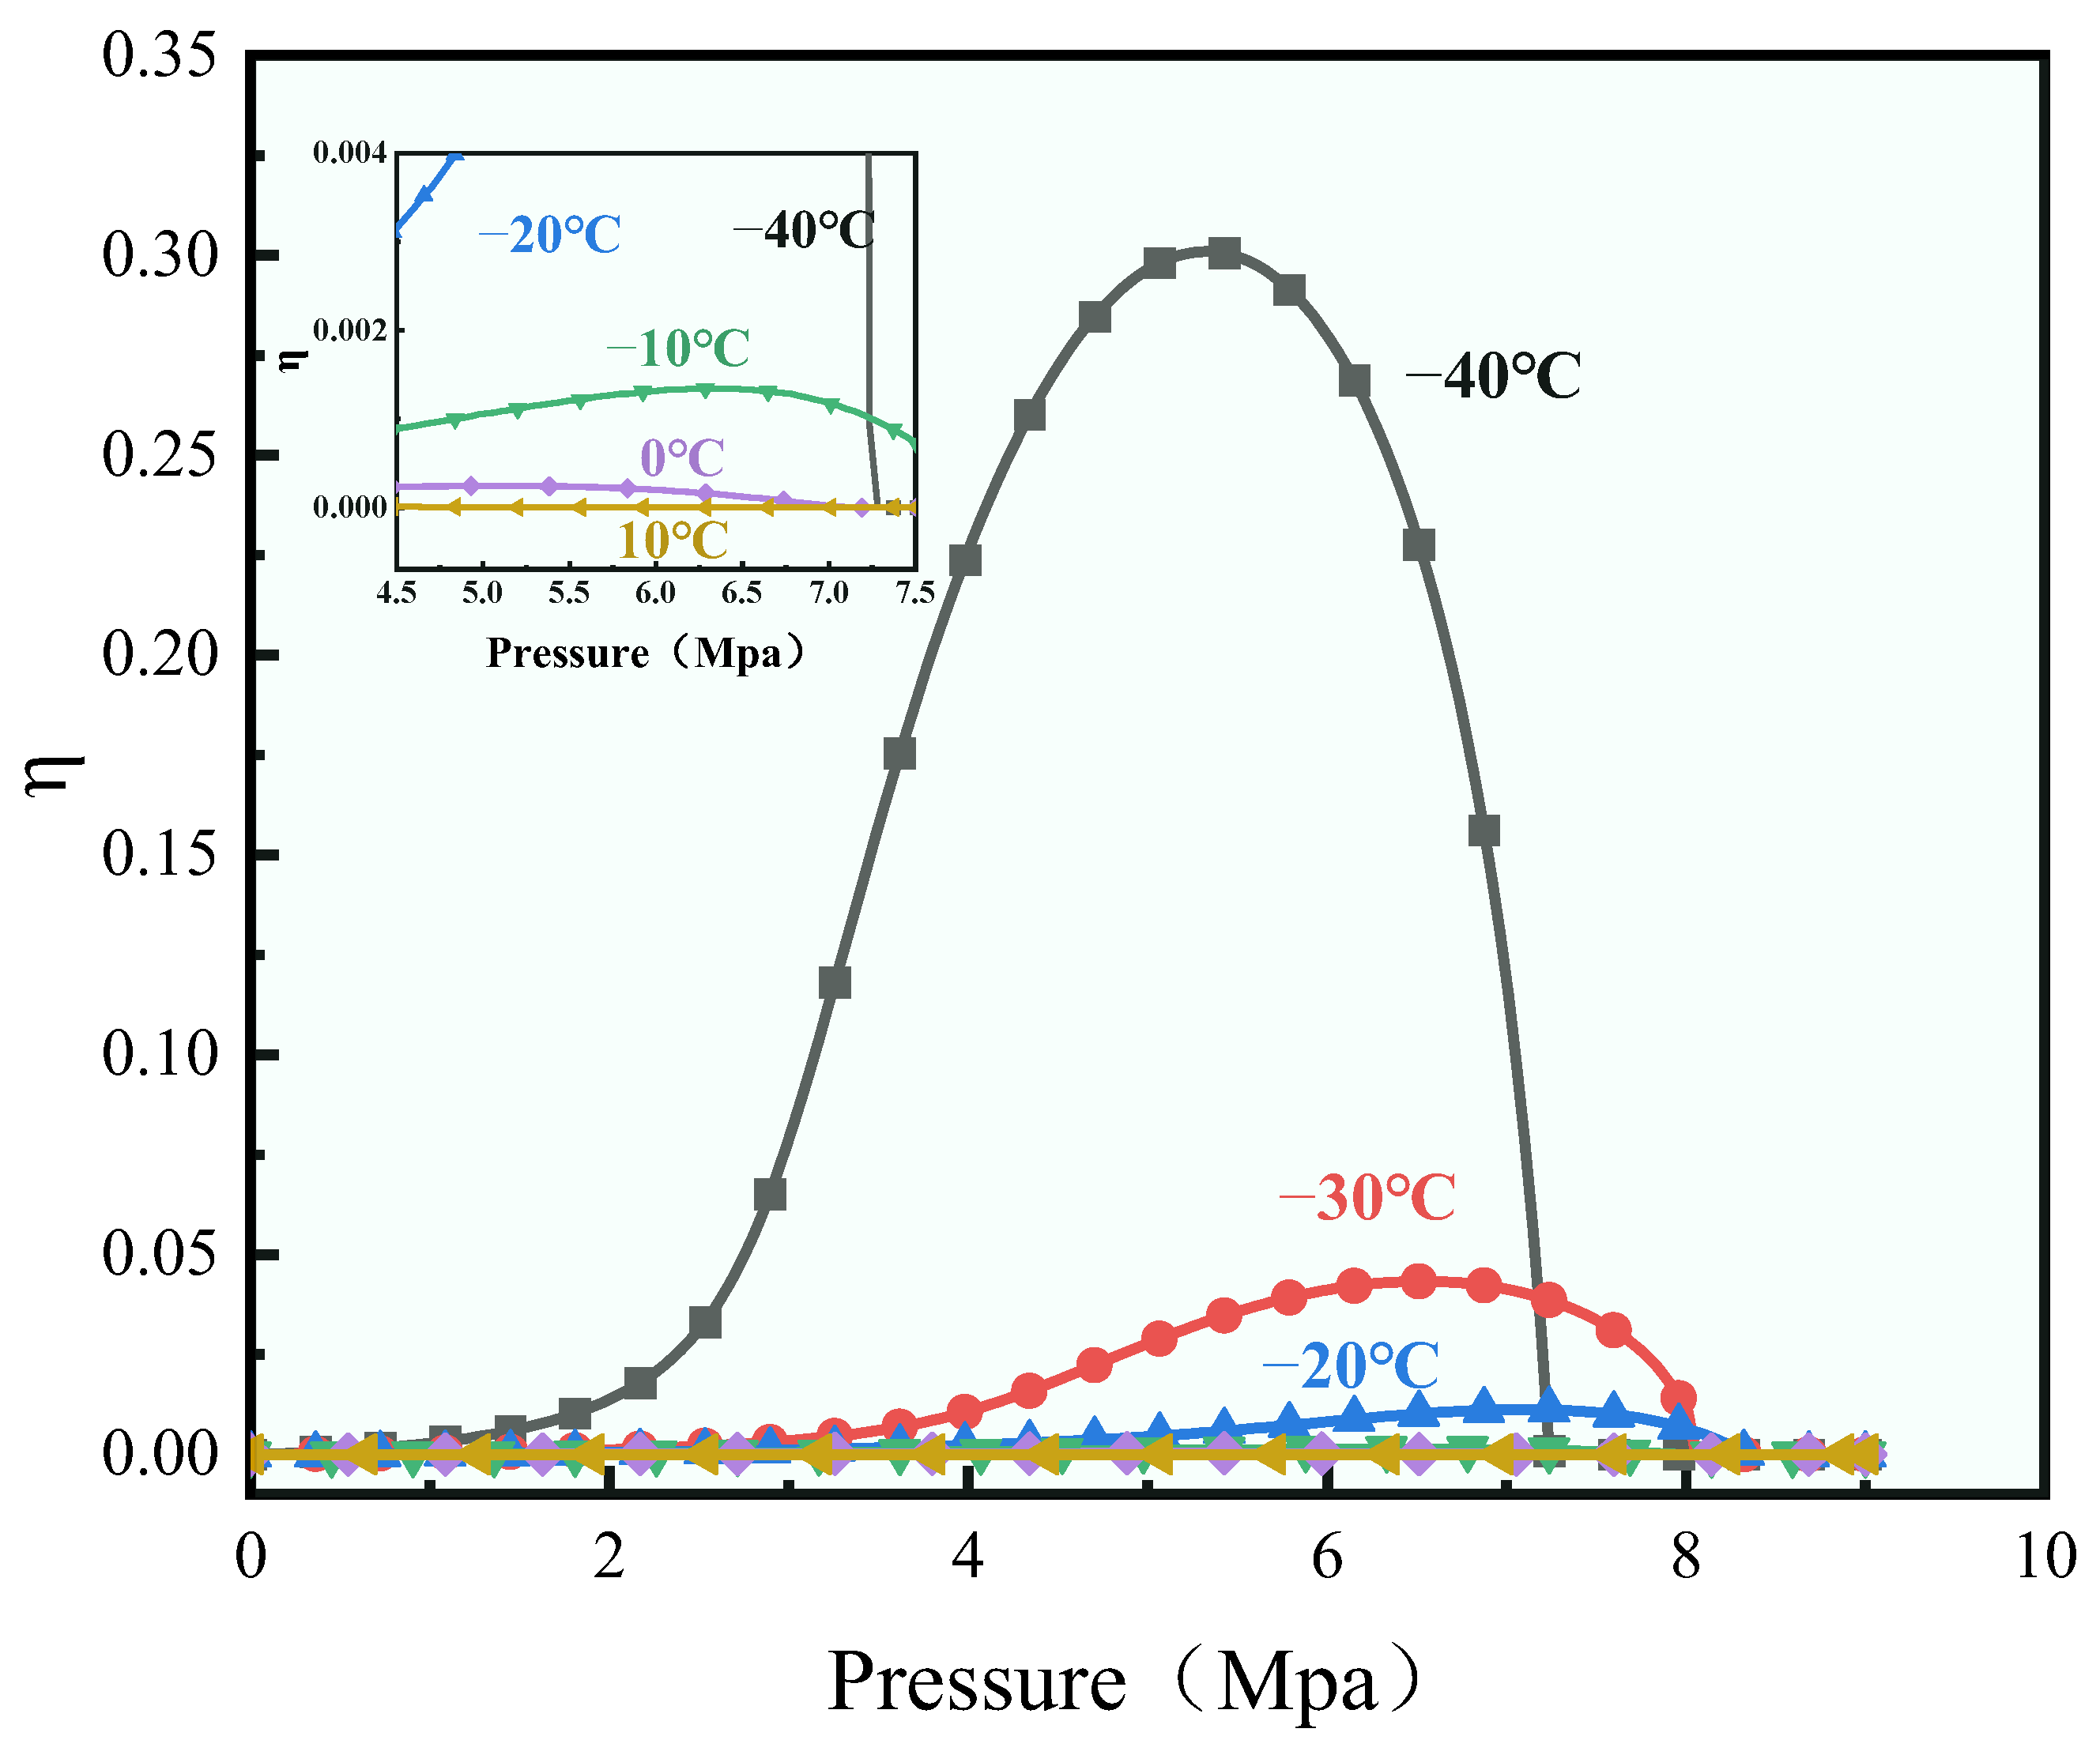
In the two-stage separation, the two-stage separation efficiency–pressure curve at different temperatures is simulated, as shown in Figure 14 below. It can be seen that before the separation reaches the critical temperature, there is a good separation efficiency because after exceeding the critical point, increasing the pressure causes the fluid in the phase equilibrium interval to undergo a phase transition to the supercritical state. Before the critical temperature, increasing the pressure causes the fluid to continuously liquefy and, at the same time, increases the CO2 content in the liquid phase and improves the separation efficiency; before the critical temperature, as the temperature decreases, that is, the curve shifts to the left, the lower the temperature, the greater the change rate of the separation efficiency with the pressure, and accordingly, the higher the liquid phase fraction, it can be seen that the phase equilibrium separation efficiency is not ideal.
Considering that the separated gas phase components still contain a large amount of CO2 and methane, taking −30 °C, 6.5 MPa as an example, the secondary separation results are compared as shown in Table 7 below.
It can be seen from the figures and tables that the separation efficiency corresponding to the separation results obtained by the two-stage separation is low. In the separation of the two schemes, CO2 is not distributed in the liquid phase components with more components. The reason is that when the temperature exceeds the critical temperature, the mixed system is basically presented in a gaseous state. At this time, if the pressure is changed, there will only be a small amount of gas-to-liquid transition. Therefore, in order to achieve better separation efficiency, the temperature should be lower than the critical temperature of the mixed component as much as possible.
In summary, comparing the two schemes, the CO2 separation result of Scheme 1 is better than that of Scheme 2, and Scheme 1 needs to control the pressure before and after throttling. Based on the ratio of CO2 mass flow before and after throttling and the ratio of CH4 mass flow, the separation result of CO2 is judged. The efficiency reaches the maximum value of about 42.4% at 30 MPa before throttling and about 2 MPa after throttling. In the second scheme, the phase equilibrium separation process is carried out by controlling the separation temperature and pressure. Because the critical temperature is lower than the separation temperature that can be achieved, the separation result is not ideal. When the temperature reaches −40 °C and the pressure is 5.8 MPa, the maximum separation efficiency is 30.2%. Therefore, Scheme 1 was selected as the second-stage separation scheme, and then the liquid phase mixture obtained by the second-stage separation was subjected to third-stage separation to separate the light components.

3.2.2. Three-Stage Separation Simulation Based on Temperature and Pressure Changes

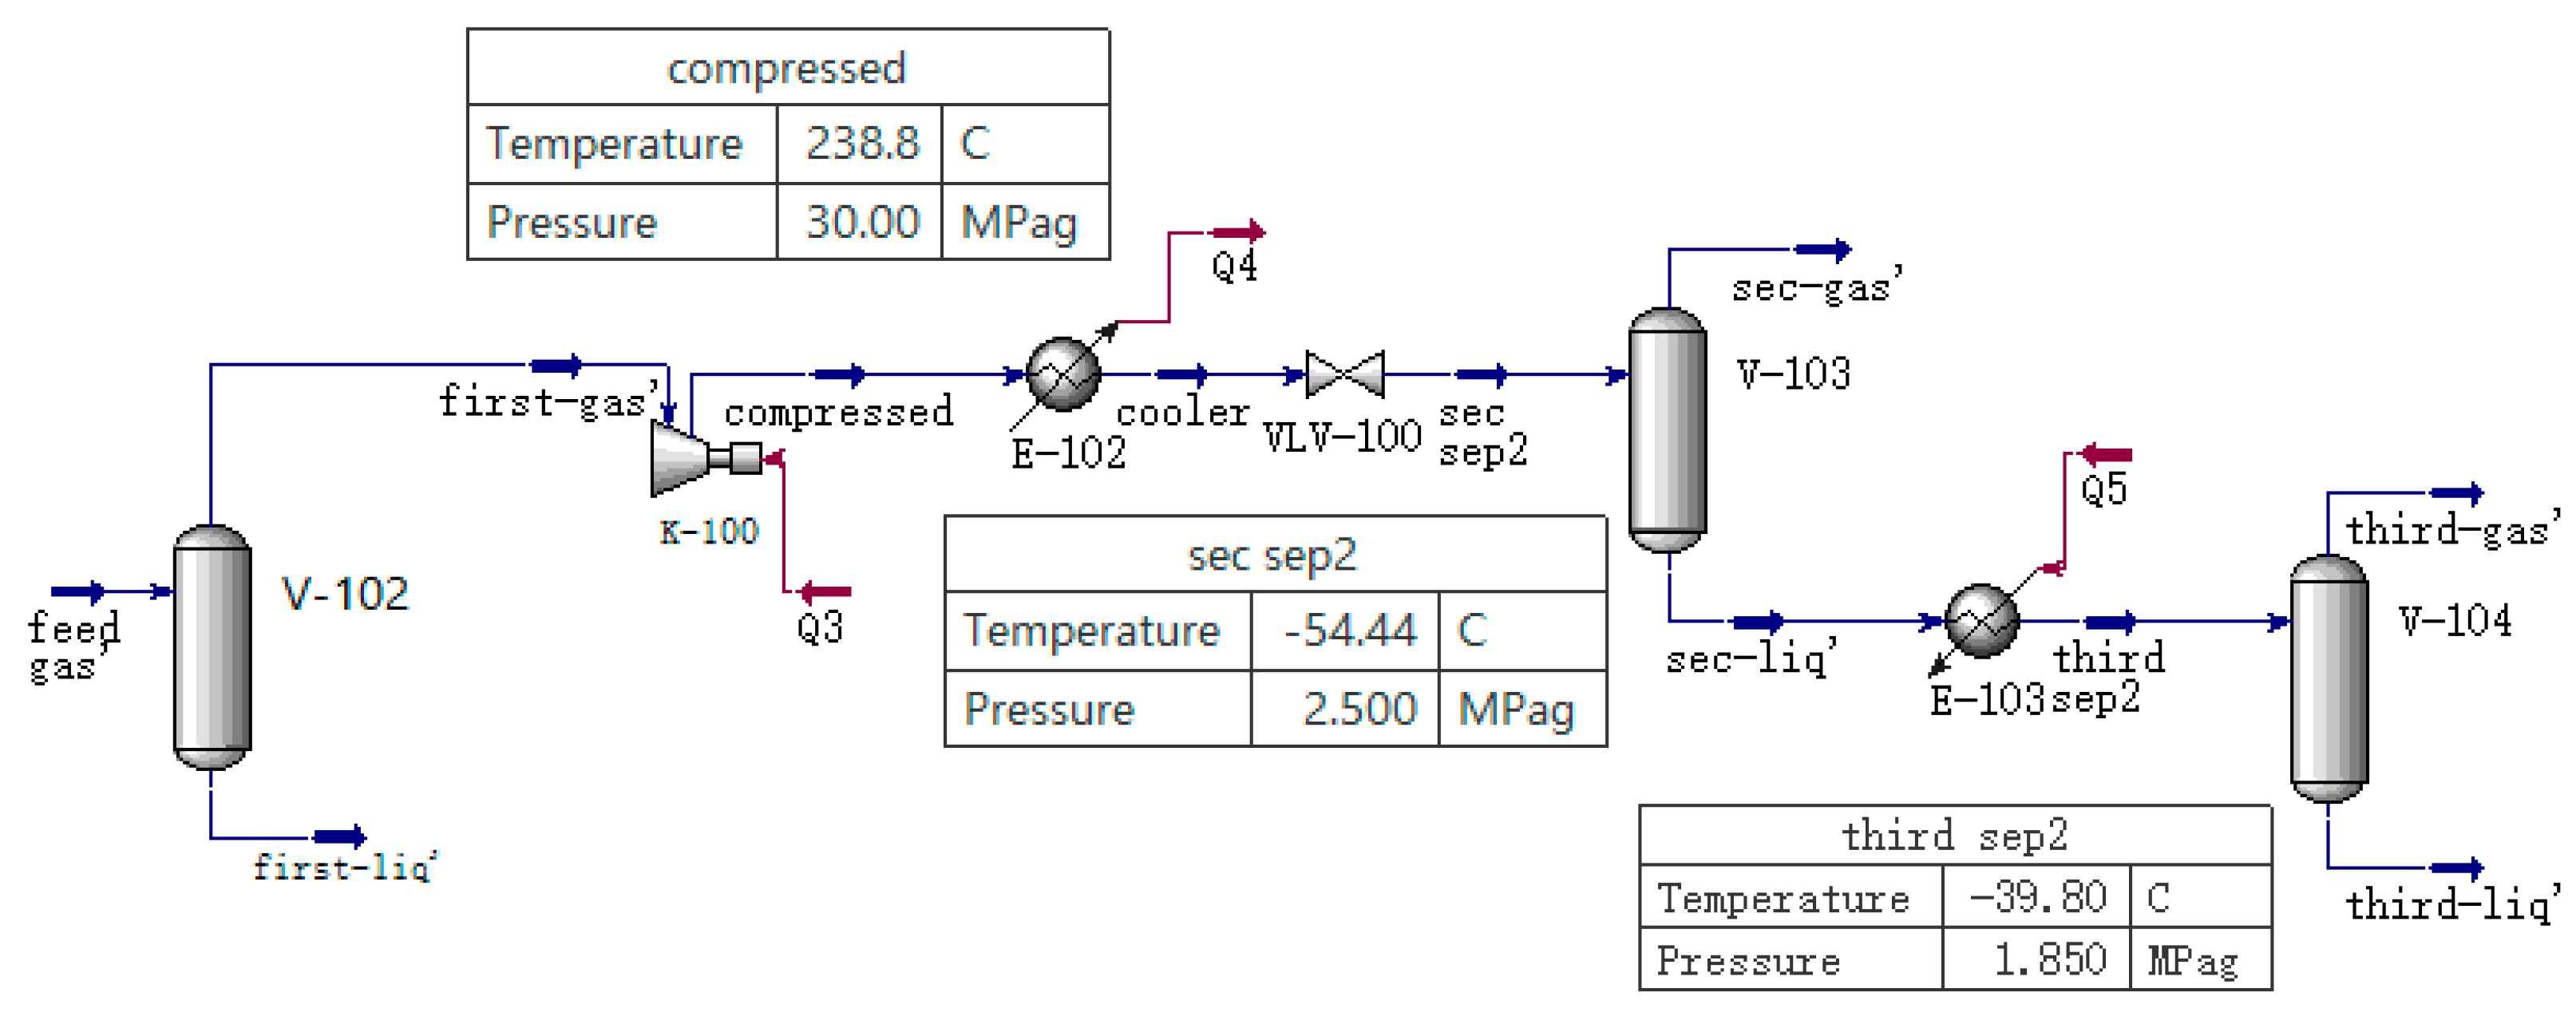
Using the separation scheme of Scheme 1, the separation flow chart of adding three-stage separation is shown in Figure 15.
After adding the three-stage separation, it is also necessary to judge the recovery efficiency of light components in the CO2-rich phase by controlling the separation temperature and pressure after the heat exchanger E-103 is added. The CO2-rich phase obtained by the two-stage separation is obtained by controlling the pressure before and after the two-stage separation throttling. The final ideal separation result is that most of the CO2 is located at the liquid phase outlet of the three-stage separation, and the light components are located at the gas phase outlet of the two-stage and three-stage separation. Therefore, the three-stage separation process indirectly affects the separation results by controlling four variables, so it is necessary to optimize the three-stage separation process.
The genetic algorithm is used for optimization. By connecting HYSYS and MATLAB for programming, the objective function OF relationship is determined as shown in Equation (3).
O F = ( q out 3 q i n 3 ) C O 2 + ( q out 2 q i n 2 ) C H 4 + ( q out 3 q i n 3 ) C H 4 3
Considering that the secondary separation is mainly for CO2 separation, and the tertiary separation is mainly for the separation of light components in the CO2-rich phase, the calculation results are shown in Figure 16 below.
The calculation results are shown in Figure 17 below. It can be concluded that when the pressure before throttling at the secondary separation is 28.43 MPa, the pressure after throttling is 2.87 MPa, the tertiary separation temperature is −39.8 °C and the separation pressure is 1.85 MPa, according to the definition of the objective function OF, the maximum efficiency is 72.23%. The molar composition of the system before and after separation is shown in Table 8.

4. Conclusions

In this paper, the phase equilibrium separation of a CO2-containing mixed system is studied. The process is a preliminary coarse separation, which is suitable for preliminary processing and separation after oil and gas production on offshore platforms, and then enters pipeline transportation to reduce economic losses. The following conclusions are obtained through experimental and simulation research and analysis:
(1)
The bubble, dew point pressure and phase envelope diagram of different CH4-CO2 systems at different temperatures were obtained by experiments. Then, different state equations are selected by simulation and compared with the experimental results. Through error analysis, the PR equation is selected to be the most suitable for a CO2 mixed system;
(2)
The multi-component system containing CO2 produced in the oilfield was studied, and the separation efficiency was redefined. The three-stage separation process was used to separate the phase equilibrium of the system. The first-stage separation was to separate most of the macromolecular alkanes in the form of a liquid phase so that most of the CO2 and small molecular alkanes were separated by the gas phase. Then, the CO2 in the separated gas phase is separated, and two different separation schemes are selected to separate so that most of the CO2 is separated in the form of a liquid phase, while most of the light hydrocarbon components exist in the gas phase. In the supercharging and throttling process of Scheme 1, it is found that when the supercharging is up to 30 MPa, the throttling is up to 2.5 MPa and the best separation efficiency is 42.2%. In Scheme 2, it is found that the optimal separation efficiency is 30.2%. With the increase of the system temperature, the system temperature rises to close to the critical temperature, which greatly reduces the separation efficiency;
(3)
Then, the light components in the liquid phase composition of the two-stage separation were recovered, and the three-stage separation process was designed. Since the separation degree of the three-stage separation was affected by the two-stage separation results, the genetic algorithm was used to optimize the two-stage and three-stage separation processes. The optimal separation temperature and separation pressure in the two-stage and three-stage separation processes were determined. It can be concluded that when the pressure before throttling at the secondary separation is 28.43 MPa, the pressure after throttling is 2.87 MPa, the tertiary separation temperature is −39.8 °C and the separation pressure is 1.85 MPa, according to the definition of the objective function OF, the maximum efficiency is 72.23%.

Author Contributions

Conceptualization, M.Z. and Y.J.; methodology, J.Z.; software, Q.W.; validation, M.Z. and Y.L.; formal analysis, N.X.; investigation, Q.W.; writing—original draft preparation, Q.W.; writing—review and editing, M.Z.; supervision, Y.J.; project administration, M.Z.; funding acquisition, M.Z. All authors have read and agreed to the published version of the manuscript.

Funding

This research was funded by the National Key Laboratory for Efficient Development of Offshore Oil and Gas (2023-GX-10-03).

Data Availability Statement

The original contributions presented in this study are included in the article. Further inquiries can be directed to the corresponding author.

Acknowledgments

This study is supported by the Development Fund Project of the National Key Laboratory for Efficient Development of Offshore Oil and Gas (2023-GX-10-03).

Conflicts of Interest

The authors declare that we have no known competing financial interests or personal relationships that could have appeared to influence the work reported in this paper.

References

  1. Yao, J.; Han, H.; Yang, Y.; Song, Y.; Li, G. A review of recent progress of carbon capture, utilization, and storage (CCUS) in China. Appl. Sci. 2023, 13, 1169. [Google Scholar] [CrossRef]
  2. Li, M.; He, N.; Xu, L.; Peng, C.; Chen, H.; Yu, G. Eco-CCUS: A cost-effective pathway towards carbon neutrality in China. Renew. Sustain. Energy Rev. 2023, 183, 113512. [Google Scholar] [CrossRef]
  3. Ding, H.; Zhang, Y.; Dong, Y.; Wen, C.; Yang, Y. High-pressure supersonic carbon dioxide (CO2) separation benefiting carbon capture, utilisation and storage (CCUS) technology. Appl. Energy 2023, 339, 120975. [Google Scholar] [CrossRef]
  4. Wang, H.; Zhao, J.; Liu, F.; She, Z.; Ge, X.; Luo, J.; Qiao, Y.; Tian, Y. Comparison of Low-Temperature Dehydration Process Routes for Natural Gas in a Certain Offshore Projec. Shandong Chem. Ind. 2023, 52, 166–168. [Google Scholar]
  5. Voldsund, M.; Nguyen, T.V.; Elmegaard, B.; Ertesvåg, I.S.; Røsjorde, A.; Jøssang, K.; Kjelstrup, S. Exergy destruction and losses on four North Sea offshore platforms: A comparative study of the oil and gas processing plants. Energy 2014, 74, 45–58. [Google Scholar] [CrossRef]
  6. Bai, G.; Su, J.; Fu, S.; Li, X.; Zhou, X.; Wang, J.; Liu, Z.; Zhang, X. Effect of CO2 injection on the gas desorption and diffusion kinetics: An experimental study. Energy 2024, 288, 129921. [Google Scholar] [CrossRef]
  7. Chen, W.; Yu, T.; Guo, Z.; Li, R.; Faye, W.; Zhang, T. Exploring the Process of Removing Acidic Gas from Natural Gas on Offshore Platforms. Shandong Chem. Ind. 2024, 53, 188–190+202. [Google Scholar]
  8. Cubas JM, C.; Stel, H.; Neto MA, M.; Da Silva, L.C.T.; Romero, G.A.; Morales, R.E.M. Numerical simulation of the flow of supercritical CO2 in a multistage centrifugal pump. In Proceedings of the SPE Brazil Flow Assurance Technology Congress, Rio de Janeiro, Brazil, 15–18 November 2022. [Google Scholar]
  9. Peng, W.; Duan, W. Discussion on Decarbonization Technology of High Carbon Dioxide Natural Gas. Chem. Enterp. Manag. 2020, 124–125. [Google Scholar]
  10. Cheng, H. Research on Decarbonization Technology of High Carbon Dioxide Natural Has. Chem. Enterp. Manag. 2019, 76–77. [Google Scholar]
  11. Ma, X.; Yu, S.; Xie, W.; Wang, S.; Cheng, Z. Decarbonization Technology of High Carbon Dioxide Natural Gas. Oil-Gas Field Surf. Eng. 2012, 31, 45–46. [Google Scholar]
  12. de Oliveira Arinelli, L.; de Medeiros, J.L.; de Melo, D.C.; Teixeira, A.M.; Brigagão, G.V.; Passarelli, F.M.; Grava, W.M.; de Queiroz, F.O. Carbon capture and high-capacity supercritical fluid processing with supersonic separator: Natural gas with ultra-high CO2 content. J. Nat. Gas Sci. Eng. 2019, 66, 265–283. [Google Scholar] [CrossRef]
  13. Fan, M.; Hua, Y.; Su, Q. Design of amine decarbonization process for high CO2 content natural gas. Chem. Eng. Oil Gas 2021, 50, 35–41. [Google Scholar]
  14. Liu, Y.; Deng, H.; Xing, C.; Zhao, Y.; Kang, G.; Cao, Y.; Li, Z. Research progress of high pressure membrane absorption of natural gas decarburization. Mod. Chem. Ind. 2022, 42, 62–66. [Google Scholar]
  15. Ghaemi, A.; Hemmati, A.; Mashhadimoslem, H. Non-equilibrium modeling of CO2 reactive-absorption process using sodium hydroxide–ammonia–water solution in a packed bed column. J. Iran. Chem. Soc. 2021, 18, 2303–2314. [Google Scholar] [CrossRef]
  16. Liu, H. Progress Analysis of Natural Gas Desulfurization and Decarbonization Process. China Energy Environ. Prot. 2019, 41, 122–125. [Google Scholar]
  17. Chronopoulos, T.; Fernandez-Diez, Y.; Maroto-Valer, M.M.; Ocone, R.; Reay, D.A. CO2 desorption via microwave heating for post-combustion carbon capture. Microporous Mesoporous Mater. 2014, 197, 288–290. [Google Scholar] [CrossRef]
  18. Fernández, J.; Sotenko, M.; Derevschikov, V.; Lysikov, A.; Rebrov, E.V. A radiofrequency heated reactor system for post-combustion carbon capture. Chem. Eng. Process. Process Intensif. 2016, 108, 17–26. [Google Scholar] [CrossRef]
  19. Nguyen, T.-V.; Barbosa, Y.M.; da Silva, J.A.; Junior, S.d.O. A novel methodology for the design and optimisation of oil and gas offshore platforms. Energy 2019, 185, 158–175. [Google Scholar] [CrossRef]
  20. Anjos, S.M.; Passarelli, F.M.; Wambersie, O.E.; Lewis, K.; Rovina, P.S.; Coelho, O.; Martins, M.; Ribeiro, O.J.S.; Fernandes, R.A.R.; Borges, F.A. Libra: Applied Technologies Adding Value to a Giant Ultra Deep Water Pre-salt Field-Santos Basin, Brazil. In Proceedings of the Offshore Technology Conference, Rio de Janeiro, Brazil, 29–31 October 2019; p. D021S016R001. [Google Scholar]
  21. Basilio, L.P.; Machado, P.B.; Sousa, L.K.S.; de Sousa, D.C.; de Castro, R.V.; Anjos, R.P.D.; Andreotti, M.; Juliano, D.R.; Chaney, C.; Matos, S.; et al. Subsea Processing Systems: An Overview of Promising Technologies on the Subsea Factory Decarbonization Path. In Proceedings of the Offshore Technology Conference, Houston, TX, USA, 1–4 May 2023; p. D031S042R003. [Google Scholar]
  22. Li, M.; Qi, B.; Zhang, Y.; Chen, Y.; Li, Z. Simulation of crude oil stabilization process and optimization of operation parameters based on HYSYS. Technol. Superv. Pet. Ind. 2023, 39, 14–19. [Google Scholar]
  23. Xu, X.; Xu, Y.; Zhang, W.; Rao, Q.; Zhou, S. Recovery and utilization of associated gas in crude oil production process. Sino-Glob. Energy 2019, 24, 91–96. [Google Scholar]
  24. Lin, M.; Fan, W.; Liu, K.; He, M.; Ma, Y.e.; Liu, H. Comparative study on positive pressure flash distillation process and fractionation stabilization process of crude oil. Nat. Gas Oil 2022, 40, 14–20. [Google Scholar]
  25. Yang, W.; Li, Y.; Li, Y. Natural gas light hydrocarbon recovery process design and optimization of operating parameters. Chem. Ind. Eng. Prog. 2015, 34, 3589–3594. [Google Scholar]
  26. Lu, J. Design and optimization of light hydrocarbon recovery process for a natural gas treatment plant in Daqing. Master’s Thesis, Northeast Petroleum University, Daqing, China, 2018. [Google Scholar]
  27. Zhu, L.; Chen, G. Model study on phase equilibrium of methane-carbon dioxide system at low temperature. Acta Pet. Sin. (Pet. Process. Sect.) 1988, 30–39. [Google Scholar]
  28. Xu, N.; Dong, J.; Wang, Y.; Shi, J. Study on the phase equilibrium of high-pressure fluid in the near-critical region of N2-CH4-CO2 system. CIESC J. 1992, 640–644. [Google Scholar]
  29. Sterner, C.J. Phase equilibria in the CO2-methane systems. In Advances in Cryogenic Engineering: Proceedings of the 1960 Cryogenic Engineering Conference University of Colorado and National Bureau of Standards Boulder, Boulder, CO, USA, 23–25 August 1960; Springer: Boston, MA, USA, 1961. [Google Scholar]
  30. Metcalfe, R.; Yarborough, L. The effect of phase equilibria on the CO2 displacement mechanism. Soc. Pet. Eng. J. 1979, 19, 242–252. [Google Scholar] [CrossRef]
  31. Ali, A.; Abdulrahman, A.; Garg, S.; Maqsood, K.; Murshid, G. Application of artificial neural networks (ANN) for vapor-liquid-solid equilibrium prediction for CH4-CO2 binary mixture. Greenh. Gases Sci. Technol. 2019, 9, 67–78. [Google Scholar] [CrossRef]
  32. Tsivintzelis, I.; Kontogeorgis, G.M.; Michelsen, M.L.; Stenby, E.H. Modeling phase equilibria for acid gas mixtures using the CPA equation of state. Part II: Binary mixtures with CO2. Fluid Phase Equilibria 2011, 306, 38–56. [Google Scholar] [CrossRef]
  33. Abdolbaghi, S.; Mohamadnazar, A.; Hasanipanah, M.; Barati-Harooni, A. Comparison between a soft computing model and thermodynamic models for prediction of phase equilibria in binary mixtures containing 1-alkanol, n-alkane, and CO2. Fluid Phase Equilibria 2020, 503, 112307. [Google Scholar] [CrossRef]
  34. Wu, Z.; Sun, R.; Shi, L.; Hu, P.; Tian, H.; Wang, X.; Shu, G. Vapor-liquid equilibrium measurement and critical line prediction for Carbon Dioxide (CO2)+ Fluoroethane (R161) binary mixtures. J. Supercrit. Fluids 2024, 207, 106205. [Google Scholar] [CrossRef]
  35. Gui, X.; Wang, W.; Gao, Q.; Yun, Z.; Fan, M.; Chen, Z. Measurement and correlation of high pressure phase equilibria for CO2 + alkanes and CO2 + crude oil systems. J. Chem. Eng. Data 2017, 62, 3807–3822. [Google Scholar] [CrossRef]
  36. Abunahman, S.S.; dos Santos, L.C.; Tavares, F.W.; Kontogeorgis, G.M. A computational tool for parameter estimation in EoS: New methodologies and natural gas phase equilibria calculations. Chem. Eng. Sci. 2020, 215, 115437. [Google Scholar] [CrossRef]
  37. Soave, G. Equilibrium constants from a modified Redlich-Kwong equation of state. Chem. Eng. Sci. 1972, 27, 1197–1203. [Google Scholar] [CrossRef]
  38. Peng, D.-Y.; Robinson, D.B. A new two-constant equation of state. Ind. Eng. Chem. Fundam. 1976, 15, 59–64. [Google Scholar] [CrossRef]
  39. Benedict, M.; Webb, G.B.; Rubin, L.C. An empirical equation for thermodynamic properties of light hydrocarbons and their mixtures I. Methane, ethane, propane and n-butane. J. Chem. Phys. 1940, 8, 334–345. [Google Scholar] [CrossRef]
  40. Nishiumi, H.; Saito, S. An improved generalized BWR equation of state applicable to low reduced temperatures. J. Chem. Eng. Jpn. 1975, 8, 356–360. [Google Scholar] [CrossRef]
  41. Kunz, O.; Wagner, W. The GERG-2008 wide-range equation of state for natural gases and other mixtures: An expansion of GERG-2004. J. Chem. Eng. Data 2012, 57, 3032–3091. [Google Scholar] [CrossRef]
Figure 1. Experimental device for measuring phase characteristics of CO2 mixed system.
Processes 12 02924 g001
Figure 2. The research process of CO2 phase equilibrium separation.
Processes 12 02924 g002
Figure 3. Comparison of experimental data of bubble and dew point of 80% CO2 and 20% CH4 with each equation.
Processes 12 02924 g003
Figure 4. Relative errors between experimental data of 80 % CO2, 20% CH4 bubble, dew point and each equation.
Processes 12 02924 g004
Figure 5. Comparison of experimental data of bubble and dew point of 90% CO2 and 10% CH4 with each equation.
Processes 12 02924 g005
Figure 6. The relative errors between the experimental values of 90% CO2, 10% CH4 bubble and dew point and each equation.
Processes 12 02924 g006
Figure 7. Platform component phase diagram.
Processes 12 02924 g007
Figure 8. One- and two-stage separation flow chart. The arrows represent the flow of logistics in the process flow.
Processes 12 02924 g008
Figure 9. Scheme two-stage separation flow chart.
Processes 12 02924 g009
Figure 10. Phase diagram of decarburization inlet composition.
Processes 12 02924 g010
Figure 11. Scheme one- and two-stage separation simulation flow chart.
Processes 12 02924 g011
Figure 12. The first- and second-stage separation efficiency η-P curve of the scheme.
Processes 12 02924 g012
Figure 13. Scheme two-stage separation simulation flow chart.
Processes 12 02924 g013
Figure 14. Two-stage separation efficiency η-P curve of the scheme.
Processes 12 02924 g014
Figure 15. Scheme 1 separation flow chart.
Processes 12 02924 g015
Figure 16. Genetic algorithm to optimize the separation iteration results.
Processes 12 02924 g016
Figure 17. Scheme 1 separation of calculation results.
Processes 12 02924 g017
Table 1. Commonly used equations of state and their expressions.
Decarburization ProcessesAdvantageDisadvantage
Low-temperature separation technologyHigh concentration of CO2 and reinjectionLarge equipment investment cost and high energy consumption
Alcohol amine methodThe technology is mature, and the light hydrocarbons lose lessThe process is complex, and the renewable energy consumption is high
Membrane separation methodSimple process, low energy consumption, small investment, light weightPressure drop has high energy consumption, low hydrocarbon recovery efficiency and high cost, and the membrane needs to be replaced regularly
Pressure swing adsorption methodSimple process, high degree of automation, low energy consumptionThe loss of light hydrocarbon is high, and the economy is poor
Physical solvent methodLow energy consumption, no solvent deterioration problemThe process is complicated, and heavy hydrocarbon loss is great
phase separationIt can be used as a preliminary separation, the process is simple, the dry high-pressure CO2 is obtained and the energy consumption is lowIt is only applicable to the initial separation, and the CO2 content in the separated natural gas makes it difficult to reach the first-class gas standard
Table 2. Commonly used equations of state and their expressions.
EOSExpressionCoefficient
SRK [37] p = R T V b a ( T ) V ( V + b ) a ( T ) = a α ( T ) = ( 0.4278 R 2 T c 2 / p c ) α ( T )
b = 0.08664 R T c / p c
α ( T ) = [ 1 + m ( 1 T r 0.5 ) ] 2
m = 0.480 + 1.574 ω 0.176 ω 2
PR [38] p = R T V b a ( T ) V ( V + b ) + b ( V b ) a ( T ) = 0.45724 ( R 2 T c 2 ) p c α ( T )
b = 0.07780 R T c p c
BWRS [39,40] p = ρ R T + ( B 0 R T A 0 C 0 T 2 + D 0 T 3 E 0 T 4 ) ρ 2 + ( b R T a d T ) ρ 3 + α ( a + d T ) ρ 6 + c ρ 3 T 2 ( 1 + γ ρ 2 ) exp ( γ ρ 2 ) B0, A0, C0, D0, E0, b, a, d, α, c, γ is the correlation coefficient of BWRS equation of state.
GERG-2008 [41] The   equation   structure   is   expressed   as   a ( δ , τ , x ¯ ) = a 0 ( ρ , T , x ¯ ) + a r ( δ , τ , x ¯ ) α r ( δ , τ , x ¯ ) = j = 1 N x j α 0 , j r ( δ , τ ) + Δ α r ( δ , τ , x ¯ )
δ = ρ ρ r ( x ¯ )
τ = T r ( x ¯ ) T
Table 3. The proportion of logistics components on the platform.
ComponentMOLEComponentMOLE
Helium0.000049 n-Decane0.000609
CO20.292836 C11+_1 *0.000554
Nitrogen0.003659 H2O0.056394
Methane0.559954 TEGlycol0.000000
Ethane0.030896 EGlycol0.022988
Propane0.012809 H2S0.000000
i-Butane0.002593 n-Hexane0.004149
n-Butane0.003558 n-Heptane0.003290
i-Pentane0.001417 n-Octane0.000701
n-Pentane0.001112 n-Nonane0.001437
* The group is divided into given virtual components.
Table 4. Decarburization inlet component ratio.
ComponentMOLEComponentMOLE
Helium0.000055i-Pentane0.000926
CO20.31889n-Pentane0.000631
Nitrogen0.004069n-Decane0.000003
Methane0.621261H2O0.000233
Ethane0.033693n-Hexane0.001112
Propane0.013241n-Heptane0.000336
i-Butane0.002415n-Octane0.000024
n-Butane0.003092n-Nonane0.000017
Table 5. The molar fraction of each component in a simulated oilfield mixed system.
ComponentComposition (mol)Gas Composition (mol)Liquid Composition (mol)Aqueous Phase (mol)
Helium0.0000490.0000540.0000030
CO20.2928350.3191360.1353360.030951
Nitrogen0.0036590.0040470.0002070.000007
Methane0.5599520.618330.0978930.000013
Ethane0.0308960.033740.0274610
Propane0.0128090.013550.0369990
i-Butane0.0025930.0025830.0168320
n-Butane0.0035580.0034080.0310940
i-Pentane0.0014170.0011460.0247330
n-Pentane0.0011120.0008250.0237370
n-Hexane0.0041490.0018480.1605770
n-Heptane0.003290.0006850.1729550
n-Octane0.0007010.0000580.0420220
n-Nonane0.0014370.0000450.0904240
n-Decane0.0006090.0000070.0390050
H2O0.0563940.0005350.0002640.68669
Table 6. The proportion of components after primary and secondary separation.
ComponentComposition (mol)Gas Composition (mol)Liquid Composition (mol)Aqueous Phase (mol)
Helium0.0000540.0000680.0000010
CO20.3191360.2329520.656640.117118
Nitrogen0.0040470.0049740.0004350.000047
Methane0.618330.7284360.189250
Ethane0.033740.0276380.0576810
Propane0.013550.0050770.0467150
i-Butane0.0025830.0004190.0110520
n-Butane0.0034080.0003560.0153510
i-Pentane0.0011460.0000450.0054560
n-Pentane0.0008250.0000210.0039730
n-Hexane0.0018480.0000120.0090320
n-Heptane0.0006850.0000010.0033630
n-Octane0.00005800.0002830
n-Nonane0.00004500.0002210
n-Decane0.00000700.0000360
H2O0.0005350.0000020.0005080.880149
Table 7. Composition ratio after secondary separation of Scheme 2.
ComponentComposition (mol)Gas Composition (mol)Liquid Composition (mol)Aqueous Phase (mol)
Helium0.0000540.0000660.0000110
CO20.3191360.2779840.467760.035927
Nitrogen0.0040470.0047130.0016610.000026
Methane0.618330.6755210.4140430
Ethane0.033740.0293970.0494310
Propane0.013550.0087890.0307030
i-Butane0.0025830.0012490.0073870
n-Butane0.0034080.0014220.0105570
i-Pentane0.0011460.0003270.0040960
n-Pentane0.0008250.0002010.0030730
n-Hexane0.0018480.0002530.0075880
n-Heptane0.0006850.000050.0029720
n-Octane0.0000580.0000020.0002570
n-Nonane0.0000450.0000010.0002040
n-Decane0.00000700.0000330
H2O0.0005350.0000240.000220.961296
Table 8. Molar composition of the system before and after separation.
ComponentRaw Gas Composition (mol)Secondary Separation Gas Phase (mol)Three-Stage Separation Gas Phase (mol)Three-Stage Separation Liquid Phase (mol)
Helium0.0000490.0000680.0000030
CO20.2928350.2374670.4847830.720461
Nitrogen0.0036590.0049610.001280.000075
Methane0.5599520.723710.4484220.075719
Ethane0.0308960.0275410.0504710.061853
Propane0.0128090.0052920.0126030.064131
i-Butane0.0025930.000460.0011510.016261
n-Butane0.0035580.0004030.0010260.022966
i-Pentane0.0014170.0000530.0001350.00834
n-Pentane0.0011120.0000260.0000660.006101
n-Hexane0.0041490.0000160.0000410.013973
n-Heptane0.003290.0000020.0000040.005215
n-Octane0.000701000.000439
n-Nonane0.001437000.000342
n-Decane0.000609000.000056
H2O0.0563940.0000030.0000140.004052
Disclaimer/Publisher’s Note: The statements, opinions and data contained in all publications are solely those of the individual author(s) and contributor(s) and not of MDPI and/or the editor(s). MDPI and/or the editor(s) disclaim responsibility for any injury to people or property resulting from any ideas, methods, instructions or products referred to in the content.