

A Novel Martensitic Stainless Steel Material for CO2 Corrosion Environment

Abstract
1. Introduction

| Element | Effect on Material Properties |
|---|---|
| Cr | The addition of Cr elements can enhance the inertness of materials. Therefore, the higher the Cr content, the stronger the corrosion resistance of the material, especially suitable for CO2 corrosion environments. As the Cr content increases, the hardness of the steel improves; however, its impact toughness may decrease. |
| Ni | The primary function of Ni is to provide the material with good ductility. When the Ni content exceeds 20%, it can endow the material with good resistance to stress corrosion cracking. Excessive addition of nickel may reduce hardness and wear resistance, affect high-temperature strength, promote stress corrosion cracking, and impair weldability, among other effects. |
| Mo | The addition of Mo elements is beneficial for enhancing the inertness of materials, preventing pitting and crevice corrosion in the material. Excessive or improper addition of molybdenum may lead to reduced toughness, increased brittleness, and deterioration in hot working and machining performance. |
| Ti | The addition of Ti elements is advantageous in preventing the precipitation of chromium carbides, thereby reducing the sensitivity to intergranular corrosion. Excessive addition or improper process control may result in reduced weldability, microstructural inhomogeneity, decreased corrosion resistance, reduced toughness, and increased processing difficulties. |
| Mn | Mn helps to prevent the occurrence of S and increase the strength of the material. Excessive manganese may lead to reduced corrosion resistance, decreased toughness, deteriorated hot workability, exacerbated sensitization, increased susceptibility to temper embrittlement, and impaired weldability. |
| Nb | The addition of Nb elements is similar to Ti in its effect. Excessive addition may lead to increased costs, embrittlement, poor weldability, reduced machinability, grain coarsening, and decreased oxidation resistance, among other issues. |
| Cu | It can improve the material’s corrosion resistance in acidic environments. Excessive copper may result in poor weldability, increased processing difficulties, enhanced low-temperature brittleness, reduced pitting corrosion resistance, and greater oxidation tendency, among other issues. |
| Al | The addition of Al elements can improve the material’s resistance to sulfur. Excessive or improper addition of aluminum may reduce mechanical properties, machinability, corrosion resistance, and high-temperature strength, increase welding difficulty, and promote embrittlement tendency. |
| C | Reducing the carbon (C) content can decrease the precipitation of chromium carbides and enhance the resistance against intergranular corrosion. High carbon content, on the other hand, can improve the alloy’s creep resistance and enhance its mechanical properties at high temperatures. However, as the carbon content increases, the corrosion rate of the alloy also increases, leading to a decrease in corrosion resistance. |
| S | The addition of S elements makes the material sensitive to pitting corrosion. |
| P | An appropriate amount of phosphorus can enhance the strength and hardness of steel; however, excessive phosphorus increases brittleness. Phosphorus affects grain growth and phase transformations, potentially leading to precipitate formation, which can impact the overall performance of the material. |
| V | An appropriate amount of vanadium can significantly increase the strength, hardness, and wear resistance of alloys while reducing the risk of brittle fracture. Vanadium refines the grain structure and promotes a uniform phase distribution, thereby enhancing overall mechanical properties. |
2. Experimental Materials and Methods
2.1. Experimental Material
2.1.1. Chemical Composition
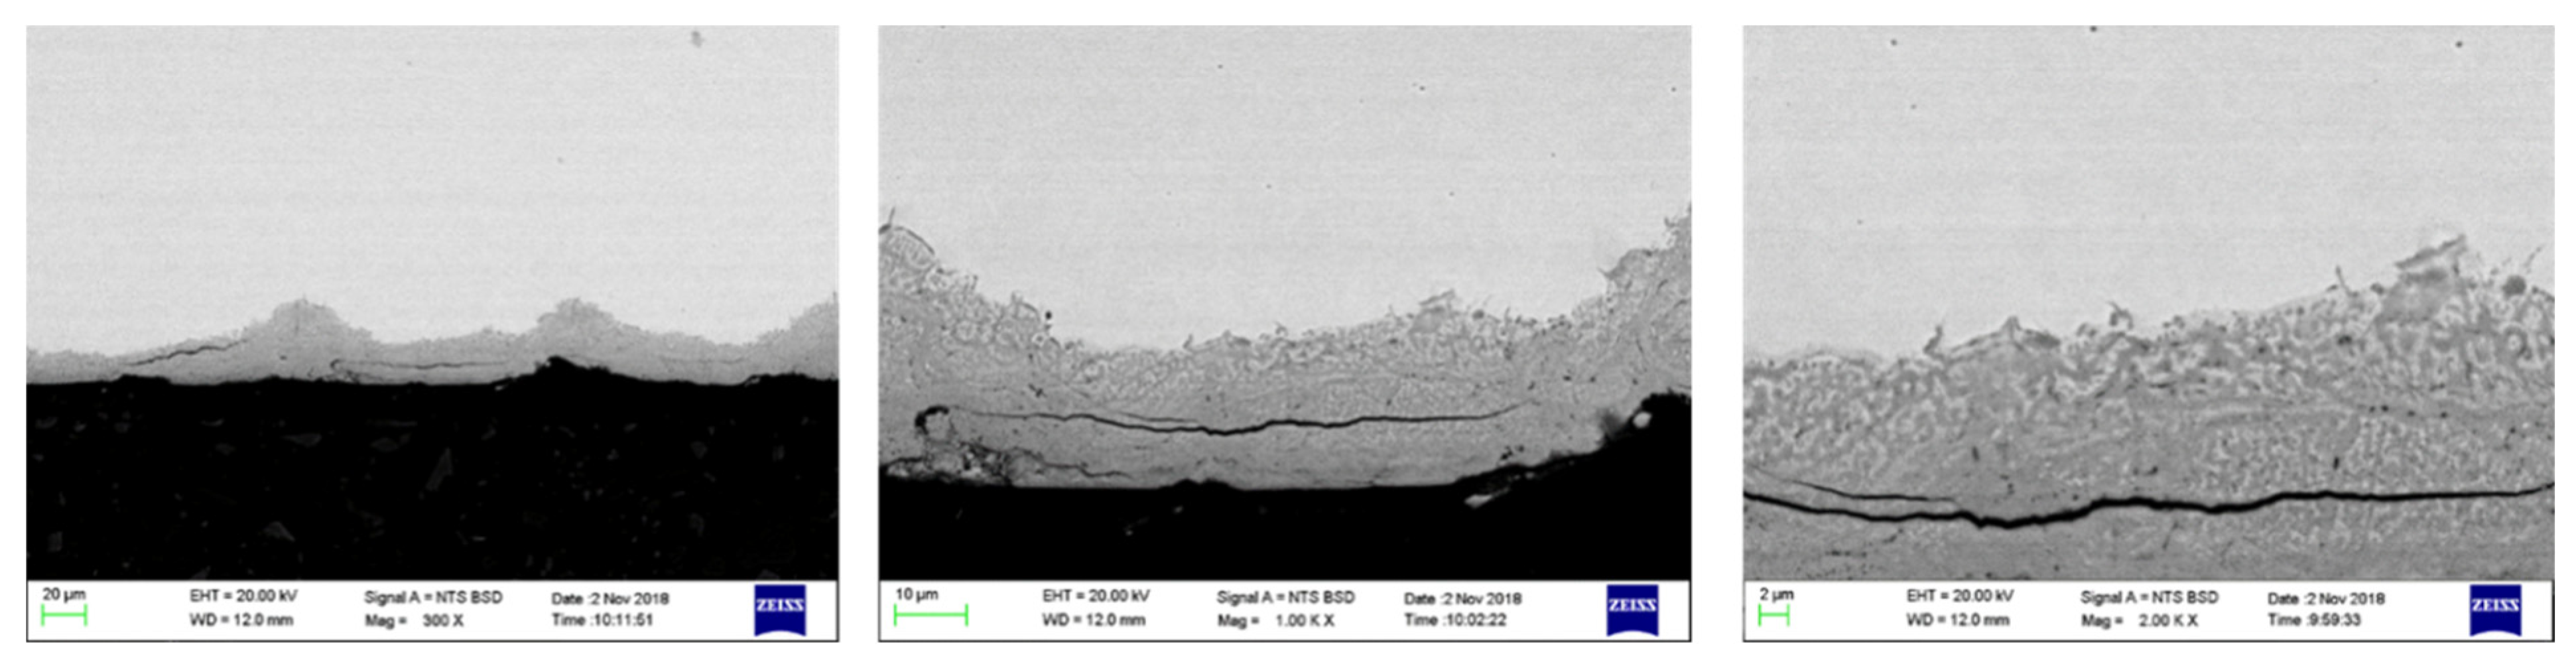
2.1.2. Surface Oxide Composition and Structure
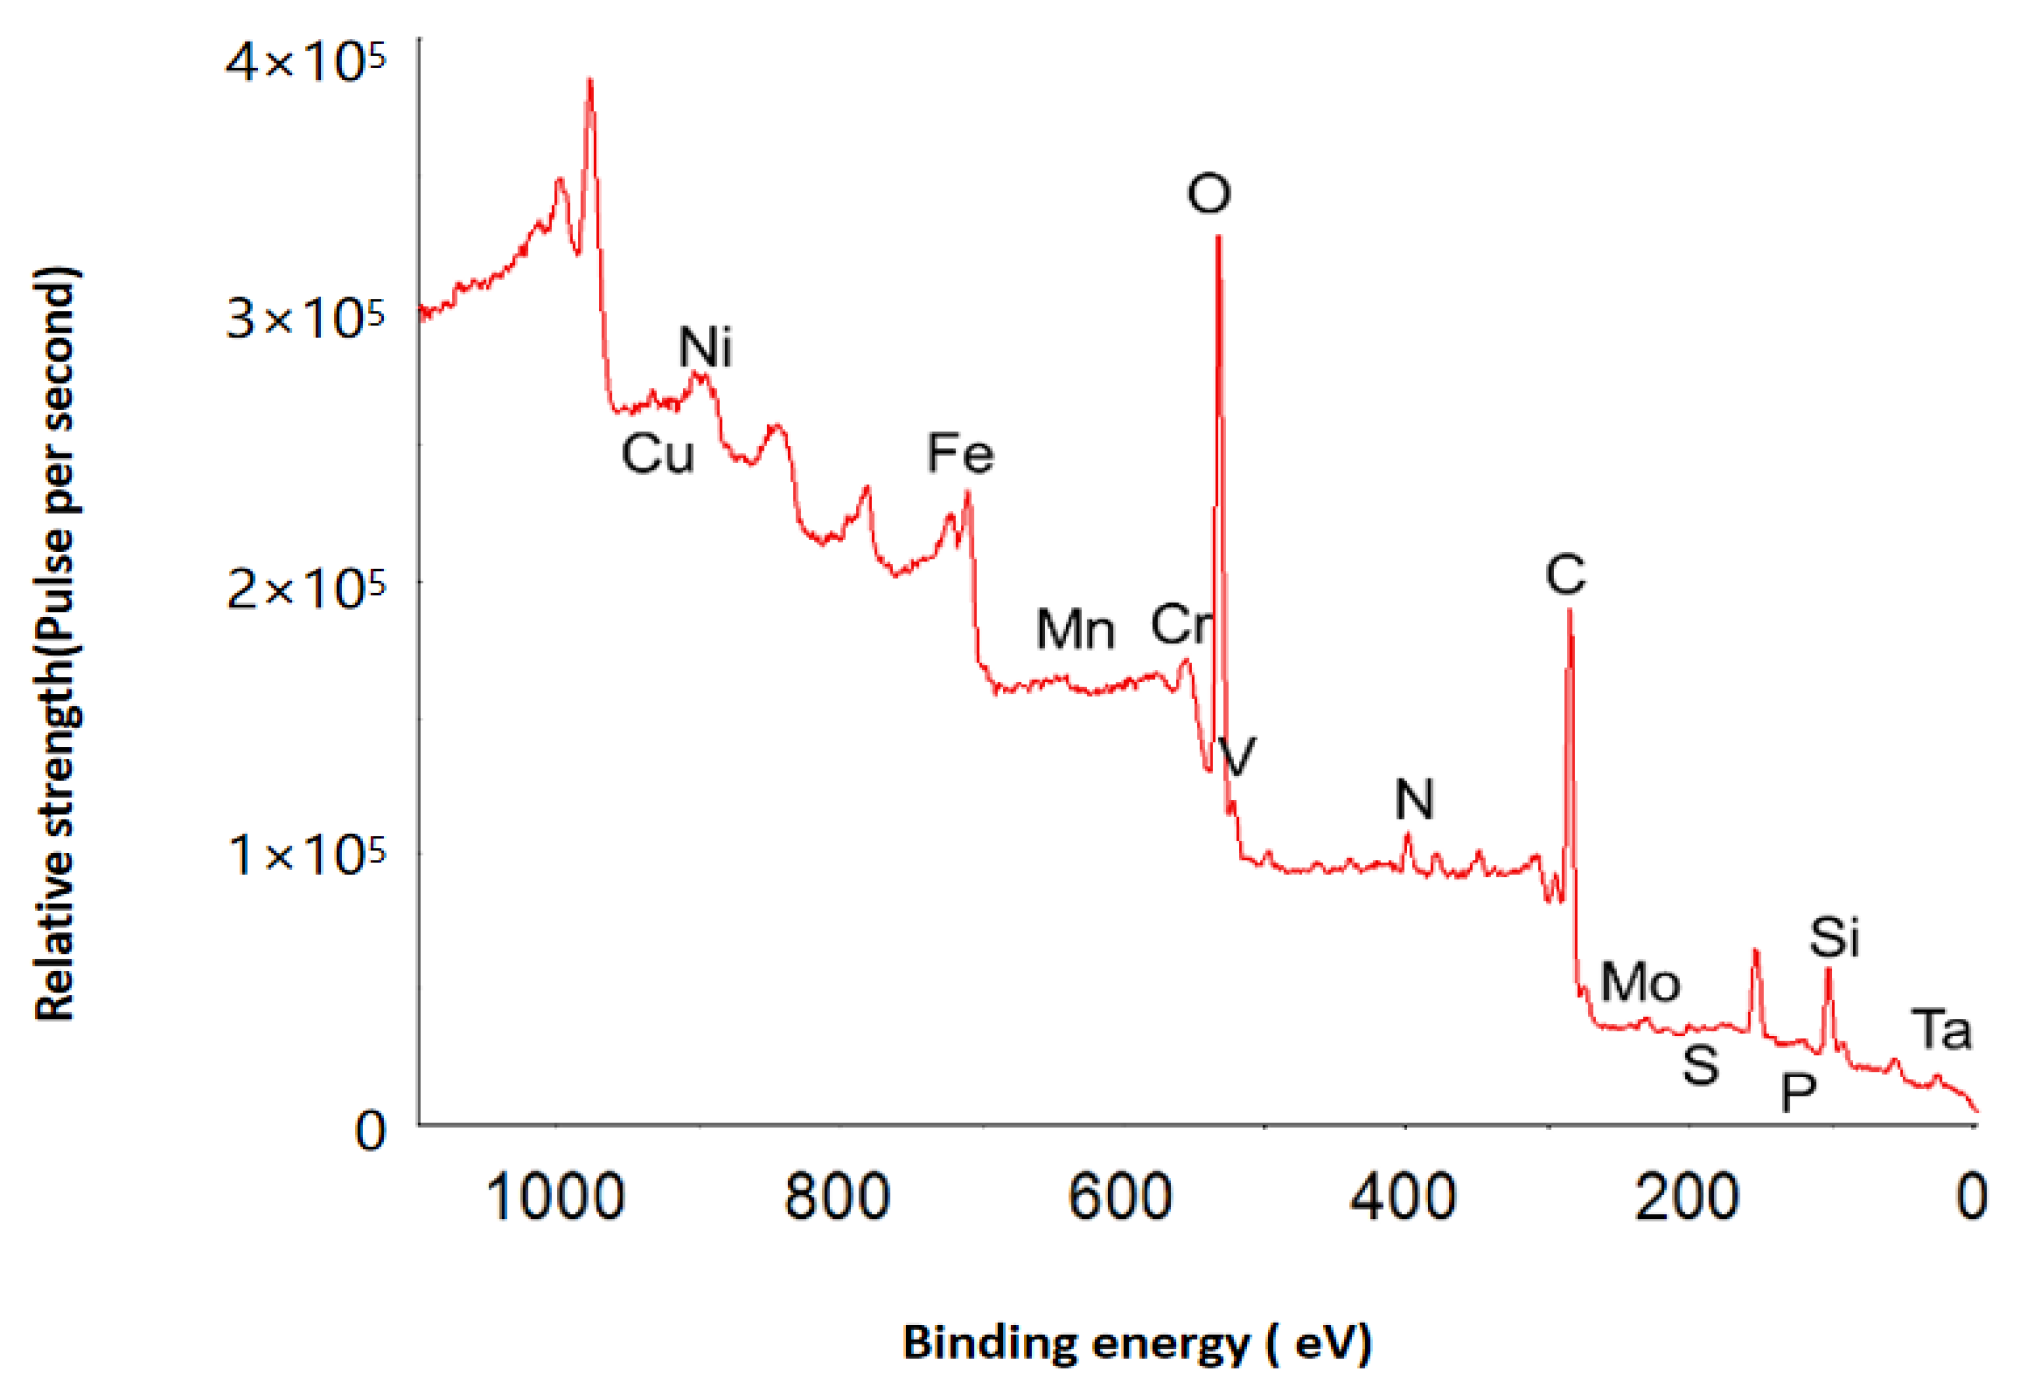
Surface Oxide Composition
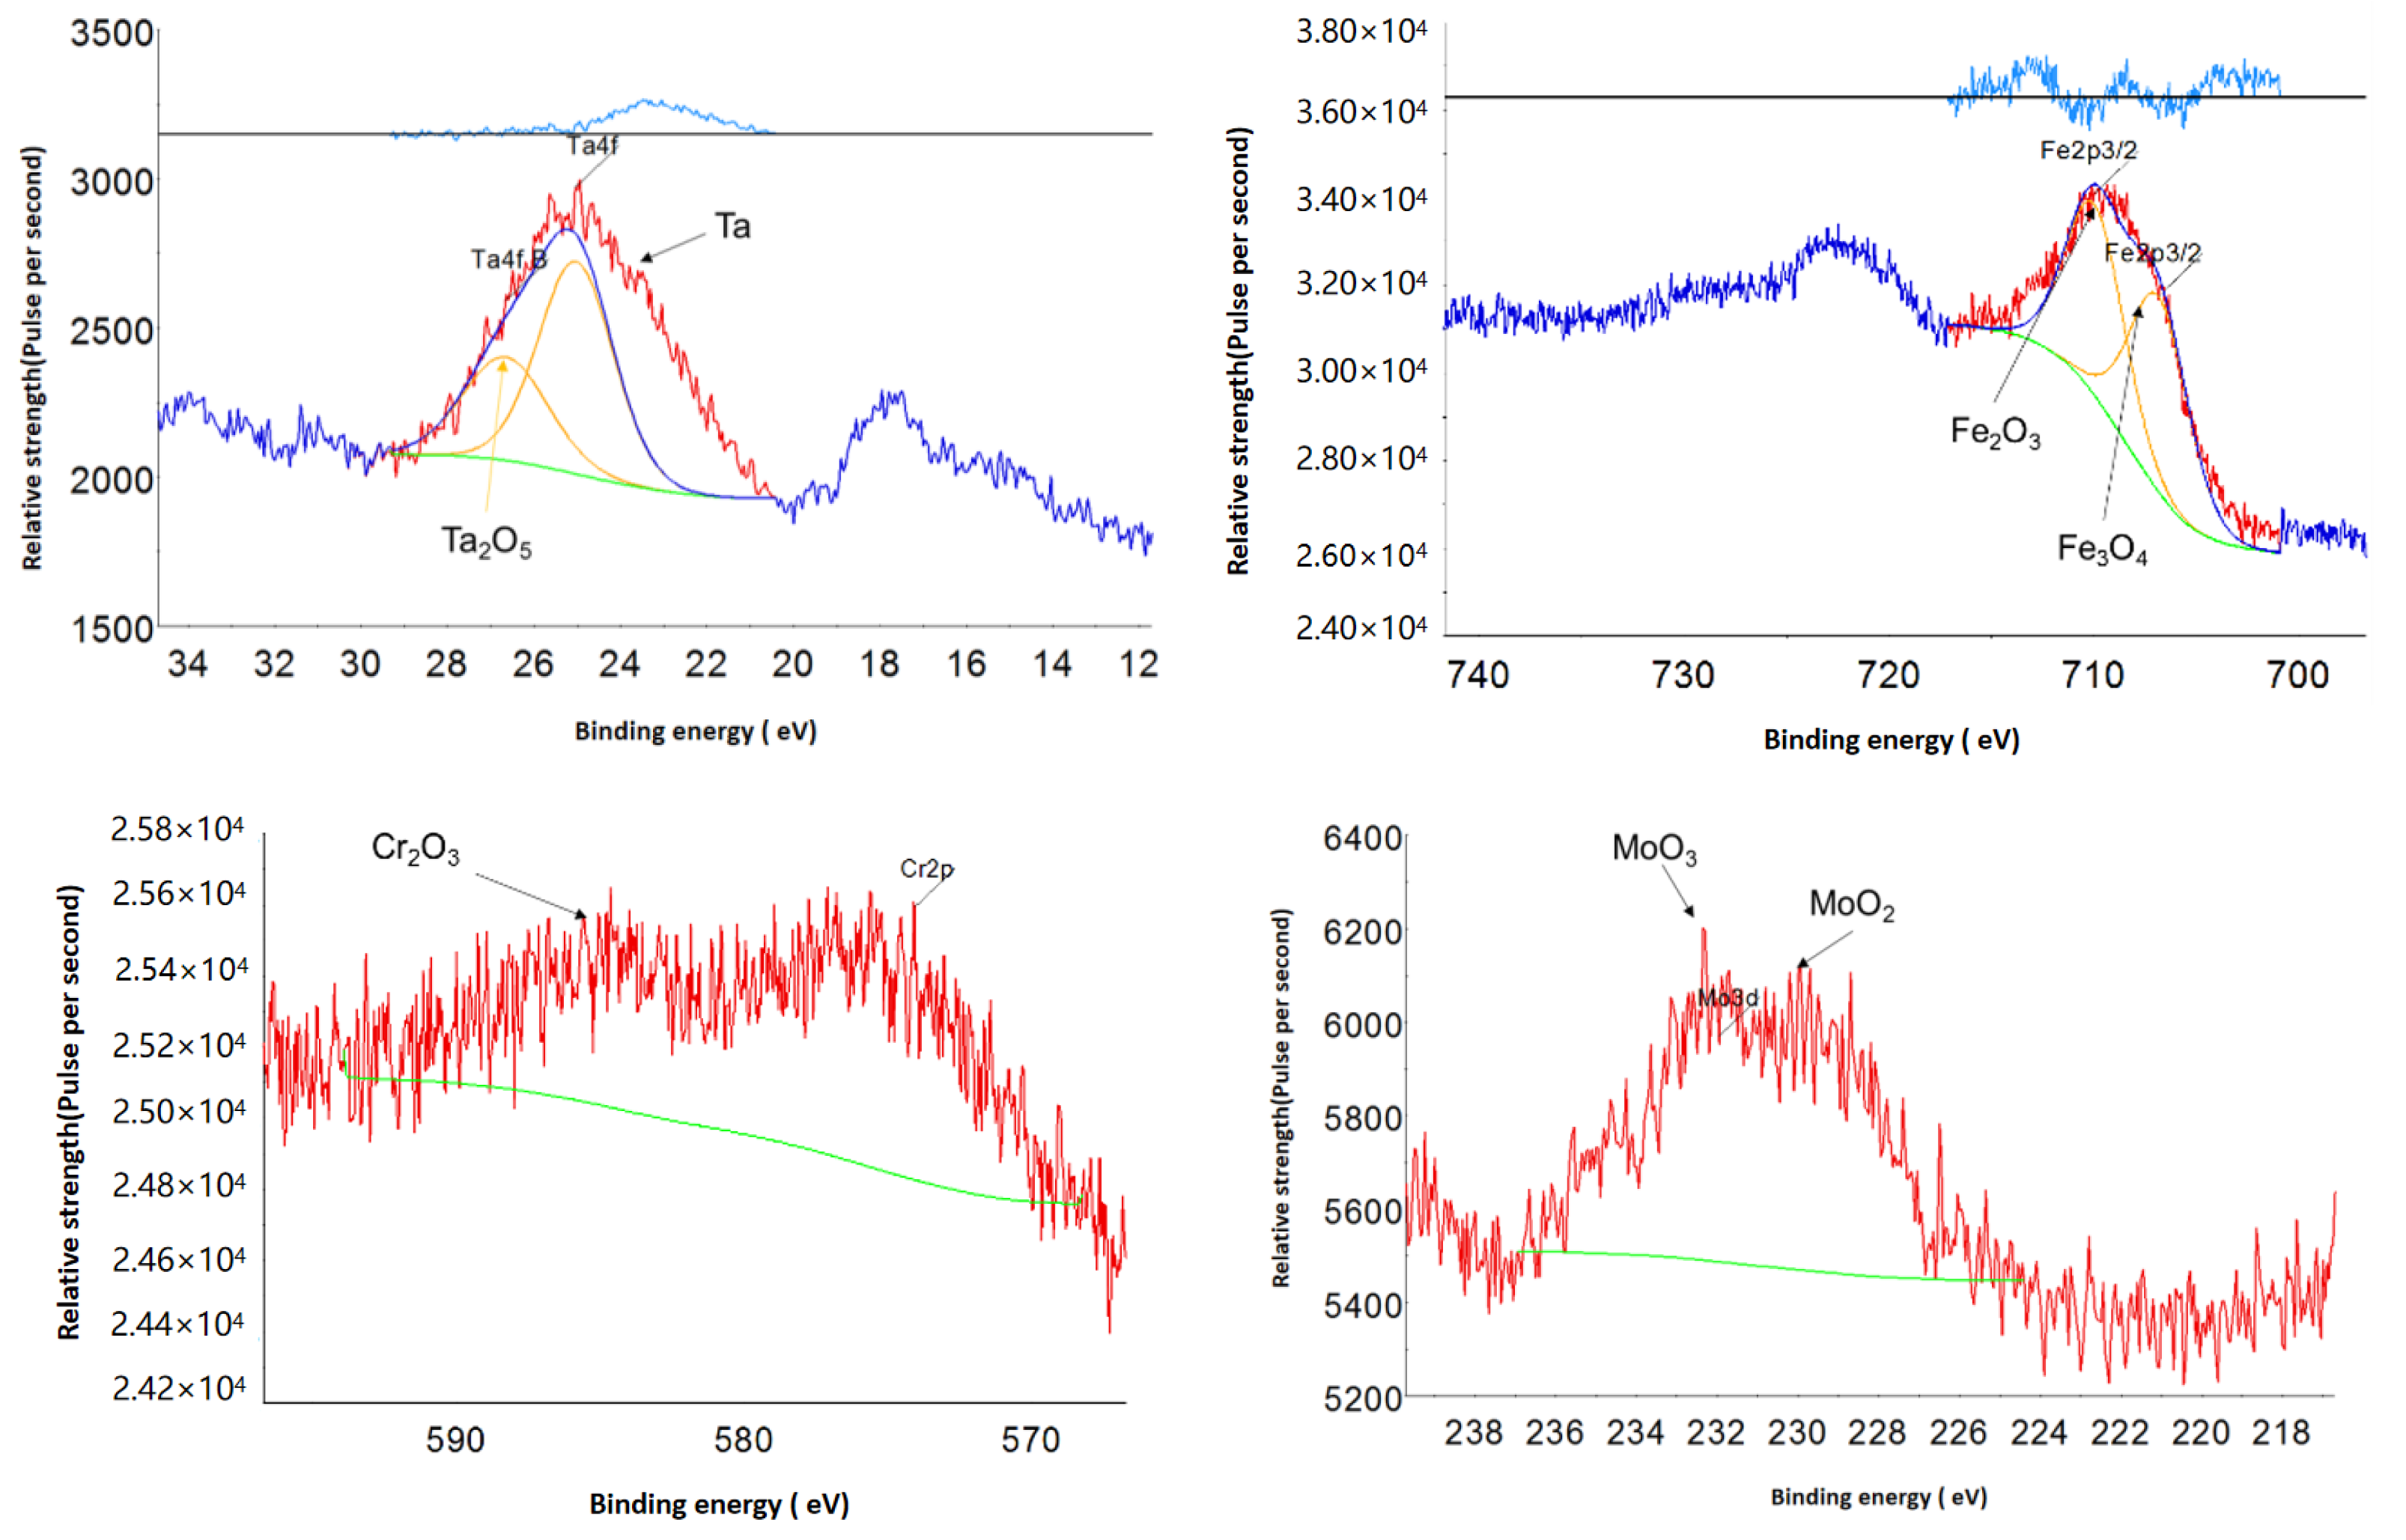
Surface Oxide Structure
2.2. Experimental Device and Principle
3. Experimental Result
3.1. Metallographic Structure
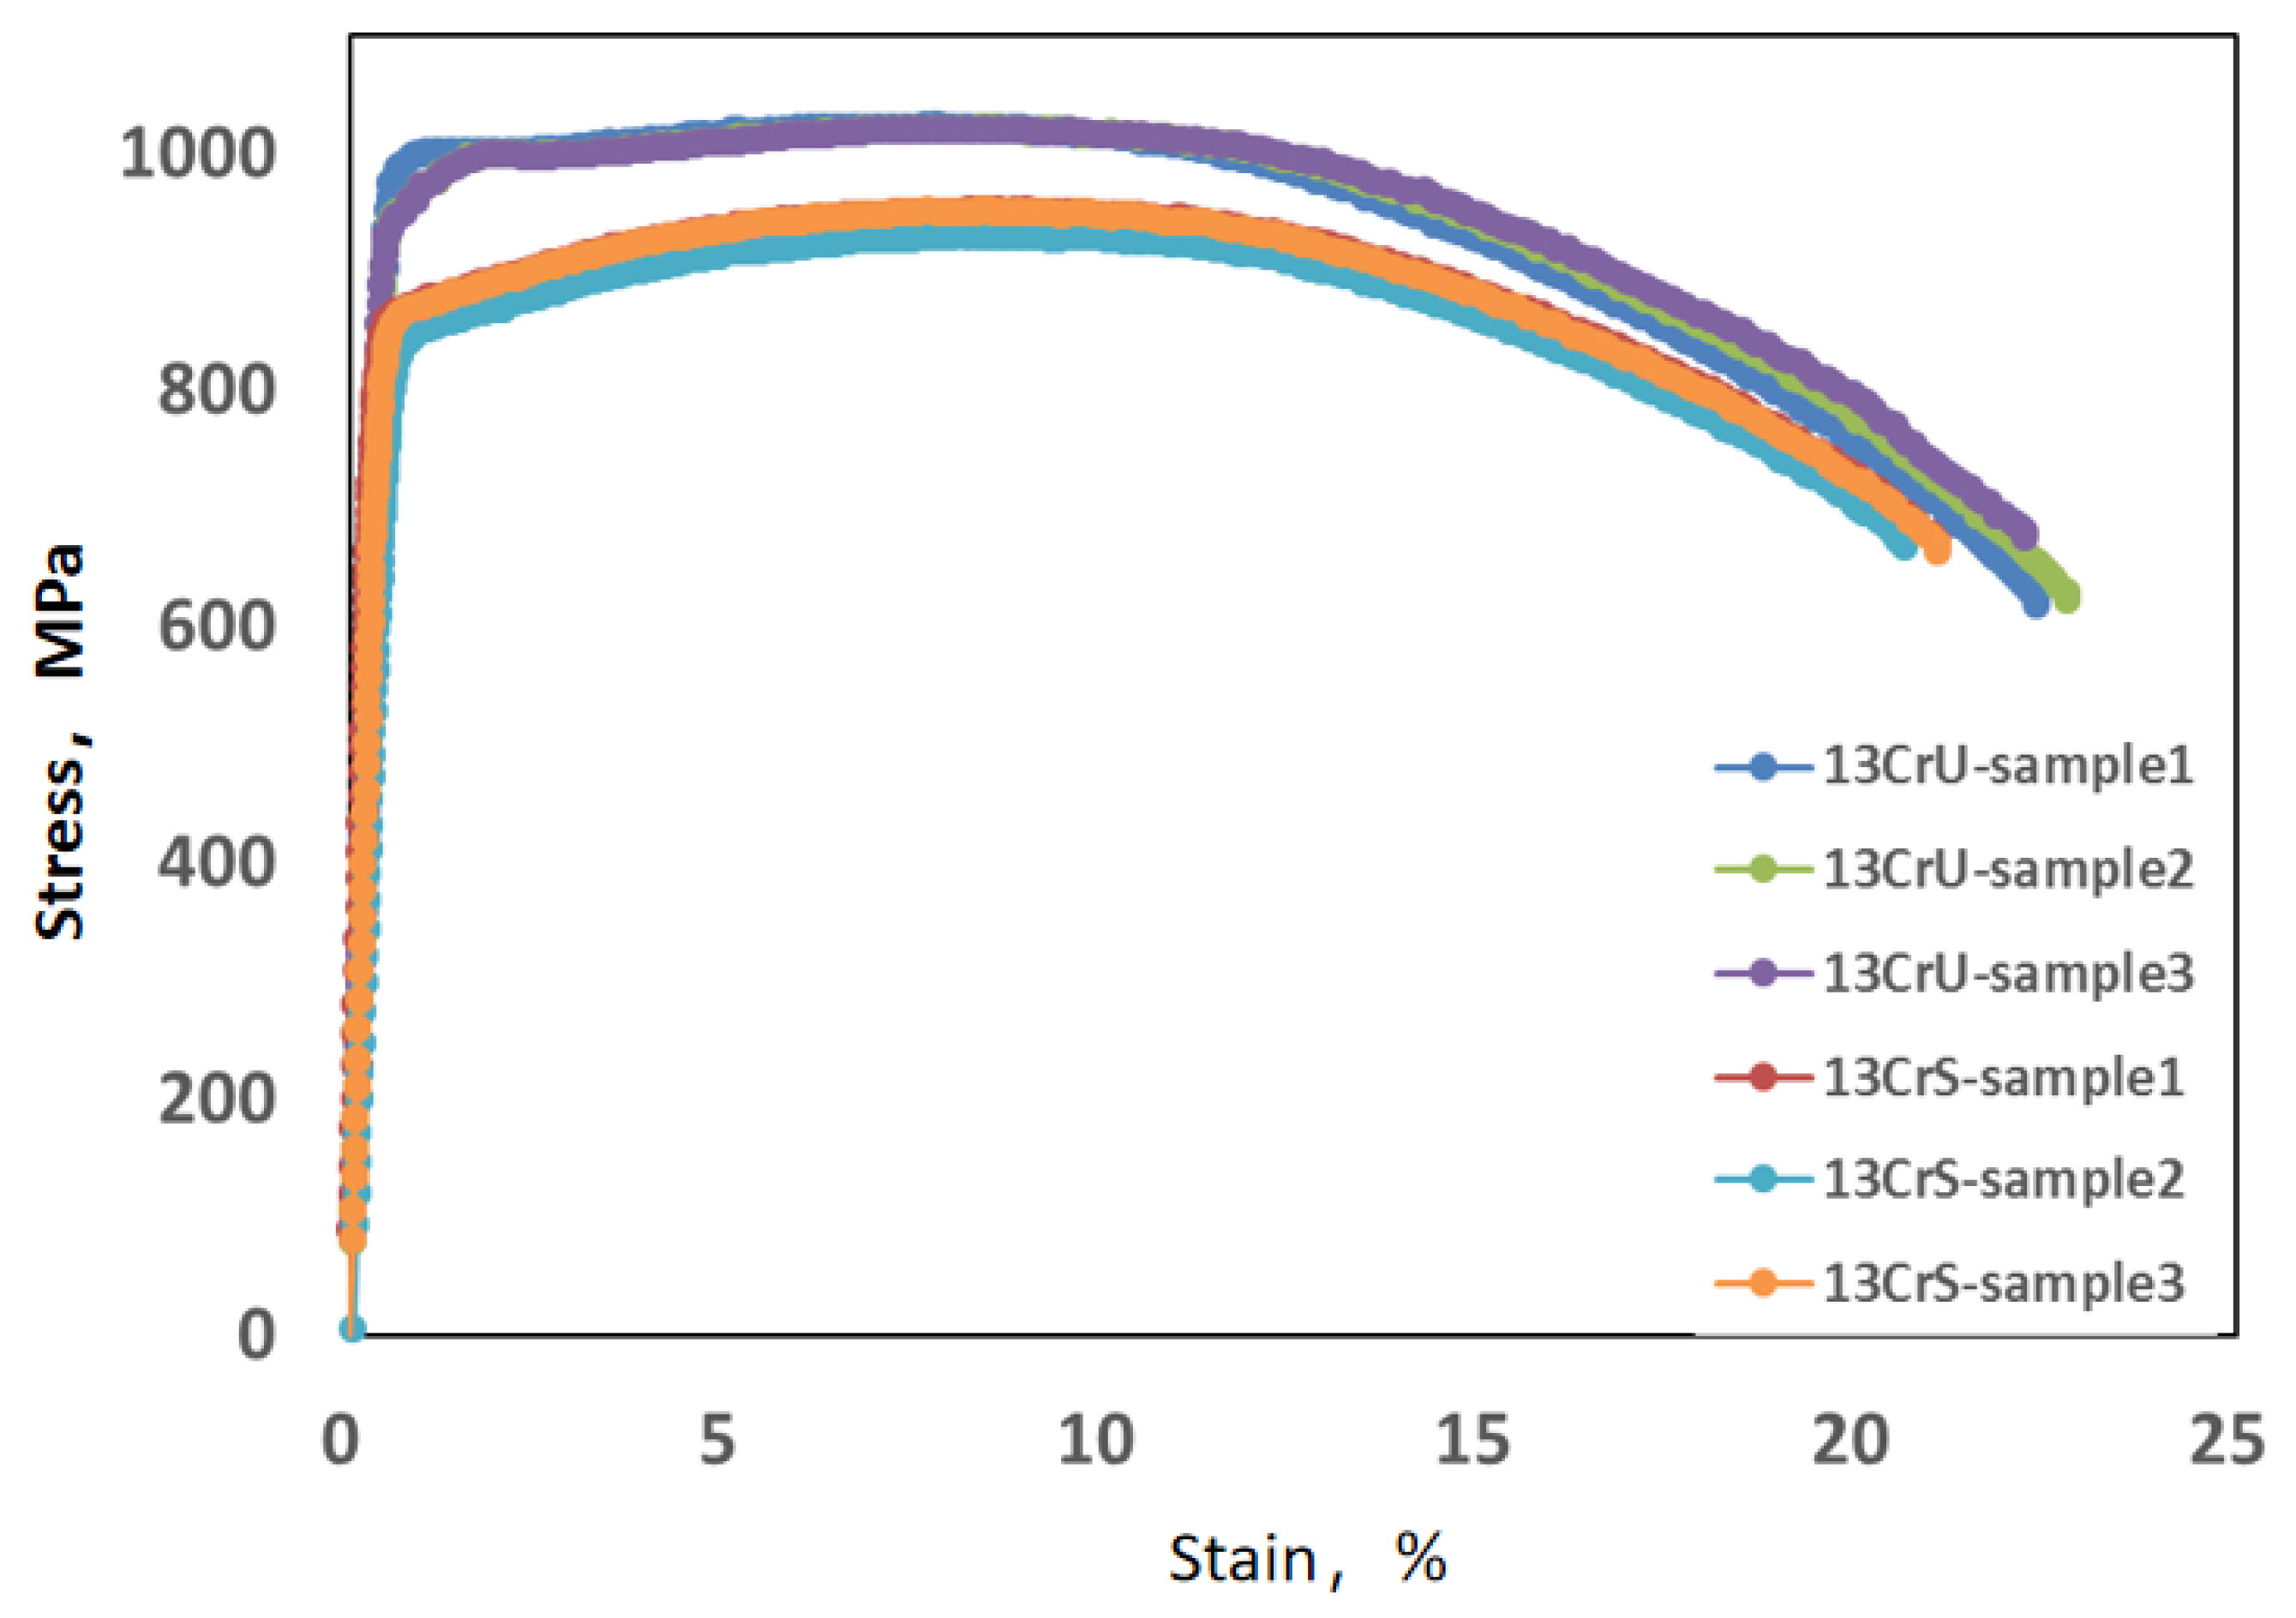
3.2. Tensile Mechanical Properties
| Materials | ID | Yield Strength Rp0.2 (MPa) | Experimental Bar (%) | Tensile Strength (MPa) | Experimental Bar (%) | Yield Ratio | Experimental Bar (%) | Elongation at Break δ (%) | Experimental Bar (%) | ||||
|---|---|---|---|---|---|---|---|---|---|---|---|---|---|
| Actual Measurement | Average | Actual Measurement | Average | / | Actual Measurement | Average | / | Actual Measurement | Average | / | |||
| 13CrS | 1# | 869.68 | 859 | 1.2 | 952.69 | 944 | 0.9 | 0.91 | 0.91 | 0.0 | 24.35 | 22.11 | 10.1 |
| 2# | 841.80 | −2.0 | 930.87 | −1.4 | 0.90 | −1.1 | 22.06 | −0.2 | |||||
| 3# | 867.32 | 1.0 | 951.05 | 0.7 | 0.91 | 0.0 | 19.92 | −9.9 | |||||
| 13CrU | 1# | 979.53 | 959 | 2.1 | 1023.10 | 1021 | 0.2 | 0.96 | 0.97 | −1.0 | 22.34 | 22.43 | −0.4 |
| 2# | 950.53 | −0.9 | 1020.80 | 0.0 | 0.97 | 6.6 | 22.76 | 1.5 | |||||
| 3# | 945.56 | −1.4 | 1020.12 | −0.1 | 0.97 | 6.6 | 22.19 | −1.1 | |||||
| ISO 13680 | 758~965 | / | ≥793 | / | — | / | ≥12.5 | / | |||||
| SY/T 5525-2009 [27] | ≥689 | / | ≥931 | / | — | / | ≥13 | / | |||||
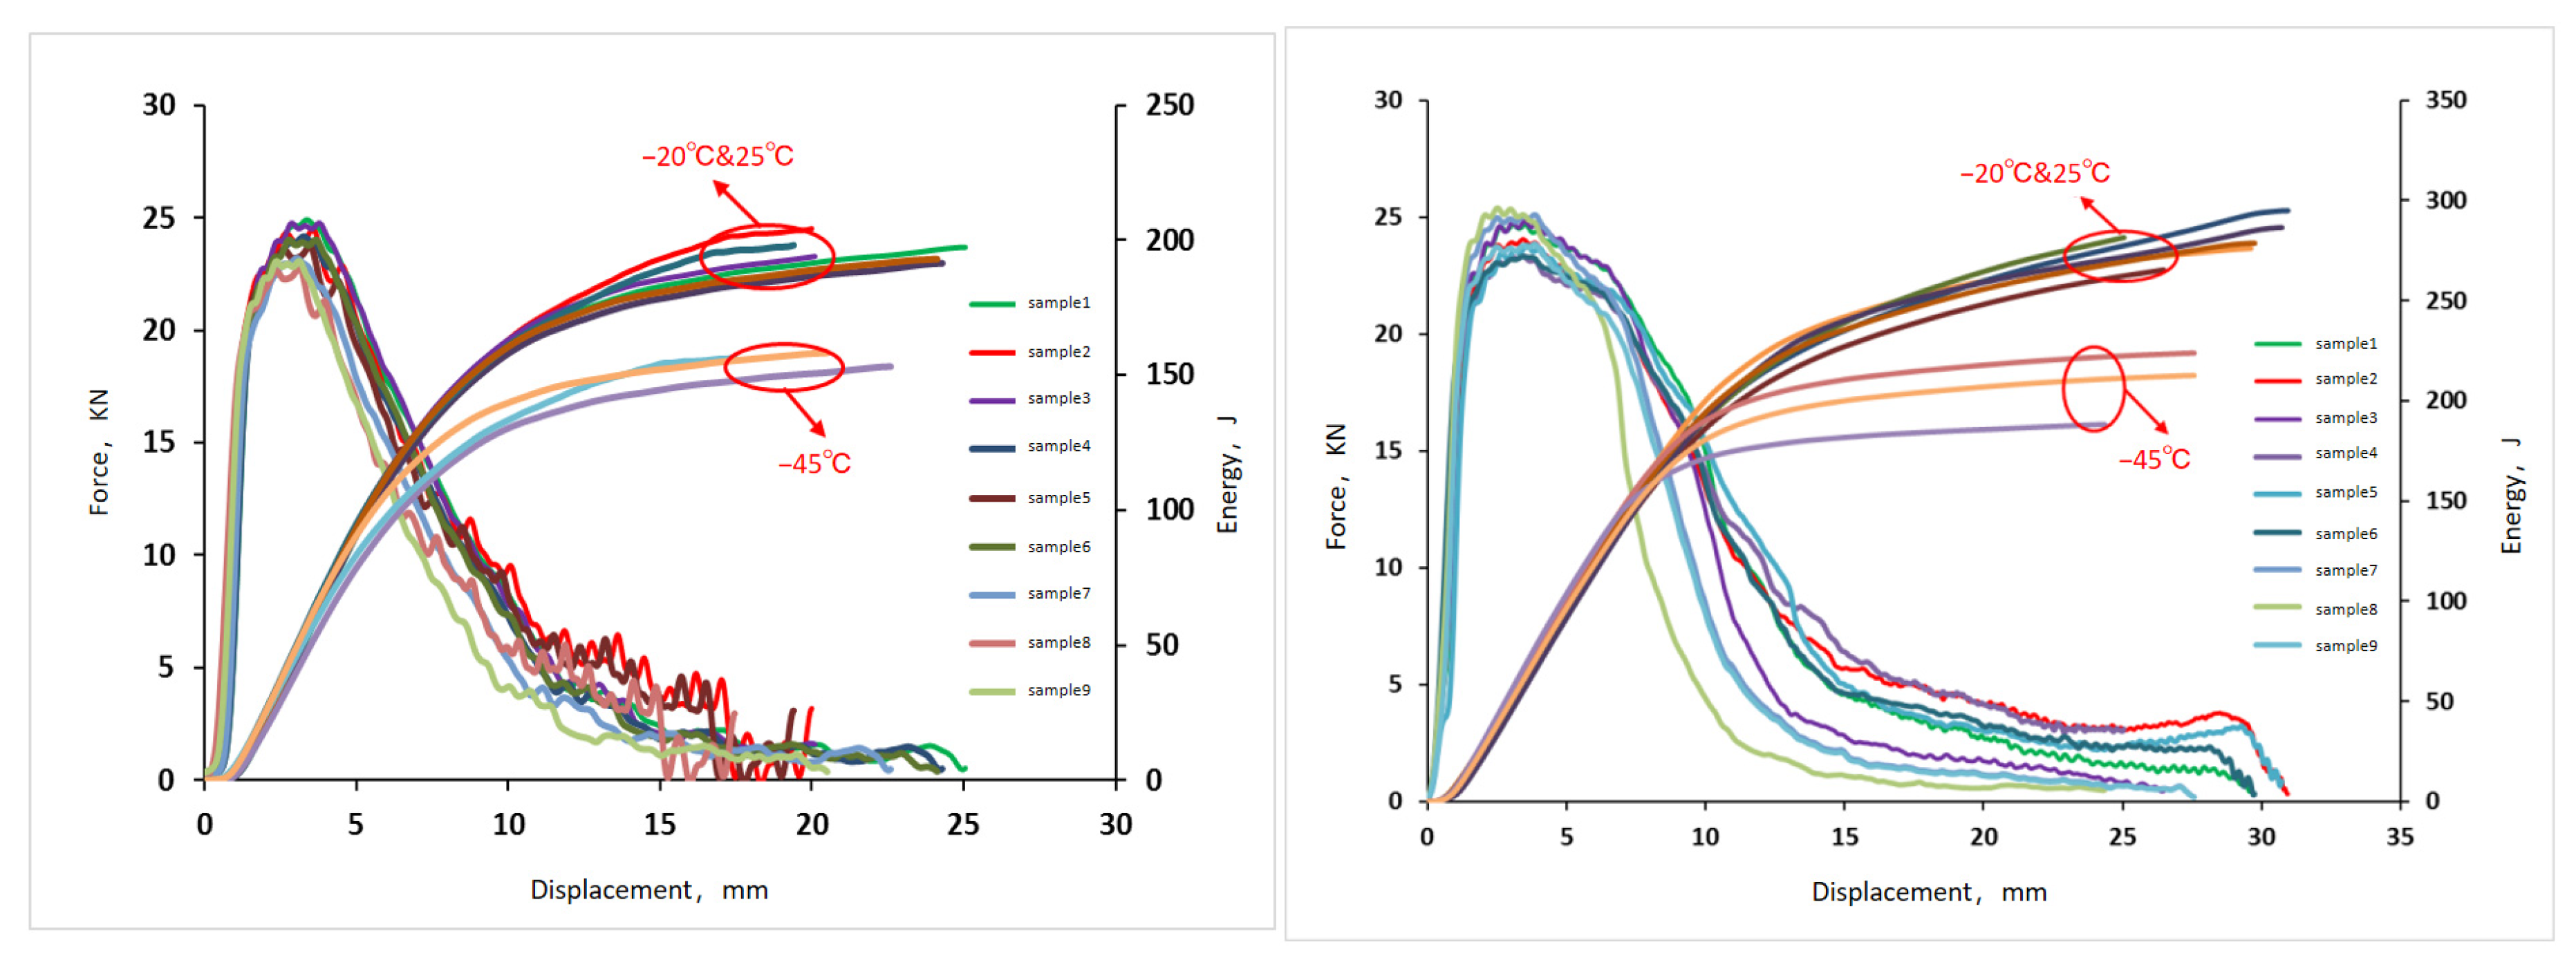
3.3. Impact Fracture Toughness
3.4. HB
3.5. Pitting Resistance
3.6. CO2 Corrosion Test
4. Analysis and Discussion
- (1)
- Improving the microstructure of stainless steel, enhancing structural stability, and reducing or eliminating inhomogeneity;
- (2)
- Promoting the formation and stability of the stainless steel passivation film;
- (3)
- Increasing the electrode potential of stainless steel;
- (4)
- Balancing or mitigating the adverse effects of carbon on corrosion resistance;
- (5)
- Strengthening the stainless steel matrix, thus improving its mechanical properties;
- (6)
- Enhancing the cold and hot workability of the material.
5. Conclusions
Author Contributions
Funding
Data Availability Statement
Conflicts of Interest
References
- API SPECIFICATION 5CT; Casing and Tubing. American Petroleum Institute: Washington, DC, USA, 2024.
- Liu, Y.R.; Dong, Y.; Jun, X.; Jiang, W.; Zhou, Y.-H.; Liu, X.; Li, J.; Su, J.; Yong, Q.-L.; Zhao, K.-Y. Microstructure of 13Cr super martensitic stainless steel. Trans. Mater. Heat Treat. 2011, 32, 66–71. [Google Scholar]
- Liu, Y.J.; Lu, X.H.; Zhao, G.X.; Chen, C.F.; Xue, Y. Corrosion Behaviors of Super 13Cr Martensitic Stainless Steel Under Drilling and Completion Fluids Environment. J. Mater. Eng. 2012, 2, 17–21. [Google Scholar]
- Zhang, Z.; Zheng, Y.; Li, J.; Liu, W.; Liu, M.; Gao, W.; Shi, T. Stress corrosion crack evaluation of super 13Cr tubing in high-temperature and high-pressure gas wells. Eng. Fail. Anal. 2019, 95, 263–272. [Google Scholar] [CrossRef]
- Ma, X.P.; Wang, L.J.; Liu, C.M.; Subramanian, S. Microstructure and properties of 13Cr5Ni1Mo0.025Nb0.09V0.06N super martensitic stainless steel. Mater. Sci. Eng. A 2012, 539, 271–279. [Google Scholar] [CrossRef]
- Wang, P.; Lu, S.P.; Xiao, N.M.; Li, D.; Li, Y. Effect of delta ferrite on impact properties of low carbon 13Cr–4Ni martensitic stainless steel. Mater. Sci. Eng. A 2010, 527, 3210–3216. [Google Scholar] [CrossRef]
- Thursdiyanto, V.; Bae, E.J.; Baek, E.R. Effect of Ni Contents on the Microstructure and Mechanical Properties of Martensitic Stainless Steel Guide Roll by Centrifugal Casting. J. Mater. Sci. Technol. 2008, 24, 343–346. [Google Scholar]
- Ma, X.; Subramanian, S.V.; Liu, C. Studies on Nb Microalloying of 13Cr Super Martensitic Stainless Steel. Metall. Mater. Trans. A 2012, 43, 4475–4486. [Google Scholar] [CrossRef]
- Yong, L.; Huang, J.; Jin, Z.; Zhang, C.; Gao, W.; Zhao, C. Effect of 0.2 and 0.5% Ti on the microstructure and mechanical properties of 13Cr supermartensitic stainless steel. J. Mater. Eng. Perform. 2015, 24, 4253–4259. [Google Scholar]
- Xia, C. Optimization of Hot Rolling Post-Processing Heat Treatment for Martensitic Stainless Steel Cast Slabs and Study on Microstructure and Properties. Ph.D. Thesis, Xi’an Shiyou University, Xi’an, China, 2023. [Google Scholar]
- Lai, W.S.; Liu, B.X. Letter to the Editor: Lattice stability of some Ni-Ti alloy phases versus their chemical composition and disordering. J. Phys. Condens. Matter 2000, 12, L53. [Google Scholar] [CrossRef]
- Michler, T.; Naumann, J.; Sattler, E. Influence of copper as an alloying element on hydrogen environment embrittlement of austenitic stainless steel. Int. J. Hydrog. Energy 2012, 37, 12765–12770. [Google Scholar] [CrossRef]
- Ru, L.; Gang, Y.; Wang, J.; Yang, M. Effect of Alloy Element on Microstructure and Mechanical Properties of 0Cr17Ni4Cu4Nb Stainless Steel—Nickel (4). Spec. Steel Technol. 2011, 17, 12–17+37. [Google Scholar]
- Seo, M.; Hultquist, G.; Leygraf, C.; Sato, N. The influence of minor alloying elements (Nb, Ti and Cu) on the corrosion resistivity of ferritic stainless steel in sulfuric acid solution. Corros. Sci. 1986, 26, 949+957–955+960. [Google Scholar] [CrossRef]
- Zhao, Z. Guide for Oil and Gas Well Corrosion Protection and Material Selection; Oil Industry Press: Tulsa, OK, USA, 2011; p. 7714. [Google Scholar]
- GB/T 13298; Methods for the Examination of Microstructures of Metals. China Standard Press: Beijing, China, 2015.
- GB/T228.1; Tensile Tests for Metallic Materials—Part 1 Test Method at Room Temperature. China Standard Press: Beijing, China, 2010.
- ISO 11960; Petroleum and Natural Gas Industries—Steel Pipes for Use As Casing or Tubing for Wells. International Organization for Standardization: Geneva, Switzerland, 2014.
- GB/T 19748; Charpy V notched Pendulum Impact Test of Steel Instrument Test Method. China Standard Press: Beijing, China, 2005.
- GB/T 229; Metallic Materials—Charpy Pendulum Impact Test Method. China Standard Press: Beijing, China, 2007.
- GB231.1; Metal Cloth Hardness Test—Part 1 Test Method. China Standard Press: Beijing, China, 2002.
- GB/TGB/T 17899; Stainless Steel Pitting Potential Measurement Method. China Standard Press: Beijing, China, 1999.
- GB 10124; Metal Materials Laboratory Uniform Corrosion Full Immersion Test Method. China Standard Press: Beijing, China, 1988.
- NACE_RP0775; Preparation, Installation, Analysis, and Interpretation of Corrosion Coupons in Oilfield Operations. NACE International: Houston, TX, USA, 2005.
- Lu, X.; Zhao, G.; Wang, Y.; Zhang, J.; Xie, K. SSC Resistance of Super 13Cr Martensitic Stainless Steel. J. Mater. Eng. 2011, 2, 17–21+25. [Google Scholar]
- Wells, A.A. Impact Strength of Materials. Metall. Rev. 1974, 17, 264–265. [Google Scholar] [CrossRef]
- SYT5525; Rotary Drilling Equipment Upper and Lower Kelly Cock Valves. National Standard Information Public Service Platform: Beijing, China, 2009.
- Zhao, Y.H.; Zhao, C.Z.; Wang, J.N.; Jiang, C.Y.; Yuan, Y.P. Forming Mechanism of δ-Ferrite and Its Effect on Martensite Heat-Resistant Steel Impact Energy. Iron Steel 2013, 48, 70–75. [Google Scholar]
- ISO 13680:2010; Petroleum and Natural Gas Industries—Corrosion-Resistant Alloy Seamless Tubes for Use as Casing, Tubing and Coupling Stock—Technical Delivery Conditions. International Organization for Standardization: Geneva, Switzerland, 2010.
- Ling, H.; Wei, B. Determination of critical pitting potential and its applciation. J. Chin. Soc. Corros. Prot. 1989, 9, 50–53. [Google Scholar]
- Zhang, X.; Gao, M.; Xu, Z.; Wang, Y.; Bi, F.Q. Effect of Ni, Mo and Cu Addition on Microstructure and CO2 Corrosion Resistance of 13Cr Stainless Steel. J. Mater. Eng. 2013, 3, 36–41. [Google Scholar]
- Voznesenskaya, N.M.; Kablov, E.N.; Petrakov, A.F.; Shal’Kevich, A.B. Highstrength corrosion-resistant steels of the austenitic-martensitic class. Met. Sci. Heat Treat. 2002, 44, 300. [Google Scholar] [CrossRef]
- Liu, T.; Chen, L.; Bi, H.; Che, X. Effect of Mo on High-Temperature Fatigue Behavior of 15CrNbTi Ferritic Stainless Steel. Acta Metall. Sin. 2014, 27, 452–456. [Google Scholar] [CrossRef]
- Lang, Y.; Chen, H. Corrosion resistance in stainless steel of Mo. In Proceedings of the National Annual Conference on Corrosion Resistant Metal Materials, Chengdu, China, October 2010. [Google Scholar]
- Zhao, H.C.; Ren, Y.B.; Dong, J.H.; Fan, X.-M.; Yang, K. Effect of Cold Deformation on the Friction–Wear Property of a Biomedical Nickel-Free High-Nitrogen Stainless Steel. Acta Metall. Sin. 2016, 29, 217–227. [Google Scholar] [CrossRef]
- Yi, B. Effect of nickel content on the properties of 13Cr low carbon martensite stainless steel. Met. Funct. Mater. 1997, 2, 75–78. [Google Scholar]
- Bronkhorst, C.A.; Cerreta, E.; Xue, Q.; Maudlin, P.; Mason, T.; Gray, G. An experimental and numerical study of the localization behavior of tantalum and stainless steel. Int. J. Plast. 2006, 22, 1304–1335. [Google Scholar] [CrossRef]
- Macionczyk, F.; Gerold, B.; Thull, R. Repassivating tantalum/tantalum oxide surface modification on stainless steel implants. Surf. Coat. Technol. 2001, 142, 1084–1087. [Google Scholar] [CrossRef]


| Experimental Material | 13CrS | 13CrU | API | |
|---|---|---|---|---|
| Element Composition | ||||
| C | 0.02 | 0.016 | - | |
| Si | 0.24 | 0.24 | - | |
| Mn | 0.41 | 0.3 | - | |
| P | 0.016 | 0.011 | ≤0.03 | |
| S | 0.001 | 0.001 | ≤0.03 | |
| Cr | 12.76 | 12.85 | - | |
| Mo | 2.16 | 2.83 | - | |
| Ni | 5.29 | 6.42 | - | |
| Ti | 0.016 | 0.01 | - | |
| Nb | 0.03 | 0.03 | - | |
| Cu | 0.05 | 0.16 | - | |
| V | 0.012 | 0.04 | - | |
| Al | 0.032 | 0.04 | - | |
| Ta | N.A. | 0.03 | - | |
| Sort | Uniform Corrosion Rate (mm/a) | Pitting Rate (mm/a) |
|---|---|---|
| Mild corrosion | <0.025 | <0.127 |
| Moderate corrosion | 0.025~0.125 | 0.127~0.201 |
| Severe corrosion | 0.126~0.254 | 0.202~0.381 |
| Very severe corrosion | >0.254 | >0.381 |
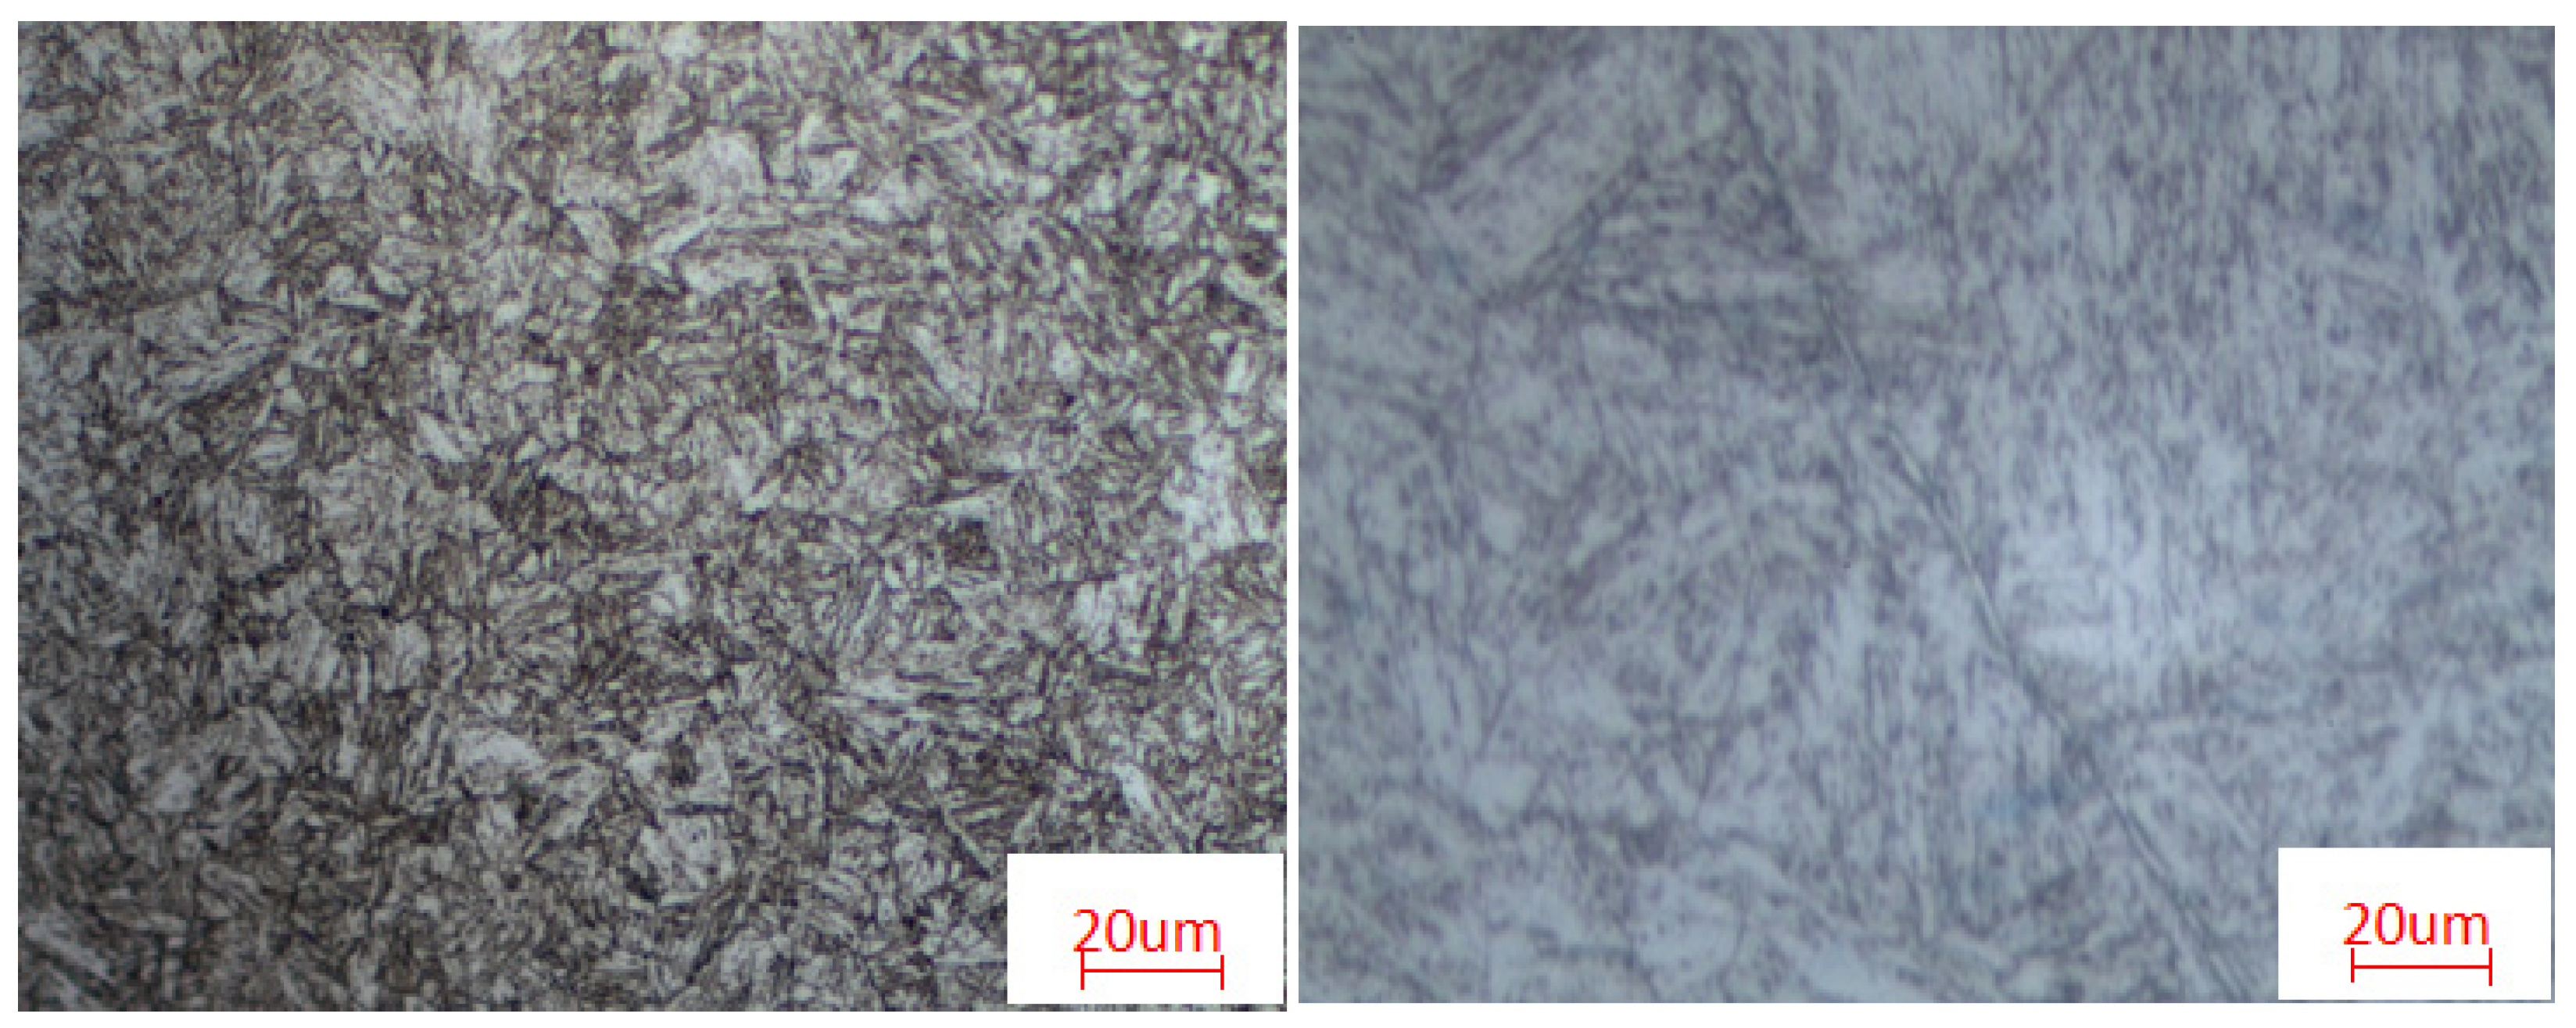
| Test Item | Nonmetal Inclusion | Metallographic Structure | The Diameter of the Average Grain Section/µm | Grain Size | |
|---|---|---|---|---|---|
| Materials | |||||
| 13CrS | D1 fine series (Lv. 0.5) | Tempered martensite with retained austenite and a small amount of granular ferrite. | 22.15 | Lv. 8 | |
| 13CrU | D1 fine series (Lv. 0.5) | Tempered sorbite and a very small amount of δ ferrite | 46.38 | Lv. 6 | |
| Temperature (°C) | ID | Impact Work/Wt (J) | Total Displacement/St (mm) | Maximum Force/Fm (kN) | Yield Force/Fgy (KN) | Crack Initiation Work/Wm (J) | Crack Propagation Work/Wa (J) |
|---|---|---|---|---|---|---|---|
| 25 | 1 | 197.34 | 24.96 | 24.90 | 19.04 | 52.12 | 145.22 |
| 2 | 201.58 | 17.47 | 24.46 | 19.18 | 62.54 | 139.04 | |
| 3 | 199.04 | 25.15 | 24.76 | 19.20 | 64.60 | 134.44 | |
| Average | 199.32 | 22.53 | 24.70 | 19.14 | 59.76 | 139.56 | |
| −20 | 1 | 191.42 | 24.21 | 24.16 | 18.46 | 50.56 | 140.86 |
| 2 | 195.54 | 16.95 | 23.72 | 18.60 | 60.66 | 134.86 | |
| 3 | 193.06 | 24.40 | 24.02 | 18.62 | 62.66 | 130.40 | |
| Average | 193.34 | 21.85 | 23.96 | 18.56 | 57.96 | 135.38 | |
| −45 | 1 | 157.88 | 19.97 | 19.92 | 15.24 | 41.70 | 116.18 |
| 2 | 161.26 | 13.98 | 19.56 | 15.34 | 50.04 | 111.24 | |
| 3 | 159.24 | 20.12 | 19.80 | 15.36 | 51.68 | 107.56 | |
| Average | 159.46 | 18.02 | 19.76 | 15.32 | 47.80 | 111.66 |
| Temperature (°C) | ID | Impact Work/Wt (J) | Total Displacement/St (mm) | Maximum Force/Fm (kN) | Yield Force/Fgy (KN) | Crack Initiation Work/Wm (J) | Crack Propagation Work/Wa (J) |
|---|---|---|---|---|---|---|---|
| 25 | 1 | 296.63 | 30.58 | 23.34 | 17.88 | 59.29 | 237.34 |
| 2 | 286.90 | 31.28 | 23.79 | 17.03 | 58.44 | 228.46 | |
| 3 | 278.66 | 29.71 | 23.32 | 18.51 | 62.57 | 216.09 | |
| Average | 287.40 | 30.52 | 23.48 | 17.81 | 60.10 | 227.30 | |
| −20 | 1 | 276.00 | 29.57 | 24.67 | 18.43 | 61.81 | 214.19 |
| 2 | 294.90 | 30.93 | 24.05 | 18.03 | 59.80 | 235.10 | |
| 3 | 243.88 | 26.43 | 24.83 | 18.68 | 62.89 | 180.99 | |
| Average | 271.59 | 28.98 | 24.52 | 18.38 | 61.50 | 210.09 | |
| −45 | 1 | 223.81 | 27.51 | 25.11 | 19.10 | 73.95 | 149.86 |
| 2 | 188.20 | 24.29 | 25.39 | 20.32 | 42.88 | 145.32 | |
| 3 | 212.62 | 26.13 | 23.85 | 18.15 | 70.25 | 142.37 | |
| Average | 208.21 | 25.98 | 24.78 | 19.19 | 62.36 | 145.85 |
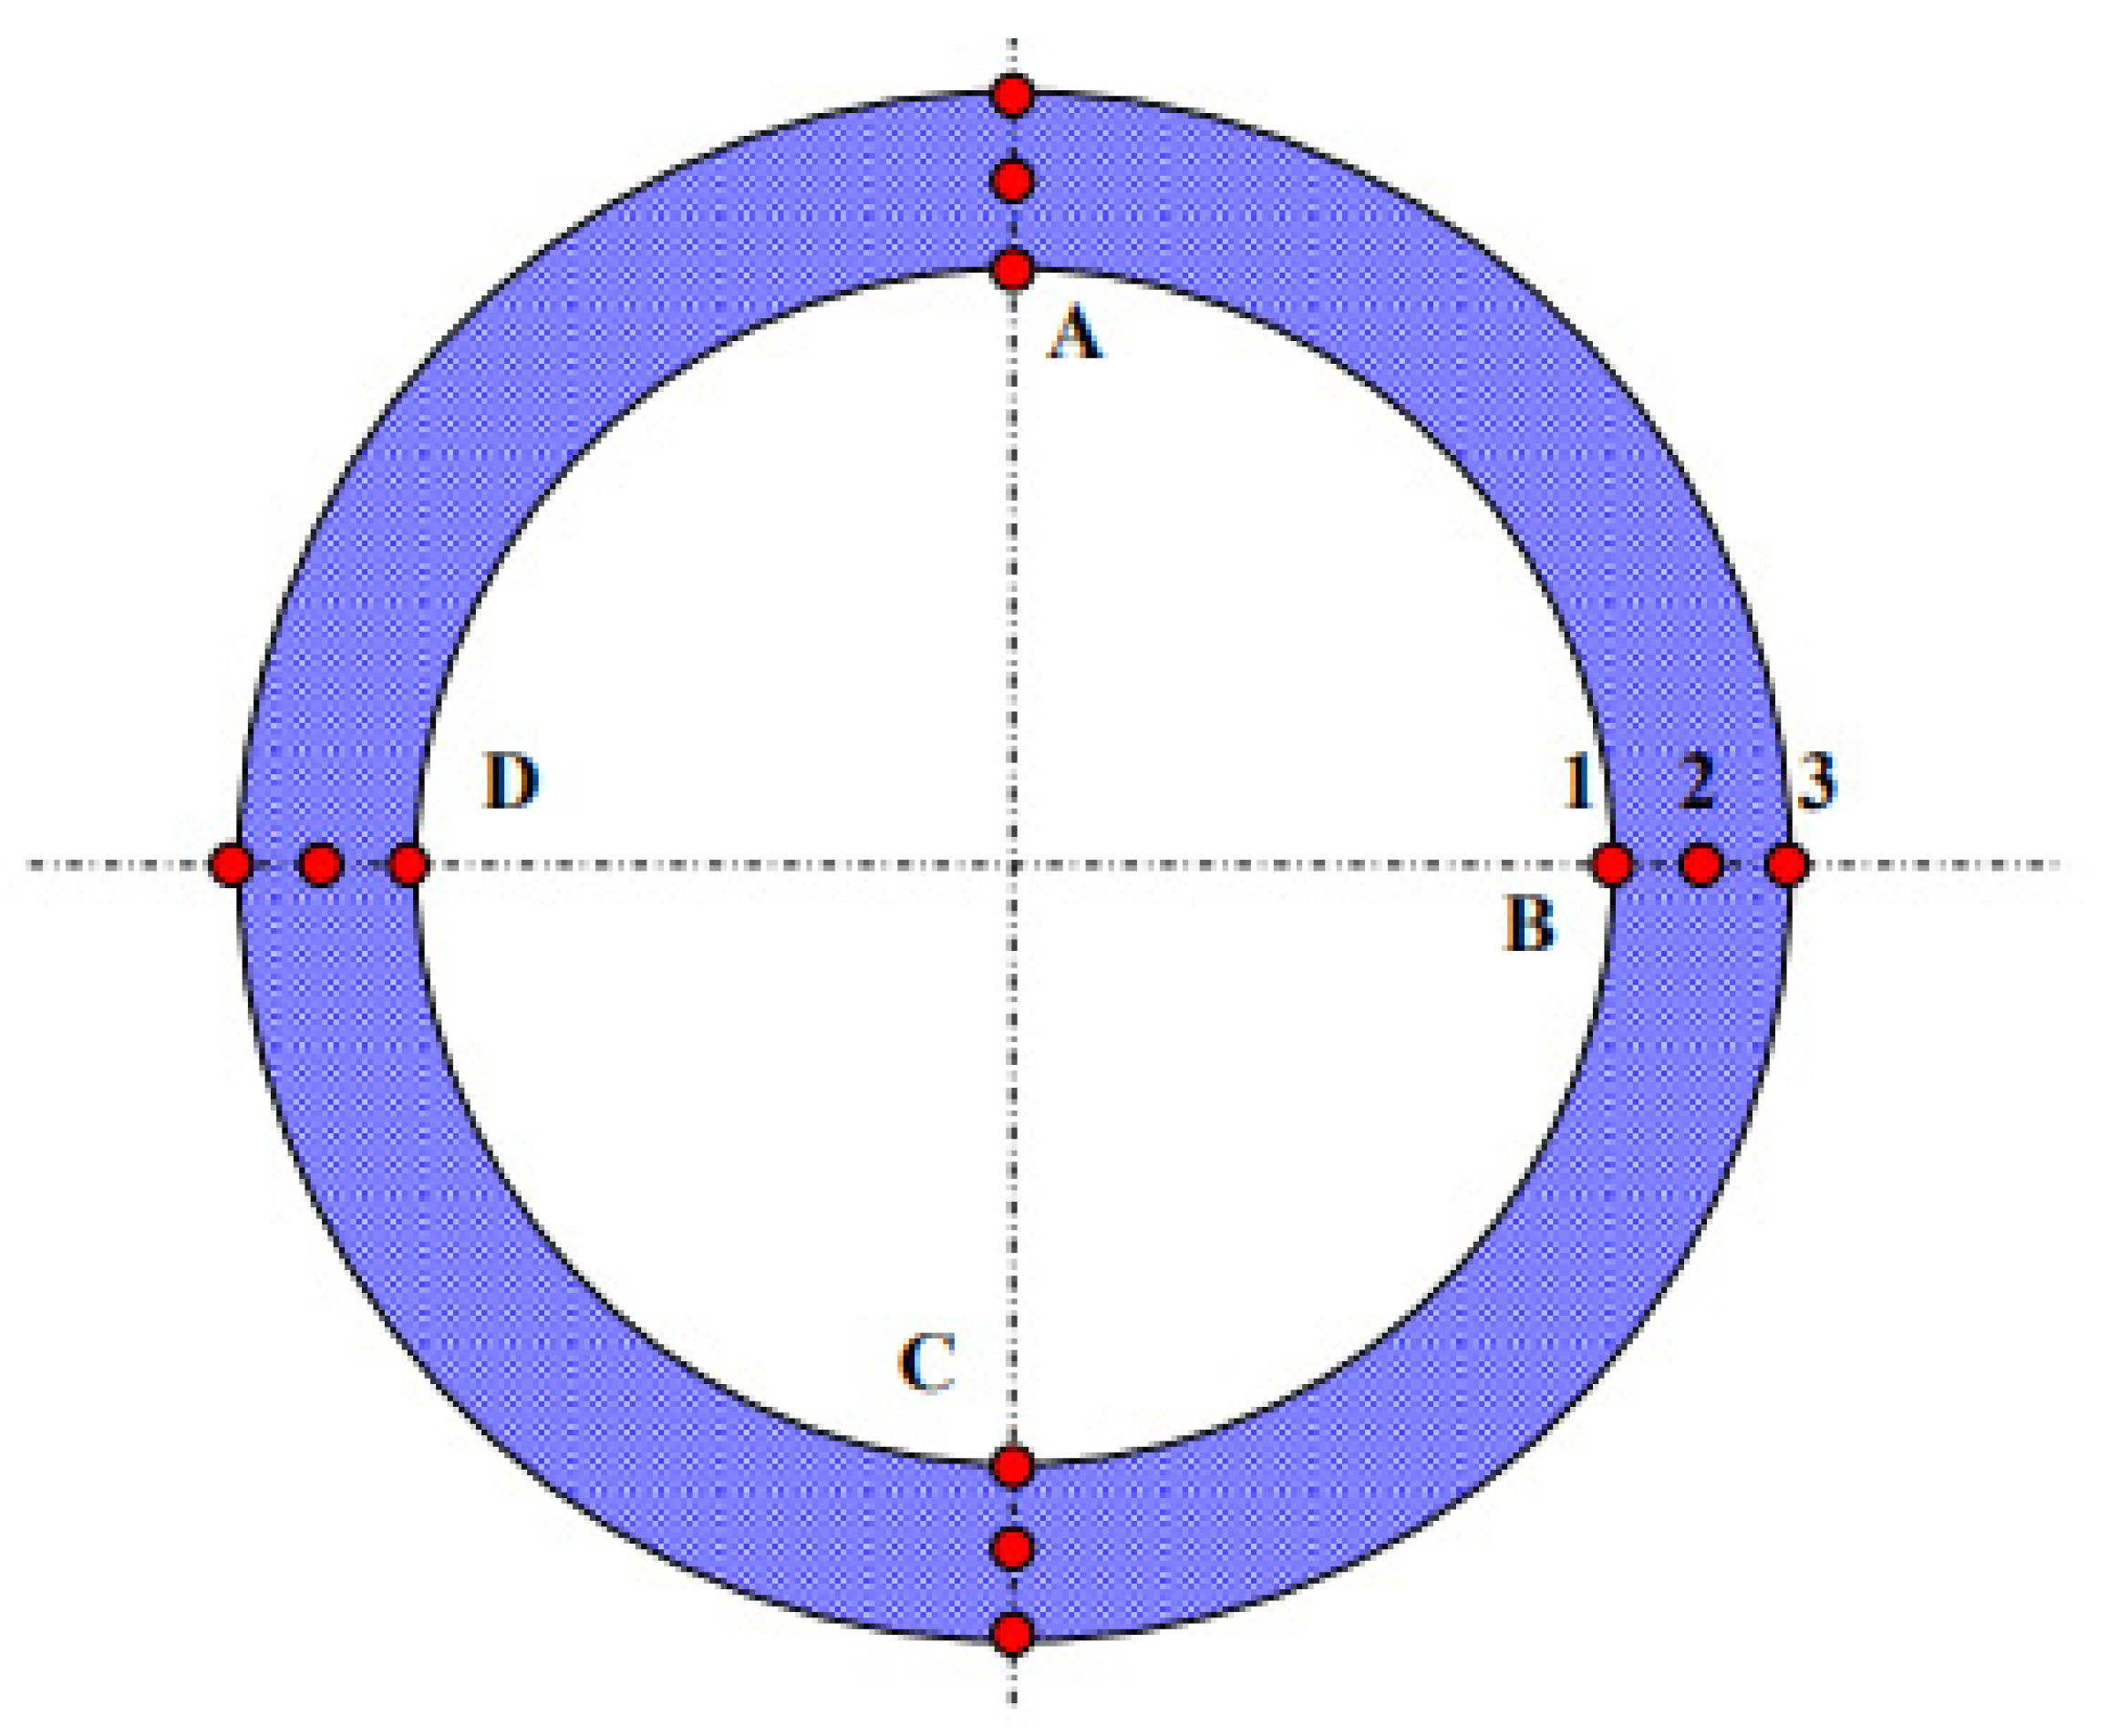
| Quadrant | Brinell Hardness (HB) Test Value | ||||||
|---|---|---|---|---|---|---|---|
| Test Location | Ⅰ | Ⅱ | Ⅲ | Ⅳ | Average | ||
| Materials | |||||||
| 13CrS | Close to outer wall | 266 | 270 | 265 | 260 | 265 | |
| Intermediate position | 268 | 266 | 269 | 263 | 267 | ||
| Close to wall | 268 | 268 | 265 | 261 | 266 | ||
| 13CrU | Close to outer wall | 294 | 328 | 336 | 366 | 331 | |
| Intermediate position | 298 | 324 | 343 | 362 | 332 | ||
| Close to wall | 301 | 324 | 350 | 356 | 333 | ||
| Experimental Temperature, °C | Materials | Corrosion Rate, mm/a |
|---|---|---|
| 150 | 13CrS | 0.16 |
| 13CrU | 0.02 | |
| 180 | 13CrS | 0.52 |
| 13CrU | 0.22 | |
| 220 | 13CrS | 1.95 |
| 13CrU | 1.45 |
Disclaimer/Publisher’s Note: The statements, opinions and data contained in all publications are solely those of the individual author(s) and contributor(s) and not of MDPI and/or the editor(s). MDPI and/or the editor(s) disclaim responsibility for any injury to people or property resulting from any ideas, methods, instructions or products referred to in the content. |
© 2024 by the authors. Licensee MDPI, Basel, Switzerland. This article is an open access article distributed under the terms and conditions of the Creative Commons Attribution (CC BY) license (https://creativecommons.org/licenses/by/4.0/).
Share and Cite
Sang, P.; Luo, W.; Li, W.; Wang, C.; Chen, Y.; Zhou, L.; Ma, Z.; Wang, D.; Duan, Y. A Novel Martensitic Stainless Steel Material for CO2 Corrosion Environment. Processes 2024, 12, 2912. https://doi.org/10.3390/pr12122912
Sang P, Luo W, Li W, Wang C, Chen Y, Zhou L, Ma Z, Wang D, Duan Y. A Novel Martensitic Stainless Steel Material for CO2 Corrosion Environment. Processes. 2024; 12(12):2912. https://doi.org/10.3390/pr12122912
Chicago/Turabian StyleSang, Pengfei, Wei Luo, Wenzhe Li, Chuanlei Wang, Ye Chen, Lang Zhou, Zihan Ma, Du Wang, and Yunqi Duan. 2024. "A Novel Martensitic Stainless Steel Material for CO2 Corrosion Environment" Processes 12, no. 12: 2912. https://doi.org/10.3390/pr12122912
APA StyleSang, P., Luo, W., Li, W., Wang, C., Chen, Y., Zhou, L., Ma, Z., Wang, D., & Duan, Y. (2024). A Novel Martensitic Stainless Steel Material for CO2 Corrosion Environment. Processes, 12(12), 2912. https://doi.org/10.3390/pr12122912