Article

Numerical Simulation of Mercury Conversion During Pulverized Coal Combustion

School of Environmental Science and Technology, Tianjin University, Tianjin 300072, China
*
Author to whom correspondence should be addressed.
Processes 2024, 12(12), 2910; https://doi.org/10.3390/pr12122910
Submission received: 5 November 2024 / Revised: 16 December 2024 / Accepted: 17 December 2024 / Published: 19 December 2024
(This article belongs to the Section Chemical Processes and Systems)

Abstract

:
The emission of elemental mercury poses significant risks to both the ecosystem and human health. Therefore, limiting its emission is critical. Although numerous studies have explored various aspects of elemental mercury, the precipitation and transformation characteristics of elemental mercury in pulverized coal under different operating conditions remain poorly understood. This study introduces a novel approach—specifically, the development of a mercury sub-model by integrating thermodynamics, reaction kinetics, and fluid dynamics. Using Fluent, this study simulates the transformation of elemental mercury during the pulverized coal combustion process in a 328.5 MW tangential combustion boiler under varying operating conditions. The study adopts excess air coefficients of 1.11, 1.16, and 1.21, along with corresponding burnout air ratios of 15%, 20%, and 25%. The study investigates three air distribution methods: inverted tower, uniform tower, and positive tower air distribution. The results indicate that lower excess air coefficients and burnout air ratios result in an increased amount of elemental mercury. Additionally, the study demonstrates that inverted tower air distribution can inhibit the precipitation and transformation of mercury.

1. Introduction

In recent years, the significant increase in mercury emissions has led to severe environmental and health impacts, which have become progressively more serious. As a result, mercury emissions have garnered increasing global attention. Mercury is highly neurotoxic, nephrotoxic, and immunotoxic. Even at low concentrations, it can cause significant harm to human health. Exposure to mercury, particularly for sensitive populations such as children and pregnant women, may result in severe consequences, including developmental retardation and intellectual disabilities. However, mercury also plays a significant role in the environment. The existence and circulation of mercury affect the balance and stability of the ecosystem. Understanding the behavior and transformation processes of mercury is crucial for better assessing environmental risks and implementing appropriate environmental protection measures. Mercury also has important applications in specific industrial fields, such as battery manufacturing, electronics, and the chemical industry. Flue gas emissions from coal-fired power plants are a major source of mercury [1,2]. Understanding mercury emissions during boiler operation is crucial. Different operating conditions directly affect mercury emissions from boilers. Studying mercury emissions under different operating conditions provides a basis for formulating effective pollution control strategies and reducing mercury-related risks to the environment and human health.
In recent decades, numerous researchers have investigated the forms of mercury in coal. Dvornikov [3] stated that mercury primarily exists in minerals as a complex of elemental mercury, mercury sulfide, and organic mercury. Zhao [4] reported that mercury exists in various forms in coal, with 11–91% being water-soluble and exchangeable, 0–32% being carbonate and oxidized, 0–25% bound to humic acid and fulvic acid, 0–42% being organic, and 0–9% incorporated into the mineral lattice. Luttrell et al. [5] highlighted that approximately 16% of mercury in coal is distributed in oxides, 28% in carbonates, and 58% in sulfides. Zheng et al. [6] examined 52 low-sulfur coal samples collected from different coalfields across six provinces in China. Based on their measurements, they identified sulfide-bound, organic-bound, and silicate-bound mercury in coal. Wu et al. [7] conducted a comprehensive study incorporating both experiments and molecular simulations. They demonstrated that mercury in coal is more likely to bind with inorganic minerals rather than organic ones. The aforementioned literature indicates that mercury exists in various forms in coal.
It has been demonstrated that during the combustion process in the furnace, mercury in pulverized coal precipitates from the coal. Mercury is emitted in three forms during this process. Mercury in solid particles is emitted either with the particles or as gaseous divalent mercury or elemental mercury in the flue gas. Additionally, most mercury is evaporated and released into the gas phase as elemental mercury during coal combustion, with the residual mercury content in the bottom ash generally being less than 2% [8,9,10]. Previous studies have reported that the proportions of oxidized mercury, zero-valent mercury, and particulate mercury in atmospheric mercury emissions from coal combustion in China are 61%, 16%, and 23%, respectively [11]. Of these three forms, oxidized divalent mercury (Hg2+) is considered relatively stable and soluble in water. It can also be captured and removed using wet desulfurization equipment. Due to its low volatility, Hg2+ is easily adsorbed onto particles and subsequently captured and removed by dust removal equipment. As a result, the amount of Hg2+ emitted into the atmosphere is relatively small. Conversely, elemental mercury is not easily soluble in water. This makes it relatively stable and the most difficult to control and remove among the three forms of mercury. Therefore, it is directly emitted into the atmosphere. During pulverized coal combustion, the flow rate and temperature of the flue gas decrease. This causes some elemental mercury in the flue gas to be oxidized into divalent mercury by the remaining components, while some is captured by pulverized coal particles [12]. Thermodynamic equilibrium calculations by some researchers highlighted that when the temperature is below 725 K, all mercury in coal-fired flue gas exists as HgCl2 [13]. Conversely, when the temperature exceeds 975 K, over 99% of mercury is present as the basic substance. Notably, a small amount of mercury oxide is also present in coal-fired flue gas. In the temperature range of 725–975 K, mercury exists as elemental mercury and HgCl2 in coal-fired flue gas, with their percentages’ intersection point controlled by the chlorine content. The equilibrium concentration of HCl in coal-fired flue gas ranges from 1 to 100 ppm [14]. Relevant research has shown that during coal combustion, Hg in coal is released as an elementary substance, with high-temperature conditions promoting this process [15]. In their study, Wu [16] analyzed the mechanism of mercury production in coal-fired flue gas using mercury testing methods. Based on mercury migration test data, they found that Hg emitted into the atmosphere during coal combustion accounted for only 6.25% of total emissions. In this process, most Hg migrates to the by-products of the flue gas pollutant control device. In another study, Zhou [17] examined the influence of the heating time, reaction atmosphere, temperature, and coal type on the mercury precipitation pattern in coal. They concluded that when heated above 600–700 °C, mercury in the coal sample mainly enters the flue gas as a gaseous form. The literature above indicates that mercury predominantly exists in the form of oxides in flue gas.
Furthermore, Jin [18] conducted a Chemkin simulation to determine the optimal flue gas composition conditions. They set various parameters for the optimal initial substance concentration in the boiler, considering factors such as the boiler size, coal quality, operating parameters, and load conditions, among others. In their study, Zhang [19] analyzed the chemical thermodynamic equilibrium and kinetics of a 410 t/h full-scale pulverized coal boiler. They studied mercury conversion in the horizontal flue under different operating conditions. Additionally, Zhu et al. [20] conducted numerical simulations for a 410 t/h tangentially fired pulverized coal boiler. Based on the simulations, they analyzed the mercury precipitation process during pulverized coal combustion. In a related study, Lyu et al. [21] conducted a numerical study on the homogeneous reaction of mercury in a 600 MW tangentially fired boiler. The results indicated that higher Cl content in coal favors the oxidation of elemental mercury. Currently, most research focuses on the effects of various elements on the oxidation of mercury but neglects the influence of different boiler operating conditions on the precipitation and oxidation of elemental mercury. Given that different operating conditions significantly impact the normal operation of boilers, it is essential to study the distribution and oxidation of elemental mercury under varying operating conditions.
Li et al. [22] prepared a sodium halide-impregnated, modified red mud-based adsorbent to capture elemental mercury in simulated coal-fired flue gas. The chemical adsorption mechanism for HgO was confirmed through fitting results from the pseudo-second-order model in kinetic studies. Gao et al. [23] studied the mercury concentration in flue gas before and after SCR, in front of the low-temperature economizer, and before and after desulfurization. It was found that the mercury mass concentration in flue gas emissions at the chimney decreases as the load of the random group increases. The synergistic removal efficiency of conventional flue gas pollutant control devices varies with different loads. Triwibowo D. et al. [24] modified the ash from bagasse boilers. The results showed that the modification affects the physicochemical properties. Magnetite-modified ash exhibited the best mercury adsorption effect. Hrdlička J. et al. [25] conducted experimental research on two alternative adsorbents, based on calcium hydroxide and aluminosilicate, for mercury capture in lignite combustion flue gas. The mercury capture rate of calcium hydroxide is about 15–25%, while that of aluminosilicate ranges from 25 to 45%. An increase in the adsorbent injection rate only promotes aluminosilicate adsorbents. Only the mercury capture rate of aluminosilicate adsorbents shows a clear correlation with the flue gas temperature at the injection point.
Since mercury is a trace substance, it is difficult to directly measure the distribution of elemental mercury in the furnace using experimental methods. Therefore, numerical simulation is a more convenient method for obtaining the desired results. Currently, research on mercury removal from boiler flue gas does not consider the influence of boiler operating parameters on mercury removal. Based on a 328.5 MW tangentially fired boiler, this paper introduces the mercury transformation mechanism into Fluent v.16.2 for calculation, realizing the coupling of chemical reaction kinetics and computational fluid dynamics. In addition to analyzing the temperature field, the component concentration field, and the distribution of elemental mercury under original working conditions, an analysis of variable working conditions is also conducted. The research results provide a theoretical basis and practical guidance for mercury control in boilers, offering significant insights for reducing mercury emissions.

2. Modeling and Methods

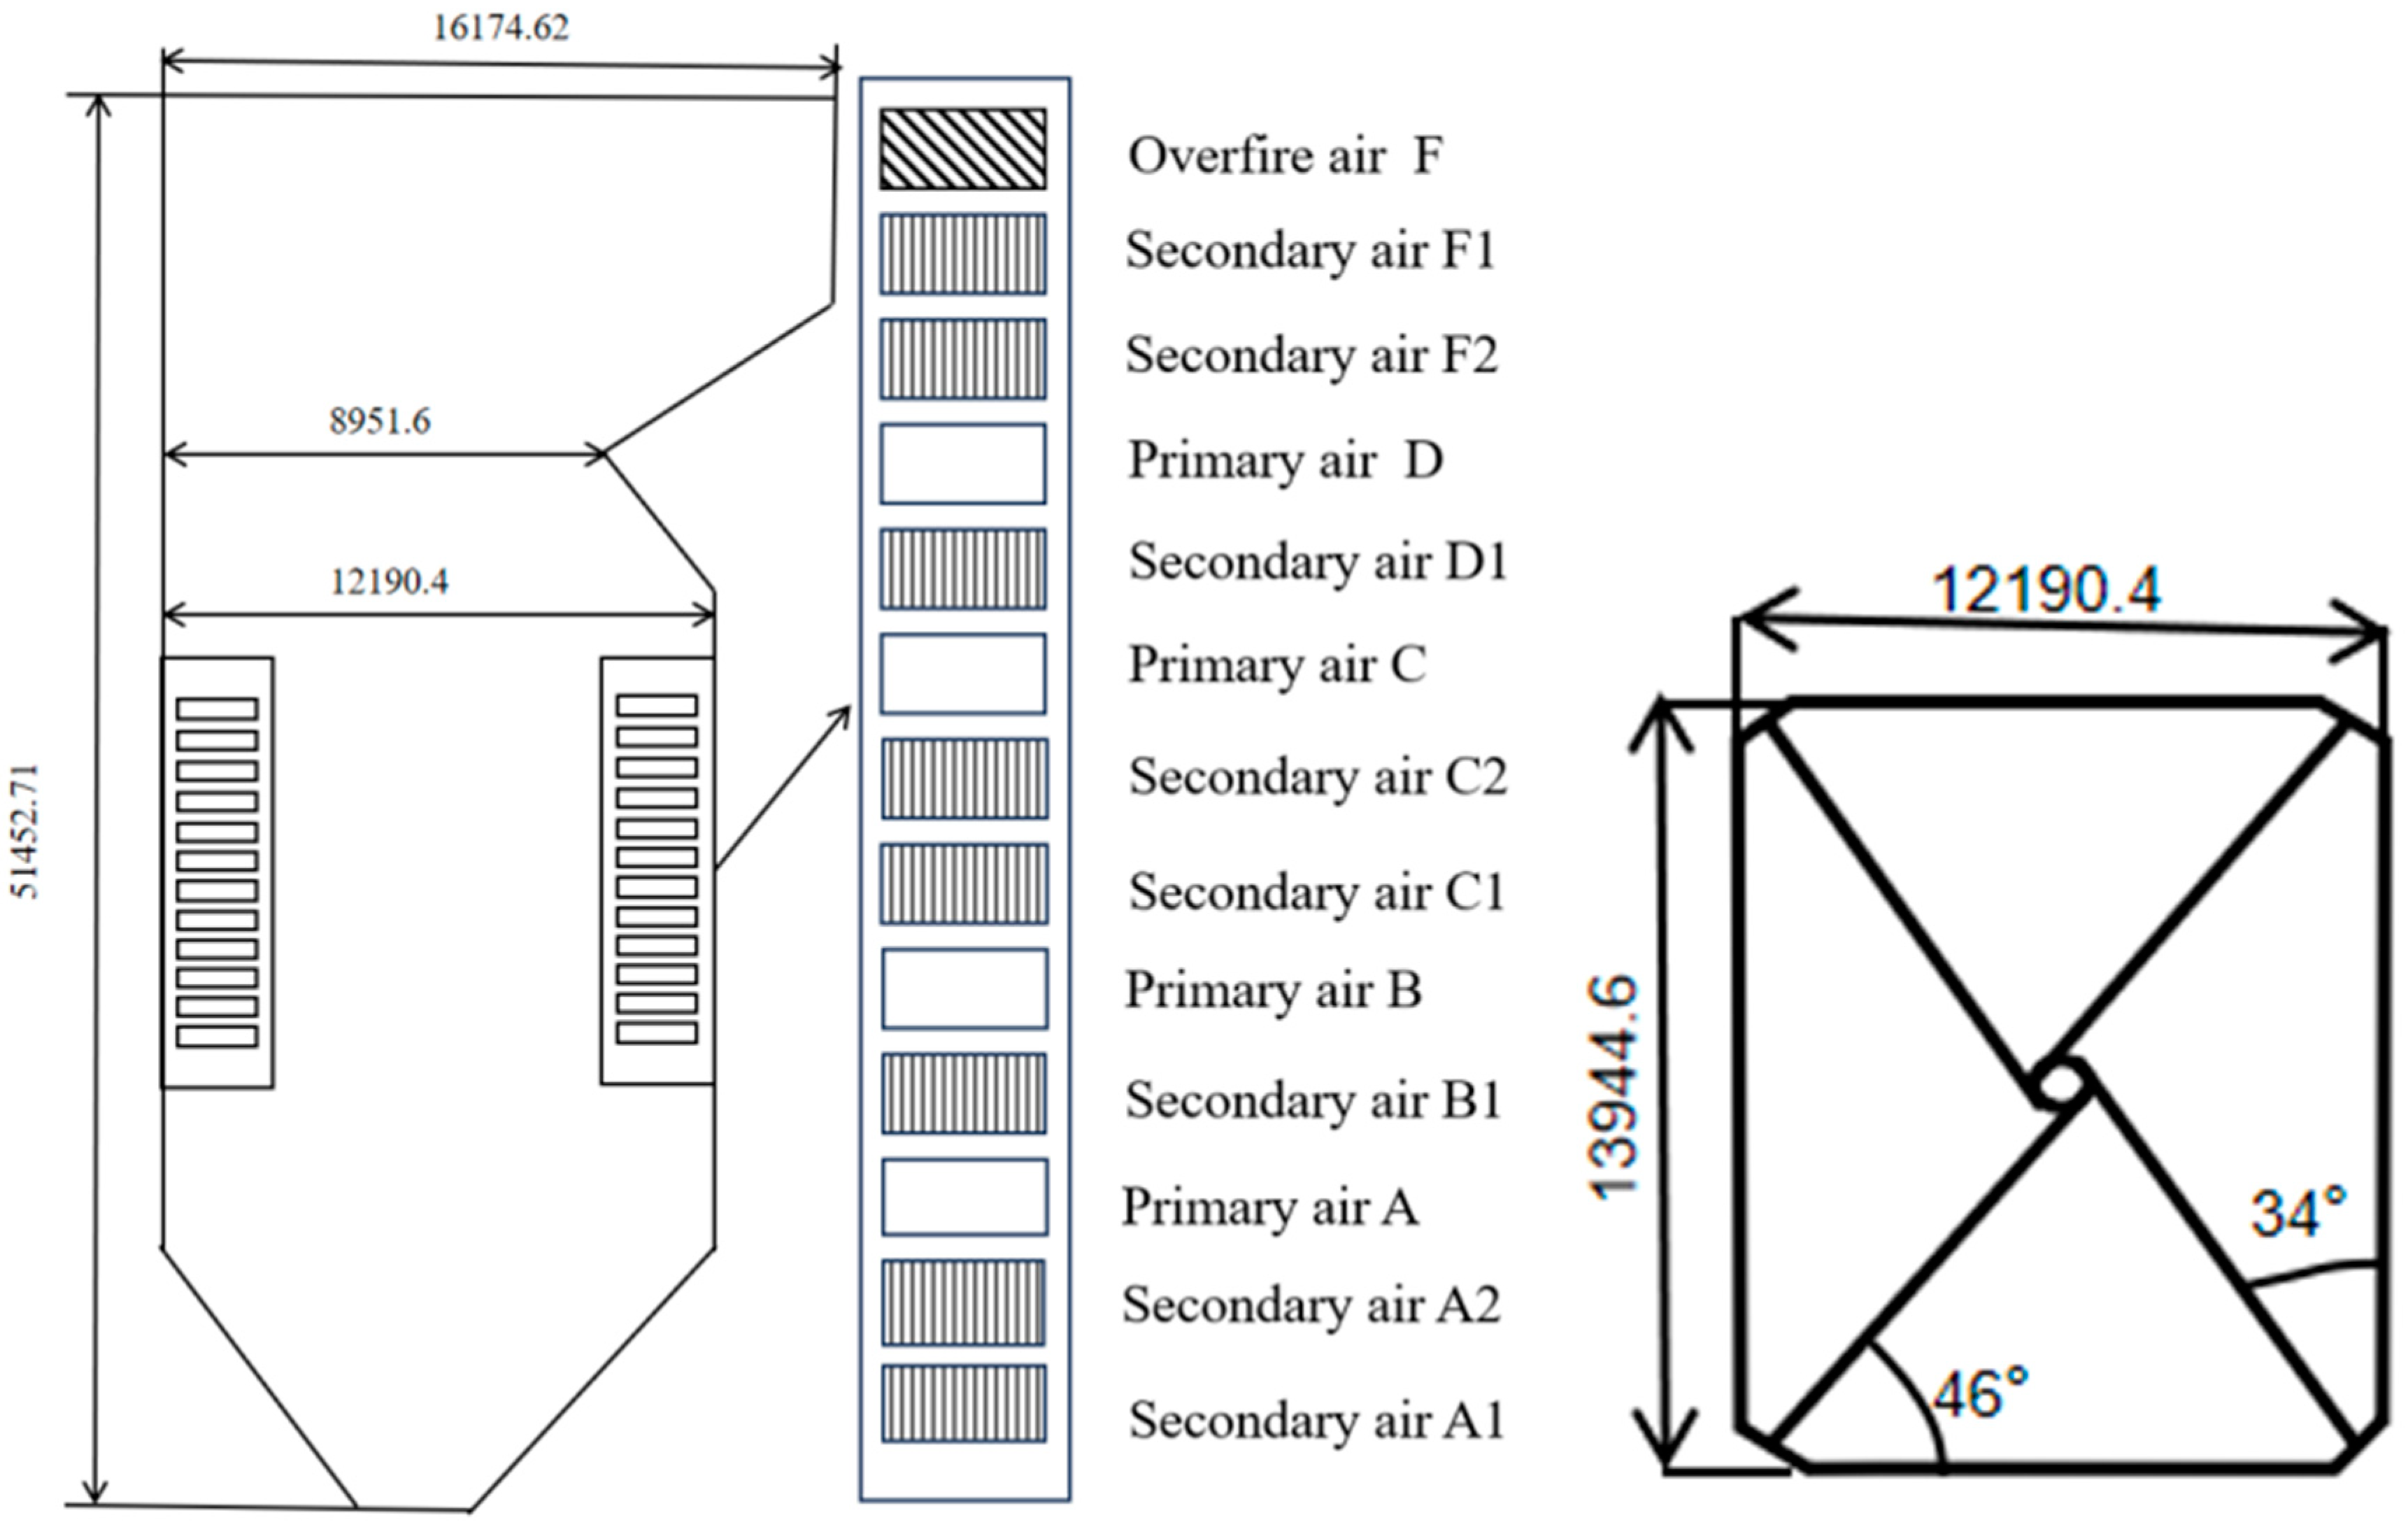
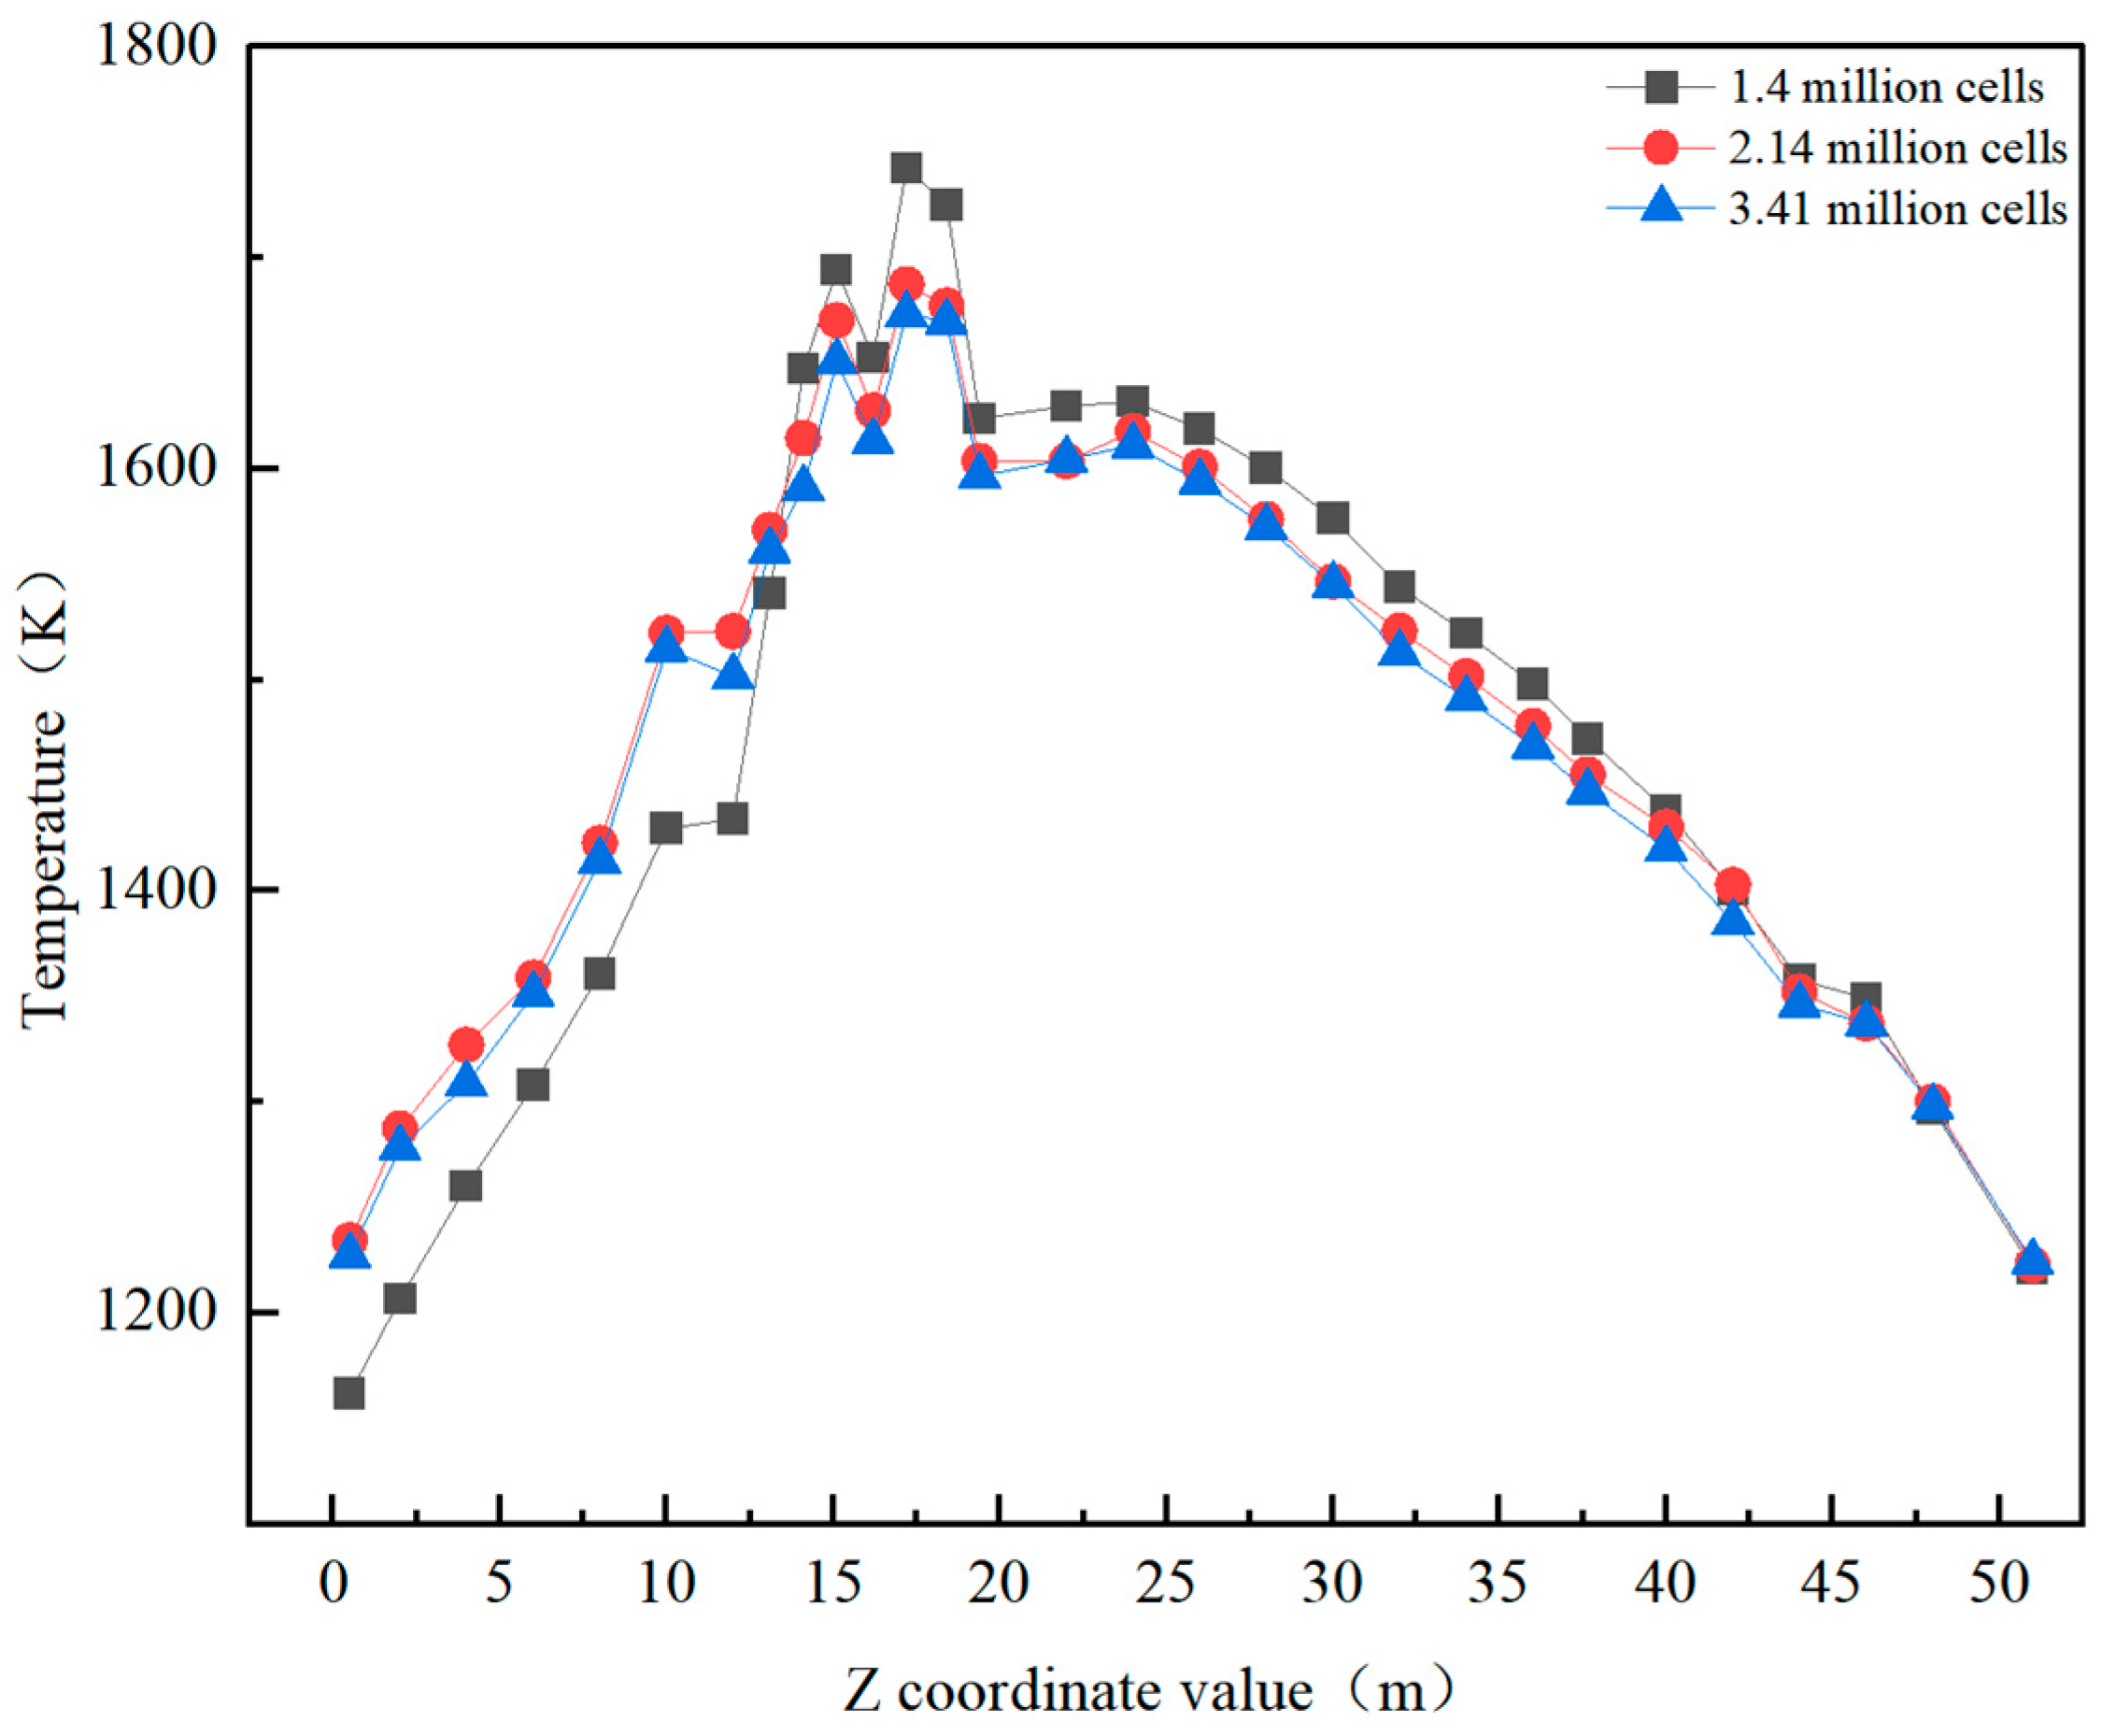
2.1. Boiler Introduction and Numerical Grid Generation

This study focuses on a drum boiler with subcritical parameters that burns bituminous coal. It utilizes controlled circulation, once-through intermediate reheating, a single furnace, and a tangential firing combustion mode. The boiler dimensions are 51.452 m × 12.19 m × 13.944 m. The burners are designed for temperature adjustment via swinging, balanced ventilation, solid slag discharge, an all-steel suspended structure, and an outdoor layout. The boiler has a total of eight layers of burners. The combustion mode follows an imaginary reverse tangential circle at the four corners of the aerodynamic field in the furnace. Each burner is equipped with peripheral air. The primary and secondary air nozzles are spaced at intervals. Anti-swirl secondary air (OFA) is positioned above the combustion layer to eliminate residual swirl. A semi-direct-fired pulverizing system is employed. The particle size of pulverized coal ranges from R90 = 15% to 40%. The outlet of each mill is connected to the four corners of a single layer of the boiler by four air-powder pipelines. The maximum rated output (BMCR) and economic continuous load (ECR) of the boiler are both supported by four mills, with one mill on standby. The overall structure of the boiler, burner layout, and the schematic diagram of tangential firing at the four corners are shown in Figure 1. The main parameters of the boiler are provided in Table 1. The parameters related to pulverized coal are listed in Table 2.
In this study, the pre-processing software Gambit v.2.4.6 is employed for grid partitioning. Based on this, the boiler is divided into five sections: the cold ash hopper, the lower burner section, the burner area, the upper burner section, and the horizontal flue section. It is important to note that different grid partitioning methods were employed for these five sections. Three sets of model grids were generated, totaling 1.4 million, 2.14 million, and 3.41 million grids, respectively. While keeping the setting parameters unchanged, independence verification is conducted on these three sets of meshes. The temperature change of the furnace is used as the standard for verifying mesh independence [26]. The grid independence is calculated using the RMS method. The calculation formula is shown in Equation (1). Here, RMS1 = 42.56, RMS2 = 11.12, and RMS3 = 42.23. After calculation with the RMS method, the temperature fluctuation when using 1.4 million grids for simulation is too large compared to that when using 2.14 million and 3.41 million grids. Considering the problem of simulation calculation efficiency, 2.14 million grids are selected for subsequent research. Additionally, meshes with a quality between 0.5 and 0.6 account for only 0.39% of this set, with no meshes exceeding a quality of 0.6. The mesh quality is deemed satisfactory. The specific grid division of the boiler is illustrated in Figure 2, and the grid independence verification results are shown in Figure 3.
RMS = 1 N i = 1 N x i 2
Equation (1): RMS1 represents the fluctuation between the temperature distributions simulated by 1.4 million and 2.14 million grids. RMS2 is the fluctuation of the simulation results of 2.14 million and 3.41 million grids. RMS3 is the fluctuation of the simulation results of 1.4 million and 3.41 million grids.

2.2. Boundary Conditions and Model Selection

In this study, the particle size distribution of pulverized coal follows the Rosin-Rammler distribution, with a maximum particle size of 250 μm, a minimum particle size of 10 μm, and an average particle size of 56 μm [27]. Primary air, secondary air, and over-fire air are configured as velocity inlets. The air distribution ratios are 27%, 58%, and 15%, respectively. The outlet uses pressure outlet boundary conditions, with the outlet pressure set to −20 Pa. The furnace wall is modeled using the standard wall function and the no-slip boundary condition. Temperature boundary conditions are applied for heat exchange. The wall surface near the burner is set to 900 K. The wall surface temperatures of the re-burning zone and the burnout zone are set to 800 K. The wall surface temperature at the bottom of the cold ash hopper is set to 473 K. The surrounding wall surface temperature is set to 690 K. The wall emissivity is set to 0.6 [28,29,30]. The specific parameter settings used in the evaluation are provided in Table 3.
Overall, the flow and combustion processes of pulverized coal in a boiler are highly complex. These processes involve various chemical reactions and physical phenomena. Based on this, the mathematical modeling used to support the simulations primarily involves selecting models for multiphase turbulence, particle motion, convective heat transfer, and radiative heat transfer. The simulation research in this section is divided into two steps. First, the original operating conditions of the boiler are simulated, neglecting the influence of mercury on combustion in the furnace. After the convergence of the original operating conditions, a post-processing method is applied to simulate the distribution of mercury in the furnace [19,20,21]. For combustion under original working conditions, the Realizable k-ε model, an improvement on the Standard k-ε model, is better suited to predicting complex turbulent flow situations. Therefore, the Realizable k-ε model is chosen as the gas-phase turbulent flow model [31,32,33]. Considering both calculation accuracy and efficiency, the P-1 model is selected as the radiation heat transfer model [18,28]. Additionally, the discrete phase model [34] is used to simulate gas–solid two-phase flow, the non-premixed combustion PDF model [35] is chosen for gas-phase combustion, the dual competition model is used for volatile matter precipitation [36], and the kinetic/diffusion-controlled reaction rate model is employed for coke combustion. Furthermore, post-processing methods are applied to calculate the properties of nitrogen oxides. Nitrogen oxides generated by pulverized coal combustion are primarily divided into NO and NO2, with NO accounting for more than 90% of the nitrogen oxides generated. Based on its reaction pathway, NOx can be categorized into thermal, fuel, and prompt NOx. In the furnace, thermal and fuel NOx dominate, while prompt NOx is negligible and can be largely ignored [37]. Currently, there is no Hg sub-model in Fluent software and no Hg-related components in the component library. Hence, there is significant difficulty in studying the transformation law of Hg under different working conditions in the furnace. Therefore, the calculation of Hg employs a post-processing method similar to that of NOx. In the calculation process, Hg and Cl in coal are initially ignored. The typical pulverized coal combustion calculation process is used to calculate the three-dimensional full-scale hot furnace. After the results converge, the relevant reactions of Hg are added, and the Hg content in the furnace is initialized based on the mercury content in coal. Then, the relevant calculations of mercury reactions are performed. Among them, the mercury content in coal is 0.34 ppm, and the precipitation rate of mercury during pulverized coal combustion is set as 85% [38]. Table 4 presents the relevant reaction and kinetic parameters for mercury.

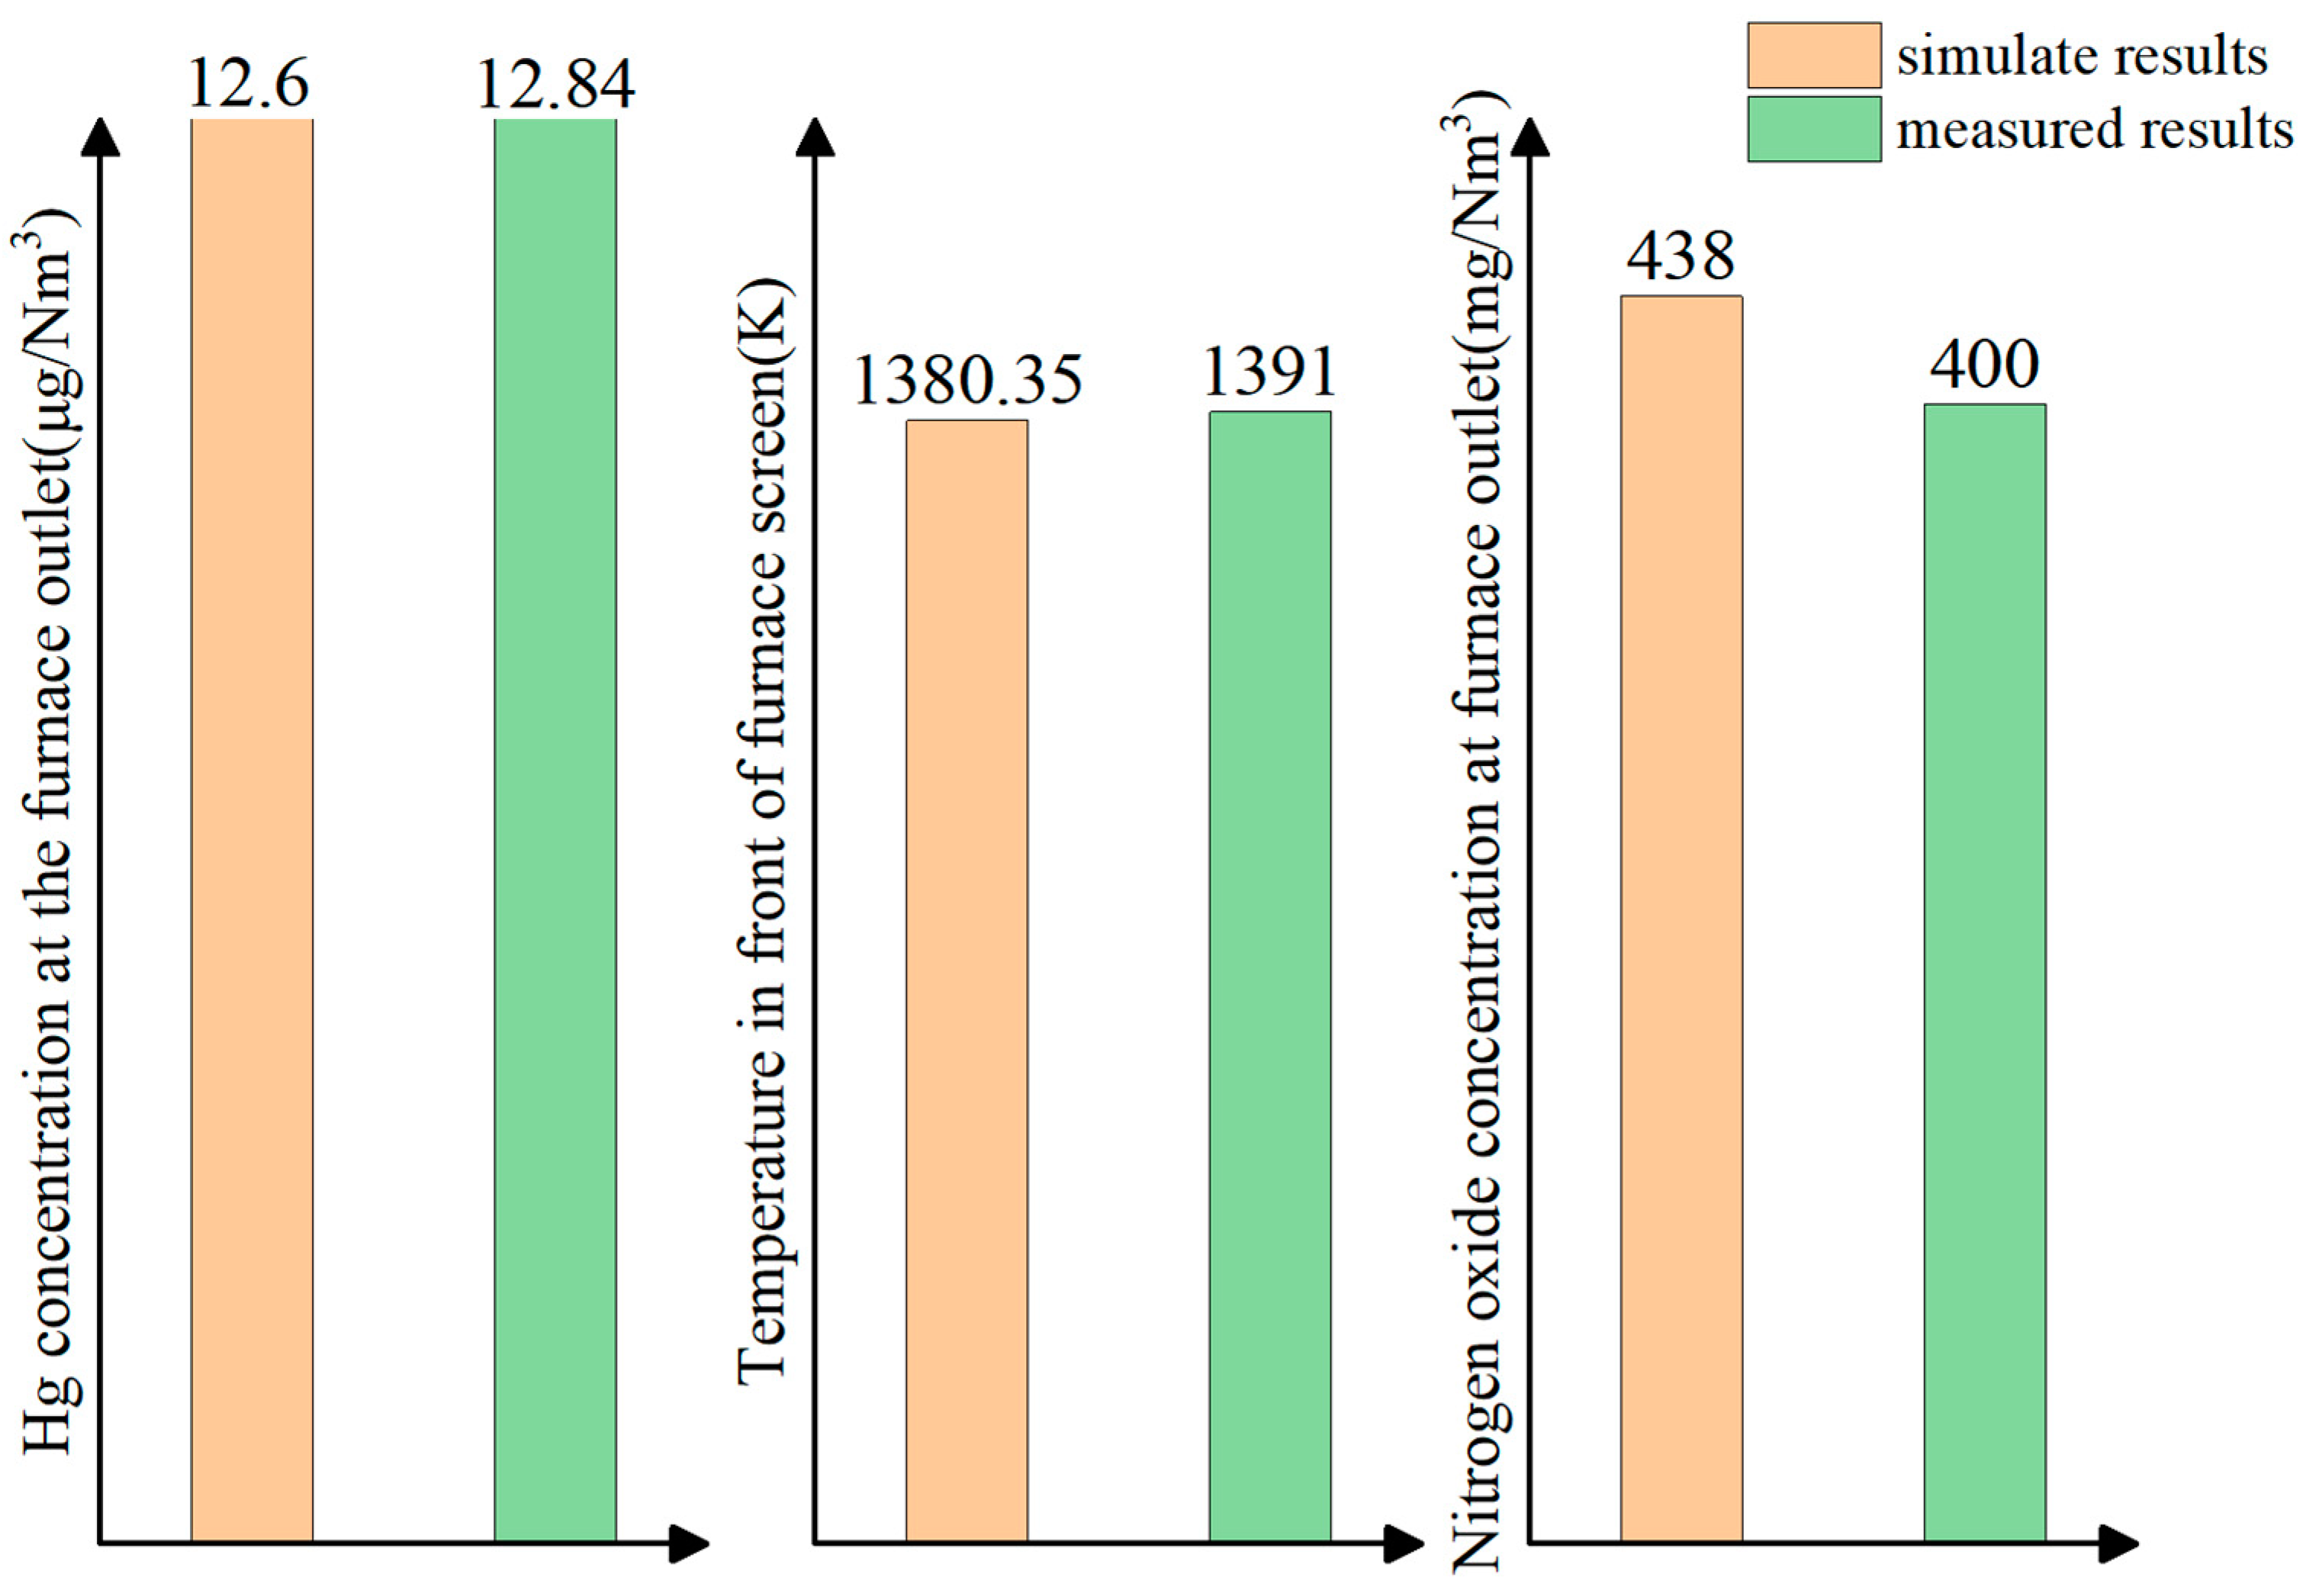
2.3. Model Validation

To validate the accuracy of the selected model, the simulation results are compared with measured data from the power plant. As shown in Figure 4, the temperature, NOx concentration, and elemental mercury concentration in the furnace are selected for comparison and validation. The temperature measurement point is located prior to the heating surface of the furnace. The nitrogen oxide measurement point is located at the furnace outlet. The measurement point for elemental mercury content in flue gas is located at the inlet of the air preheater. For the field test, the activated carbon adsorption tube method (EPA METHOD 30B) for determining total gaseous mercury in coal-fired pollutants and the activated carbon adsorption/thermal cracking atomic absorption spectrophotometry method (HJ 917-2017) for determining gaseous mercury in waste gas from stationary pollution sources are employed as test methods and standards. The portable mercury tester, HYDRA II C, and the 30B adsorption method flue gas mercury sampler are utilized as test instruments. Among the three parameters selected, the nitrogen oxide concentration at the furnace outlet exhibited the largest error of 9.5%. The errors associated with the oxygen concentration at the furnace outlet and the front panel temperature were 1.3% and 0.82%, respectively. Overall, the simulation results are deemed acceptable for coal-fired boilers [39]. Based on this, the model selected in this study has been validated to effectively simulate the combustion of pulverized coal, flue gas flow, and heat transfer in the furnace.

3. Results and Discussion

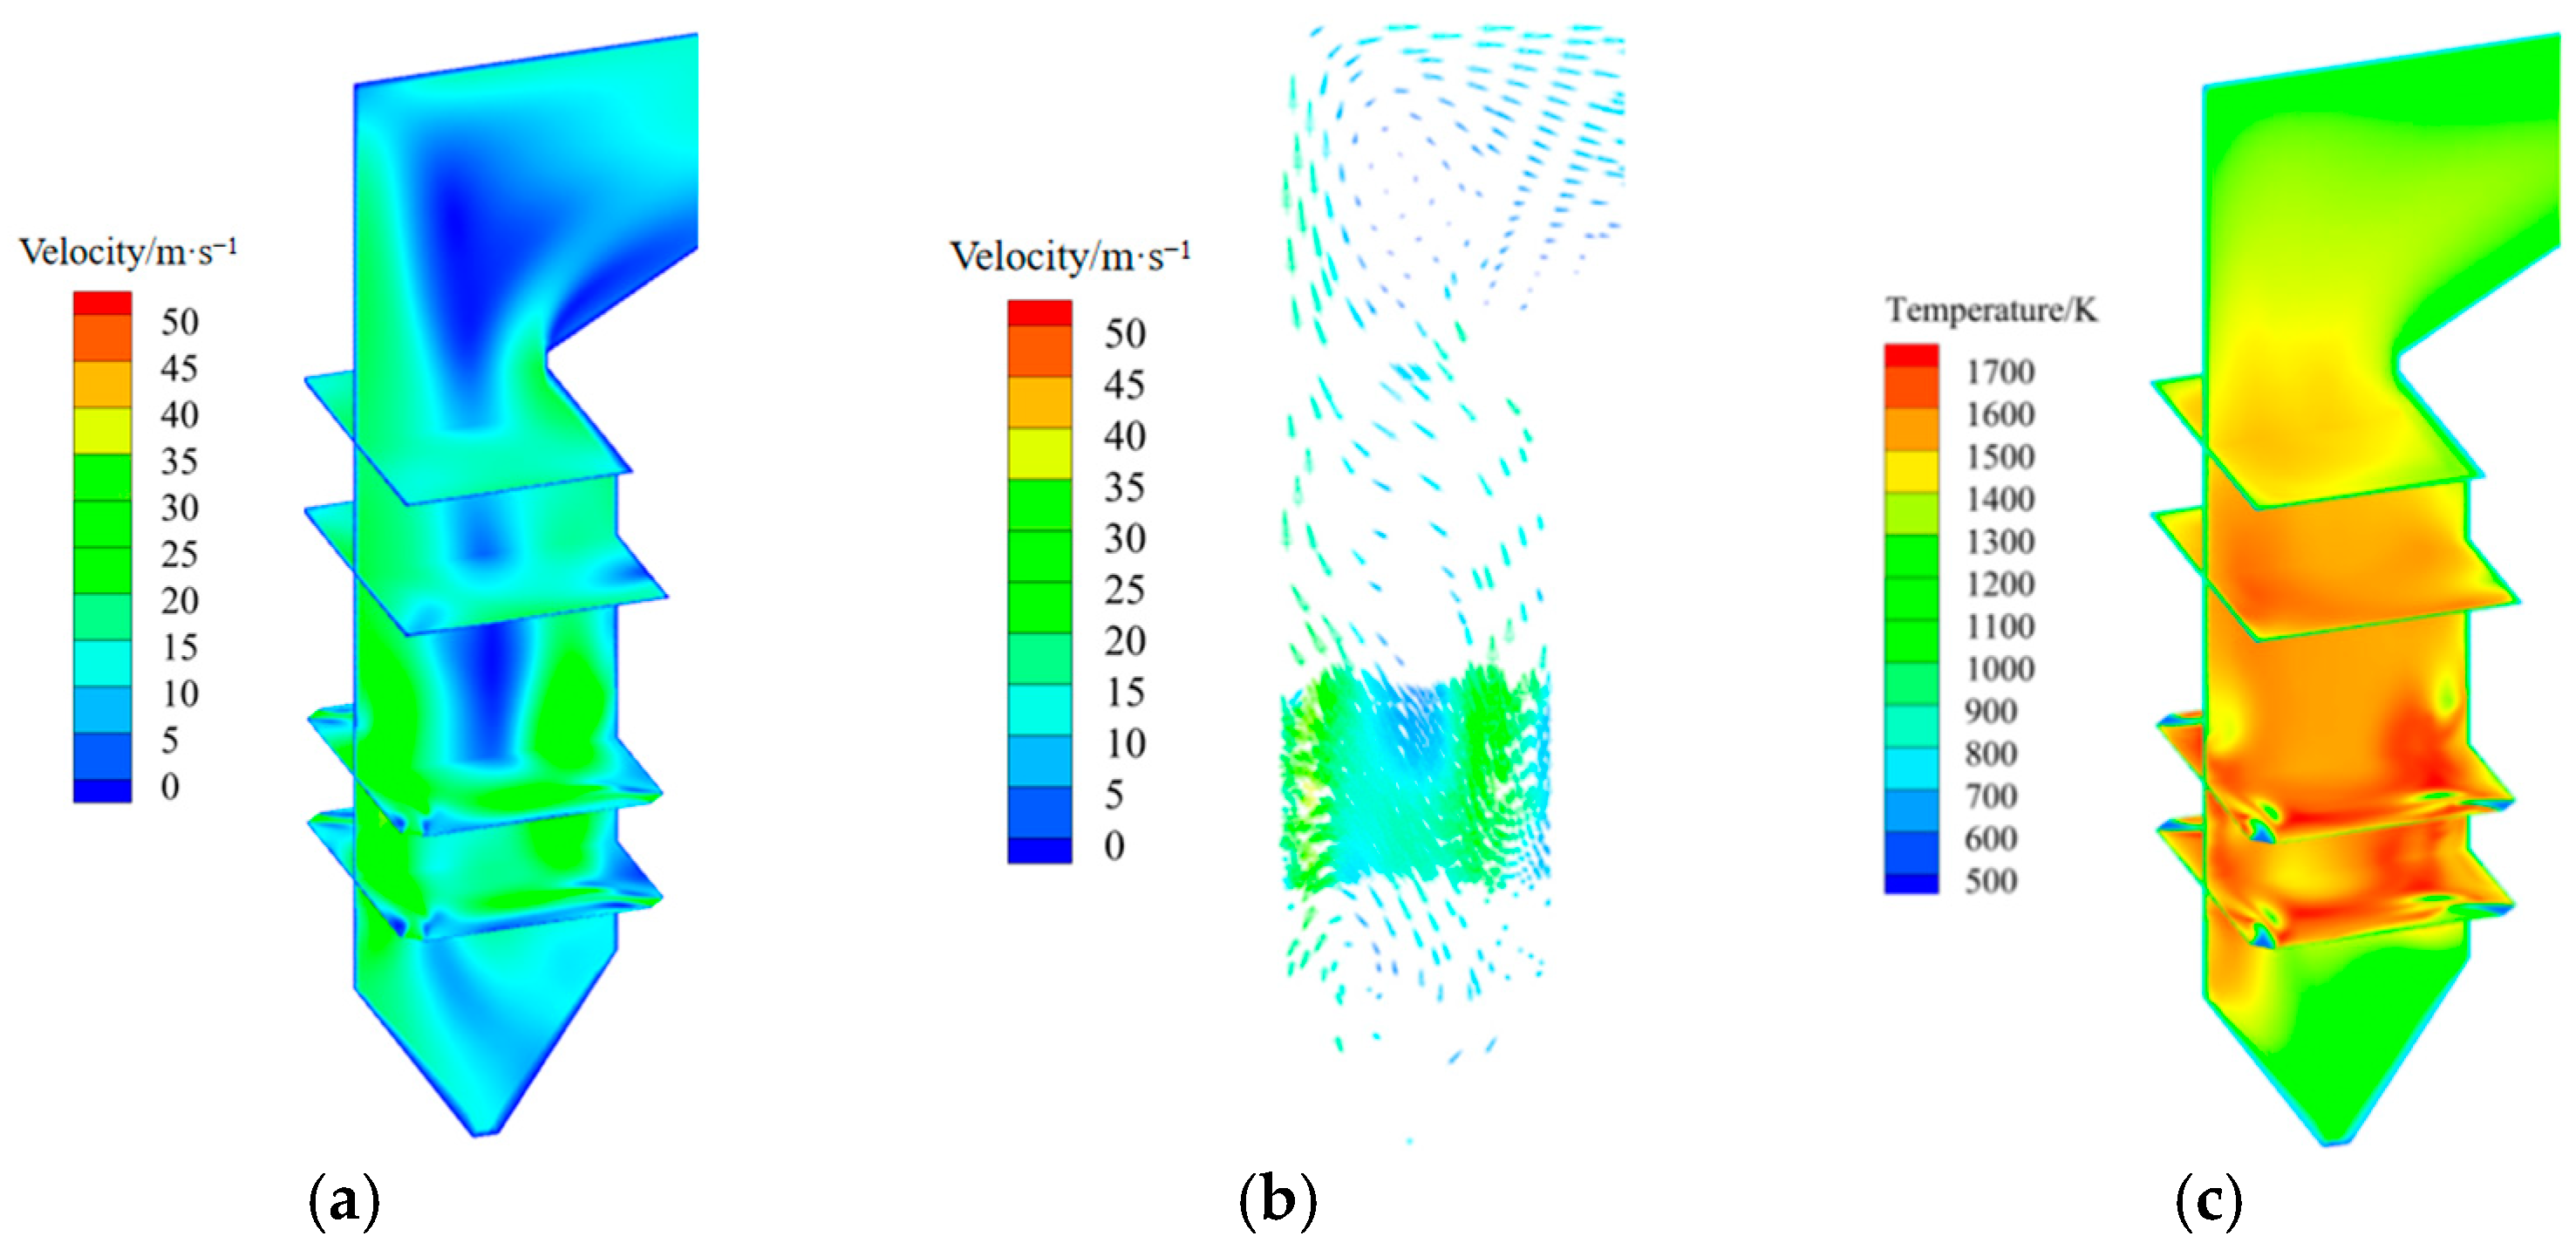
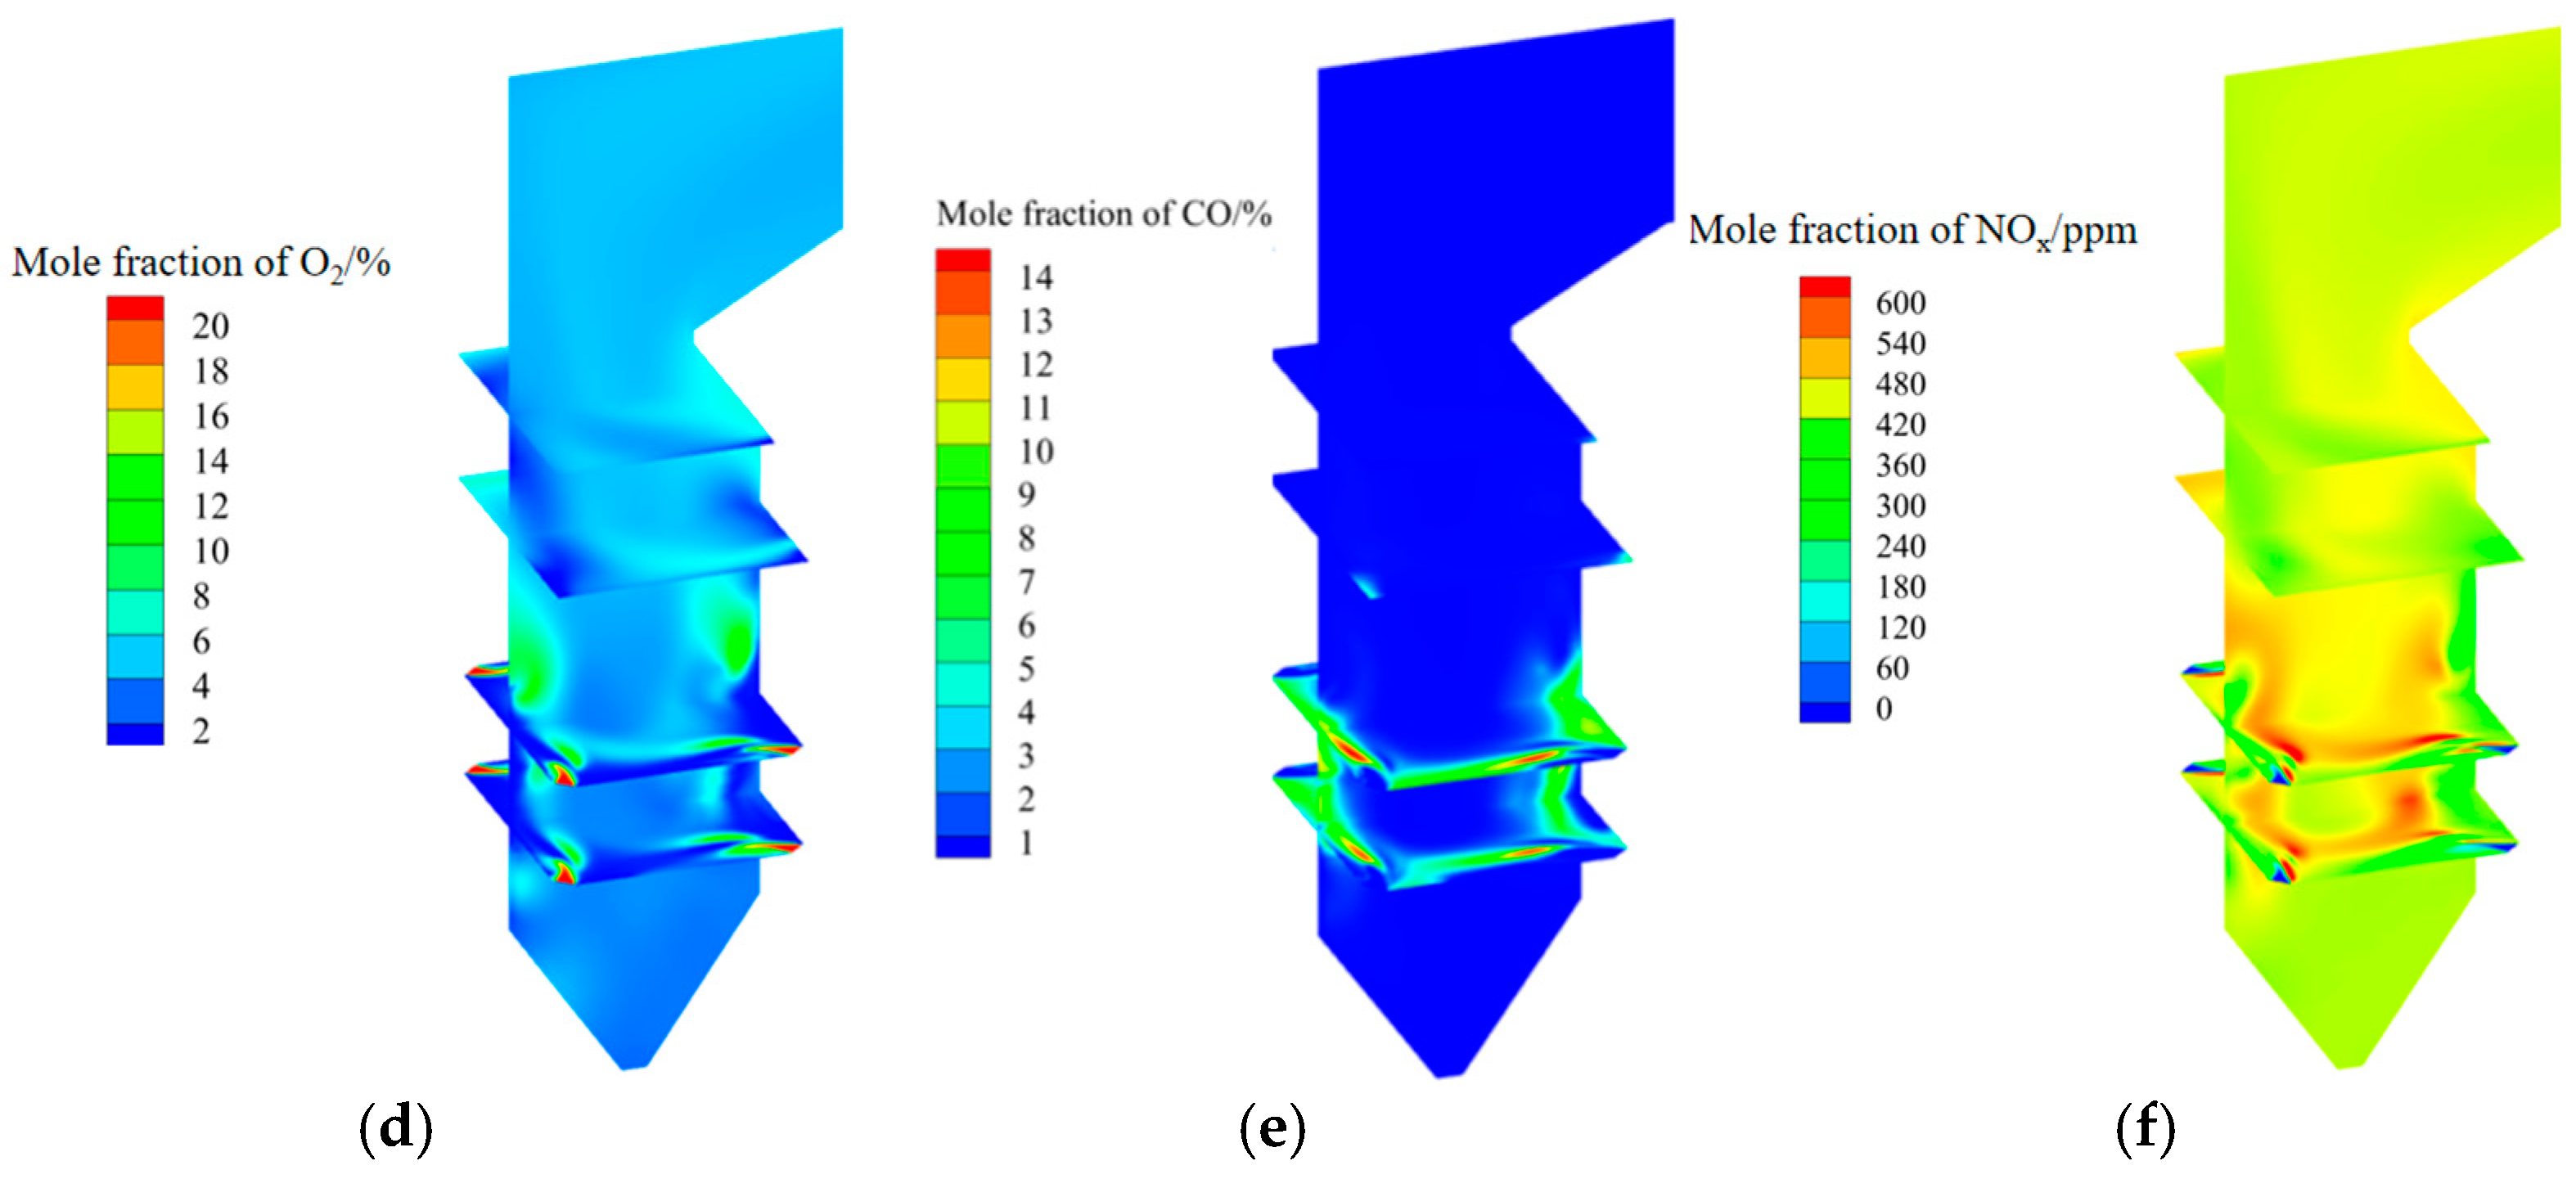
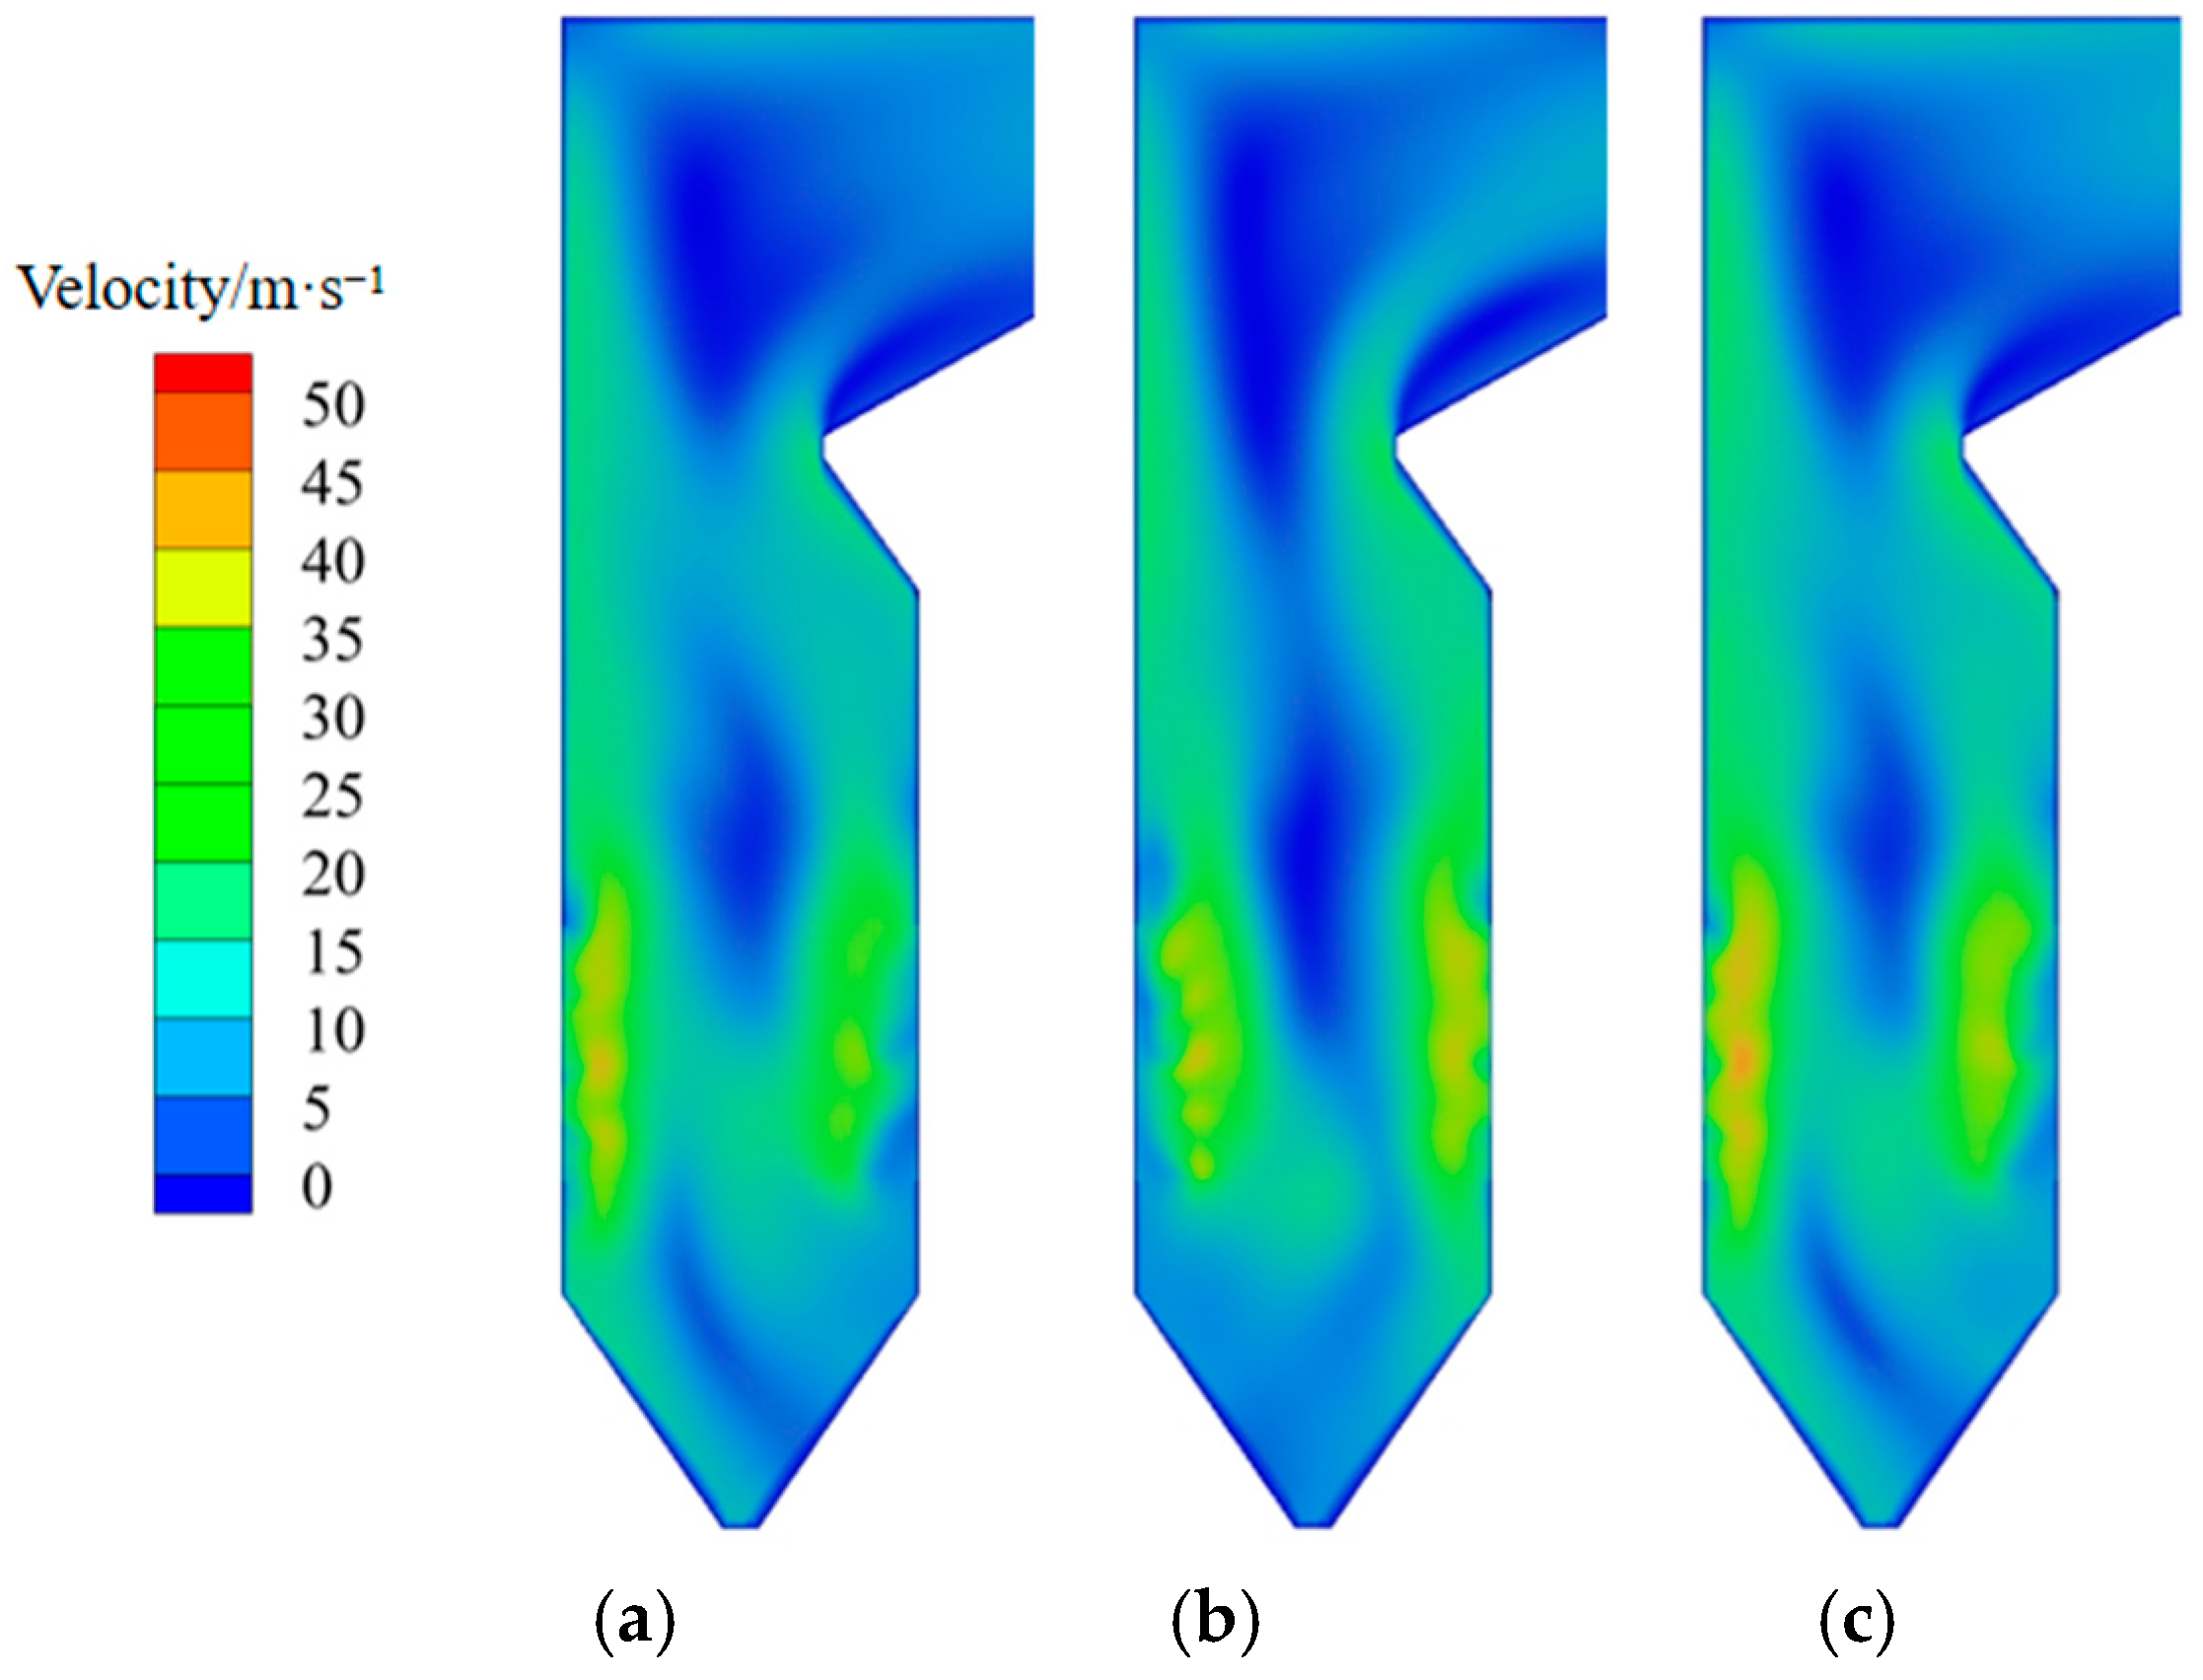
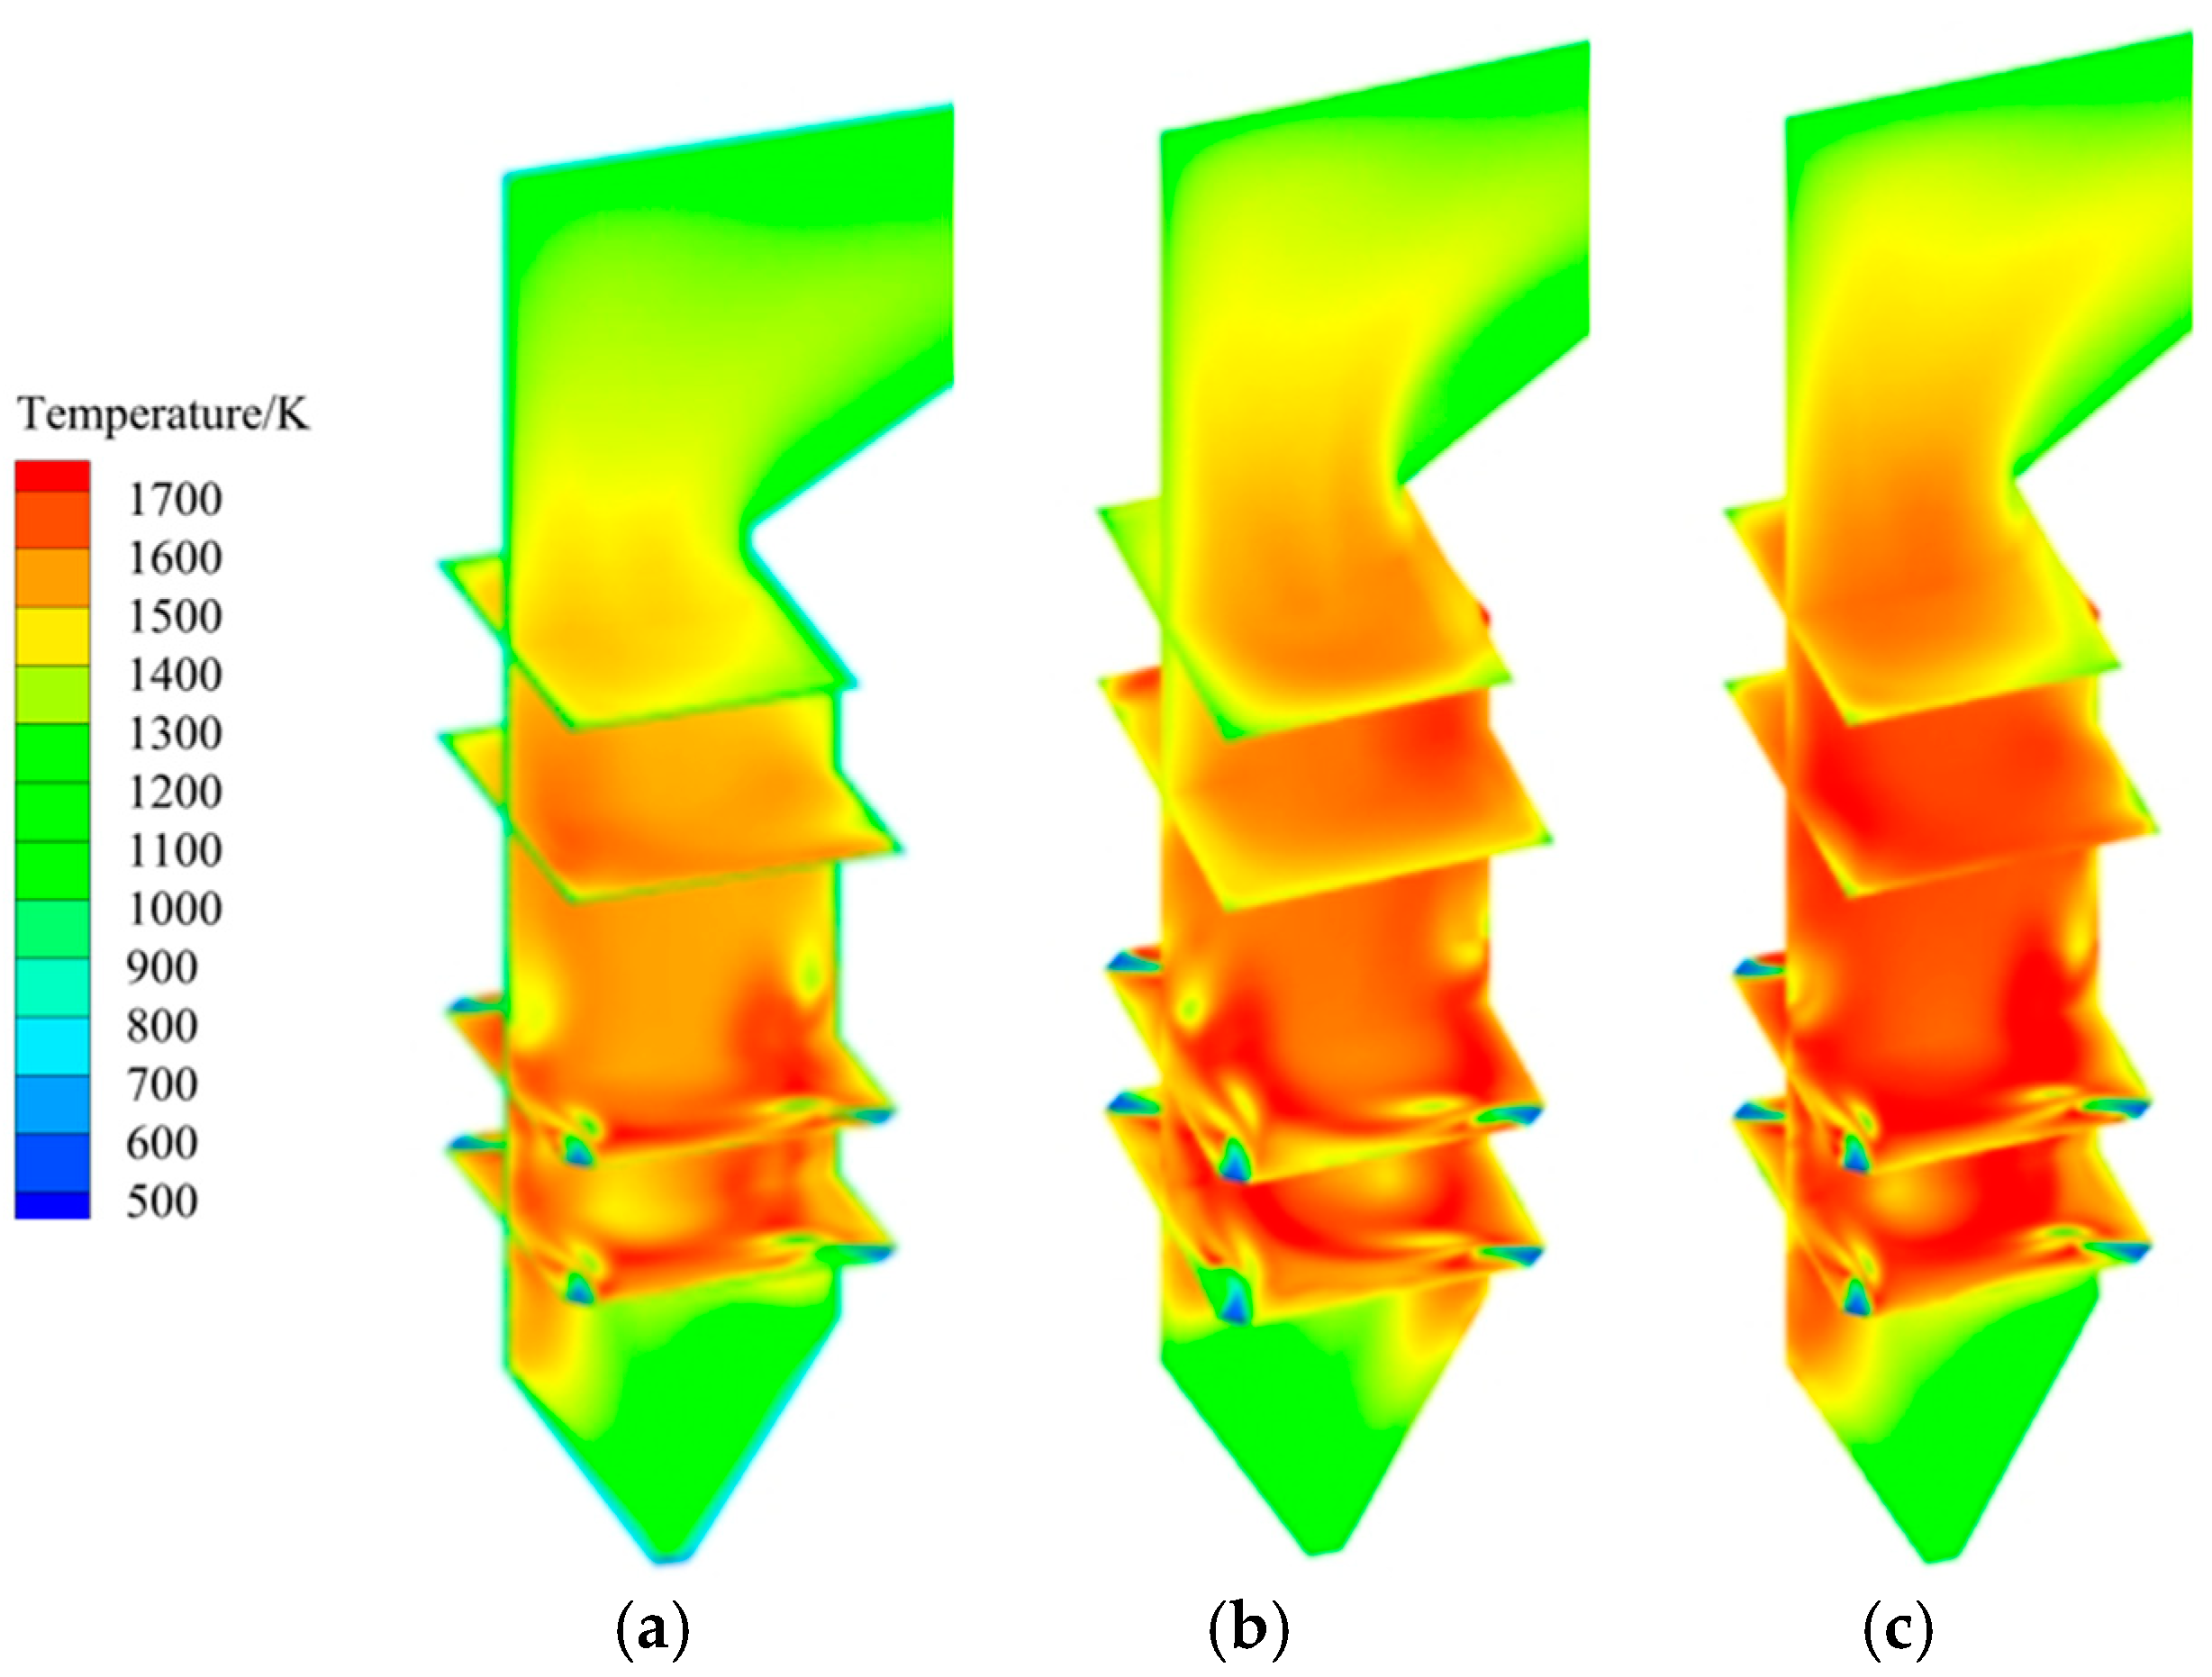
3.1. Analysis of Original Operating Conditions

As shown in Figure 5a,b, the velocity below the burner is relatively low, whereas the velocity in the burner area increases significantly compared to the area below. Additionally, the flue gas in the region above the burner flows horizontally after passing around the nose arch, where the velocity at the nose arch is relatively high. Once the flue gas reaches the panel area, the velocity near the side walls is relatively high, while the velocity in the center is relatively low. Figure 5c shows that the temperature in the cold ash hopper region is relatively low. It is worth noting that only a portion of the flue gas and ash fall into the cold ash hopper region due to gravity, leading to a temperature increase. The temperature is highest in the burner region. This is because the pulverized coal and air introduced into the furnace by the burner undergo intense combustion reactions in the burner region, releasing a significant amount of heat. This results in a sharp increase in temperature. After leaving the burner region, the pulverized coal gradually burns out, leading to a decrease in the heat released. This explains why the temperature in the upper region of the burner decreases.
Additionally, Figure 5d,e show that the oxygen volume fraction is relatively low in the burner nozzle region. This occurs because, in the burner nozzle region, when pulverized coal enters the furnace with primary air, it ignites and burns, consuming a large amount of oxygen. This leads to a lower oxygen concentration in the burner region. Moreover, the unburned pulverized coal undergoes combustion under conditions of sufficient oxygen provided by the overfire air. As a result, oxygen is consumed, leading to a lower oxygen concentration in the overfire air nozzle region. It is noteworthy that the CO volume fraction is extremely high in the burner nozzle region, while it is low in other regions. This is the opposite of the distribution of the O2 volume fraction. This indicates that the combustion of pulverized coal in this region consumes a large amount of oxygen, resulting in incomplete combustion and the generation of more CO. Figure 5f highlights that the oxygen concentration is relatively high in the cold ash hopper region. Thus, pulverized coal can be fully combusted, forming an oxidizing atmosphere and resulting in a higher NOx concentration. As it enters the dominant combustion zone, the NOx concentration rapidly decreases and then slowly increases. This occurs because the incomplete combustion of pulverized coal in the main combustion zone produces CO, further reducing the NOx concentration. However, as overfire air is injected, the oxygen concentration increases, and the pulverized coal is fully combusted, which leads to a gradual increase in the NOx concentration. Based on the above analysis, it can be concluded that the simulation results of the original operating conditions are consistent with the actual operating conditions of the boiler. On this basis, further simulation research on mercury behavior in the furnace can be conducted.

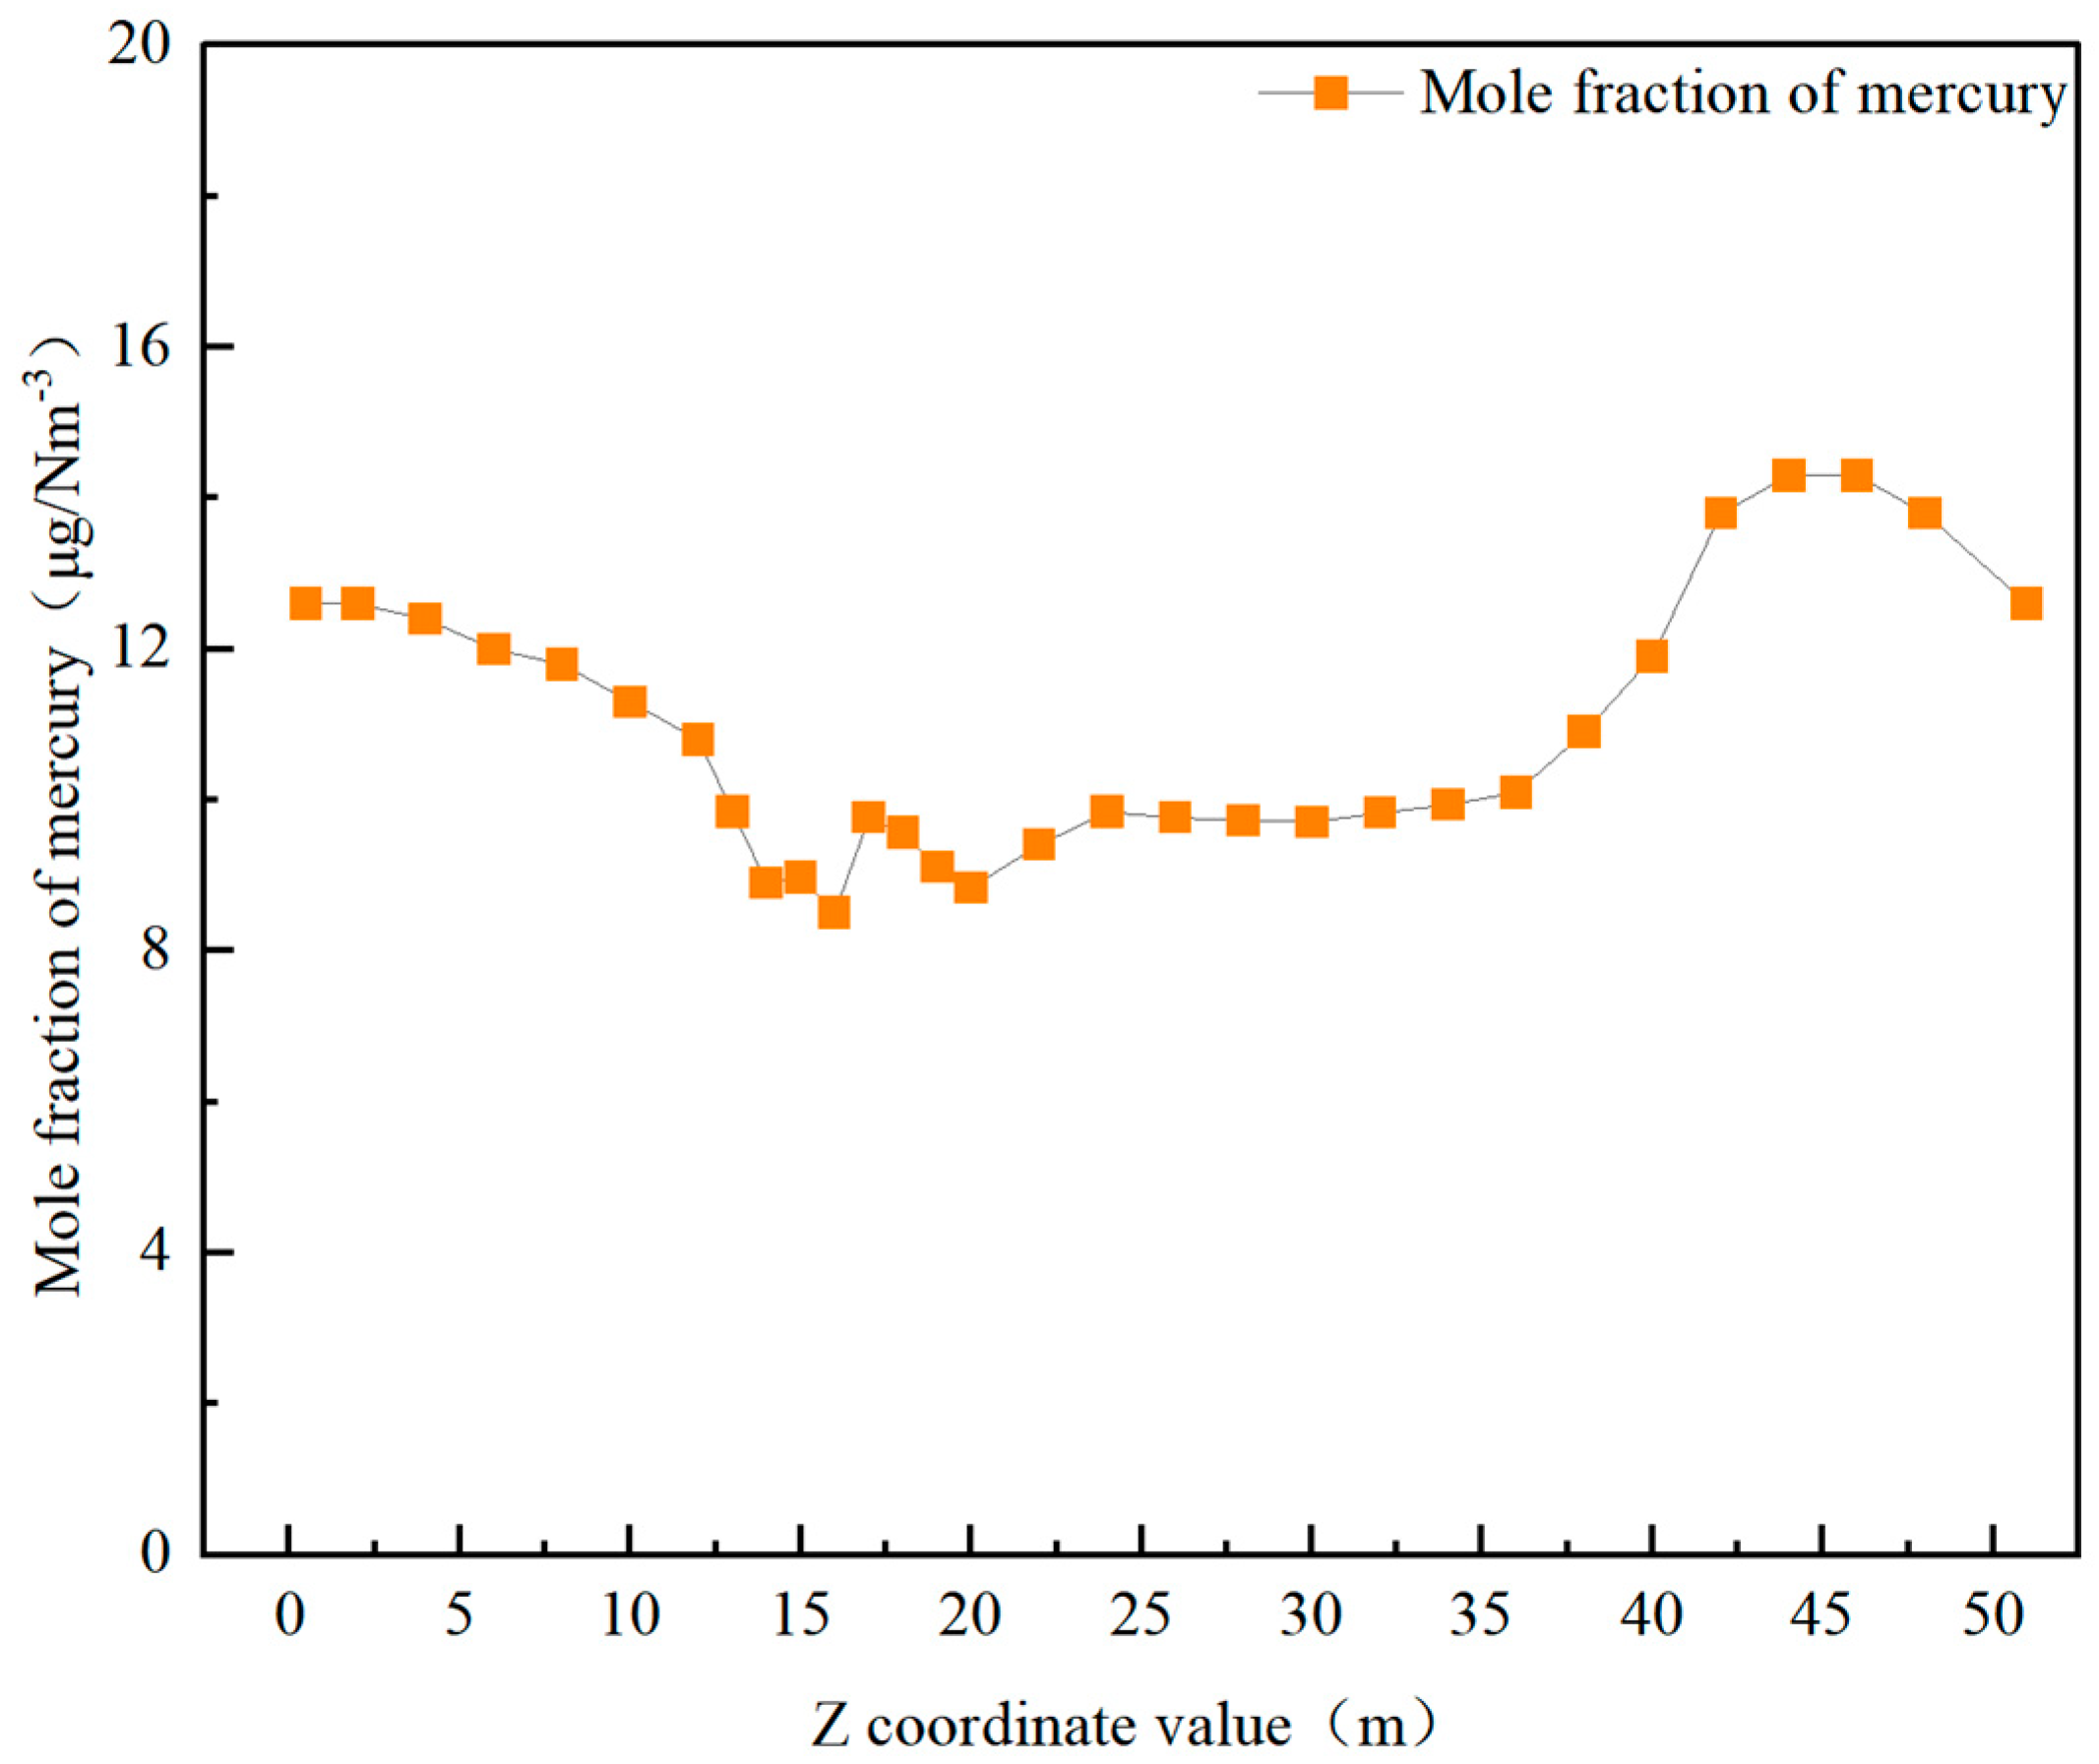
3.2. Mercury Distribution Under Original Operating Conditions

Figure 6 illustrates the volume distribution cloud map of mercury in the central section of the furnace, while Figure 7 presents the average volume distribution map of mercury across sections along the furnace’s height. The results presented in these figures highlight that the mercury content in the burner region is relatively low. Conversely, the mercury content in the cold ash hopper region, overfire region, and horizontal flue region is relatively higher. This is because mercury predominantly exists as elemental mercury in the furnace chamber. Due to its highly volatile nature, the mercury element will precipitate along with the volatile matter during pulverized coal combustion. Moreover, as a heavy metal with a relatively high molecular mass, mercury continuously sinks under the influence of gravity. This leads to an increase in the elemental mercury content in the cold ash hopper region. Furthermore, the lower content of elemental mercury in the burner region occurs because it reacts with oxidizing gases, such as oxygen and chlorine, in the furnace after precipitation. As a result, mercury compounds are generated, leading to a decrease in the elemental mercury content. Due to the gradual uniformity in flue gas mixing and the high-temperature decomposition of mercury oxides, the content of elemental mercury increases in the overfire and horizontal flue regions.

3.3. Mercury Distribution Under Various Operating Conditions

3.3.1. The Influence of Excess Air Coefficient on Mercury Distribution

According to the velocity distribution cloud diagram for the furnace’s central cross-section shown in Figure 8, the flow field distributions under different excess air coefficients are essentially the same. In the wall-adjacent areas, the velocity is relatively high. In the central region, the velocity is lower. The airflow spirals upward in a strong swirling motion and has a lower velocity at the furnace outlet. As the excess air coefficient increases, so does the amount of air entering the furnace. This results in enhanced swirling within the furnace and a significant increase in velocity in the wall-adjacent areas. This could exacerbate corrosion and wear near the water-cooled walls, adversely affecting the boiler’s safe and stable operation. Therefore, it is crucial to control the excess air coefficient appropriately.
Figure 9 displays the temperature distribution in the furnace’s central section under varying excess air coefficients. As shown, the temperature distribution within the furnace remains relatively similar across different excess air coefficients. During combustion, the main combustion zone exhibits intense activity, releasing significant heat. This causes the temperature to rise. Simultaneously, a substantial volume of low-temperature overfire air enters the furnace in the overfire zone, leading to a slight temperature reduction. With increasing excess air coefficients, the high-temperature zone of the main combustion zone gradually extends towards the walls. Conversely, the low-temperature zone at the furnace’s center gradually expands. This phenomenon is primarily attributed to the increase in the excess air coefficient, which leads to higher air volumes and velocities entering the furnace. The combustion pathway of pulverized coal shortens after entering the furnace. Consequently, it ignites quickly and releases thermal energy, thereby increasing the local temperature. Additionally, as the excess air coefficient increases, the average temperature across the cross-section is observed to gradually decrease. The increase in the excess air coefficient results from a higher air flow rate. This is reflected in the boundary conditions by an increased inlet velocity for primary air, secondary air, and overfire air. This, in turn, enhances the turbulent mixing of pulverized coal and accelerates the combustion process. However, with a constant fuel supply and increasing air volume, the temperature of the heatable flue gas gradually decreases. This leads to a reduction in the furnace’s temperature level.
Additionally, Figure 10 displays the cloud map of mercury’s volume fraction distribution in the furnace’s central section under varying excess air coefficients, while Figure 11 illustrates the distribution of average mercury volume fractions along the furnace’s height with varying excess air coefficients. As shown in the two figures, the mercury distribution trend in the furnace is similar across different excess air coefficients. The general trend initially decreases and then increases as the furnace height increases. When considering excess air coefficients of 1.21, 1.16, and 1.11, the volume fraction of elemental mercury in the cold ash hopper area decreases as the excess air coefficient increases. This occurs because a lower excess air coefficient reduces the oxygen content in the furnace. Consequently, this decreases the oxidation of elemental mercury. As a result, the elemental mercury content in the cold ash hopper area decreases. However, in the burner area, reducing the excess air coefficient causes an incomplete combustion of pulverized coal. Additionally, the reduced oxygen levels inhibit the oxidation of elemental mercury, leading to minimal differences in the mercury content in the burner area. Furthermore, reducing the excess air coefficient in the overfire and horizontal flue zones causes an insufficient oxygen supply, lowering the rate of mercury compound formation. Moreover, as elemental mercury is stable, a lower excess air coefficient reduces its potential to form oxides or chlorides with other elements. As a result, the formation of mercury compounds in the overfire and horizontal flue zones is reduced. In conclusion, a decrease in the excess air coefficient leads to a slight increase in the elemental mercury content.

3.3.2. The Effect of the Overfire Air Ratio on Mercury Distribution

Furthermore, Figure 12 illustrates the temperature distribution in the middle of the furnace for different overfire air ratios. The figure shows that the temperature distribution in the middle of the furnace remains largely the same for different overfire air ratios. Specifically, the combustion intensity near the cold ash hopper is low, leading to lower temperatures. During combustion, the fuel near the main combustion zone mixes with air and undergoes intense combustion, releasing significant heat and increasing the temperature. The figure also shows that as the overfire air ratio increases, the primary air slows down, allowing more pulverized coal to enter the cold ash hopper. Additionally, the combustion of these fuels generates heat, increasing the temperature in the lower part of the main combustion zone. In the overfire area, the cooling effect of the low-temperature air exceeds the heat released by the combustion of unburned pulverized coal. Consequently, the temperature in the overfire area gradually decreases. Moreover, as the overfire air ratio increases, the flame center gradually shifts upward. However, the results indicate that the temperature distribution near the primary air nozzle remains unchanged for different overfire air ratios. At very low overfire air ratios, the flow and speed of the primary and secondary air increase, causing more pulverized coal to undergo complete combustion near the burner. However, the lower part of the burner contains less pulverized coal, resulting in less heat release and a lower temperature. As the overfire air ratio increases, the speed of the primary and secondary air decreases, leading to more pulverized coal near the primary air nozzle. In this case, fuel combustion becomes more intense, increasing the average temperature of the sections.
Additionally, Figure 13 shows the average volume fraction distribution of mercury in the furnace sections along the height direction for different overfire air ratios. Figure 14 also presents the volume fraction distribution of mercury along the furnace height for sections with different overfire air ratios. The results in these two figures show that increasing the overfire air ratio has little effect on the mercury distribution trend. As the overfire air ratio decreases from 25% to 15%, the content of elemental mercury in the cold ash hopper area increases. This occurs because during combustion, mercury is oxidized into HgO, HgCl2, or other oxides and emitted with the flue gas. However, as the overfire air ratio decreases, coal combustion becomes incomplete, preventing full oxidation of mercury. Consequently, the deposition of elemental mercury in the cold ash hopper area increases. Furthermore, when the overfire air ratio decreases from 25% to 15%, the combustion temperature in the burner area decreases. This leads to a decrease in the volatility of mercury and a relative increase in the content of elemental mercury. Higher combustion temperatures increase mercury volatility. As a result, a decrease in the overfire air ratio increases the content of elemental mercury in the burner area. Moreover, reducing the overfire air ratio from 25% to 15% decreases the temperature in the overfire zone. This slows the oxidation rate of mercury, increasing the content of elemental mercury. Under normal combustion conditions, mercury is oxidized and emitted with the flue gas. However, when the overfire air ratio decreases, incomplete coal combustion reduces the oxygen content in the overfire zone. This impacts the oxidation reaction of mercury, increasing the content of elemental mercury. The decrease in the overfire air ratio from 25% to 15% also lowers the temperature in the horizontal flue area and reduces combustion efficiency. This reduces mercury oxidation and increases the content of elemental mercury. Insufficient air and low combustion temperatures in the horizontal flue make mercury difficult to oxidize. As a result, elemental mercury accumulates and deposits in the horizontal flue area.

3.3.3. The Effect of Air Distribution Mode on Mercury Distribution

Figure 15 illustrates that, under varying operating conditions, the temperature difference in the furnace is primarily concentrated in the burner area and at the bottom of the furnace. Notably, the bottom of the furnace does not participate in the combustion reactions. Consequently, its impact on the combustion process and material generation in the boiler is relatively minimal. Therefore, examining and analyzing the bottom of the furnace is unnecessary in the current investigation. In contrast, variations in the air distribution method affect the combustion process in the burner area. The results indicate that the temperature in the burner area is higher with both the positive tower air distribution and uniform air distribution methods. In contrast, the inverted tower air distribution results in a lower temperature in the burner area compared to the other two methods.
Additionally, when applying the positive air distribution method, the secondary air volume at the bottom of the burner is relatively large. In this case, the pulverized coal and secondary air move upwards through the furnace, ensuring thorough mixing. Furthermore, when using the uniform air distribution method, the secondary air flow is evenly distributed across each layer and sprayed into the furnace. This facilitates full contact between the pulverized coal and the secondary air within the furnace. Under both air distribution methods, the pulverized coal fully interacts with the secondary air in the burner area. This results in a more concentrated combustion zone and an increase in the combustion temperature within the furnace. Conversely, when the inverted tower air distribution method is used, the secondary air distribution in the burner area is uneven. In this case, combustion primarily occurs in the upper part of the burner. Furthermore, it is difficult to form a relatively concentrated combustion zone, leading to a lower combustion temperature in the furnace compared to the other two methods.
Furthermore, Figure 16 illustrates the volume fraction distribution of mercury along the furnace height for various air distribution methods. Similarly, Figure 17 depicts the volume fraction distribution of mercury in the sections along the furnace height for different air distribution methods. Based on the results presented in the two figures, it is observed that when the tower air distribution method is employed, the elemental mercury content in the cold ash hopper area is relatively low. This is due to the fact that this method promotes a more complete combustion process within the furnace. This facilitates the oxidation of mercury during combustion, thereby reducing its deposition in the cold ash hopper area. In contrast, when the inverted tower air distribution method is applied, the elemental mercury content in the cold ash hopper area is relatively high. This method creates an insufficient oxidation environment during combustion, hindering the oxidation of mercury. Consequently, this results in significant accumulation in the cold ash hopper area. Additionally, it is shown that all three air distribution methods enable the complete combustion of pulverized coal in the burner area, allowing mercury to fully precipitate. As a result, different air distribution patterns have minimal effect on the mass fraction of elemental mercury in the burner area. However, in the overfire and horizontal flue areas, the positive tower air distribution method results in a relatively high mercury content. This occurs because the air flow in these two areas is lower when using the positive tower air distribution method. Consequently, less elemental mercury is oxidized. Conversely, it is observed that the air distribution in the inverted tower method is the opposite. This air distribution method results in higher air flow in the overfire and horizontal flue areas, leading to the greater oxidation of elemental mercury. Therefore, it can be concluded that the inverted tower air distribution method decreases the elemental mercury content in those two areas.

4. Conclusions

This study investigates a 328.5 MW boiler as the object of research. Simulations were conducted with excess air coefficients of 1.11, 1.16, and 1.21 and overfire air ratios of 15%, 20% and 25%. Moreover, various air distribution methods were examined and implemented to investigate the mercury precipitation and transformation characteristics under different operating conditions. These include inverted tower, equal, and positive tower air distribution methods. Based on the findings of this study, the following conclusions can be drawn:
(1)
The volume fraction of elemental mercury in the cold ash hopper area decreases as the excess air coefficient increases. This can be attributed to several factors. Existing studies have shown that oxygen can oxidize elemental mercury [40]. An increase in the excess air coefficient promotes the oxidation reaction during combustion, making elemental mercury more easily oxidized to its oxidized form, thereby reducing its content. In the burner area, a decrease in the excess air coefficient leads to the incomplete combustion of pulverized coal. Concurrently, a reduction in oxygen availability limits the oxidation of elemental mercury. Consequently, the content of elemental mercury in the burner area remains relatively unchanged. In the burnout and horizontal flue areas, the content of elemental mercury increases as the excess air coefficient decreases. When the excess air coefficient is reduced from 1.21 to 1.16 and 1.11, the content of elemental mercury in the flue gas at the furnace outlet increases by 16.7% and 25.3%, respectively.
(2)
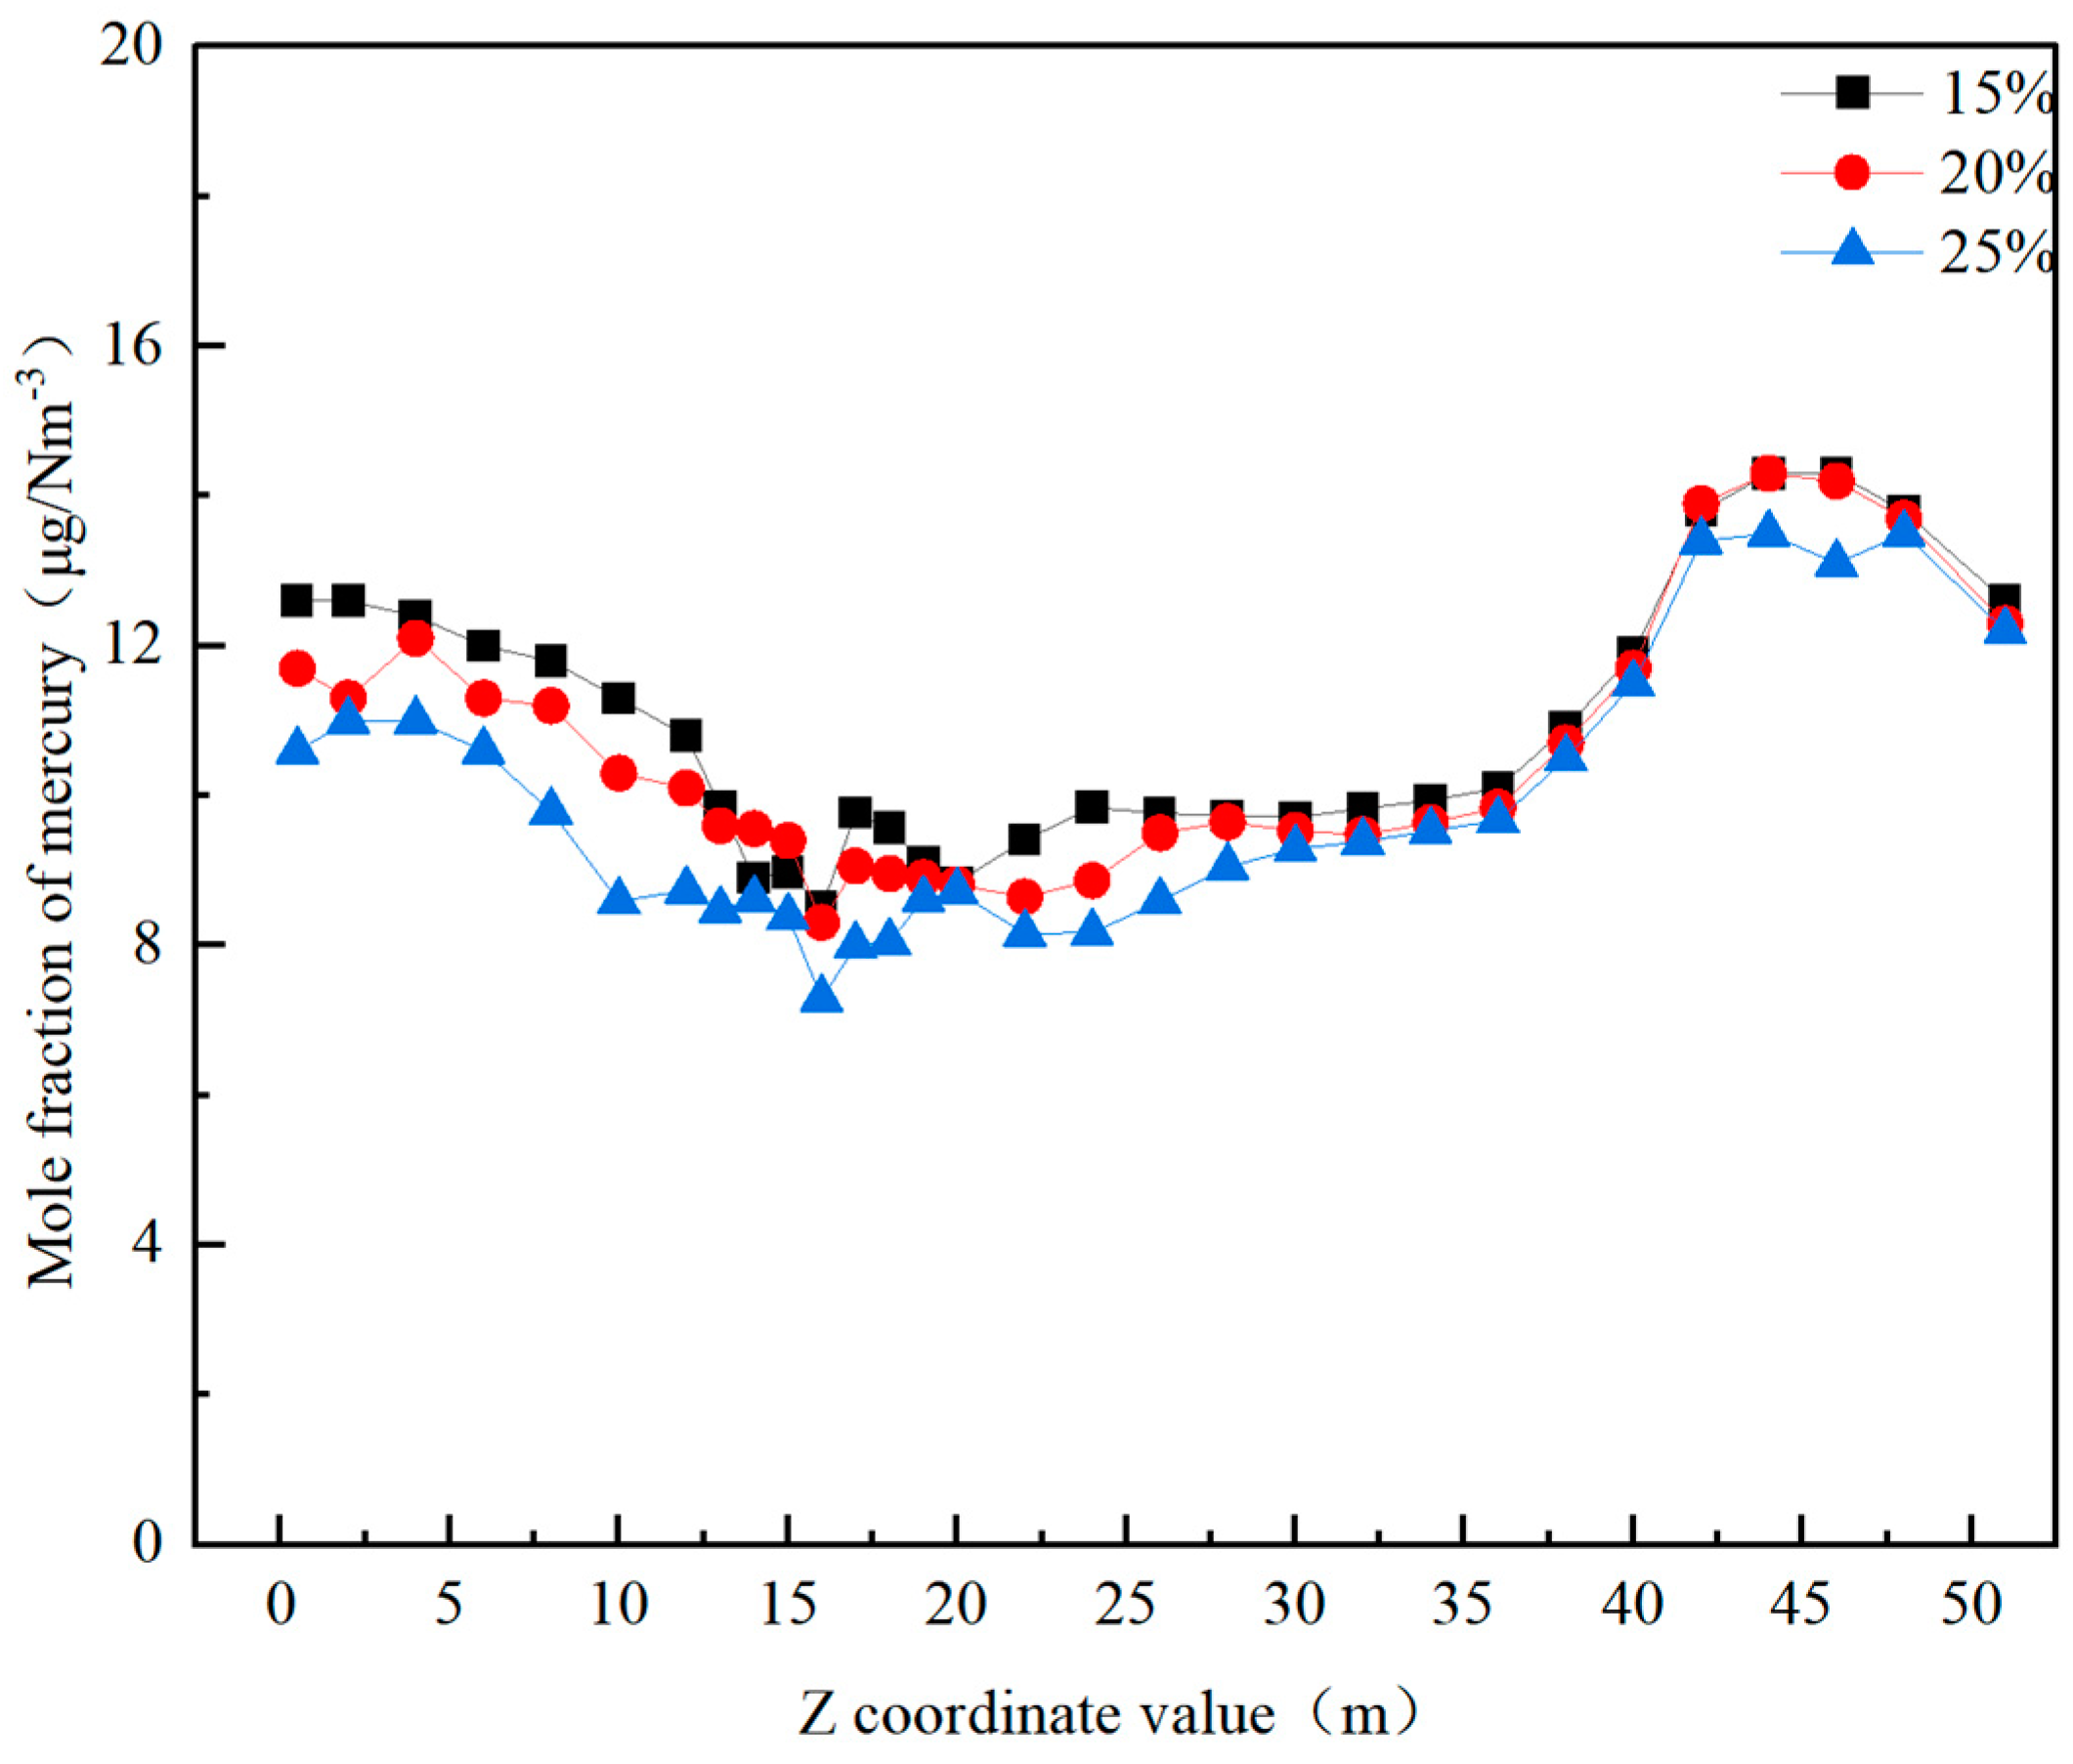
Reducing the burnout air ratio from 25% to 15% leads to an increase in the content of elemental mercury in the cold ash hopper area. This occurs because a reduction in the burnout air ratio lowers the temperature and combustion efficiency in the burner, burnout, and horizontal flue areas, slowing the oxidation rate of mercury and leading to a relatively higher content of elemental mercury. Numerous studies have confirmed the critical role of the combustion temperature and efficiency in mercury oxidation [41]. When the burnout air ratio increases from 15% to 20% and 25%, the content of elemental mercury in the flue gas at the furnace outlet decreases by 5.4% and 7.6%, respectively.
(3)
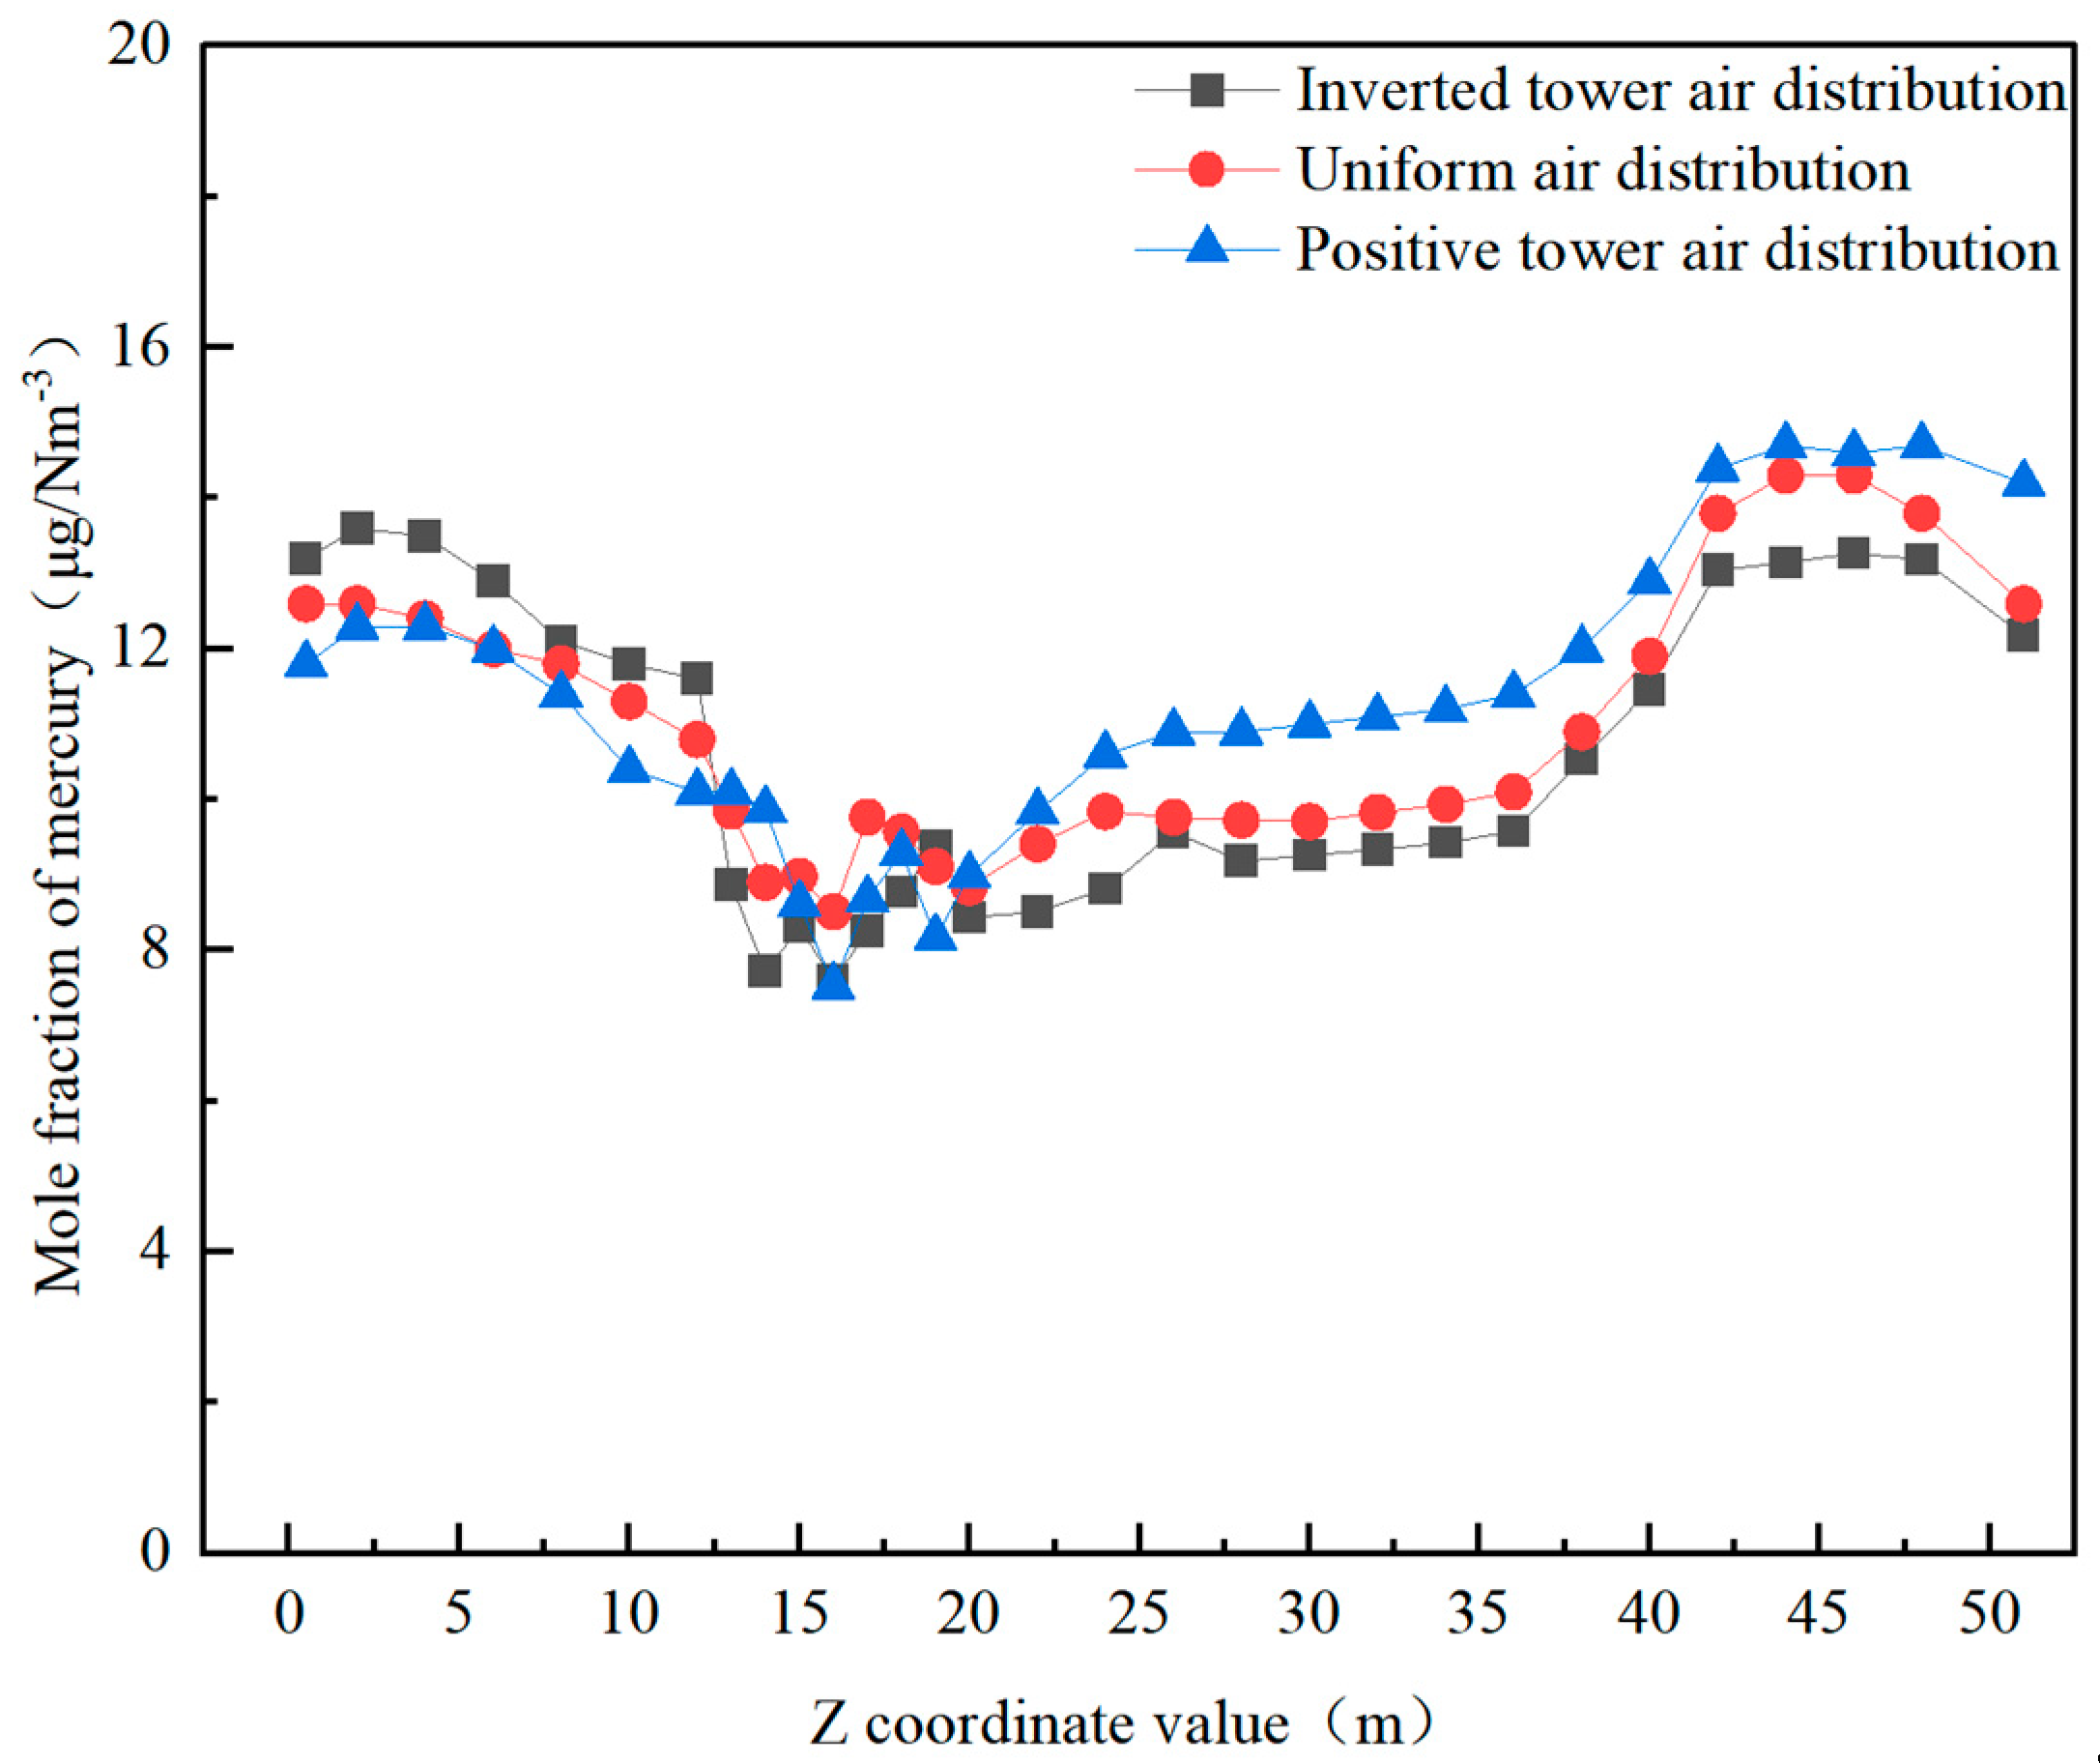
Under different air distribution modes, the content of elemental mercury in the cold ash hopper area is lower with the positive pagoda air distribution method. In contrast, it is relatively higher with the equal and inverted pagoda air distribution methods. The content of elemental mercury in the burner area shows minimal differences among the three air distribution methods. Adopting the inverted pagoda air distribution method in the burnout and horizontal flue areas can reduce the content of elemental mercury. This may be because the inverted pagoda air distribution method better promotes the oxidation reaction during the later stages of combustion, reducing the content of elemental mercury. The content of elemental mercury in the flue gas at the furnace outlet decreases by 7.9%.
In conclusion, this study presents novel ideas and methods for mercury removal from boiler flue gas. Based on the simulation results, the following recommendations are proposed to reduce mercury emissions. First, while maintaining combustion efficiency, reduce the excess air coefficient to limit the generation of elemental mercury in the cold ash hopper area. However, it is crucial to avoid insufficient combustion resulting from an excessively low excess air coefficient. Second, enhance combustion efficiency by optimizing burner design and adjusting the fineness of pulverized coal. Next, improve combustion efficiency in the burner, burnout, and horizontal flue areas. For example, optimize the burner air distribution and increase the furnace temperature to reduce the formation of elemental mercury. Finally, employ the inverted pyramid air distribution method in the burnout and horizontal flue areas to reduce the content of elemental mercury. Simultaneously, factors such as the excess air coefficient, burnout air ratio, and air distribution method must be carefully considered to determine the optimal operating conditions for minimizing mercury emissions. Future research can expand and deepen upon this foundation to further advance the development of this field.
The current numerical simulation method relies on the steady-state assumption, which may not accurately reflect real-world conditions. Additionally, the simplified assumptions regarding the physicochemical properties of mercury may result in inaccuracies in the simulation results. The morphological changes in mercury under varying temperatures, pressures, and atmospheres are complex. It may be challenging to fully and accurately incorporate these changes into the simulation. Moreover, due to the challenges in measuring mercury, obtaining experimental data may be difficult. This complicates the mutual verification of the simulation results with experimental data. To address these limitations, the following improvements can be made. Develop a more accurate dynamic model to simulate the unsteady-state processes in boiler operation more effectively. Conduct in-depth research on the physicochemical properties of mercury and develop a more accurate model to describe its behavior under various conditions.

Author Contributions

Methodology, J.M.; software, J.M.; validation, J.M.; writing—original draft, J.M.; writing—review and editing, B.Y.; visualization, J.M.; supervision, B.Y. All authors have read and agreed to the published version of the manuscript.

Funding

This study did not receive external financial support.

Data Availability Statement

The original contributions presented in this study are included in the article. Further inquiries can be directed to the corresponding author.

Conflicts of Interest

The authors declare no conflict of interest.

References

  1. Fernández-Miranda, N.; Rodríguez, E.; Lopez-Anton, M.A.; García, R.; Martínez-Tarazona, M.R. A new approach for retaining mercury in energy generation processes: Regenerable carbonaceous sorbents. Energies 2017, 10, 1311. [Google Scholar] [CrossRef]
  2. Lv, Q.; Cai, M.; Wang, C.A.; He, Y.; Che, D.F. Investigation on elemental mercury removal by cerium modified semi-coke. J. Energy Inst. 2020, 93, 666–678. [Google Scholar] [CrossRef]
  3. Dvornikov, A.G. Forms of mercury in Donets Basin Coals. Geol. Zh. 1981, 41, 96–101. [Google Scholar]
  4. Zhao, F.H. Experimental Study on the Distribution and Occurrence Mechanism of Harmful Trace Elements in Coal and Leaching of Combustion Products. Ph.D. Thesis, Beijing Graduate School of China University of Mining and Technology, Beijing, China, 1997. [Google Scholar]
  5. Luttrell, G.H.; Kohmuench, J.N.; Yoon, R.-H. An evaluation of coal preparation technologies for controlling trace element emissions. Fuel Process. Technol. 2000, 65–66, 407–422. [Google Scholar] [CrossRef]
  6. Zheng, L.; Liu, G.; Chou, C. Abundance and modes of occurrence of mercury in some low-sulfur coals from China. Int. J. Coal Geol. 2008, 73, 19–26. [Google Scholar] [CrossRef]
  7. Wu, J.; Xie, W.; Tan, J.; Liu, L. Understanding the sources of mercury release from coal: A combined experimental and molecular simulation study. J. Hazard. Mater. 2023, 460, 132429. [Google Scholar] [CrossRef] [PubMed]
  8. Li, X.; Teng, Y.; Zhang, K.; Peng, H.; Cheng, F.; Yoshikawa, K. Mercury migration behavior from flue gas to fly ashes in a commercial coal-fired CFB power plant. Energies 2020, 13, 1040. [Google Scholar] [CrossRef]
  9. Yang, Y.; Liu, J.; Wang, Z. Reaction mechanisms and chemical kinetics of mercury transformation during coal combustion. Prog. Energ. Combust. 2020, 79, 100844. [Google Scholar] [CrossRef]
  10. Contreras, M.L.; Ganesh, N.; Rodilla, I.; Bahillo, A. Assess of biomass co-firing under oxy-fuel conditions on Hg speciation and ash deposit formation. Fuel 2018, 215, 395–405. [Google Scholar] [CrossRef]
  11. Jiang, J.K.; Hao, J.M.; Wu, Y.; Streets, D.G.; Duan, L.; Tian, H.Z. Preliminary establishment of mercury emission inventory from coal combustion in China. Environ. Sci. 2005, 26, 34–39. [Google Scholar]
  12. Galbreath, K.C.; Zygarlicke, C.J. Mercury transformations in coal combustion flue gas. Fuel Process. Technol. 2000, 65, 289–310. [Google Scholar] [CrossRef]
  13. Senior, C.L.; Sarofim, A.F.; Zeng, T.; Helble, J.J.; Mamani-Paco, R. Gas-phase transformations of mercury in coal-fired power plants. Fuel Process. Technol. 2000, 63, 197–213. [Google Scholar] [CrossRef]
  14. Zheng, Y.; Jensen, A.D.; Windelin, C.; Jensen, F. Review of technologies for mercury removal from flue gas from cement production processes. Prog. Energy Combust. Sci. 2012, 38, 599–629. [Google Scholar] [CrossRef]
  15. Liu, H.X.; Chen, Z.M.; Guo, G.F.; Yin, C.M.; Mei, L.L. Review on generation, testing, emission and treatment technologies of Hg in coal-fired flue gas. In Proceedings of the 18th China Electrostatic Precipitator Conference, Nanjing, China, 1 October 2019; pp. 666–673. [Google Scholar]
  16. Wu, X.Q.; Wang, J.X. Analysis of migration and transformation characteristics of mercury in coal-fired power plants. Guangdong Chem. Ind. 2018, 45, 85–87. [Google Scholar]
  17. Zhou, J.S.; Luo ZW Ren, J.L.; Cen, K.F. Study on mercury emission during coal pyrolysis or combustion. Combust. Sci. Technol. 2002, 5, 103–108. [Google Scholar] [CrossRef]
  18. Jin, F. Analysis and Numerical Simulation of Mercury Conversion During Coal Combustion. Master’s Thesis, North China Electric Power University, Beijing, China, 2016. [Google Scholar]
  19. Zhang, H.R. Numerical Simulation of Emission, Migration and Adsorption Purification of Mercury Pollutants in Coal Combustion Process. Master’s Thesis, Nanjing Normal University, Nanjing, China, 2012. [Google Scholar]
  20. Zhu, Y.Q.; Zhou, J.S.; He, S.; Cen, K.F. Numerical simulation of mercury emission during pulverized coal combustion. J. Zhejiang Univ. Eng. Ed. 2009, 43, 942–947. [Google Scholar]
  21. Lyu, Q.; Wang, C.; Liu, X.; Che, D. Numerical Study on the Homogeneous Reactions of Mercury in a 600 MW Coal-Fired Utility Boiler. Energies 2022, 15, 446. [Google Scholar] [CrossRef]
  22. Muhammad, S.; Li, Y.; Yang, H.; Jin, L.; Li, D.; Hu, H. Removal of elemental mercury from coal combustion flue gas by sodium halides impregnated red mud. J. Fuel Chem. Technol. 2024, 53, 1–17. [Google Scholar]
  23. Gao, Z.; Chen, F.; Wang, J.; Wang, T.; Zhang, Y. Study on Mercury Emissions and Ash Characteristics of 600 MW Brown Coal-Fired Unit. Power Gener. Technol. 2023, 44, 543. [Google Scholar]
  24. Triwibowo, D.; Purnomo, D.; Ningrum, R.S.; Triastuti, T.; Afandi, A.Y.; Kusumaningrum, W.B.; Pramasari, D.A.; Kurniawan, Y.D.; Widyaningrum, B.A. Effect of modified boiler ash from sugarcane bagasse for mercury adsorption: Physical and chemical properties. AIP Conf. Proc. 2024, 2973, 020009. [Google Scholar]
  25. Hrdlička, J.; Pilař, L.; Vodička, M.; Skopec, P.; Jeníková, J.; Dvořák, M. Alternative sorbents for mercury capture in flue gas from lignite combustion. Appl. Therm. Eng. 2024, 236, 121875. [Google Scholar] [CrossRef]
  26. Du, Y.; Lv, Q.; Li, D.; Liu, H.; Che, D. CFD investigation on combustion and NOx emission characteristics in a 600 MW wall-fired boiler under high temperature and strong reducing atmosphere. Appl. Therm. Eng. 2017, 126, 407–418. [Google Scholar] [CrossRef]
  27. Che, D. Boilers-Theory, Design and Operation, 1st ed.; Xi’an Jiaotong University Press: Xi’an, China, 2008; p. 245. [Google Scholar]
  28. Fang, Q. Numerical Simulation Methods and Applications of Combustion; China Electric Power Press: Beijing, China, 2017. [Google Scholar]
  29. Zhao, J.X. Numerical Simulation of Combustion; Science Press: Beijing, China, 2002. [Google Scholar]
  30. Ma, L.; Fang, Q.; Yin, C.; Wang, H.; Zhang, C.; Chen, G. A novel corner-fired boiler system of improved efficiencyand coal flexibility and reduced NOx emissions. Appl. Energy 2019, 238, 453–465. [Google Scholar] [CrossRef]
  31. Hurt, R.; Sun, J.K.; Lunden, M. A kinetic model of carbon burnout in pulverized coal combustion. Combust. Flame 1998, 113, 181–197. [Google Scholar] [CrossRef]
  32. Yao, G.; Han, X.; Liu, Z.; Tang, H.; Zhou, Y.; Wang, Z. Low-NOx study of a 600 MW tangentially fired boiler based on pulverized coal preheating method. Case Stud. Therm. Eng. 2023, 48, 103156. [Google Scholar] [CrossRef]
  33. Gu, W.; Zheng, Z.; Zhao, N.; Wang, X.; Cheng, Z. Combustion characteristics of a 660 MW tangentially fired pulverized coal boiler considering different loads, burner combinations and horizontal deflection angles. Case Stud. Therm. Eng. 2024, 64, 105520. [Google Scholar] [CrossRef]
  34. Vuthaluru, R.; Vuthaluru, H.B. Modelling of a wall fired furnace for different operating conditions using FLUENT. Fuel Process. Technol. 2006, 87, 633–639. [Google Scholar] [CrossRef]
  35. Haas, J.; Tamura, M.; Weber, R. Characterization of coal blends for pulverized fuel combustion. Fuel 2001, 80, 1317–1323. [Google Scholar] [CrossRef]
  36. Vasquez, S.A.; Ivanov, V.A. A Phase Coupled Method for Solving Multiphase Problems on Unstructured Meshes. In Proceedings of the ASME 2000 Fluids Engineering Division Summer Meeting, Boston, MA, USA, 11–15 June 2000. [Google Scholar]
  37. Hill, S.C.; Smoot, L.D. Modeling of nitrogen oxides formation and destruction in combustion systems. Prog. Energ. Combust. 2000, 26, 417–458. [Google Scholar] [CrossRef]
  38. Guo, X.; Zheng, C.G.; Xu, M. Characterization of mercury emissions from a coal-fired power plant. Energy Fuels 2007, 21, 898–902. [Google Scholar] [CrossRef]
  39. Liu, H.; Liu, Y.; Yi, G.; Li, N.; Che, D. Effects of air staging conditions on the combustion and NOx emission characteristics in a 600 MW wall fired utility boiler using lean coal. Energ. Fuel. 2013, 27, 5831–5840. [Google Scholar] [CrossRef]
  40. Preciado, I.; Young, T.; Silcox, G. Mercury oxidation by halogens under air-and oxygen-fired conditions. Energy Fuels 2014, 28, 1255–1261. [Google Scholar] [CrossRef]
  41. Wilcox, J.; Rupp, E.; Ying, S.C.; Lim, D.H.; Negreira, A.S.; Kirchofer, A.; Feng, F.; Lee, K. Mercury adsorption and oxidation in coal combustion and gasification processes. Int. J. Coal Geol. 2012, 90, 4–20. [Google Scholar] [CrossRef]
Figure 1. Overall structure of the boiler, layout of the burners, and a schematic diagram of the tangentially fired burners.
Processes 12 02910 g001
Figure 2. Schematic diagram of grid divisions of the boiler.
Processes 12 02910 g002
Figure 3. Temperature distribution along the height direction of the furnace with different grid numbers.
Processes 12 02910 g003
Figure 4. Comparison between the simulation results and experimental data.
Processes 12 02910 g004
Figure 5. Distribution cloud map of the main parameters of the boiler in the furnace: (a) speed cloud map, (b) speed vector map, (c) temperature cloud map, (d) oxygen cloud map, (e) carbon monoxide cloud map, and (f) nitrogen oxide cloud map.
Processes 12 02910 g005aProcesses 12 02910 g005b
Figure 6. Volume distribution cloud map of mercury in the central section of the furnace.
Processes 12 02910 g006
Figure 7. Volume distribution of average mercury in the sections along the height direction of the furnace.
Processes 12 02910 g007
Figure 8. Cloud map of the speed distribution at the center of the furnace under different excess air coefficients. (a) α = 1.11; (b) α = 1.16; (c) α = 1.21.
Processes 12 02910 g008
Figure 9. Cloud map of the temperature distribution at the center of the furnace under different excess air coefficients. (a) α = 1.11; (b) α = 1.16; (c) α = 1.21.
Processes 12 02910 g009
Figure 10. Cloud map of the volume fraction distribution of mercury in the central section of the furnace under different excess air coefficients. (a) α = 1.11; (b) α = 1.16; (c) α = 1.21.
Processes 12 02910 g010
Figure 11. Distribution of the average mercury volume fraction in the sections along the furnace height under different excess air coefficients.
Processes 12 02910 g011
Figure 12. Cloud map of the temperature distribution in the central section of the furnace under different overfire air ratios. (a) 15%; (b) 20%; (c) 25%.
Processes 12 02910 g012
Figure 13. Cloud map of the volume fraction distribution of mercury in the central section of the furnace under different overfire air ratios. (a) 15%; (b) 20%; (c) 25%.
Processes 12 02910 g013
Figure 14. Distribution of the mercury volume fraction in the sections along the height of the furnace under different overfire air ratios.
Processes 12 02910 g014
Figure 15. Cloud map of the temperature distribution in the central section of the furnace with different air distribution methods. (a) Inverted tower air distribution; (b) Uniform air distribution; (c) Positive tower air distribution.
Processes 12 02910 g015
Figure 16. Cloud map of the volume fraction distribution of mercury in the central section of the furnace with different air distribution methods. (a) Inverted tower air distribution; (b) Uniform air distribution; (c) Positive tower air distribution.
Processes 12 02910 g016
Figure 17. Distribution of mercury volume fraction in the sections along the height of the furnace with different air distribution methods.
Processes 12 02910 g017
Table 1. Main parameters of the boiler.
ParameterMCRControl Load
Superheater steam flow rate1110 T/h721.5 T/h
Superheater outlet steam pressure174 bar174 bar
Superheater outlet steam temperature540 °C540 °C
Reheater steam flow rate878.8 T/h592 T/h
Reheater inlet steam temperature328 °C298 °C
Reheater inlet steam pressure37.8 bar25.1 bar
Reheater outlet steam temperature540 °C540 °C
Reheater outlet steam pressure35.6 bar23.7 bar
Economizer inlet feedwater temperature296 °C268 °C
Economizer inlet feedwater pressure196.6 bar180.7 bar
Table 2. Pulverized coal content.
ComponentSymbolActual Coal Quality
Total moisture M a r 13.4%
Ash A a r 14.65%
Volatile matter V a r 26.37%
Carbon C a r 58.96%
Hydrogen H a r 3.41%
Nitrogen N a r 0.82%
Sulfur S a r 0.37%
Oxygen O a r 8.39%
Low calorific value Q n e t , a r 22,440 kJ/kg
Table 3. Operating parameters and boundary condition settings.
ItemValue
Primary air velocity24.09 m/s
Secondary air velocity45.49 m/s
Overfire air velocity34.63 m/s
Primary air temperature607 K
Secondary air temperature612 K
Coal feed rate127.4 t/h
Total air flow rate1190 t/h
Excess air coefficient1.21
Table 4. Related reactions and kinetic parameters of mercury.
Elementary ReactionPre-Exponential Factor, ATemperature Coefficient, βActivation Energy, E (cal/mol)
Hg + Cl + M = HgCl + M [18,35]2.40 × 1081.4−14,400
Hg + Cl2 = HgCl + Cl [18,35]1.39 × 10140.034,000
HgCl + Cl2 = HgCl2 + Cl [18,35]1.39 × 101401000
Hg + HOCl = HgCl + OH [18,35]4.27 × 1013019,000
Hg + HCl = HgCl + H [18,35]4.94 × 1014079,300
HgCl + HCl = HgCl2 + H [18,35]4.94 × 1014021,500
Cl + Cl + M = Cl2 + M [18,35]14.40−1800
H + Cl + M = HCl + M [18,35]1700
HCl + H = H2 + Cl [18,35]13.3603500
H + Cl2 = HCl + Cl [18,35]13.9301200
O + HCl = OH + Cl [18,35]3.532.873510
O + Cl2 = ClO + Cl [18,35]12.7903585
O + ClO = Cl + O2 [18,35]13.20−193
Cl + HO2 = HCl + O2 [18,35]13.030894
Cl + HO2 = OH + ClO [18,35]13.390−388
ClO + H2 = HOCl + H [18,35]11.78014,100
H + HOCl = HCl + OH [18,35]13.9807620
Cl + HOCl = HCl + ClO [18,35]12.260258
Cl2 + OH = Cl + HOCl [35]12.101810
O + HOCl = OH + ClO [35]12.7804372
HOCl + M = OH + Cl + M [18,35]10.25−356,720
Hg + ClO2 = HgO + ClO [35]1.87 × 107051,270
Hg + O3 = HgO + O2 [35]7.02 × 1014042,190
Hg + N2O = HgO + N2 [35]5.08 × 1010059,810
HgO + HCl = HgCl + OH [35]9.63 × 10408920
HgO + HOCl = HgCl + HO2 [35]4.11 × 1013060,470
Hg + ClO = HgO + Cl [35]1.38 × 101208320
Disclaimer/Publisher’s Note: The statements, opinions and data contained in all publications are solely those of the individual author(s) and contributor(s) and not of MDPI and/or the editor(s). MDPI and/or the editor(s) disclaim responsibility for any injury to people or property resulting from any ideas, methods, instructions or products referred to in the content.

