Article

Optimal Economic and Environmental Aspects in Different Types of Loads via Modified Capuchin Algorithm for Standalone Hybrid Renewable Generation Systems

by
Moayed Mohamed
1,
Ali M. El-Rifaie
2,*,
Ilyes Boulkaibet
2 and
Ahmed Elnozahy
3
1
Faculty of Technology and Education, Suhag University, Sohag 82524, Egypt
2
College of Engineering and Technology, American University of the Middle East, Egaila 54200, Kuwait
3
Faculty of Engineering, Assiut University, Assiut 71515, Egypt
*
Author to whom correspondence should be addressed.
Processes 2024, 12(12), 2902; https://doi.org/10.3390/pr12122902
Submission received: 11 November 2024 / Revised: 11 December 2024 / Accepted: 12 December 2024 / Published: 18 December 2024
(This article belongs to the Special Issue Advances in Renewable Energy Systems (2nd Edition))

Abstract

:
Greenhouse gas emissions have become a significant concern for many countries due to their effect on the global economy and environment. This work discusses a standalone hybrid renewable generation system (HRGS) for use in isolated areas with different load demand profiles. Three load profiles were studied in this work: educational, residential, and demand-side management (DSM)-based residential load profiles. To investigate the economic and environmental aspects, a proposed modified capuchin search algorithm (MCapSA) was implemented, and the obtained results were compared with those of different conventional optimal procedures, such as the genetic algorithm (GA), particle swarm optimization (PSO), and HOMER. The Levy flight distribution method, which is based on random movement, enhances the capuchin algorithm’s search capabilities. The cost of energy (CoE), electric source deficit (ESD), greenhouse gas (GHG) emissions, and renewable factor (RF) indicators were all optimized and estimated to emphasize the robustness of the proposed optimization technique. The results reveal that the shift in the residential load profile based on individual-household DSM-scale techniques leads to significant sharing of renewable sources and a reduction in the utilization of diesel generators, consequently diminishing GHG emissions. The proposed MCapSA achieved optimal values of economic and environmental aspects that are equal to or less than those achieved through PSO. From the overall results of the three scenarios, the modified algorithm gives the best solution in terms of GHG, COE, and ESD compared to other existing algorithms. The usage of MCapSA resulted in decreases in COE and GHG in three types of loads. The robustness and effectiveness of MCapSA are demonstrated by the fact that the DSM-based optimal configuration of the renewable energy sources produces the lowest CoE and GHG emissions of 0.106 USD/kWh and 137.2 kg, respectively.

1. Introduction

Hybrid renewable energy generation systems combine many sources, such as wind and photovoltaic energy, and batteries that are used to store electrical power. Clean energy is being increasingly adopted due to the effects of pollution and climate change resulting from the utilization of fossil fuels [1]. This work focuses on techno-economic viability and sustainability, and the main target was to reduce COE, LPSP, and GHG in different types of load in areas of Sohag University (Faculty of Technology and Education). To reduce these factors, the authors used optimization techniques such as PSO and the capuchin algorithm to obtain the best solutions and also created a modified version of the capuchin algorithm and compared its results with those of HOMER Pro [2].
Optimization algorithms were used in this work to decrease the values of COE, LPSP, and GHG to obtain the best values for a techno-economic probability analysis of an HRGS. The energy sources were PV systems and wind turbines, used in parallel with a lower percentage of diesel and stored battery power. PSO was used in this work, and its COE results were compared with those of the software HOMER Pro [3]. The capuchin algorithm is an advanced technique used to solve problems with mathematical algorithms. The lifestyle of capuchin monkeys is largely arboreal, and they spend all their time in groups of males and females. The modified capuchin algorithm simulates the monkeys’ behavior in obtaining food while they are above trees and moving in groups [4]. The authors improved the capuchin algorithm, making it suitable for determining the optimal economic and environmental indices of HRGSs. The reason for modifying the capuchin algorithm was to obtain the best solutions by way of utilizing the development of economic sizing in different load scenarios. Moreover, AI techniques are being used in HRGSs for tasks like defect detection, predictive maintenance, and component optimization, going beyond control techniques. Inverters, batteries, and monitoring devices are examples of HRGS components whose data may be analyzed using machine learning algorithms such as reinforcement learning and deep learning, allowing for proactive maintenance interventions and early problem identification [5].
Most of the previous literature is important and focuses on the HRGSs and energy management systems of islanded areas. Davarpanah et al. [6] studied a system of standalone hybrid generation systems. Bassam Abu-Hijleh et al. [7] focused on energy economics and the regulations of green buildings in Dubai. Ahmed Elnozahy et al. [8] were interested in the optimal economics for HRGES in a standalone area (Sues University). Nsafon et al. [9] designed optimization techniques for a hybrid diesel, wind farm, and decentralized PV energy generation system and performed a sustainability analysis of this system. Khan et al. [10] studied a hybrid PV, diesel, battery storage, and wind generation system with techno-economic feasibility in a Punjab city in India. Mandal et al. [11] explored the rural electrification application of a standalone system with hybrid generation in Bangladesh. Keyvandarian et al. [12] focused on an application of HRG that approached distribution through the uncertain nature of energy. Babaei et al. [13] performed an analysis of a standalone (Pelee Island) HRGS application to optimize sizing. Mokhtara et al. [14] focused on the energy management of a hybrid generation system. Tezer et al. [15] studied a system of hybrid renewable energy and created an optimization technique for this system. Moretti et al. [16] designed an application for an isolated system through two layers with a hybrid microgrid. Abba et al. [17] introduced optimum-based load demand forecasting and optimum location sizing (Nigeria). Das et al. [18] designed and optimized a standalone system with electrical and thermal loads. Zhang et al. [19] designed an optimization method to find the appropriate sizing of a system in an isolated area with a mix of renewable generation sources, including hydrogen and weather conditions such as wind.
A predictive model was developed and utilized to predict the NOx emissions in coal-fired boiler systems. The proposed model was compared with convolutional neural networks (CNNs). The outcomes revealed that the developed predictive model was faster in training time, with a lower root mean square error (RMSE) and mean absolute error (MAE) [20]. Economic and environmental optimization issues were investigated in a hybrid renewable energy generation system consisting of photovoltaics, biogas, and hydropower sources along with a battery storage system. The authors used HOMER Pro software as an optimization tool. The results showed that the optimal economic and environmental configuration of the hybrid system was achieved along with the lowest cost of energy (CoE), minimal GHGs and pollutants, and high reliability of the optimal configuration with the lowest energy shortage [21]. A mathematical technique was proposed to find the optimal size and location of hybrid renewable energy sources. The proposed system consists of a PV source and wind turbines that feed a water desalination system. The target of this research was to maximize the profit of renewable energy sources as well as increase the system efficiency. A machine learning technique based on long short-term memory networks was utilized. The outcomes revealed a significant reduction in the total cost of the proposed system, which verified the robustness and effectiveness of the proposed technique [22].
The motivation for this work was to reduce dependence on fossil fuels and obtain the best value in the sizing and cost of electricity by reducing the CoE. The authors used three types of loads in the HRGS in this study: educational, residential, and DSM-based residential loads.
This work discusses a standalone hybrid renewable generation system (HRGS) for use in isolated areas with different load demand profiles. An MCapS algorithm was developed to investigate aspects of economic and environmental aspects, and the results were compared with those of the normal optimal procedures, namely, PSO, GA, and HOMER. The research objective of this work was to obtain the sizing of hybrid renewable energy sources in three different load scenarios in an isolated area at Sohag University with different algorithms.
The remainder of this work is structured as follows: Section 2 describes the system configuration, including the modeling of the system components and the three different load profiles. The conventional optimization methods as well as the proposed optimization method are introduced in Section 3. The economic and reliability objective functions are analyzed in Section 4, while Section 5 presents the acquired simulation results and discussion. Finally, Section 6 summarizes the most important research findings.

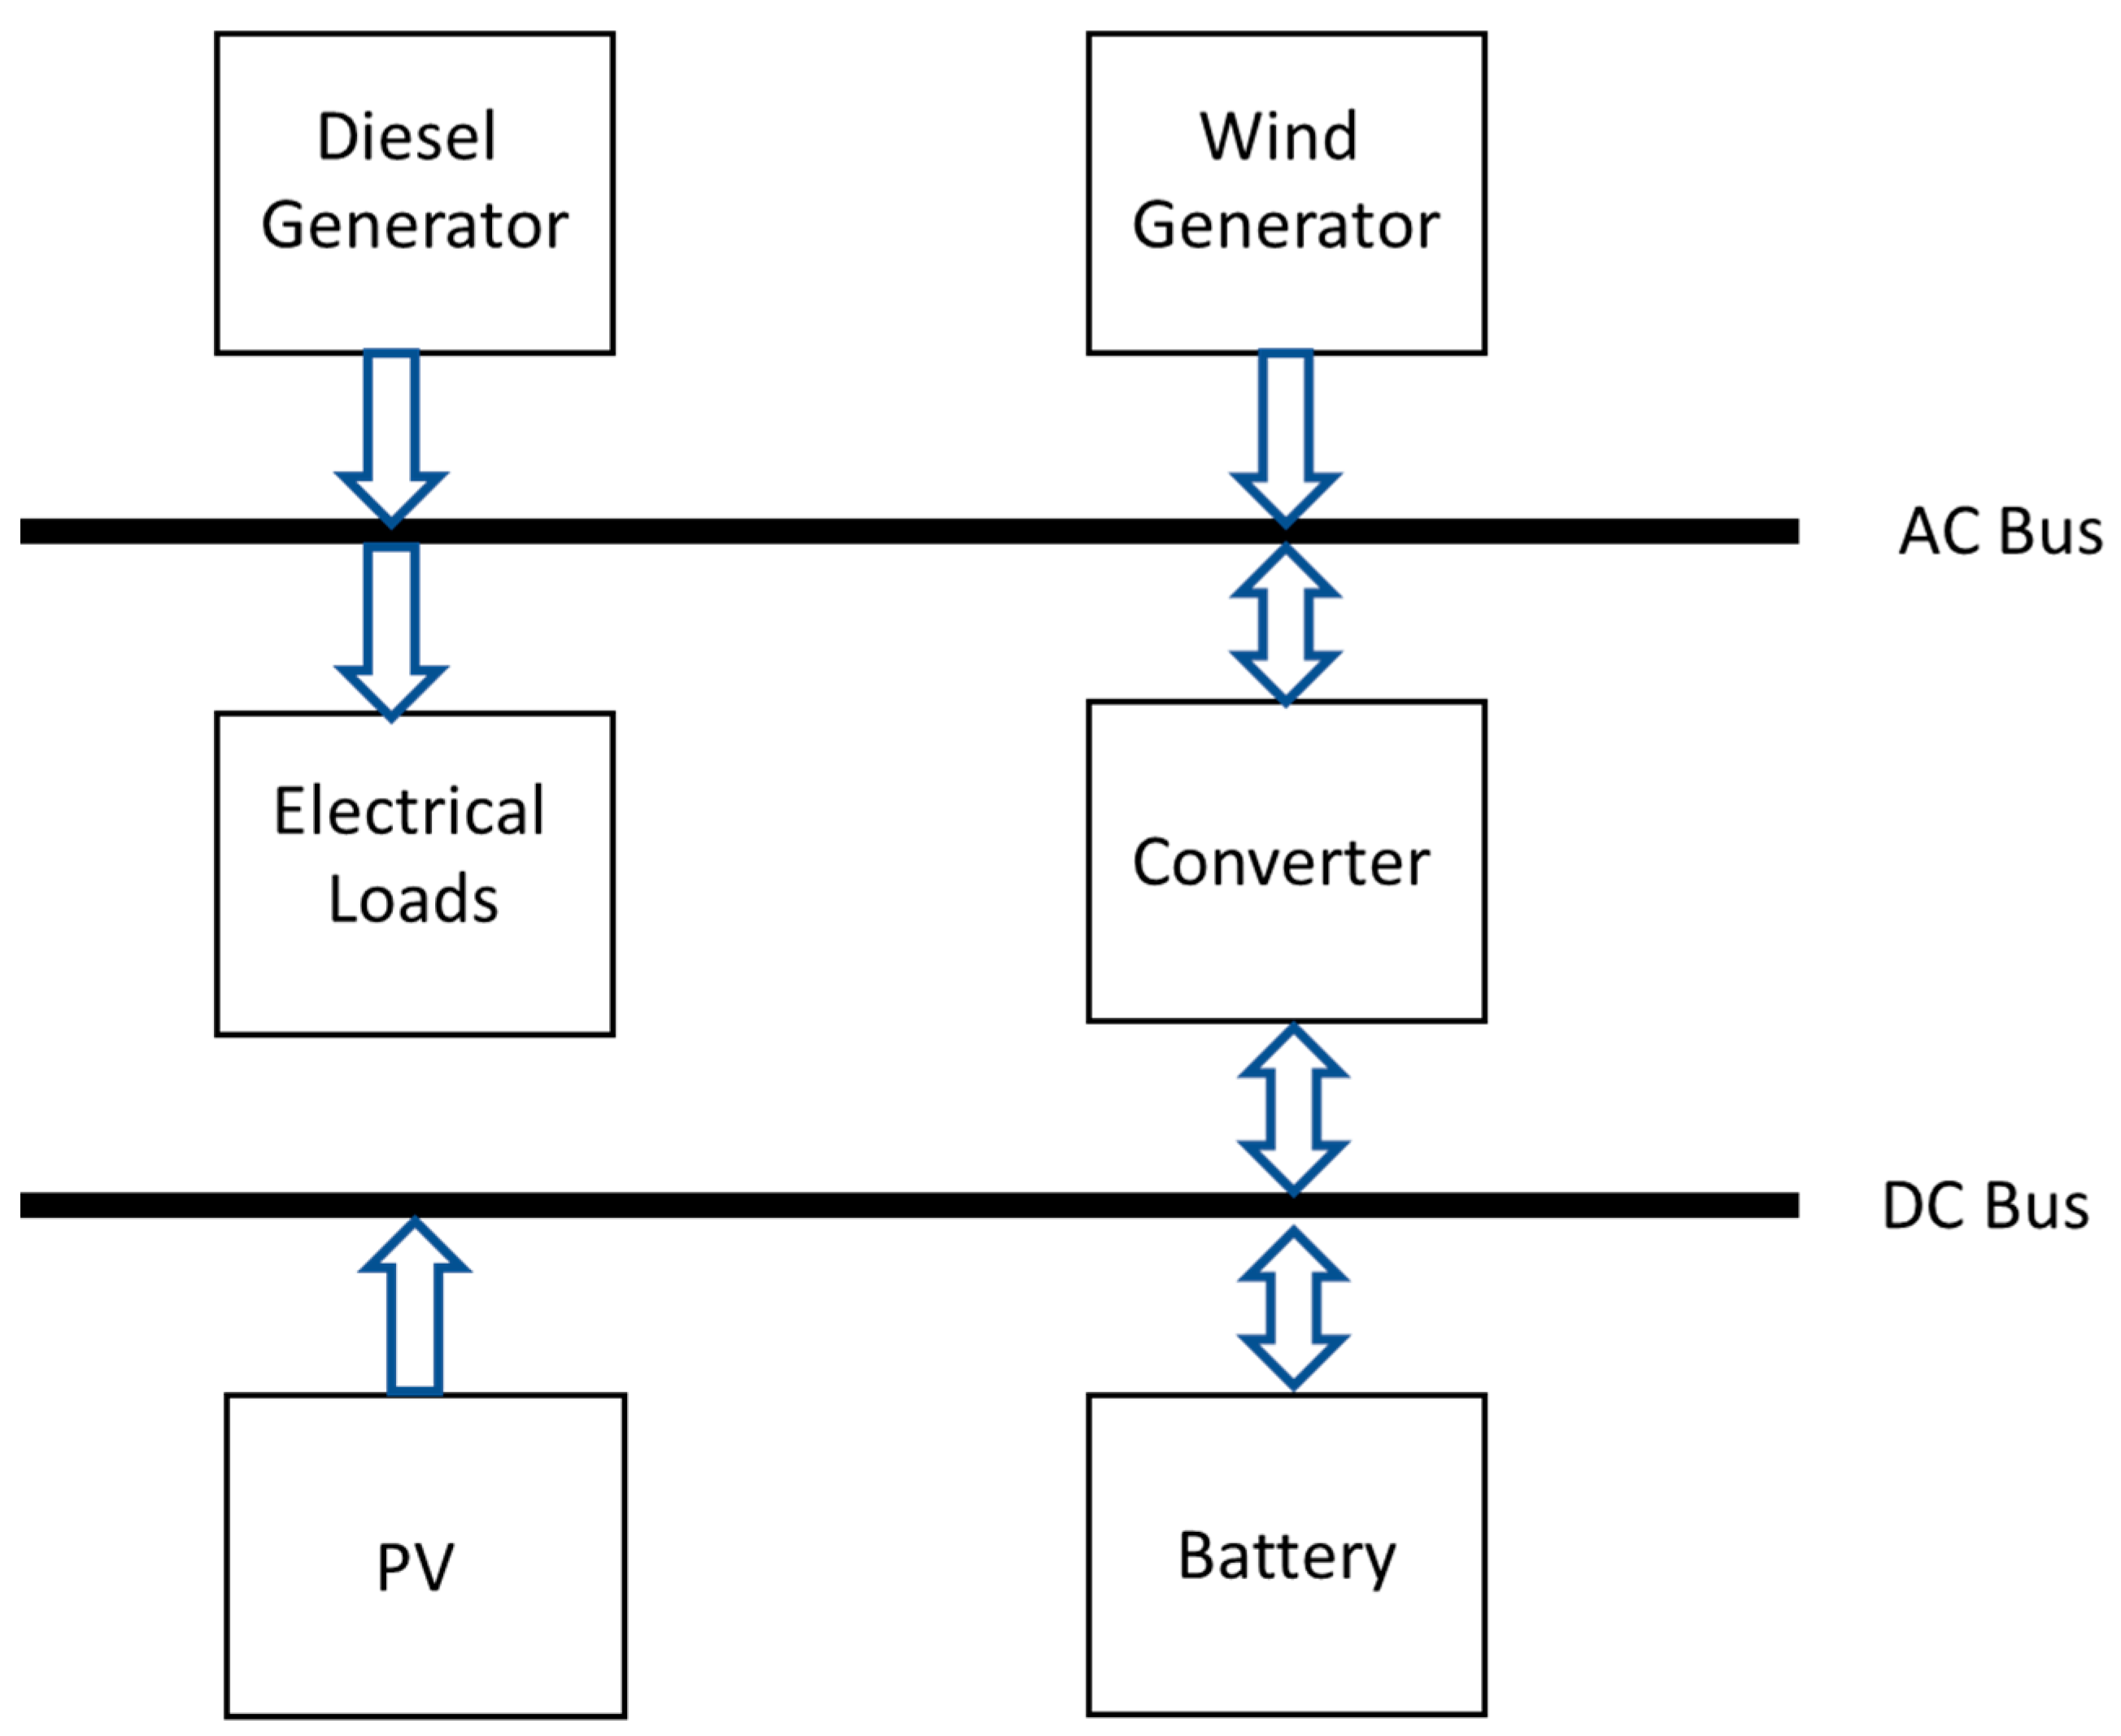
2. System Description

Figure 1 depicts the standalone HRGS components. The proposed HRGS consists of renewable sources, namely, photovoltaic and wind turbine generation, along with a diesel generator in addition to batteries for storage purposes. A converter is used to convert the DC to AC. The batteries’ charging process is managed by the solar charge controller (SCC), while the PV source’s output voltage and current are controlled by a DC/DC converter.

2.1. PV Source

PV sources are used to generate electric power and are the main sources of renewable energy in Egypt. The location of Sohag University benefits from a clear sky and high solar irradiance throughout the year, with a maximum value of 1050 W/m2, as depicted in Figure 2. The wide utilization of PV power has increased the need to determine total costs and minimize COE [23]. The power from the model’s PV source transported to every panel at time t is dependent on the obtainable PV irradiance (S) and temperature (Tc) calculated in Equation (1):
P p v ( t ) = P p v r e f S t S r e f 1 + β r e f T C t T r e f
where:
T C t = T a t + N O C T 20 800 S
where NOCT is the normal operating temperature, which demonstrates the temperature of the cell after the panel’s PV operation at 800 W/m2 of PV irradiance. The temperature is 20 °C and is typically between 42 °C and 46 °C. Figure 2 shows the hourly horizontal PV irradiance for one year, as determined from historical SODA data for the chosen area (Sohag University campus at a latitude of 26.5° N and longitude of 31.7° E) during the period from 1 January 2021 to 31 December 2021. The temperature of this zone is shown in Figure 3.

2.2. Wind Generation Turbines

Wind turbines are renewable generation resources suitable for some areas in Egypt [24]. In DFIG wind generation, the power obtained from the wind (Pw) is computed as shown in Equation (3).
P w = 1 2 ρ a A W ν 3
where the mechanical power of the turbine follows Equation (4):
P W T = P r   V 3 t V c i 3 V r 3 V c i 3 , V c i V V r P r V r V   V c o 0 V c o V       o r     V V c i
P r = 1 2 C p ρ a A W V r 3
where Cp is the power coefficient, Vci is the cut-in, and Vco is the cut-out wind turbine speed. The wind speed is affected by factors including height, and the wind speed of the hub at a specified location can be computed from the next equation. h W T is the height of the hub of the source wind turbine, and h r e f is a reference point height with a wind gauge number. The tension number is a speed function for the wind, temperature, height above ground level, unevenness of land, and time of year, and the mutual value α is one-seventh of the value [25]. Figure 4 shows hourly wind speed from old SODA data for the chosen area from the first of January 2021 to 31 December 2021.
V W T t = V r e f t h W T h r e f α

2.3. Diesel Generator

Diesel generators are used as an alternative means of providing AC load, but they are not widely used by other authors due to requirements for renewable energy [26]. The output power from a diesel generator utilized by the university is 2 kW. The cost of replacing this diesel generation is expected to be USD 1000 per kW. The O&M cost of diesel generation is equal to 0.39 USD/kWh. These generators are operated 24 h a day. The determination of the Condis value is demonstrated in Equation (7). The hourly cost of diesel fuel can be obtained from Equation (8).
c o n d i s t = B g P d i s r + A g P d i s t
C d i s f = c o n d i s t f d i s

2.4. Battery Storage

Battery storage is required to store energy demand for the load. However, battery storage may not be a suitable means of storing energy in these renewable energy systems because of the changes in weather. The battery charge reaches an energy equilibrium among the hybrid resource systems and the isolated loads after a certain time [27]. The stored battery capacity in kWh is determined using Equation (9), where the number of battery autonomy days, AD, is approximately 3–5. Typical values for DOD, η B a t t , and η i n v are 80%, 85%, and 95%, respectively [28].
E B a t t = E 1 A D D O D η B a t t η i n v
where η B a t t is the battery efficiency, E is the average load demand, and AD is the number of autonomy days. Battery power restraints in the battery bank are used to manage surplus electricity generation of the power system. These conditions, along with the absence of energy in the battery bank, are depicted in Equations (10) and (11), respectively.
P g t = E l ( t ) η i n v P p v t + P w t + P d i s t        
P b a t t t = P b a t t t 1 1 σ P g t η b a t t ;                           P g t < 0 P b a t t t 1 1 σ P g t ;                                         P g t 0
Each battery has a preliminary charge equal to 20% of its rated capacity, which decreases the impact of the absence of the storage battery. The minimum and maximum capacity for the battery charger, Ebmin and Ebmax, are specified in Equations (12) and (13), respectively.
E b m i n E b a t t t E b m a x
E b m i n = 1 D O D E b m i x

2.5. Power Converter

The DC generation of the system is achieved via a PV module and battery storage. Consequently, DC/AC and AC/DC converters are compulsory. The inverter efficiency ( η i n v ) can be determined from Equation (14).
P i n v = P l m η i n v

2.6. Load Profile

In this work, there are three classifications of loads: educational, residential, and DSM-based residential. Figure 4, Figure 5 and Figure 6 depict the load profiles for the three types of loads for one day in winter and one day in summer. Regarding educational load, Figure 4 presents the loads of the Faculty of Technology and Education at Suhag University, with maximum peak loads of 441 and 483 kW at 1 p.m. and 12 p.m. for winter and summer, respectively. The peak load occurs at midday when all the employees in the faculty are still in their offices. Furthermore, it is obvious that the load varies somewhat during the operation hours of 8 a.m. to 3 p.m.
Figure 5 presents a winter and summer day load profile of 10 small-scale households. It is worth noting that the winter and summer peak loads of 30 and 49 kW, respectively, occurred around 7 p.m.
Considering the demand-side management (DSM) in individual households and the behavior of the consumers, the operating times of some appliances, such as washing machines, electric water heaters, irons, and vacuum cleaners, could be shifted to operate at peak hours of solar irradiation during the daytime. Consequently, the peak loads of 33 and 68 kW occur at 11 a.m and 12 p.m. in winter and summer, respectively, as shown in Figure 6. The average daily DSM-based residential loads in winter and summer are shown in Figure 7a and Figure 7b, respectively.

3. Optimization Methods

3.1. PSO Algorithm

The PSO algorithm is used to explain many problems and is modified to amend its conjunction properties. The PSO algorithm reveals further details on the particle swarm optimization organizing system [29,30]. Each particle’s rapidity is independently updated using the following equations:
X i t + 1 = w u i t + c 1 r 1 x ^ i t x i t + c 2 r 2 g t x i t   0 c 1 ,   c 2 2                                                                                    
where r1 and r2 are random values ( 0 r 1 , r 2 1) regenerated for each velocity.
The velocity of all particles is reduced in Equation (16):
v i t + 1 = w v i t + c 1 r 1 x ^ i t x i t + c 2 r 2 g t x i t
The positions of separate particles remain unchanged when employing Equation (17):
x i t + 1 = x i t + v i t + 1

3.2. Capuchin Search Algorithm (CapSA)

The CapSA algorithm is an innovative algorithm that emulates the hunting behavior of capuchins [31,32], such as their leaping, swinging, and climbing to investigate for food during foraging. Capuchins are social animals that move in forests as a household group consisting of adult females, males, and small monkeys. The foraging movement of capuchins can be simulated via optimization algorithms. The demonstrated capuchin search algorithm is built on three motion mechanisms as follows:
(a)
Leaping motion
Capuchins frequently leap from branch to branch to find food sources, and this behavior has been imitated in research on various devices. It is articulated by the third law of motion as follows:
x = x 0 + v 0 t + 1 2 a t 2
including the initial location of the capuchin, the initial speed of the capuchin, and the time. This equation is modified as follows:
x = x 0 + v 0 2 sin 2 θ 0 g
(b)
Swinging motion
The pendulum-like swinging motion and the movement can be described as follows:
x = L sin θ
(c)
Climbing motion
This movement is simulated by local searching. The climbing motion can be represented as follows:
x = x 0 + v 0 t + 1 2 v v 0 t 2
The following steps describe the capuchin algorithm.
The initial populations of the capuchins are generated randomly as follows:
X i = L b + U b L b × r a n d
where L b and U b are lesser and higher boundaries. r a n d is a random value within [0–1]. The motion of the capuchins can be categorized as the leader motion or the follower motion. The leader motion is formulated as follows:
X i = F + P b f v i 2 sin ( 2 θ ) g   i < n / 2 ; 0.1 < ϵ 0.20
in which:
θ = 3 2 r
where r is a random factor in the range [0–1]. F denotes the food position. ϵ is a random value. P b f refers to the balance probability provided by the capuchin’s tail. An adaptive parameter was utilized for balancing the exploration process, and it can be formulated as:
τ = β 0 e β 1 t T β 2
where t and T are the maximum iteration current. β 0 , β 1 , and β 2 are constant values that were selected to be 2, 21, and 2, respectively. The movement of the alpha capuchin to find food on the ground occurs over a wide area when the food in trees is low. The motion of the alpha capuchin and the followers is as follows:
X i = F + P e f P b f v i 2 sin ( 2 θ ) g i < n / 2 ; 0.2 < ϵ 0.30
X i = X i + v i   i < n 2   ;   0.3 < ϵ 0.50
v i = ρ X i + τ a 1 X b e s t i X i r 1 + τ a 2 F X i r 2
a 1 and a 2 are two parameters that assign the effects of F and X b e s t i to the velocity. X b e s t i is the best position. r 1 and r 2 refer to random values. ρ denotes an inertia coefficient that was selected to be 0.7. The capuchins swing on trees to pick the food, and this motion is described in Equation (29).
X i = F + τ P b f × sin ( 2 θ )   i < n / 2 ; 0.5 < ϵ 0.75
The capuchins climb the trees several times. This motion is represented as follows:
X j i = F j + τ P b f v j i v j 1 i   i < n / 2 ; 0.75 < ϵ 1.0
The capuchins try to find new areas randomly, which can be represented as follows:
X i = τ × X L b + ϵ × X U b X L b   i < n / 2 ; ϵ P r
where P r equals a value of 0.1. The followers start to update their places based on the leader’s location as follows:
X j i = 1 2 X L j i + X j i 1 n / 2 i n
X j i 1   and X L j i denote the leader and follower positions, respectively.

3.3. Modified Capuchin Search Algorithm (MCapSA)

The proposed MCapSA has improved performance and searching ability over the conventional CapSA. It considers adaptive motion, which depends on the exponent factor ( H ), the best solution ( X b e s t ), and the worst solution ( X w o r s t ) as follows:
X i t + 1 = X i t + r a n d × H × X b e s t X w o r s t
in which:
H = 1 ( t t m a x ) × e x p t t m a x
The second modification was built on the Levy flight motion to improve the exploration phase of the proposed technique. The following equation describes the motion based on Levy flight:
X i t + 1 = X i t +   Levy β
in which:
  L e v y β     ~     0.01 u v 1 β X s i X b e s t
where u and v are determined as follows:
u   ~   N 0 , ϕ u 2 , v   ~   N 0 , ϕ v 2
ϕ u = Γ 1 + β × s i n π × β / 2 Γ 1 + β / 2 × β 1 / β , ϕ v = 1
The flowchart shown in Figure 8 describes the modified CapSA algorithm.

3.4. HOMER Pro

HOMER Pro software is suitable for analyzing remote locations [33]. It can be integrated with hybrid renewable generation and used to investigate the economic feasibility and conditional adaptation of a system [34].

3.5. Genetic Algorithm

The genetic algorithm (GA) is a populace-built algorithm and a basic optimization technique. It includes numerous procedures, such as initialization, alteration, and the choice to check an objective function [35]. GAs can become stuck in local targets upon initialization when used unsuitably [36].

4. Economic and Reliability Objective Functions

4.1. Economic Objective Function

An economic aim of an objective function is minimizing the COE produced from the planned HRGS. The CoE is the total annualized costs of components in the system ( C a n u s y s ) divided by the annual reported energy demand ( E l , a n u ) provided by:
C o E = C a n u s y s E l , a n u
Consequently, the annualized cost of all system operating expenses is as follows:
C a n u s y s = N P V t s y s C R F + C d i s f P W F
The net present value ( N P V t s y s ) is calculated based on the operating and preservation costs of system components ( N c ) as follows:
N P V t s y s = i = 1 N c ( C i n i t i + C r e p i + C O & M i )
The economic parameters depend on the interest (IR) and inflation (IF) lifetime rates of the system ( L F s y s ), such as the capital recovery and present worth factors. CRF and PWF are calculated as in Equations (42) and (43), respectively.
C R F = I R ( 1 + I R ) L F s y s ( 1 + I R ) L F _ s y s 1
P W F = 1 + I F 1 + I R 1 1 + I F 1 + I R L F s y s 1 1 + I F 1 + I R
where C d i s f is the annual costs of diesel fuel.

4.2. Reliability Objective Function

The electric supply deficit (ESD) is a reliability index that indicates the shortage in electric energy demand during a time (t). Thus, in this work, the ESD is expressed as a percentage of the annual total shortage in kWh (i.e., generated energy, E g ( t ), subtracted from load demand) to the total load demand as in Equation (44).
E S D = t = 1 8640 ( E l t E g ( t ) ) t = 1 8640 E l t
Thus, the proposed modified capuchin search algorithm (MCapSA) was employed to achieve the minimal values of both the CoE and ESD objective functions, which are presented in Equations (38) and (43), respectively.

4.3. Environmental Constraints

Two environmental constraints were used in this work. The first constraint is total GHG emissions. GHG includes the total annual CO2 emissions from system components during operation. The GHG emissions are calculated as in Equation (45).
G H G = G H G i t = 1 8640 E i t i N c ;   n u m b e r   o f   c o m p o n e n t s
The PV panels and wind turbines are assumed to be zero-emission sources by neglecting the emitted emissions during the manufacturing of these sources. Thus, the diesel generator is considered the sole source of GHG emissions in the system.
The second constraint is the renewable factor (RF), which is the total generated energy from the zero-emission renewable sources (i.e., the PV source and wind turbine in this study) divided by the total generated energy from all sources (i.e., photovoltaic, diesel, and the turbine of a wind generator) in the system as presented in Equation (46).
R F = t = 1 8640 P p v t + P W T t P p v t + P W T t + P d i s ( t )

5. Simulation Results and Discussion

The HRGS, which consists of a PV source, wind turbine, diesel generator, and battery storage, was optimized via different algorithms, namely, the GA, PSO, and HOMER Pro, and the results are compared with those of MCapSA. The optimization target was to minimize the CoE and GHG in three different load scenarios: educational load, residential load, and DSM-based residential load.
The outcomes of the three conventional optimization techniques and the comparison with the proposed modified capuchin search algorithm (MCapSA) are reported in this section. The evaluated variables in the process of optimization were the PV size in kW, no. of wind turbine units, and the autonomy days. Table 1 illustrates the upper and lower limits of these chosen variables based on the peak load and the numerous trial-and-error iterations. The technical and economic specifications for system components are listed and discussed.

5.1. Scenario 1: Educational Load

All parameters of the technical and economic components of the system were obtained from reference [8]. Figure 9 presents the annual energy share percentage of the system configuration. The PV source is the dominant source and comprises 68%, 67%, and 73% of the generated energy for PSO, the GA, and MCapSA, respectively. This high share in the percentage of PV energy is due to the distribution peak demand period during the daytime as illustrated in the load profile in Figure 4. Also, wind energy produced 23%, 23%, and 27% of the required energy for PSO, the GA, and MCapSA, respectively. This share is not as high as the PV source due to the low average speed of wind generation in the selected location. The MCapSA solution has the advantage of using renewable energy sources and lower dependence on diesel or batteries as the battery power comprises less than 1% of the overall share as revealed in Figure 9d. The more significant environmental issue is that the diesel generator exhibits a negligible value of less than 1%. As shown in Table 2, MCapSA achieves the minimal economic and environmental parameter values, 0.16 USD/kWh and 3% for the CoE and ESD, respectively, as compared to PSO and GA techniques.
Production from the PV source, wind turbine, and diesel sources and power consumed by the demand of the load and the battery charging, as well as the dumped power in the first week of January for the educational load scenario, are shown in Figure 10 for the four optimization techniques. The results shown in Table 2 and demonstrated in different figures for the educational load scenario show that the modified capuchin algorithm gives the best solution compared to all other algorithms. All the results show that the modified capuchin algorithm has better performance when it comes to economic and environmental parameter estimation for the hybrid renewable generation system.

5.2. Scenario 2: Residential Load

Due to the configuration of load distribution of residential load, as presented in Figure 5, the maximum demand occurs in the evening. Thus, the contribution of the PV solar generator is reduced to 36% for PSO and MCapSA, and, consequently, the contribution of wind energy is increased to reach 50 and 51% for PSO and MCapSA, respectively. Also, diesel comprises less than 1% and battery 13% of the share as depicted in Figure 11. The ESD value for the GA is more than 35%, as illustrated in Table 3. The CoE, ESD, GHG, and RF are 0.23 USD/kWh, 14.4%, 1424.9 kg, and 99.9%, respectively, for both MCapSA and PSO, as demonstrated in Table 4. The value of ESD 14.4% is considered high from a reliability perspective. Thus, the following scenario solves this issue by implying the individual-household DSM-scale technique.
Production from the PV source, wind turbine, and diesel sources and power consumed by the battery charging demand load in addition to the dumped power in the first week of January in the residential load scenario are given in Figure 12 for the three optimization techniques.

5.3. Scenario 3: DSM-Based Residential Load

In Scenario 3, DSM-based residential load, the contribution of the PV source increased by 26 and 21% for PSO and MCapSA, respectively, compared to Scenario 2, as presented in Figure 13. Moreover, the CoE, ESD, GHG, and RF in Scenario 3 are 0.206 USD/kWh, 4%, 267.2 kg, and 99.9% compared to 0.23 USD/kWh, 14.4%, 1424.9 kg, and 99.9%, respectively, in Scenario 2 for both PSO and MCapSA as illustrated in Table 4. This corresponds to 11.5, 72, and 81% reductions in the CoE, ESD, and GHG, respectively. This result emphasizes the effectiveness of applying the individual-household DSM-scale technique. Production from the PV source, wind turbine, and diesel sources and power consumed by the load and the battery demand for charging plus the dumped power in the first week of January in the DSM-based residential load scenario are shown in Figure 14 for the three optimization techniques.
According to the comparison of the three scenarios, the contribution of the PV source is significant in Scenarios 1 and 3 due to the period of maximum demand, which occurred during the daytime. Furthermore, Scenarios 1 and 3 achieved the optimal values of both economic and environmental aspects. Scenario 2 has the lowest performance from both economic and environmental perspectives. The share of diesel generation is less than 1% in all scenarios. The proposed MCapSA achieved optimal values of economic and environmental aspects equal to or less than those obtained through PSO.

6. Conclusions

A standalone hybrid renewable generation system (HRGS) for use in isolated areas with different load demand profiles was studied in this work. Three different types of load profiles were used with two different conventional optimization techniques, PSO and GA, along with a proposed modified capuchin search algorithm (MCapSA). The individual-household DSM-scale technique was applied to one of these loads. Economic and environmental aspects such as the CoE, ESD, GHG, and RF were considered. The results reveal that the contribution of the PV source is significant in Scenarios 1 and 3 as compared to Scenario 2. Scenario 2 exhibits the lowest performance from both economic and environmental perspectives. The share of diesel generation is less than 1% in all scenarios. Furthermore, the results emphasize the effectiveness of applying the individual-household DSM-scale technique for both economic and environmental aspects, as observed in Scenario 3. The proposed MCapSA achieved optimal values of economic and environmental aspects equal to or less than those obtained through PSO. As a result, the optimal DSM-based arrangement of the renewable energy sources achieves the lowest CoE and GHG emissions of 0.106 USD/kWh and 137.2 kg, respectively, highlighting the robustness and effectiveness of the developed MCapSA. An experimental investigation of the obtained optimal configuration will be introduced in future work.

Author Contributions

Conceptualization, M.M., A.M.E.-R., I.B. and A.E.; methodology, M.M., A.M.E.-R., I.B. and A.E.; software, M.M., A.M.E.-R. and A.E.; validation, M.M. and I.B.; formal analysis, M.M., A.M.E.-R., I.B. and A.E.; investigation, M.M., A.M.E.-R., I.B. and A.E; resources, A.M.E.-R. and I.B.; data curation, M.M. and A.E.; writing—original draft preparation, M.M. and A.E.; writing—review and editing, A.M.E.-R. and I.B.; visualization, M.M., A.M.E.-R., I.B. and A.E.; supervision, M.M., A.M.E.-R., I.B. and A.E.; project administration, M.M., A.M.E.-R., I.B. and A.E.; funding acquisition, A.M.E.-R. and I.B. All authors have read and agreed to the published version of the manuscript.

Funding

This research received no external funding.

Data Availability Statement

Data are contained within the article.

Conflicts of Interest

The authors declare no conflicts of interest.

Abbreviations

HRGShybrid renewable generation systemGAgenetic algorithm
MCapSAmodified capuchin search algorithmCoEcost of energy
PSOparticle swarm optimizationGHGgreenhouse gases
ESDelectric source deficitDSMdemand-side management
NOCTnormal operating cell temperature (°C)DODdepth of discharge (%)
NPCnet present costADautonomy days

References

  1. Abdelwahab, S.A.M.; Mohamed, M.; Ebeed, M.; Abdellatif, W.S.E. Equilibrium Optimizer and FLC of Two Area Load Frequency control with Multi-Source Generators System. Int. J. Renew. Energy Res. 2022, 12, 2180–2188. [Google Scholar]
  2. Rousis, A.O.; Tzelepis, D.; Konstantelos, I.; Booth, C.; Strbac, G. Design of a hybrid AC/DC microgrid using HOMER pro: Case study on an Islanded residential application. Inventions 2018, 3, 55. [Google Scholar] [CrossRef]
  3. Tazay, A. Techno-Economic Feasibility Analysis of a Hybrid Renewable Energy Supply Options for University Buildings in Saudi Arabia. Open Eng. 2021, 11, 39–55. [Google Scholar] [CrossRef]
  4. Mohseni, M.; Amirghafouri, F.; Pourghebleh, B. CEDAR: A cluster-based energy-aware data aggregation routing protocol in the internet of things using capuchin search algorithm and fuzzy logic. Peer-to-Peer Netw. Appl. 2023, 16, 189–209. [Google Scholar] [CrossRef]
  5. Alruwaili, O.; Mohamed, M. Performance improvement of rotor current controller in doubly fed induction gen-eration wind turbine with artificial intelligence methods. Energy Rep. 2024, 11, 2236–2254. [Google Scholar] [CrossRef]
  6. Razmjoo, A.; Shirmohammadi, R.; Davarpanah, A.; Pourfayaz, F.; Aslani, A. Stand-alone hybrid energy systems for remote area power Generation. Energy Rep. 2019, 5, 231–241. [Google Scholar] [CrossRef]
  7. Abu-Hijleh, B.; Jaheen, N. Energy and economic impact of the new Dubai municipality green building regulations and potential upgrades of the regulations. Energy Strategy Rev. 2019, 24, 51–67. [Google Scholar] [CrossRef]
  8. Elnozahy, A.; Yousef, A.M.; Ghoneim, S.S.M.; Abdelwahab, S.A.M.; Mohamed, M.; Abo-Elyousr, F.K. Optimal economic and environmental indices for hybrid PV/wind-based battery storage system. J. Electr. Eng. Technol. 2021, 16, 2847–2862. [Google Scholar] [CrossRef]
  9. Nsafon, B.E.K.; Owolabi, A.B.; Butu, H.M.; Roh, J.W.; Suh, D.; Huh, J.-S. Optimization and sustainability analysis of PV/wind/diesel hybrid energy system for decentralized energy generation. Energy Strategy Rev. 2020, 32, 100570. [Google Scholar] [CrossRef]
  10. Khan, M.J.; Yadav, A.K.; Mathew, L. Techno economic feasibility analysis of different combinations of PV-Wind-Diesel-Battery hybrid system for telecommunication applications in different cities of Punjab, India. Renew. Sustain. Energy Rev. 2017, 76, 577–607. [Google Scholar] [CrossRef]
  11. Mandal, S.; Das, B.K.; Hoque, N. Optimum sizing of a stand-alone hybrid energy system for rural electrification in Bangladesh. J. Clean. Prod. 2018, 200, 12–27. [Google Scholar] [CrossRef]
  12. Keyvandarian, A.; Saif, A. Optimal sizing of a reliability-constrained, stand-alone hybrid renewable energy system using robust satisficing. Renew. Energy 2023, 204, 569–579. [Google Scholar] [CrossRef]
  13. Babaei, R.; Ting, D.S.-K.; Carriveau, R. Feasibility and optimal sizing analysis of stand alone hybrid energy systems coupled with various battery technologies: A case study of Pelee Island. Energy Rep. 2022, 8, 4747–4762. [Google Scholar] [CrossRef]
  14. Mokhtara, C.; Negrou, B.; Bouferrouk, A.; Yao, Y.; Settou, N.; Ramadan, M. Integrated supply–demand energy management for optimal design of off-grid hybrid renewable energy systems for residential electrification in arid climates. Energy Convers. Manag. 2020, 221, 113192. [Google Scholar] [CrossRef]
  15. Tezer, T.; Yaman, R.; Yaman, G. Evaluation of approaches used for optimization of stand-alone hybrid renewable energy systems. Renew. Sustain. Energy Rev. 2017, 73, 840–853. [Google Scholar] [CrossRef]
  16. Moretti, L.; Polimeni, S.; Meraldi, L.; Raboni, P.; Leva, S.; Manzolini, G. Assessing the impact of a two-layer predictive dispatch algorithm on design and operation of off-grid hybrid microgrids. Renew. Energy 2019, 143, 1439–1453. [Google Scholar] [CrossRef]
  17. Abba, S.; Najashi, B.G.; Rotimi, A.; Musa, B.; Yimen, N.; Kawu, S.; Lawan, S.; Dagbasi, M. Emerging Harris Hawks Optimization based load demand forecasting and optimal sizing of stand-alone hybrid renewable energy systems—A case study of Kano and Abuja, Nigeria. Results Eng. 2021, 12, 100260. [Google Scholar] [CrossRef]
  18. Das, B.K.; Hasan, M. Optimal sizing of a stand-alone hybrid system for electric and thermal loads using excess energy and waste heat. Energy 2021, 214, 119036. [Google Scholar] [CrossRef]
  19. Zhang, W.; Maleki, A.; Rosen, M.A.; Liu, J. Sizing a stand-alone solar-wind-hydrogen energy system using weather forecasting and a hybrid search optimization algorithm. Energy Convers. Manag. 2019, 180, 609–621. [Google Scholar] [CrossRef]
  20. Wang, Z.; Zhou, H.; Peng, X.; Cao, S.; Tang, Z.; Li, K.; Fan, S.; Xue, W.; Yao, G.; Xu, S. A predictive model with time-varying delays employing channel equalization convolutional neural network for NOx emissions in flexible power generation. Energy 2024, 306, 132495. [Google Scholar] [CrossRef]
  21. Mukhtar, S.; Muhammad, S.; Alyousef, H.A.; Khan, W.; Shah, R.; El-Tantawy, S.A. Enviro-economic and optimal hybrid energy system: Photovoltaic–biogas–hydro–battery system in rural areas of Pakistan. Heliyon 2024, 10, 35182. [Google Scholar] [CrossRef]
  22. AlHajri, I.; Ahmadian, A.; Alazmi, R. A comprehensive technical, economic, and environmental evaluation for optimal planning of renewable energy resources to supply water desalination units: Kuwait case study. Energy 2023, 275, 127416. [Google Scholar] [CrossRef]
  23. Yimen, N.; Tchotang, T.; Kanmogne, A.; Abdelkhalikh Idriss, I.; Musa, B.; Aliyu, A.; Okonkwo, E.C.; Abba, S.I.; Tata, D.; Meva’a, L.; et al. Optimal sizing and techno-economic analysis of hybrid renewable energy systems—A case study of a photovoltaic/wind/battery/diesel system in Fanisau, Northern Nigeria. Processes 2020, 8, 1381. [Google Scholar] [CrossRef]
  24. Xu, X.; Hu, W.; Cao, D.; Huang, Q.; Chen, C.; Chen, Z. Optimized sizing of a standalone PV-wind-hydropower station with pumped-storage installation hybrid energy system. Renew. Energy 2020, 147, 1418–1431. [Google Scholar] [CrossRef]
  25. Dawoud, S.M.; Lin, X.; Okba, M.I. Hybrid renewable microgrid optimization techniques: A review. Renew. Sustain. Energy Rev. 2018, 82, 2039–2052. [Google Scholar] [CrossRef]
  26. Khan, M.; Iqbal, M. Pre-feasibility study of stand-alone hybrid energy systems for applications in Newfoundland, Renew. Energy 2005, 30, 835–854. [Google Scholar]
  27. Nsafon, B.E.K.; Butu, H.M.; Owolabi, A.B.; Roh, J.W.; Suh, D.; Huh, J.-S. Integrating multi-criteria analysis with PDCA cycle for sustainable energy planning in Africa: Application to hybrid mini-grid system in Cameroon. Sustain. Energy Technol. Assess. 2020, 37, 100628. [Google Scholar] [CrossRef]
  28. Hrayshat, E.S. Techno-economic analysis of autonomous hybrid photovoltaicdiesel- battery system. Energy Sustain. Dev. 2009, 13, 143–150. [Google Scholar] [CrossRef]
  29. Amer, M.; Namaane, A.; M’Sirdi, N.K. Optimization of Hybrid Renewable Energy Systems (HRES) Using PSO for Cost Reduction. Energy Procedia 2013, 42, 318–327. [Google Scholar] [CrossRef]
  30. Safari, S.; Ardehali, M.M.; Sirizi, M.J. Particle swarm optimization based fuzzy logic controller for autonomous green power energy system with hydrogen storage Global Conference on Renewable energy and Energy Efficiency for Desert Regions 2011 GCREEDER 2011. Energy Convers. Manag. 2013, 65, 41–49. [Google Scholar] [CrossRef]
  31. Ebeed, M.; Ahmed, D.; Kamel, S.; Jurado, F.; Shaaban, M.F.; Ali, A.; Refai, A. Optimal Energy planning of Multi-Micro Grids at Stochastic Nature of Load demand and Renewable Energy Resources using a Modified Capuchin Search Algorithm. Neural Comput. Appl. 2023, 35, 17645–17670. [Google Scholar] [CrossRef]
  32. Braik, M.; Sheta, A.; Al-Hiary, H. A novel meta-heuristic search algorithm for solving optimization problems: Capuchin search algorithm. Neural Comput. Appl. 2021, 33, 2515–2547. [Google Scholar] [CrossRef]
  33. Abdelwahab, S.A.M.; Yousef, A.M.; Ebeed, M.; Abo-Elyousr, F.K.; Elnozohy, A.; Mohamed, M. Optimization of PID controller for hybrid renewable energy system using adaptive sine cosine algorithm. Int. J. Renew. Energy Res. 2020, 10, 670–677. [Google Scholar]
  34. Singh, S.; Singh, M.; Kaushik, S.C. Feasibility study of an islanded microgrid in rural area consisting of PV, wind, biomass and battery energy storage system. Energy Convers. Manag. 2016, 128, 178–190. [Google Scholar] [CrossRef]
  35. Zeng, J.; Li, M.; Liu, J.F.; Wu, J.; Ngan, H.W. Operational optimization of a stand-alone hybrid renewable energy generation system based on an improved genetic algorithm. In Proceedings of the IEEE PES General Meeting, Minneapolis, MN, USA, 25–29 July 2010. [Google Scholar]
  36. Ghofrani, M.; Hosseini, N.N. Optimizing Hybrid Renewable Energy Systems: A Review. Sustain. Energy—Technol. Issues Appl. Case Stud. 2016, 8, 161–176. [Google Scholar]
Figure 1. Standalone hybrid renewable generation system.
Processes 12 02902 g001
Figure 2. Hourly solar radiation of PV at Sohag University.
Processes 12 02902 g002
Figure 3. Hourly ambient temperature of PV at Sohag University.
Processes 12 02902 g003
Figure 4. Hourly wind speed at Sohag University.
Processes 12 02902 g004
Figure 5. (a) The average daily educational load in winter. (b) The average daily educational load in summer.
Processes 12 02902 g005
Figure 6. (a) The average daily residential load in winter. (b) The average daily residential load in summer.
Processes 12 02902 g006
Figure 7. (a) The average daily DSM-based residential load in winter. (b) The average daily DSM-based residential load in summer.
Processes 12 02902 g007
Figure 8. Flowchart of the modified CapSA.
Processes 12 02902 g008
Figure 9. Annualized energy share percentage for HRGS sources in educational load scenario for the (a) PSO, (b) GA, (c) CapSA, and (d) MCapSA.
Processes 12 02902 g009
Figure 10. Production and expenditure of power in the first week of January in the educational load scenario for the (a) PSO, (b) GA, (c) CapSA, and (d) MCapSA.
Processes 12 02902 g010
Figure 11. Annualized energy share percentage for HRGS sources in the residential load scenario for the (a) PSO, (b) GA, (c) CapSA, and (d) MCapSA.
Processes 12 02902 g011
Figure 12. Production and power consumption in the first week of January in the residential load scenario for the (a) PSO, (b) GA, and (c) MCapSA.
Processes 12 02902 g012aProcesses 12 02902 g012b
Figure 13. Annualized energy share percentage for HRGS sources in the DSM-based residential load scenario for (a) PSO, (b) GA, (c) MCapSA, and (d) MCapSA.
Processes 12 02902 g013
Figure 14. Production and power consumption in the first week of January in the DSM-based residential load scenario for the (a) PSO, (b) GA, (c) CapSA, and (d) MCapSA.
Processes 12 02902 g014
Table 1. The upper and lower limits of optimization for the chosen variables.
Decision VariablesPV Size (kW)Wind Turbines (No.)Autonomy Days (Days)
Lower limit3053
Upper limit9508905
Table 2. Optimal decision variables and economic and environmental parameters of educational load in HRGS.
ParameterUnitPSOGACapSAMCapSAHOMER
PV energykW493.03476.75483.49474.61118
Autonomy daysDays55555
Wind turbineNo.838.42822.79850.00820.00610
Annualized cost ( C a n u s y s )USD264,717.14262,001.04 264,952.25261,500279,606
CoEUSD/kWh0.1660.1640.1660.1620.334
ESD%3.13.3330.552
GHGkg8.0968.0968.0968.0329.502
RF%99.9999.9999.9999.9999
Table 3. Optimal decision variables and economic and environmental parameters of residential load in HRGS.
ParameterUnitPSOGACapSAMCapSAHOMER
PV energykW33.631.932.9 3165.8
Autonomy daysDays55555
Wind turbineNo.23232232306793
Annualized   cos t   ( C a n u s y s ) USD42,172.924,079.542,136.722,079.3279,606
CoEUSD/kWh0.2340.1330.2330.1210.383
ESD%14.435.714.4 350.559
GHGkg1424.95101424.95071950
RF%99.699.799.799.799
Table 4. Optimal decision variables and economic and environmental parameters of DSM-based residential load in HRGS.
ParameterUnitPSOGACapSAMCapSAHOMER
PV energykW61.763.263.361.8 61.8
Autonomy daysDays5 5 554
Wind turbineNo.1513014051180
Annualized   cos t   ( C a n u s y s ) USD37,171.826,612.837,20925,209.755,569
CoEUSD/kWh0.2060.1470.2060.1060.436
ESD%412.8840.570
GHGkg267.2145.7 267.2137.2315.4
RF%99.999.999.999.999
Disclaimer/Publisher’s Note: The statements, opinions and data contained in all publications are solely those of the individual author(s) and contributor(s) and not of MDPI and/or the editor(s). MDPI and/or the editor(s) disclaim responsibility for any injury to people or property resulting from any ideas, methods, instructions or products referred to in the content.

