Article

The Influence of Stability in New Power Systems with the Addition of Phase Modulation Functions in Thermal Power Units

1
State Grid Henan Electric Power Research Institute, Zhengzhou 450052, China
2
College of Artificial Intelligence and Automation, Hohai University, Nanjing 210098, China
*
Author to whom correspondence should be addressed.
Processes 2024, 12(12), 2897; https://doi.org/10.3390/pr12122897
Submission received: 24 October 2024 / Revised: 11 December 2024 / Accepted: 16 December 2024 / Published: 18 December 2024

Abstract

:
The addition of phase modulation function technology to thermal power units is one of the most effective measures to solve dynamic reactive power shortages in the construction process of new power systems. In this paper, the influence of the phase modulation function transformation of thermal power units on the stability of a new power system is studied. Firstly, the new power system stability index is deeply analyzed, and an evaluation system for power system transient stability is constructed from five key dimensions: transient voltage, static voltage, power angle stability, power flow characteristics, and grid support. Secondly, a fuzzy comprehensive evaluation method considering the subjective and objective comprehensive weights is proposed, and the influence of the phase modulation transformation of the thermal power unit on the stability of the receiving-end power grid is quantitatively analyzed. Finally, a CEPRI36 node example model was built based on the PSASP v.7.91.04.9258 (China Electric Power Research Institute, Beijing, China) platform to verify the accuracy and effectiveness of the proposed method. The results show that the proposed method can quantitatively analyze the impact of adding a phase modulation function to thermal power units on the stability of the power system. At the point of renewable energy connection, the static voltage stability index improved by 42.9%, the transient power angle stability index improved by 32.1%, the multi-feed effective short-circuit ratio index improved by 33.9%, and the comprehensive evaluation score improved by 14.7%. These results further indicate that adding a phase modulation function to thermal power units can provide a large amount of dynamic reactive power support and improve the voltage stability and operational flexibility of the system.

1. Introduction

With the continuous, deepening utilization of renewable energy such as wind and solar energy, the rapid rise of energy storage technologies, and the widespread adoption of electric vehicles and rail transit, modern power systems are gradually evolving into new power systems (NPS) dominated by power electronic equipment and synchronous machines [1,2,3,4].
With the continuous increase in the proportion of installed renewable energy capacity and the rapid development of ultra-high voltage direct current transmission, the form and stability characteristics of the power grid have undergone significant changes [5]. On the one hand, the large-scale integration of renewable energy and direct current transmission using power electronic converters has greatly changed the voltage stability characteristics of the power system, resulting in smaller time scales and stronger nonlinear features of transient processes [6]. On the other hand, synchronous generators with strong transient voltage support and strong excitation overload capability have been largely replaced by renewable energy generation, resulting in a significant shortage of dynamic reactive power sources. A single AC fault in the core area may cause global voltage instability, leading to a sharp increase in reactive power demand in the power system and posing huge challenges to voltage stability [7,8].
NPS have significant characteristics, such as high levels of integration, being clean and low-carbon, flexible and efficient, and safe and reliable [9]. In NPS, emerging technologies such as renewable energy, energy storage technology, and smart grids are deeply integrated with traditional power systems, achieving efficient utilization and an optimized energy configuration [10,11]. However, as the main source of dynamic reactive power in the power grid, conventional power sources have significantly reduced their operating capacity and utilization hours due to environmental pollution and the squeeze of clean energy substitution. A large number of thermal power units are facing the dilemma of long-term shutdown or even early retirement [12]. This undoubtedly further increases the risk of voltage instability in the power grid. How to further increase the proportion of dynamic reactive power sources in the power grid, optimize the utilization rate of thermal power units, and improve the stable operation level of the power grid has become an urgent problem that needs to be solved in the construction of new power systems [13,14]. Some scholars believe that the application of hydropower and energy storage technology can completely eliminate thermal power, but this approach not only has high economic costs but is also difficult to implement. Therefore, some scholars have proposed to replace old thermal power units facing shutdown with phase modulation operation [15] and to retrofit thermal power units with phase modulation function, which can leverage their strong overload capacity, fast response speed, and excellent reactive power output characteristics [16]. In fact, the renovation of Unit 2 of Yahekou Power Plant has already added phase modulation function to thermal power units and grid-connected operation [17]. Adding phase modulation function not only solves the problem of insufficient dynamic reactive power support capacity in the power grid, but also fully utilizes the residual value of the units to solve the operational difficulties of power plants. So, accurately evaluating the impact of adding phase modulation function to thermal power units before and after the transformation on the system’s dynamic reactive power support capability, and clarifying whether the technical transformation of the unit is necessary, is the first problem that needs to be solved [18].
The analysis of the impact of adding phase modulation function to thermal power units on new power systems mainly includes two aspects: the construction of an evaluation index system and quantitative evaluation methods. Currently, different scholars have proposed various evaluation indicators from different perspectives [19,20,21]. Reference [19] used the alternating direction method of multipliers (ADMM) to fit the grid voltage phasor trajectory, quickly estimate the transient stability of the power system, and construct evaluation indices based on the trajectory arc-length distance. However, this method may have limitations when dealing with large-scale or multi-machine complex power systems. Reference [20] analyzed the coupling relationship between transient angle stability and transient voltage stability and proposed evaluation indices that quantify the coupling strength, including angle stability, load stability, network transmission capacity, and load power margin. However, calculating these indices may involve large amounts of data and complex computational processes, which could affect their practicality in real-time or online assessment. Reference [21] proposed an evaluation model that combines graph deep learning (GDL) and the confidence band method, taking into account the randomness of renewable energy to predict the probability distribution of power system stability indices. This method relies on large amounts of training data, thus requiring high data quality. Deep learning models often lack interpretability, which may hinder providing clear decision-making references for grid operators.
In addition, scholars have also researched methods for evaluating the stability of power systems [22,23,24]. Reference [22] compared the similarities and differences between the classification of GB 38755-2019 [23] and that of IEEE/CIGRE- 2004; the extended power system stability classification of IEEE PES in 2020 was also reviewed. And, the classification of power system security and stability was proposed based on the nature, physical characteristics, disturbance size, and time scale of different instability phenomena and abnormal operating conditions. Reference [24] proposed a power system stability assessment method considering random interference factors in which the probabilistic stability is classified and evaluated based on a probability analysis method, and the stochastic stability is classified and evaluated by using a stochastic analysis method. Reference [25] has meticulously reviewed and refined the existing statistical indicator system and established a pioneering statistical indicator framework for the new power system, aligning it with the core attributes of the NPS. However, further research is needed on the quantitative evaluation methods for the transient stability of new power systems, especially the quantitative evaluation of the impact of adding a phase modulation function to thermal power units on system stability.
This paper first constructs a transient stability evaluation system for power systems based on five dimensions: transient voltage, static voltage, power angle stability, power flow characteristics, and grid support. The impact of adding phase modulation function to thermal power units on the stability of new power systems is studied. Secondly, a fuzzy comprehensive evaluation method combining subjective and objective weights is proposed to quantitatively analyze the impact of phase modulation transformation in thermal power units on the stability of the receiving-end power grid. Finally, a CEPRI36 node model was built based on the PSASP v.7.91.04.9258 (China Electric Power Research Institute, Beijing, China) platform for simulation verification.

2. Analysis on Influence of Phase Modulation Function Modification of Thermal Power Units on the Stability of New Power System

2.1. Analysis and Selection of Stability Evaluation Indicators for New Power Systems

According to the classification of power system stability in the national standard “Power System Safety and Stability” GB38755-2019 [23], this paper constructs transient stability evaluation indicators for power systems from five dimensions: transient voltage stability, static voltage stability, angle stability, power flow characteristics, and grid structure support strength.

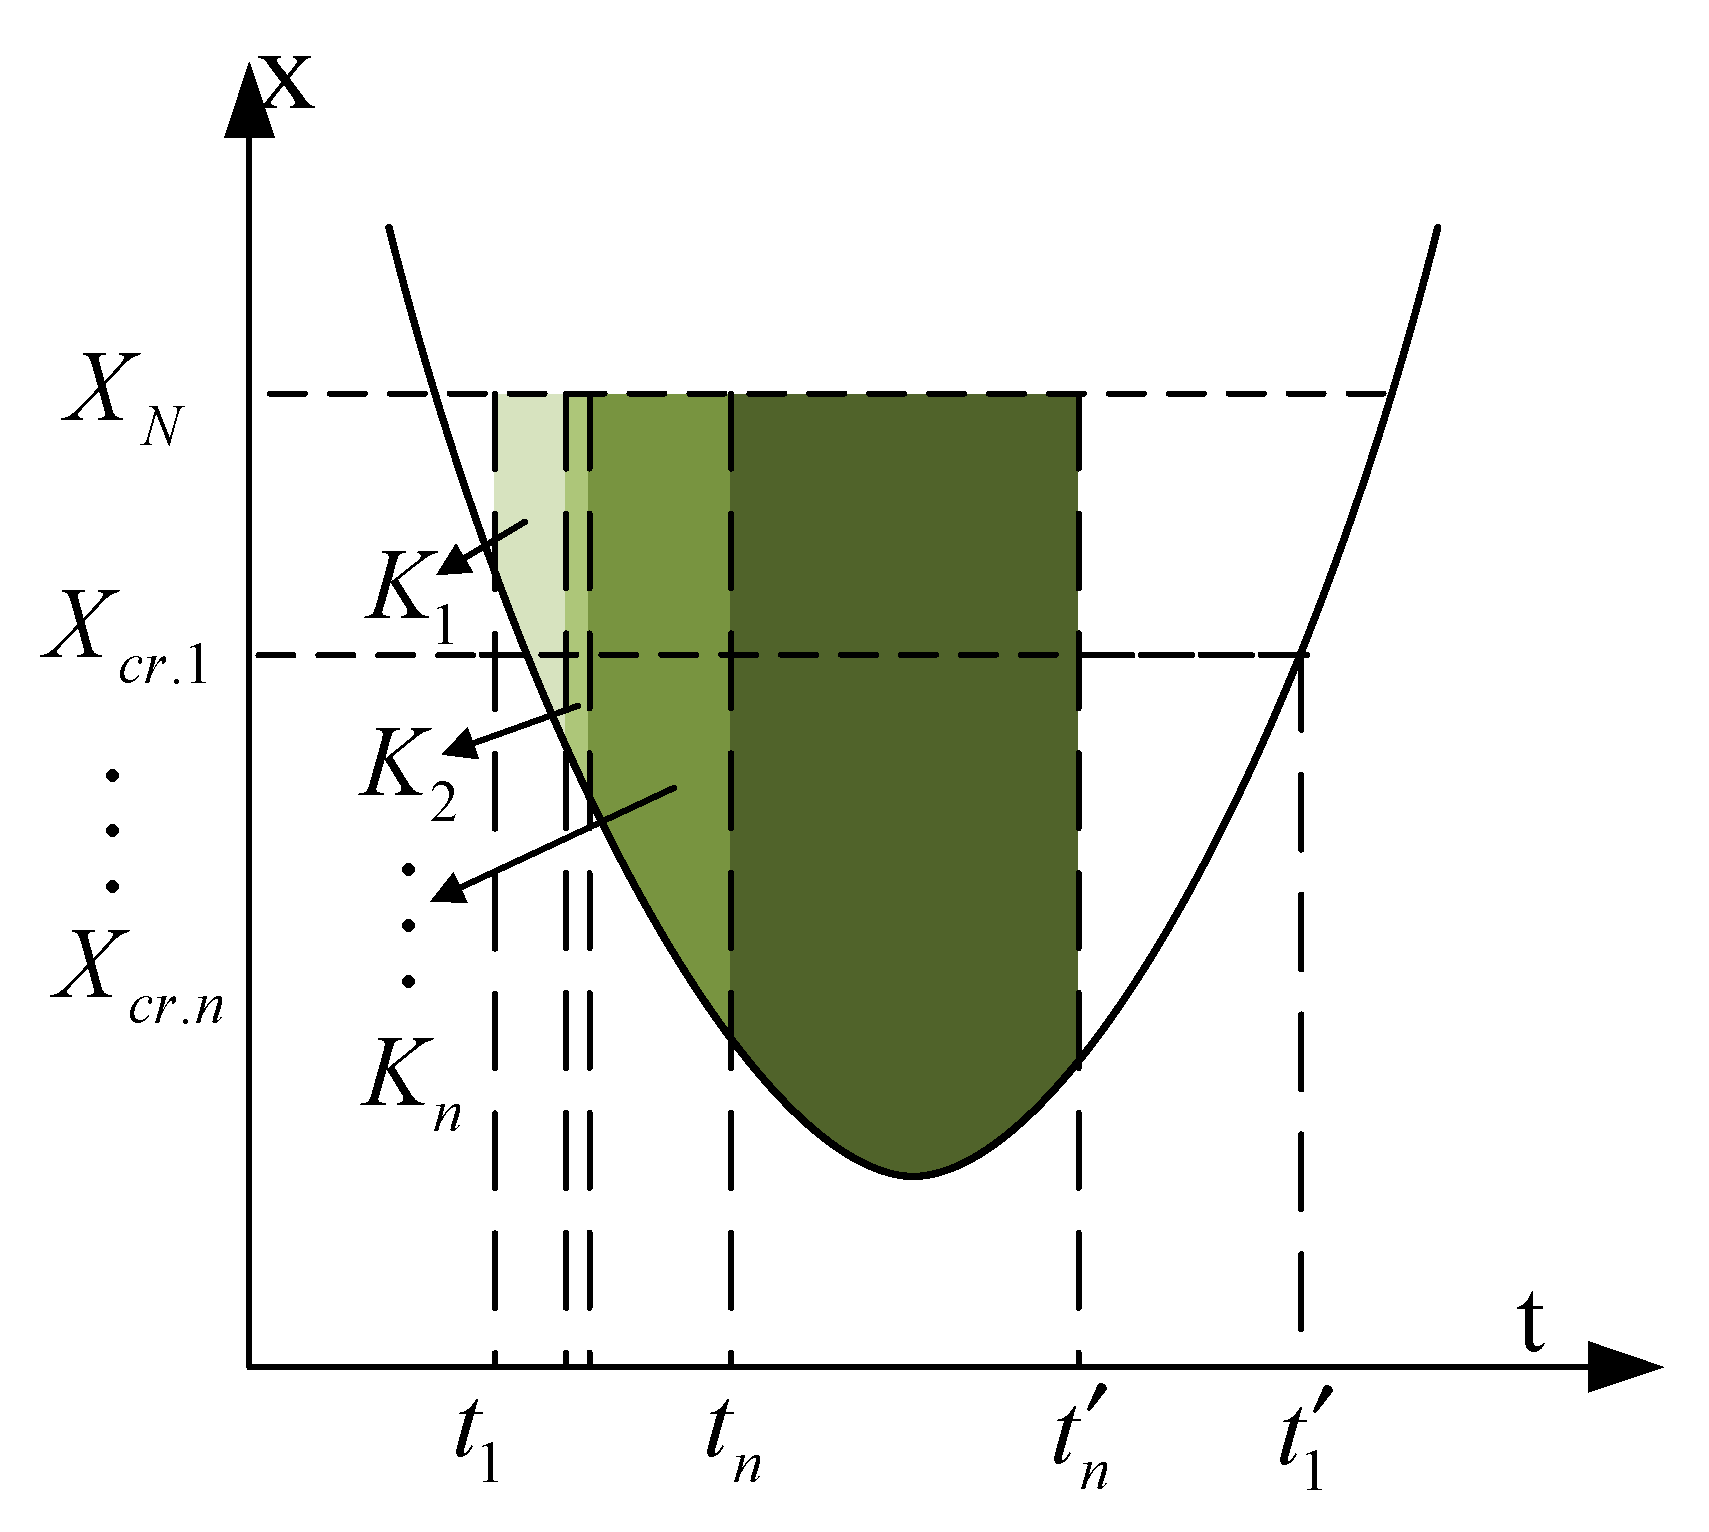
2.1.1. Transient Voltage Stability Indicator for Voltage Dips

The voltage dip indicator is a key factor in determining whether the system can recover to a stable state within a short period after a disturbance [26]. The transient voltage stability indicator is built based on multiple binary criteria, assigning different weights to different voltage dip levels and refining the impact of voltage dips, as shown in Figure 1.
In Figure 1, t1, t1’ represent the moments during the voltage dip when the voltage drops below Xcr.1 and recovers above Xcr.1, respectively. Tb1 = t1’-t1 indicates the duration during which the voltage remains below Xcr.1 during the dynamic process, and K1, K2, …, Kn is the weighting coefficient. For the transient voltage stability of the bus after a fault, different weighting coefficients are assigned based on the degree of voltage drop. The transient voltage stability margin indicator at node i is as follows:
ξ V i = 1 k = 1 n 1 K k t k t k + 1 V i N V i t d t K n t n t n V i N V i t d t k = 1 n 1 K k t k + 1 t k V i N V i t d t
where ViN is the rated reference value and different values are set according to different stability requirements.
After calculating the transient voltage stability margin indicators for all key buses i = 1,…, n, the minimum value is defined as the system transient voltage drop stability margin for the fault, i.e., ξ m = min ξ V i , ξ V n . If ξ m > 0 , the system transient voltage is considered stable, and the larger the value, the better. If ξ m < 0 , the smaller the ξ m , the greater the impact of the fault on transient voltage stability.

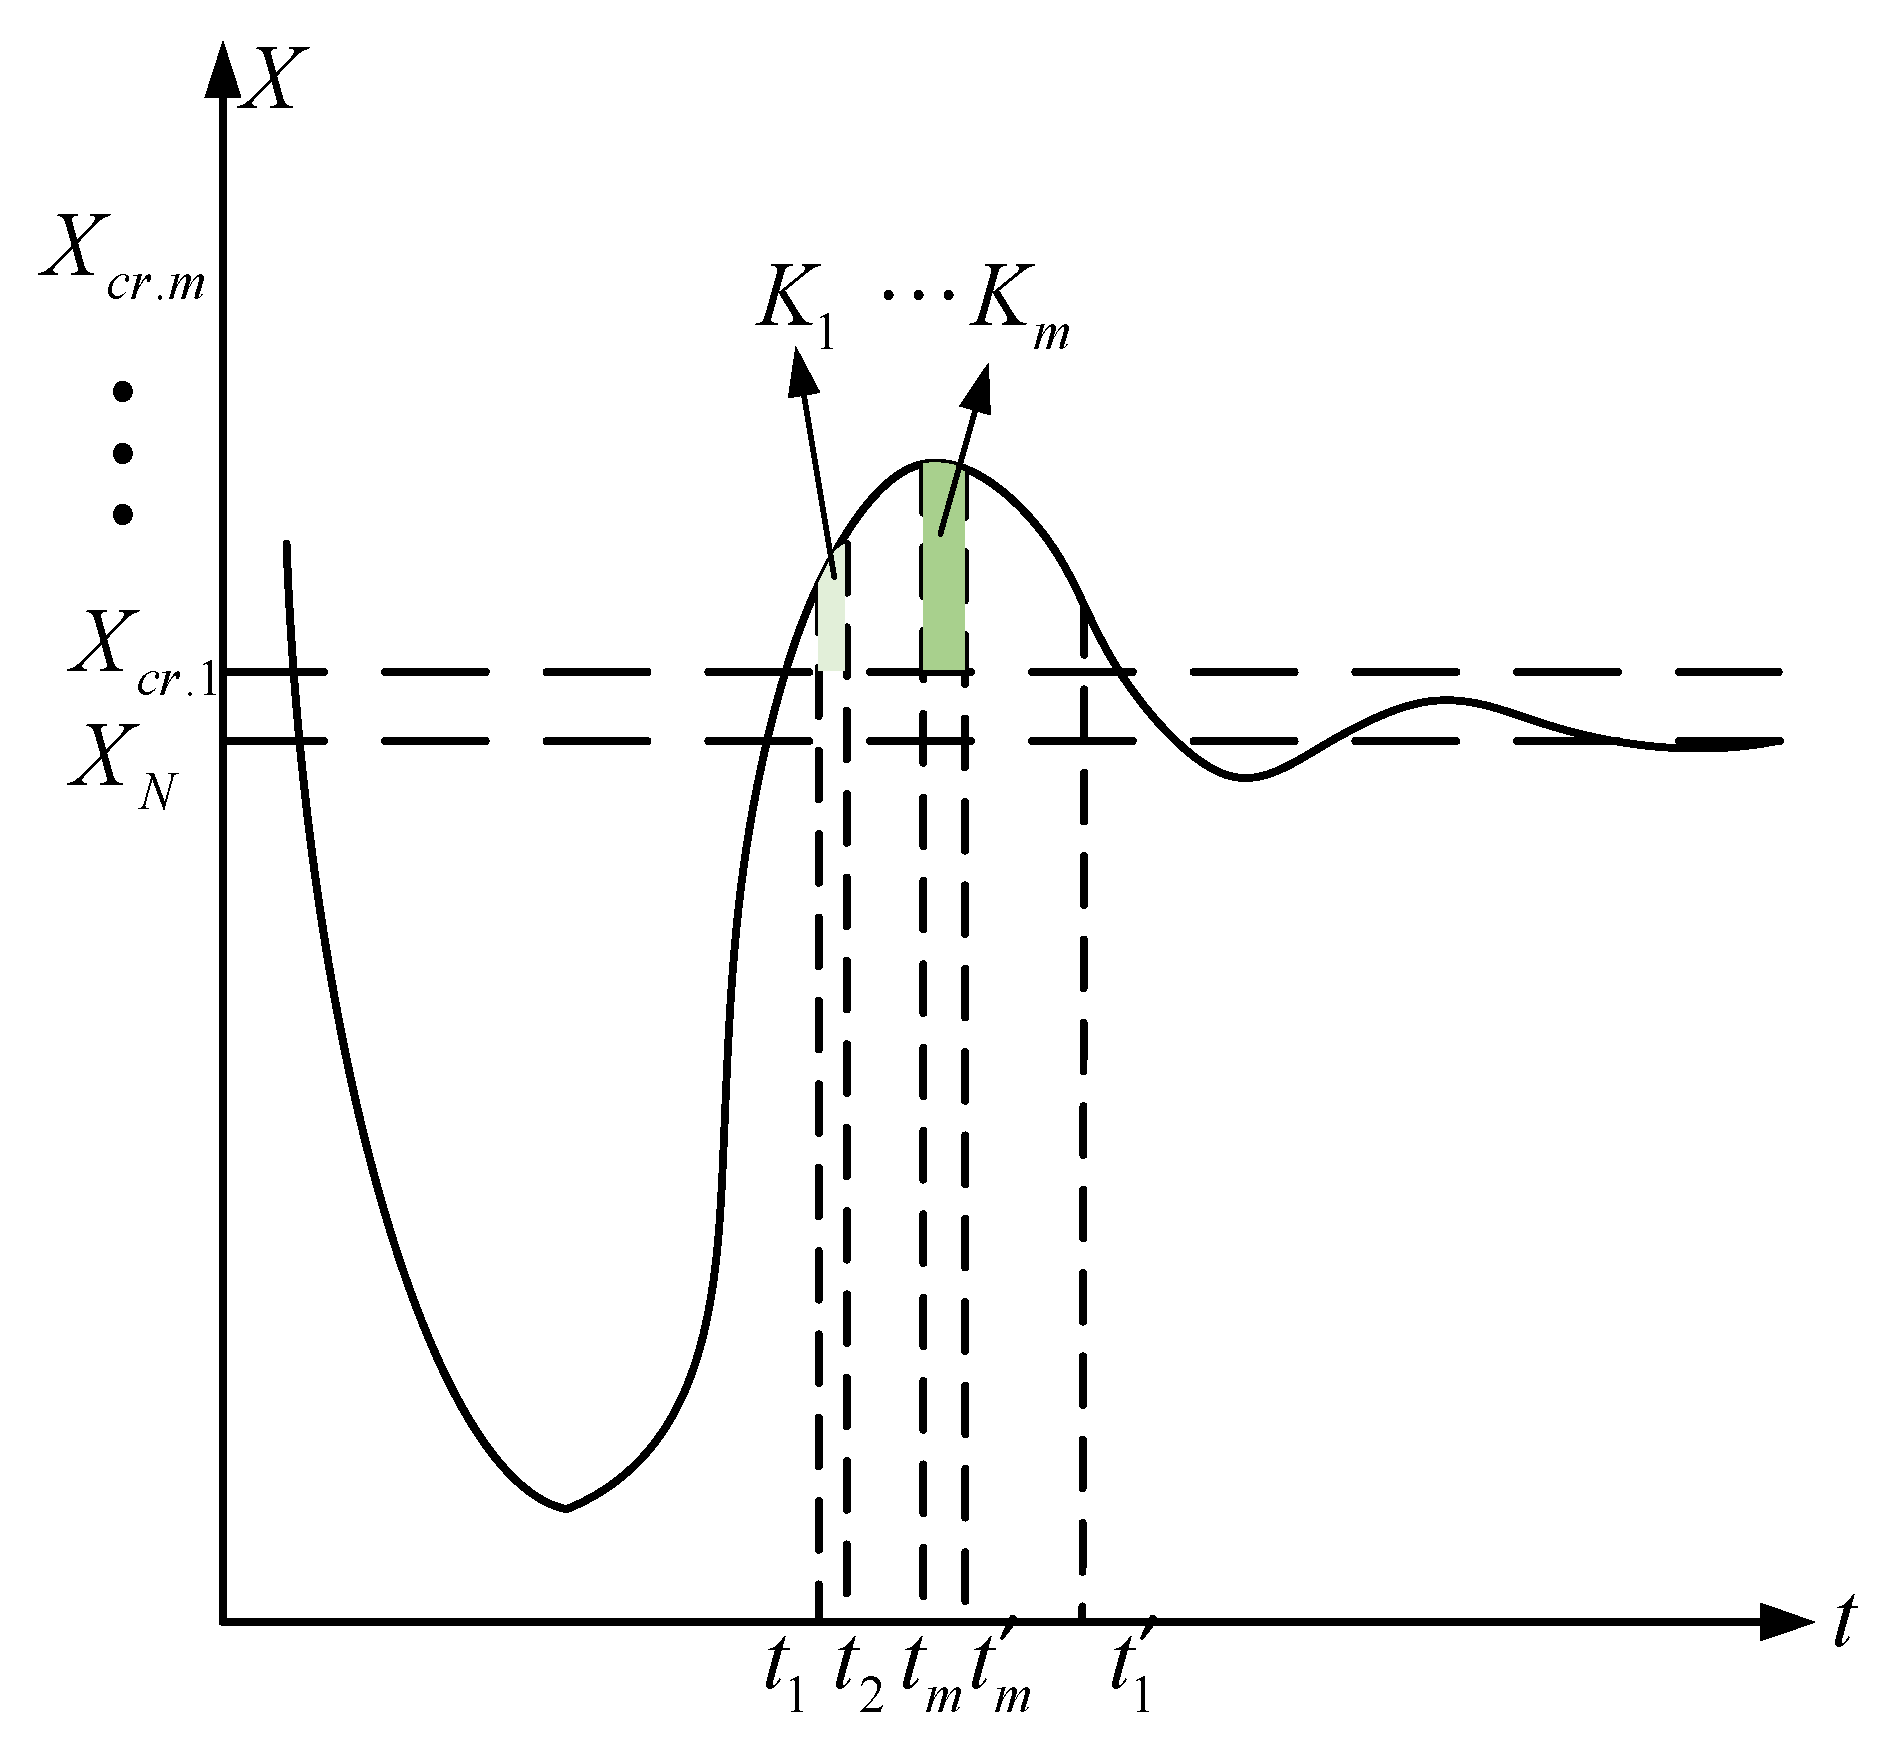
2.1.2. Transient Voltage Stability Indicator for Overvoltage Conditions

The transient voltage overshoot indicator helps to evaluate the maximum voltage fluctuation the system might experience after extreme events [27]. For the transient overvoltage after fault clearance, different weighting coefficients are assigned to different voltage dip levels, refining the impact of voltage dips, as shown in Figure 2.
ζ V i = 1 k = 1 m 1 K k t k t k + 1 V i t V i N d t + K m t m t m V i t V i N d t + k = 1 m 1 K k t k + 1 t k V i t V i N d t
where t1, t1’ represent the moments during the transient voltage rise when the voltage drops below Xcr.1 and recovers above Xcr.1. Tb1 = t1’ − t1 indicates the duration time the voltage remains above Xcr.1 during the dynamic process, with K1, K2, …, Kn being the weighting coefficient. For the transient voltage stability of the bus after a fault, different weighting coefficients are assigned based on the severity of the overvoltage. The transient voltage stability margin indicator at node i is calculated as Equation (2).
After calculating the transient voltage stability margin indicators for all key buses i = 1,…, n, the minimum value is defined as the system’s transient voltage rise stability margin for that fault, i.e., ξ m = min ξ V i , ξ V n . If ξ m > 0 , the system’s transient voltage is considered stable. The larger the value of ξ m , the better. If ξ m < 0 , the smaller the value of ξ m , and the greater the impact of the fault on transient voltage stability.

2.1.3. Construction of Effective Short-Circuit Ratio Evaluation Indicator for Multi-Infeed Systems

The effective short-circuit ratio (SCR) is a key indicator used to measure the interaction strength between AC systems and multi-infeed HVDC systems and to comprehensively assess the system’s resistance to various disturbances [28]. For AC/DC systems with n HVDC buses, the constructed multi-infeed short-circuit ratio indicator P is defined as Equation (3).
P = i = 1 n ω ^ i M E S C R i
where ω ^ i represents the weighting factor for the i-th DC bus, and j = 1 n ω j = 1 reflects the influence of the i-th DC bus in the multi-DC-infeed system. It does not require manual assignment or adjustment and reflects the mutual influence between DC buses. The weights are defined as Equation (4).
ω i = j = 1 , j i n Z e q i i P d i Z e q i j P d j ω ^ i = ω i / j = 1 n ω j
where ω i ω j are the weighting coefficients of the i-th and the j-th DC bus, P d i is the rated DC power of the i-th DC circuit, P d i is the rated DC power of the j-th DC circuit, Z e q i i is self-impedance corresponding to the commutation bus of the first DC in the equivalent impedance matrix, and Z e q i j is the mutual impedance between the commutation bus of the first DC and the commutation bus of the second DC in the equivalent impedance matrix.
MESCRi in Equation (3) is defined as Equation (5).
M E S C R i = = U i 2 Z e q i i Q c i P d i + j = 1 , j i n Z e q i j Z e q i i P d j
where Ui is the rated voltage on the i-th DC converter bus and Qci is the reactive power compensation capacity of the i-th DC converter bus at rated voltage.
If there are no DC transmission buses in the region, the multi-infeed short-circuit ratio can still be used to assess the short-circuit current distribution at each bus node in the power system, which can be calculated using Equation (6).
P i = I max I min
where Pi represents the multi-infeed short-circuit ratio of the i-th bus node, and Imax and Imin represent the maximum and minimum short-circuit current at that bus.

2.1.4. Construction of the Transient Power Angle Stability Evaluation Index

Transient power angle stability refers to the ability of the power system to maintain synchronous operation among all synchronous generators after a large disturbance without falling out of step [29]. Therefore, the transient power angle stability index (TASI) is used to describe the power angle stability of the system under different faults, calculated as Equation (7).
δ T A S I = 100 × 360 δ max 360 + δ max
where δmax represents the maximum power angle difference between any two synchronous generators after a system fault. The larger the value of δTASI, the more stable the system is, and the less severe the fault. If δTASI < 0, the power angle of the system becomes unstable after the fault.

2.1.5. Construction of the Static Voltage Stability Evaluation Index

The static voltage stability index is a key tool for ensuring voltage stability in power systems [30,31]. When a fault occurs and equipment goes offline, the system static voltage stability will change.
A matrix J = [J1, J2, …, Jq] is formed from the local voltage stability indices of all load nodes in the system, where q represents the number of load nodes. The system’s voltage stability index is given by the following equation:
L J = J
If the system voltage is stable, 0 < L J < 1 , and the larger the local voltage stability index, the higher the system’s static voltage stability. This indicates that the negative impact of a fault on the system’s static voltage stability is smaller.
The definition of the local voltage stability index Ji is defined as Equation (9).
J i = 1 k N E Z i k I k U L , i
where NE is the set of load nodes, Zik represents the i-th row and k-th column element of the impedance matrix of the load node, Ik represents the k-th element of the current injection vector of the load node, and UL,i represents the voltage of load node i.

2.1.6. Construction of the Load Margin Evaluation Index

The load margin index provides dispatch operators with a direct measure of the distance from the system’s current operating point to the voltage collapse point [32]. Its physical meaning is clear, and it can be used to characterize the static voltage stability level of the receiving-end system. Figure 3 shows a typical PV curve of load bus. In Figure 3, P 0 represents the initial load; P ¯ L represents the critical load at voltage collapse.
The load margin index Kp is defined as Equation (10).
K p = P ¯ L P L 0 P L 0 × 100 %
If the value of the Kp index after the line fault is removed is smaller, it indicates that the fault is more severe. Its calculation relies on a detailed model of the system and load flow analysis, requiring extensive data input and computational resources, which may not be practical for fast decision-making or real-time system monitoring.

2.1.7. Construction of the Power Flow Transfer Entropy Evaluation Index

The power flow entropy index is used to describe the impact of line faults on the power flow characteristics of the grid. After line i is faulted and disconnected, the power flow increment shared by line k from line i is given by the following equation:
Δ λ k i = P k i P k 0
where Pk0 is the active power transmitted by line k before line i is disconnected, and L is the active power transmitted by line k after line i is disconnected.
The power flow transfer impact ratio βki from line i to line k is defined as follows:
β k i = Δ λ k i k = 1 N L Δ λ k i
where NL is the number of lines.
The power flow transfer entropy of line i is defined as follows:
H i = k = 1 N L β k i ln β k i
If the power flow transfer entropy of line i is smaller, the greater the impact of power flow transfer after disconnection, indicating a more severe fault. The calculation of power flow transfer entropy typically involves complex probabilistic and statistical methods, and its results are more often used for strategic planning and fault analysis rather than real-time stability assessment [33].
When selecting power system stability evaluation indices, considerations should include not only the theoretical completeness of the indices but also their practicality, ease of operation, and whether they provide timely and critical decision support. While load margin and power flow transfer entropy are very useful in academic research and long-term planning, they may be less effective than transient voltage stability and power angle stability indices in situations requiring immediate response and intuitive operation. Therefore, it is advisable to prioritize indices that directly reflect the current system state and its immediate response to disturbances, meeting the needs of system operation and emergency management. Thus, the evaluation indices selected for this paper are as follows: the transient voltage evaluation index during voltage sag, the transient voltage evaluation index during voltage swell, the multi-infeed short-circuit ratio evaluation index, the transient power angle stability evaluation index, and the static voltage stability evaluation index.

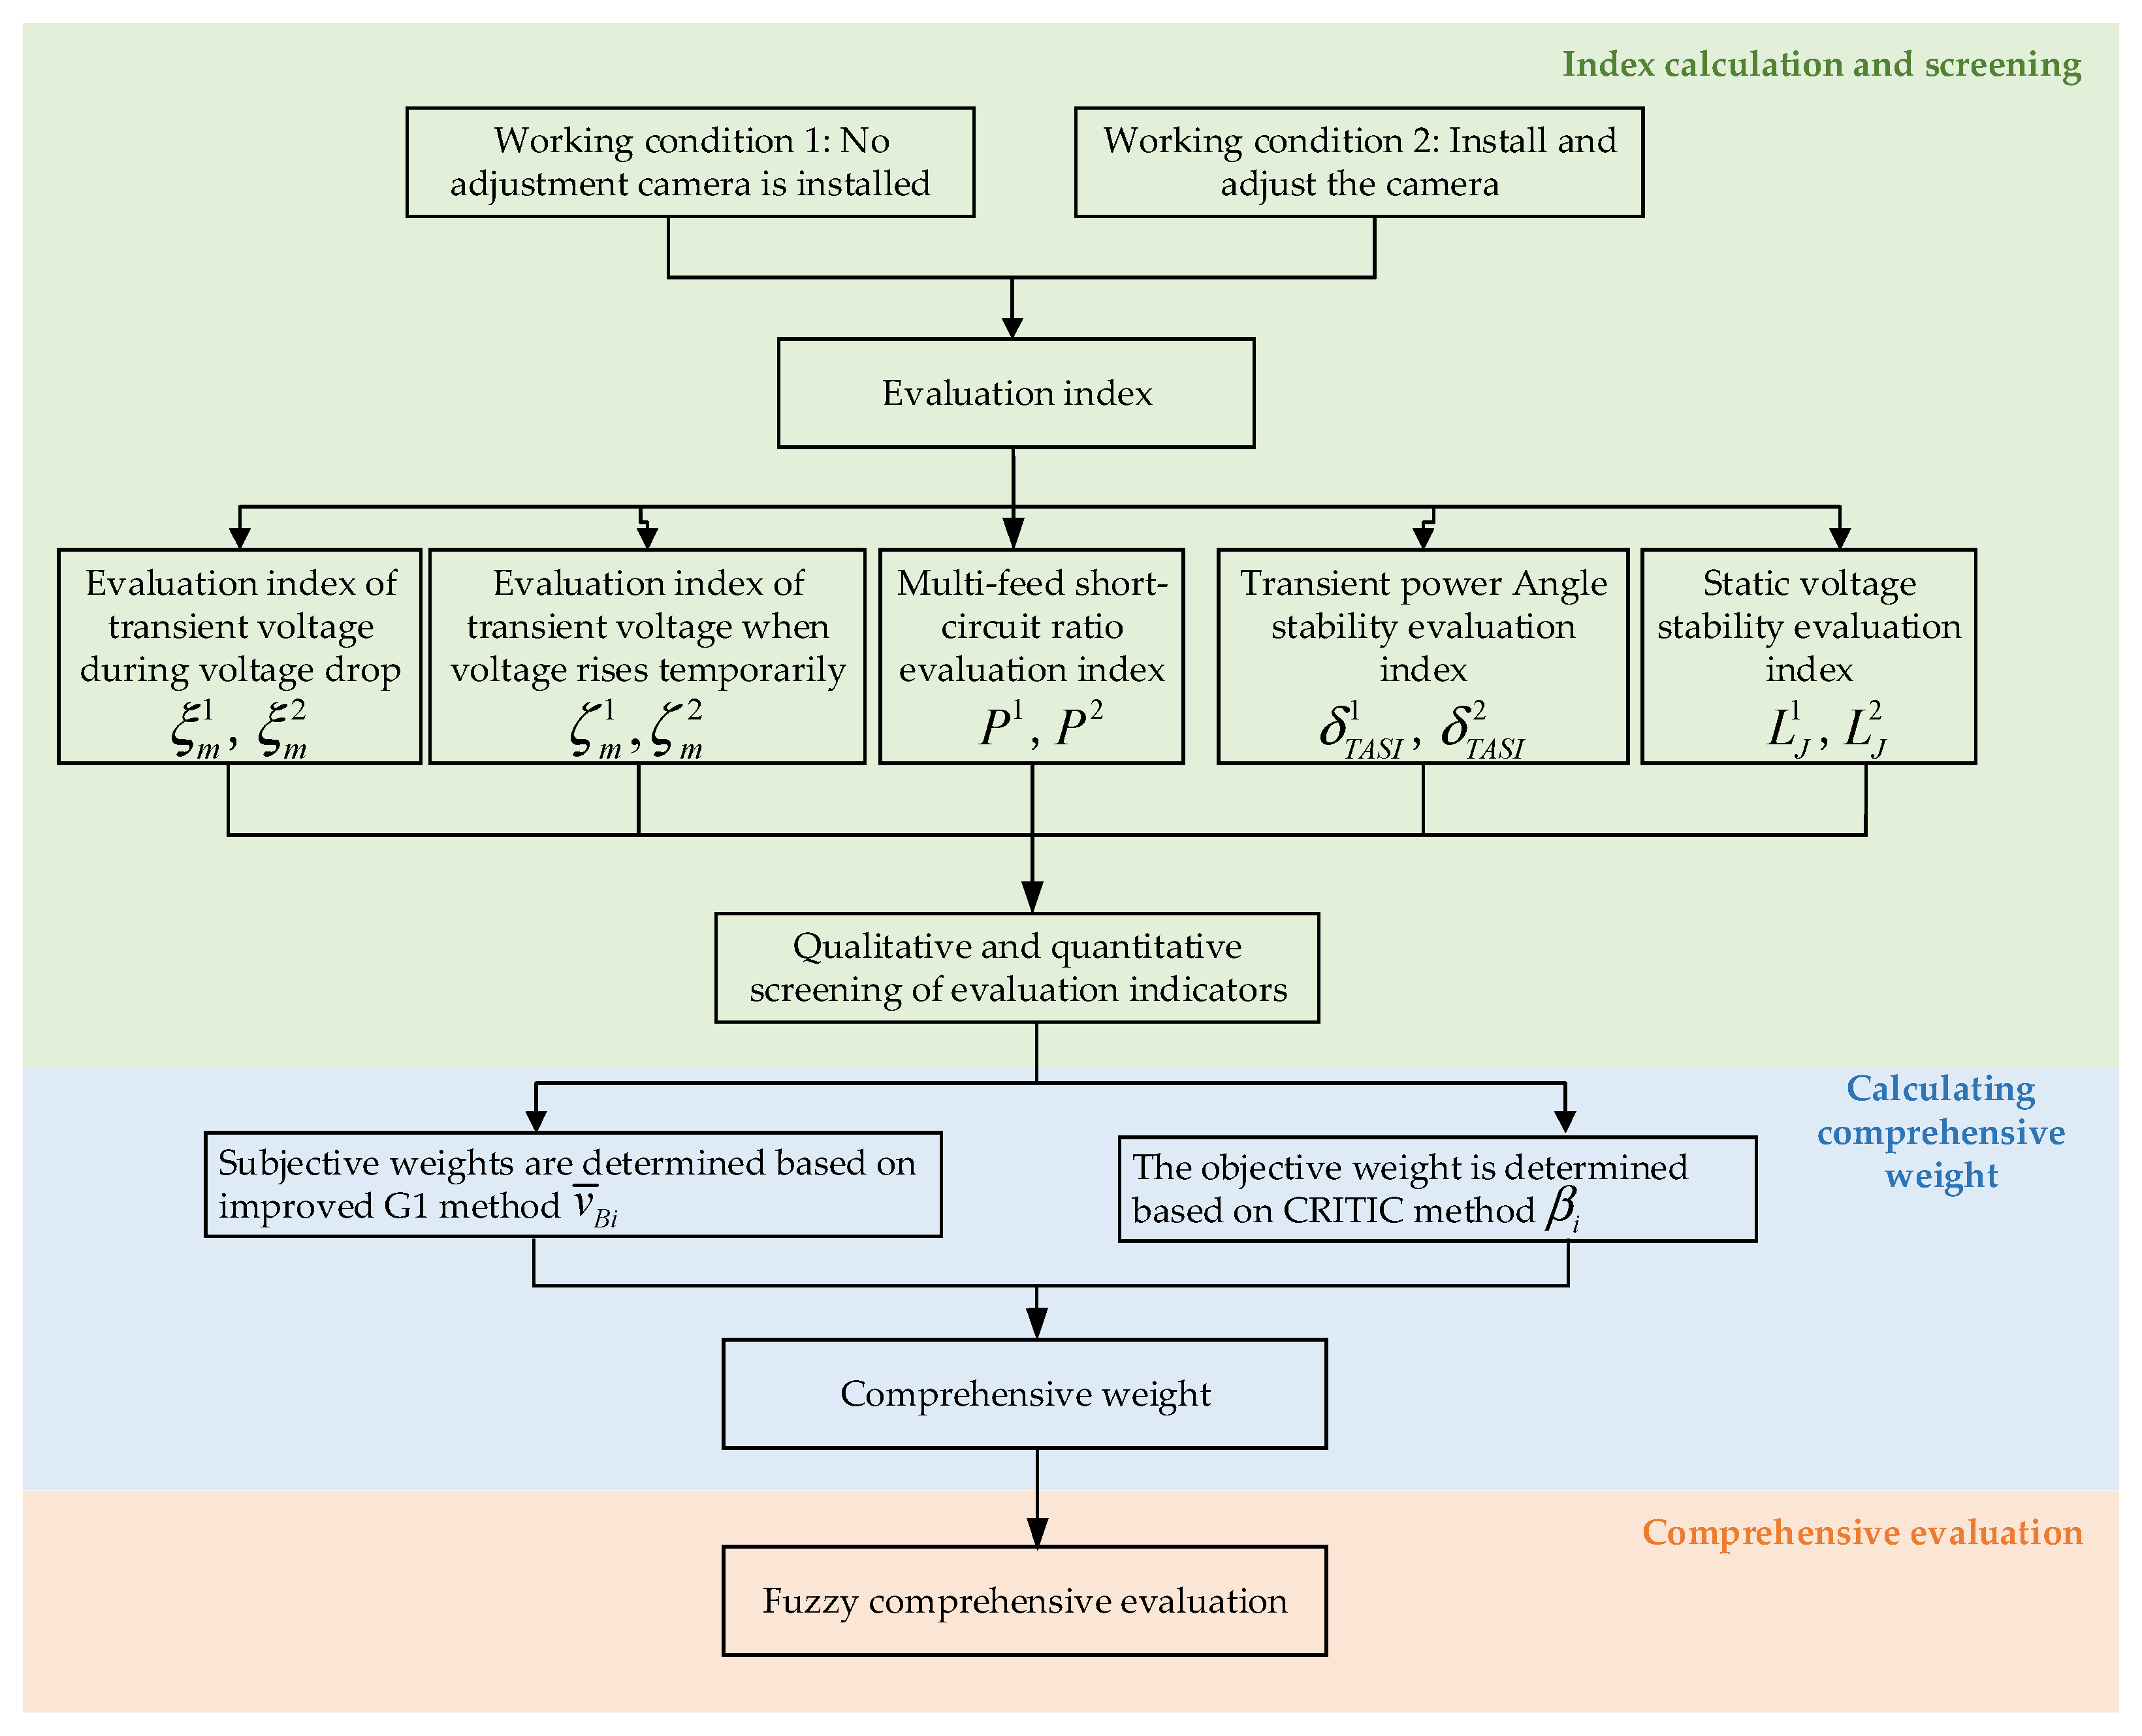
2.2. Construction of the Evaluation System for Enhancing the Stability of the Receiving-End Power Grid Through Adding Phase Modulation Function to Thermal Power Units

Based on the system stability and margin indices established from the above research, an evaluation system for enhancing the stability of the receiving-end power grid through adding phase modulation function to thermal power units is constructed as Figure 4.

2.2.1. Quantitative Screening of Indices

Due to the strong subjectivity of using only qualitative methods to screen indices, it is easy to have a high redundancy of indices and a cumbersome and large index system, which increases the computational workload and easily leads to distorted evaluation results. Therefore, on the basis of qualitative screening of indices, this paper considers the objectivity of basic index data and introduces the hierarchical Gray Relational Analysis (GRA) method to calculate the comprehensive relational degree of each index and set an appropriate threshold to achieve quantitative index screening. This ensures the scientific nature and minimal redundancy of the index system.
Hierarchical Gray Relational Analysis involves multiplying the weight vector of indices obtained through the Analytic Hierarchy Process (AHP) [34] by the Gray relational degrees derived from Gray Relational Analysis, yielding a new comprehensive relational degree. Based on this, an appropriate threshold is set for dynamic screening to obtain a set of key indices, completing the quantitative screening of indices. The detailed calculation steps are as follows:
  • Determine the weight vector of evaluation indices using the AHP.
W = [ w 1 ,   w 2 ,   ,   w n ]
where wk is the weight corresponding to the k-th evaluation index, k = 1,2, …, n.
  • Calculate the Gray relational coefficient [35].
i ( k ) = min i min k | x 0 ( k ) x i ( k ) | + ρ max i max k | x 0 ( k ) x i ( k ) | | x 0 ( k ) x i ( k ) | + ρ max i max k | x 0 ( k ) x i ( k ) |
where ρ is the distinguishing coefficient ρ 0 , 1 , and is usually set to 0.5; max i max k x 0 ( k ) x i ( k ) represents the maximum value of the difference sequence, and min i min k x 0 ( k ) x i ( k ) represents the minimum value of the difference sequence.
  • Calculate the Gray relational degree.
l i ( k ) = 1 n k = 1 n i ( k )
  • Calculate the comprehensive Gray relational degree.
A i ( k ) = w k l i ( k ) j = 1 n w j l i ( j ) , k = 1 , 2 , , n
  • Screening of evaluation indices.
Set the threshold T = 0.90, delete redundant elements, and retain the elements that meet the threshold criteria.
Q i = Q i ( k ) Q i ( k ) A i ,   s . t .   k = 1 n A i ( k ) T

2.2.2. Rationality Test of Indices

To comprehensively consider the inherent properties of the index data and the degree of independence of the information, this paper employs the information contribution rate, which reflects the information content of the index through the variance of the data to test the rationality of the index system.
Given the small number of indices in each criterion layer, calculating the information contribution rate for each layer can easily lead to inaccurate results due to the uniqueness of certain data points. Therefore, this paper takes the ratio of the variance sum of the index data matrix after quantitative screening and converts it to the variance sum of the index data matrix after qualitative screening as the information content of the screened index system. This ratio is used as the basis for testing the rationality of the index system. The formula for calculating the information contribution rate is as Equation (19):
I n = t r S l / t r S x
where t r S is the trace of the covariance matrix of the indices, l is the number of indices after quantitative screening, and x is the number of indices before quantitative screening.
Generally, if I n 90 % , the evaluation index system is considered reasonable.

3. Quantitative Evaluation Method

Since this study focuses on evaluating the improvement in system stability after retrofitting thermal power units with synchronous condenser capabilities, it is necessary to establish evaluation indices for both scenarios, with the system before retrofitting and the system after retrofitting the thermal power units as synchronous compensators. The flowchart of the evaluation methodology for the stability of the receiving-end power grid is shown in Figure 5.

3.1. Calculation of Comprehensive Subjective and Objective Weights

Subjective Weight: Using the improved G1 [36] method, a total of z experts provide subjective assessments of the indicators. The subjective weights of the H comprehensive indices are obtained by calculating the weighted average as Equation (20).
v ¯ B i = j = 1 z v B i z i = 1 , 2 , , H
Objective Weight: The CRITIC [37] method is employed, which is a process of assigning objective weights based on the characteristics of the data. Essentially, the objective weight is determined by the amount of information contained in the data. The objective weights of the comprehensive indices, β i , are calculated as Equation (21):
β i = G i r = 1 H G r r = 1 , 2 , , H
where r = 1 H G r represents the total information of the H indices.
To incorporate both subjective and objective factors, the minimum discrimination principle is applied. Using the subjective weight υ ¯ B i derived from the improved G1 method and the objective weight β i obtained from the CRITIC method, the comprehensive weight α i for each index is calculated. The specific process is as Equation (22).
min J ( α ) = i = 1 H α j ln α i υ ¯ B i + α i ln α i β i   s . t .   i = 1 H α i = 1 α i 0 i = 1 , 2 , , H
After solving the target model, the comprehensive weight of each index can be obtained as Equation (23).
α i = v ¯ B i β i i = 1 H v ¯ B i β i
Then, the synthetic weight vector can be obtained as Equation (24).
α = α 1 , α 2 , , α H T

3.2. Fuzzy Comprehensive Evaluation Method

The enhancement of system stability by retrofitting thermal power units with synchronous condenser functions is difficult to describe with precise mathematical models. The fuzzy comprehensive evaluation method is used to handle the uncertainties and fuzziness of the evaluation, combining both qualitative and quantitative indicators.
  • Determine the evaluation index set and evaluation grade set.
Establish a set that includes all the evaluation indices and define the evaluation levels (evaluation grade set) for each index, as shown in Table 1.
  • Construct the membership function model.
Define the membership function for each evaluation index to describe the degree of membership corresponding to the value of each index, i.e., its adaptability to different evaluation levels. The relevant membership function parameters in Figure 6 are shown in Table 2.
  • Constructing the Fuzzy Evaluation Matrix.
Using the membership functions and parameters corresponding to each index, calculate the degree of membership for each index in the evaluation set V, forming the fuzzy evaluation matrix.
  • Fuzzy Comprehensive Evaluation Score.
Perform fuzzy operations between the fuzzy evaluation matrix and the index weight matrix to obtain the fuzzy comprehensive evaluation vector. Multiply this vector by the scores corresponding to the evaluation set to obtain the final comprehensive evaluation score as Equation (25).
S = U R V
In order to clearly show the ability to improve system stability after adding the phase modulation function to thermal power units, some improvements should be made to the evaluation set. The improvement percentage of the five indices of the transformed system is calculated based on the classification percentage of the seven grades given by the fuzzy comments set in Table 1. If the improvement percentage of indicator 1 is 0~30%, the improvement percentage of index 1 is classified as G; if the improvement percentage of index 2 is also 0~30%, the improvement percentage of index 2 is also classified as G, and so on. All five indices are classified and summed. Based on 100 points, if the average improvement percentage of the five indices increases from 80% to 100%, then 80 points will be multiplied with the improved review set. If the average improvement percentage of the five indices is 60% or less, then 40 points are multiplied with the improved comment set, and the resulting promotion matrix is added with the evaluation set to obtain a new evaluation set: V’ is obtained by improving V as Equation (26).
V = 80   o r   60   o r   40 × i f   70 Δ i < 100 5 Δ i i f   62 Δ i < 70 5 Δ i i f   54 Δ i < 62 5 Δ i i f   46 Δ i < 54 5 Δ i i f   38 Δ i < 46 5 Δ i i f   30 Δ i < 38 5 Δ i i f   0 Δ i < 30 5 Δ i + 85 66 58 50 42 34 15

4. Simulation Verification

4.1. System Overview

A simulation analysis on the standard calculation example of the CEPRI36-node system is conducted to obtain the corresponding index values in this section, and the evaluation index system is formed by using the combination of subjective and objective indices. Then, the fuzzy comprehensive evaluation method is used to evaluate the stability improvement ability of the thermal power unit adjustment synchronous condenser through the combination of subjective and objective weights.
The original CEPRI36-node system is improved to satisfy the characteristics of the new power system. The line between BUS33 and BUS34 is replaced by a 400 MW and 400 kV LCC-HVDC DC transmission line; DFIG wind power generation is incorporated at BUS29 and the photovoltaic power generation system is integrated at BUS34. Figure 7 shows the improved system topological geographic wiring diagram.

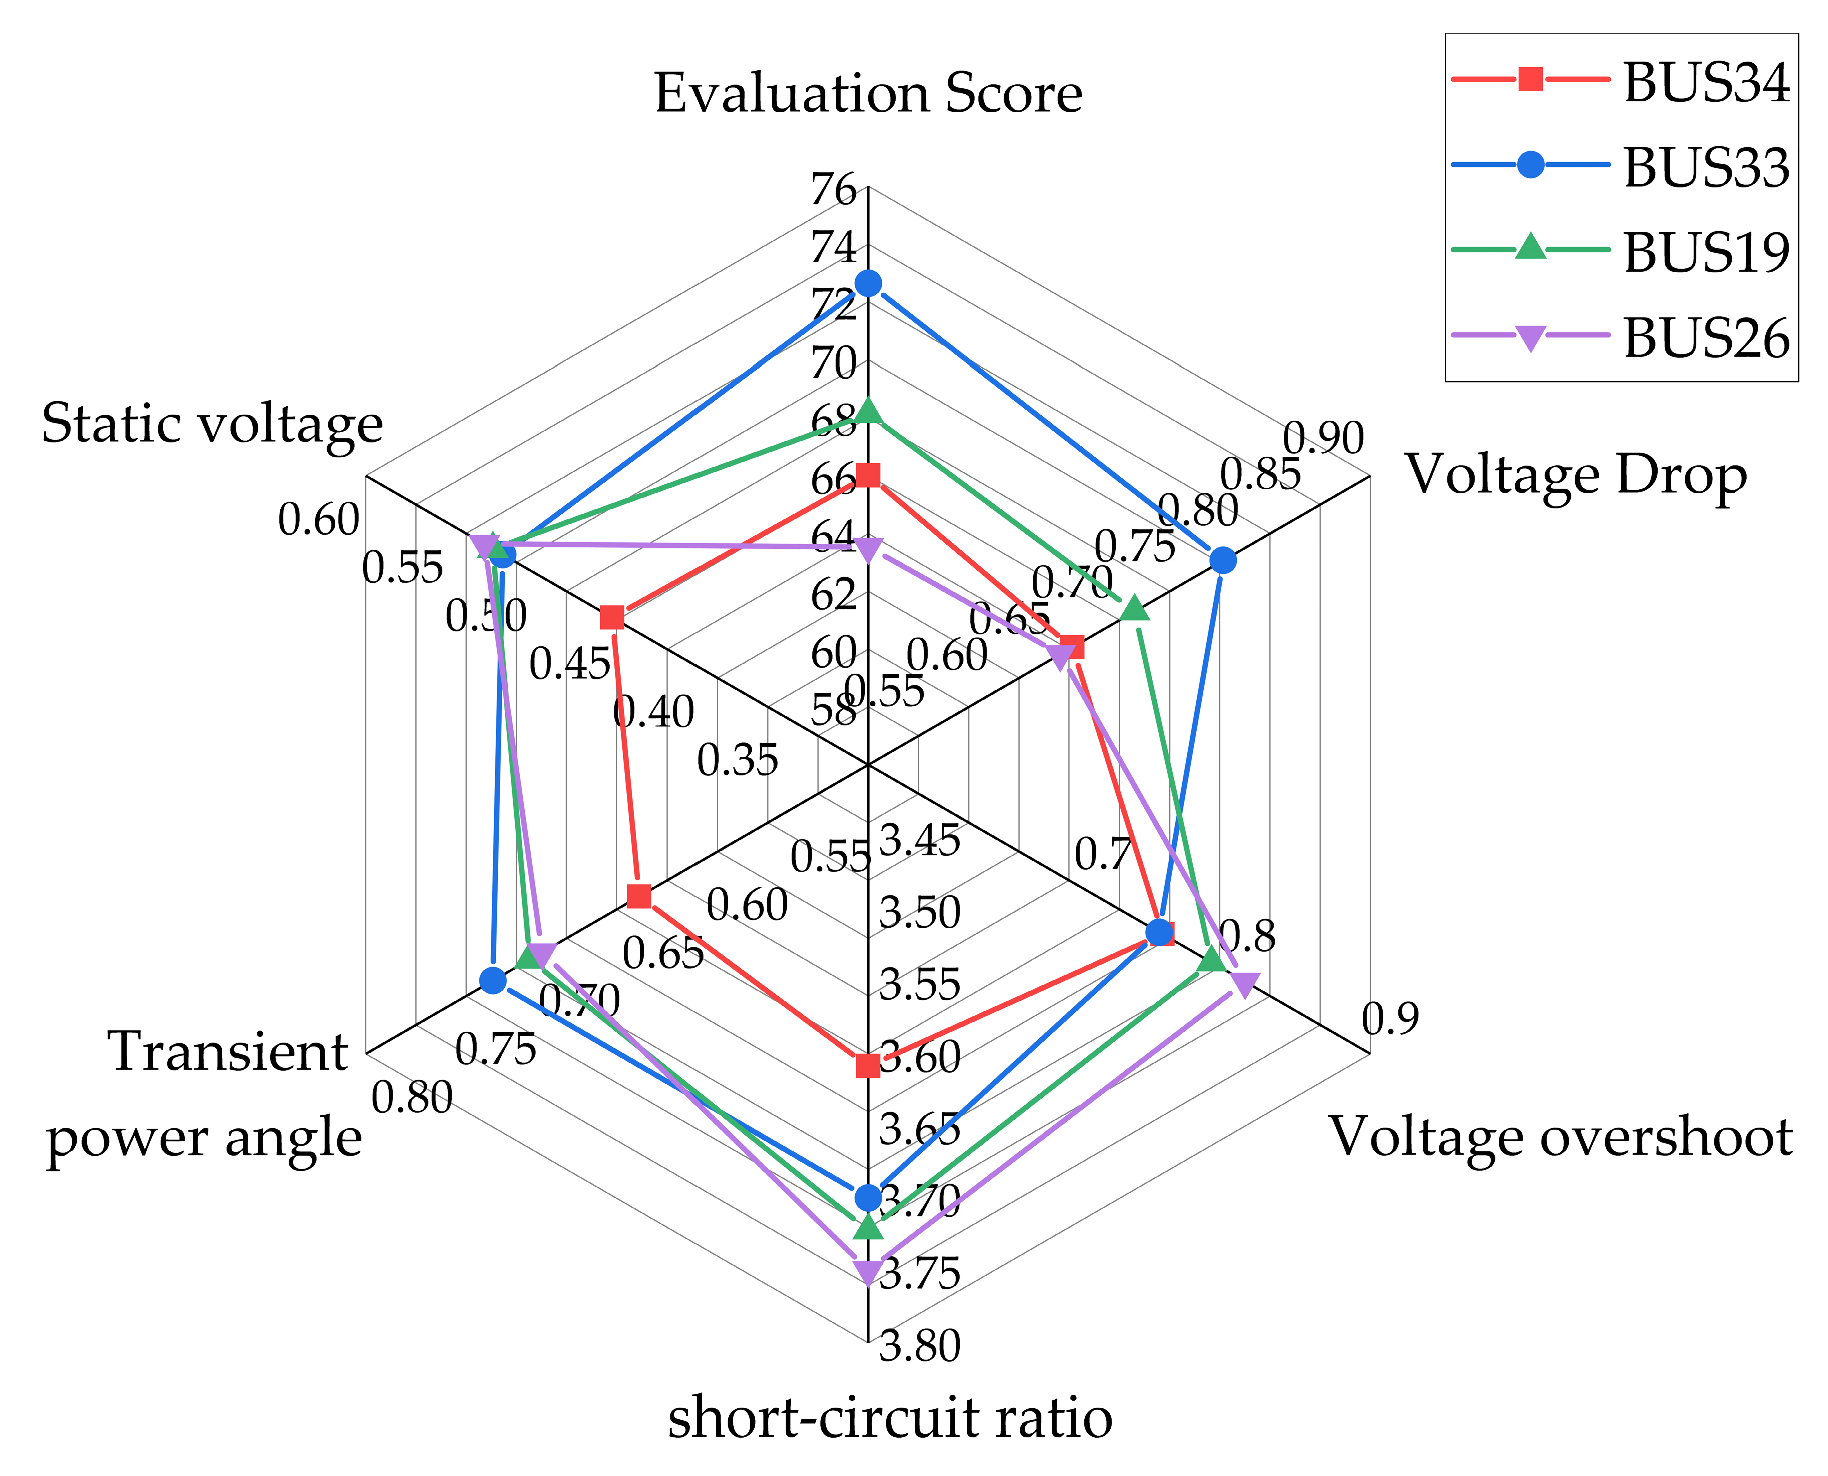
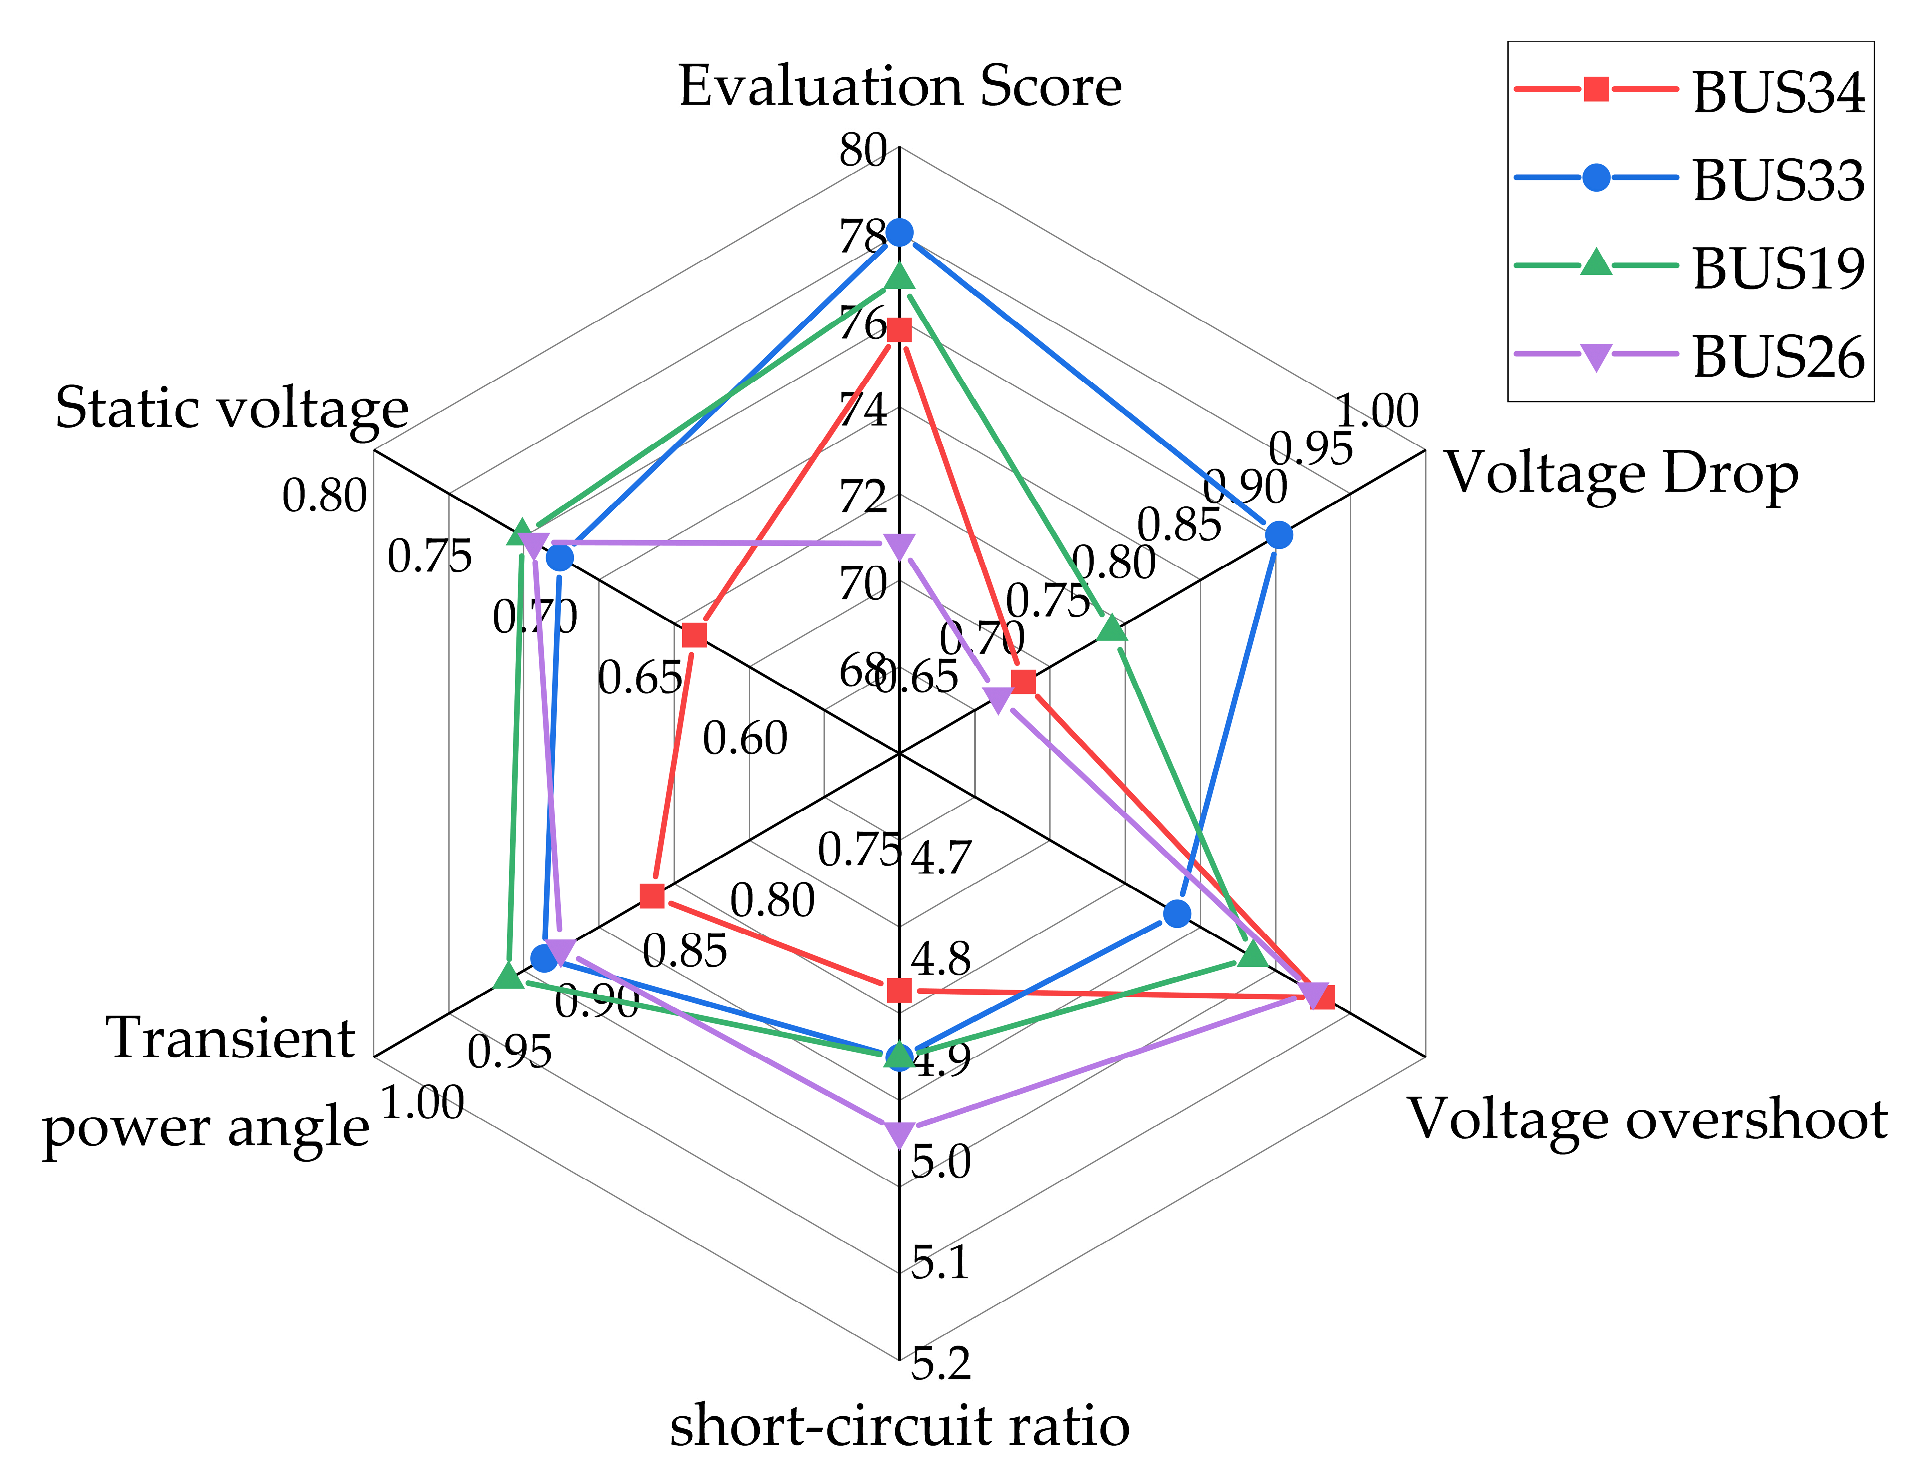
4.2. Comparison of System Evaluation Before and After Thermal Power Unit Retrofitting Under Different Bus Faults

Table 3 shows the scores of system nodes before and after the renovation. A comprehensive evaluation of the system is performed by setting the same three-phase short-circuit serious fault for BUS34, BUS33, BUS19, and BUS26, respectively. Figure 8 compares the stability evaluation indices scores of the system at different fault locations before the retrofitting of the thermal power unit. Figure 9 compares the stability evaluation indices scores of the system at different fault locations after the retrofitting of the thermal power unit. Figure 10 compares the comprehensive evaluation scores of system stability at different fault locations.

4.3. Discussion

In this paper, a new regional power system based on the CEPRI36-node model is constructed, and a serious fault on the busbar at different distances from the grid connection point of the retrofitting units is set to comprehensively evaluate the stability of the new power system. In the simulation, the retrofitting unit locates at BUS5, and four typical nodes, BUS34, BUS33, BUS26, and BUS19, are selected. There are fewer generator units near BUS34, while there are more renewable energy units, resulting in a higher penetration rate of renewable energy. Therefore, BUS34 nodes have strong volatility and instability, and there is a large demand for reactive power when faults occur. BUS33 and BUS34 are connected through a 400 MW, 400 kV LCC-HVDC direct current transmission line, and BUS33 is located at the transmission end of the direct current transmission line, with a high power generation capacity. BUS19 is the closest power supply node to the retrofitting unit node and carries a large load. BUS26 is located at a critical position in the system, undertaking a large amount of power flow and having a significant load demand, which has a significant impact on the stability of the entire power grid.
From Figure 8, it can be seen that when a short circuit fault occurs at the BUS26 node, the stability evaluation score of the system is the lowest, which means that when BUS26 experiences a fault, the system stability is the most affected. This is because BUS26 is located in a critical position in the system and bears a large amount of power flow, so the system stability significantly decreases during the fault. When a short circuit fault occurs at the BUS34 node, the comprehensive evaluation score is relatively low. From the two indices of the multi-feed short-circuit ratio and transient power angle, the score of the BUS34 node is the lowest among these four nodes. This is because there are fewer generator units near BUS34 although there are more renewable energy units, resulting in a higher penetration rate of renewable energy. When a fault occurs, the strength of the system becomes lower and the stability of the system deteriorates as a result. In contrast, when a short circuit fault occurs at BUS33, the system has the highest comprehensive evaluation score. This is because BUS33 is located at the transmission end of DC transmission and has many generator units with sufficient capacity to quickly respond to faults.
According to the analysis of Figure 8, Figure 9 and Figure 10, it can be seen that after the retrofitting of the thermal power unit, when a short circuit fault occurs at BUS34, the system stability evaluation score improves the most, from 66.0145 points at level B to 75.7719 points at level A, which is an increase of 14.7%. Its improvement ability is mainly reflected in the bus voltage drop and static voltage indicators, which are related to the grid connection position of the retrofitting unit. The retrofitting unit locates closer to BUS5 and BUS34, which can enhance the power transmission capacity of the transmission line, improve the power reception capacity of the receiving end, and enable the system to withstand greater load fluctuations and fault impacts. When BUS33 has a fault, the system stability capability evaluation score improved the least, from 72.6398 points at level A to 78.0199 points, still at level A, an increase of 7.4%. The improvement of the shortcomings is mainly reflected in the voltage surge and multi-feed short-circuit ratio because the BUS33 node is located at the transmission end of the DC transmission line, with high power generation capacity and system inertia. When the delivery system fails, the generator units provide certain voltage support. However, since the system has already performed well in terms of stability before the generator retrofitting at level A, it means that its stability has reached a high standard. Therefore, although the generator retrofits to a synchronous condenser which can further enhance the stability of the system, the support effect of the phase modulation is relatively low due to its high stability, so the improvement is limited. When the BUS19 node fails, its rating increases from 68.1397 to 76.9347, from level B to level A, which is an increase of 12.9%. Due to the short distance between BUS19 and the retrofitting unit node, the improvement effect of its static voltage stability index is also the best, increasing by 39.2%. From the perspective of voltage overshoot and voltage drop indices, the system at the BUS19 node has a fault. The improvement in these two indices is due to the fact that the retrofitting unit can effectively play the role of phase modulation, compensate the reactive power demand of the BUS19 node, and thus improve the stability of the system. For node BUS26, on the one hand, it is considered that it is far away from the retrofitting unit BUS5 node, and on the other hand, it is located in a critical position in the system, bearing a large amount of load. This increases the rating of the BUS26 node from 63.8916 points to 71.2351 points, from level B to level A, which is an increase of 11.5%. After the unit retrofitting, both the static voltage and transient power angle improves greatly, with the most significant increase of 32.6% in the multi-feed effective short-circuit ratio index. This indicates that the anti-interference capability of the BUS26 node in thermal power units has been greatly improved after adding phase modulation.
Compared with the qualitative analysis of system stability in the past, this paper quantitatively studies the ability of the phase modulation function of a thermal power unit connected in a grid to improve system stability. From the analysis results, it can be seen that after adding a phase modulation function to thermal power units, when the system occurs fault, the voltage drop index, static voltage index, transient power angle stability index, multi-feed short-circuit ratio index, and transient voltage overshoot index all have certain improvements, and the comprehensive evaluation score of the system has been improved. This indicates that adding phase modulation function to thermal power units can significantly improve the stability of the system.

5. Conclusions

This paper evaluates the impact of adding a phase modulation function to thermal power units on the stability power systems and constructs a multi-dimensional comprehensive new power system stability evaluation system. By constructing a CEPRI36-node example model on the PSASP v.7.91.04.9258 (China Electric Power Research Institute, Beijing, China) platform for simulation research, the following conclusions are drawn:
(1)
Adding a phase modulation function to thermal power units can improve the system voltage drop and overshoot indices, effectively suppress voltage drop and overshoot phenomena, and provide stable dynamic reactive power support for the power system.
(2)
For nodes with a high penetration rate of renewable energy, the volatility and uncertainty of the power system increase. After adding phase modulation function to thermal power units, the transient power angle stability index and static voltage stability index are improved, effectively improving the transient stability of the system and reducing the risk of system instability caused by renewable energy fluctuations.
(3)
After adding phase modulation function to thermal power units, the multi-feed short-circuit ratio index has been improved, and the anti-interference ability of the system has been enhanced. It can quickly adjust the excitation current when dealing with short circuit faults, reduce the impact of short-circuit current on the system, and improve the operational flexibility of the system.
In summary, this paper proposes a quantitative method for evaluating the impact of adding phase modulation function to thermal power units on system stability. The method evaluates the impact of adding phase modulation function on power system stability and provides a basic reference for identifying which regions of the power grid can prioritize the retrofitting of thermal power units with a phase modulation function. Future research can further consider validating the effectiveness of this method in more complex power grid structures and explore strategies for improving system stability through the collaborative optimization of multiple technologies combined with different types of power generation equipment.

Author Contributions

Conceptualization, M.L. and X.Y.; methodology, M.L. and X.Y.; software, C.T. and Z.G.; validation, M.L. and C.L.; formal analysis, Z.G.; investigation, D.Z.; resources, C.L.; data curation, M.L.; writing—original draft preparation, M.L.; writing—review and editing, X.Y.; visualization, C.T.; supervision, C.L.; project administration, C.L.; funding acquisition, C.L. All authors have read and agreed to the published version of the manuscript.

Funding

This work was supported by the Science and Technology Project of SGCC in 2022 (Key technology and demonstration of retrofitting thermal power unit to synchronous condenser under new-type power system voltage stability demand, no. 5100-202224023A-1-1-ZN).

Data Availability Statement

No new data were created or analyzed in this study.

Conflicts of Interest

The authors declare no conflicts of interest.

References

  1. Zhou, S.-C.; Li, Y.-F. Enhancing the resilience of the power system to accommodate the construction of the new power system: Key technologies and challenges. Front. Energy Res. 2023, 11, 1256850. [Google Scholar] [CrossRef]
  2. Peng, Y.-M.; Yang, Y.; Chen, M. Value Evaluation Method for Pumped Storage in the New Power System. Chin. J. Electr. Eng. 2023, 9, 26–38. [Google Scholar] [CrossRef]
  3. Tong, J.-L.; Liu, W.-S.; Mao, J.B. Role and Development of Thermal Power Units in New Power Systems. IEEE J. Radio Freq. Identif. 2022, 6, 837–841. [Google Scholar] [CrossRef]
  4. Li, Z.-W.; Cheng, Z.-P.; Liang, J. Distributed Cooperative AGC Method for New Power System with Heterogeneous Frequency Regulation Resources. IEEE Trans. Power Syst. 2023, 38, 4928–4939. [Google Scholar] [CrossRef]
  5. Li, Z.; Lv, P.; Ju, X.; Zhu, C. Research on carbon emission reduction Calculation of thermal power industry under double carbon background. In Proceedings of the 2022 IEEE 5th Advanced Information Management, Communicates, Electronic and Automation Control Conference (IMCEC), Chongqing, China, 16–18 December 2022. [Google Scholar] [CrossRef]
  6. Gou, H.-L.; Jiang, Q. Black Start Method and Coordinated Restoration Strategy of DC Receiving-end Power Grid Based on Hybrid Direct Current. Adv. Eng. Sci. 2023, 55, 70–79. [Google Scholar] [CrossRef]
  7. Cao, D.; Zhao, J.; Hu, W.; Ding, F.; Huang, Q.; Chen, Z. Attention enabled multi-agent DRL for decentralized volt-VAR control of active distribution system using PV inverters and SVCs. IEEE Trans. Sustain. Energy 2021, 12, 1582–1592. [Google Scholar] [CrossRef]
  8. Chae, M.; Cha, H.-Y.; Kim, H. Abnormal temperature and bias dependence of threshold voltage instability in p-GaN/AlGaN/GaN HEMTs. IEEE J. Electron Devices Soc. 2024, 12, 581–586. [Google Scholar] [CrossRef]
  9. Yan, H.-G.; Zhang, W. The Necessity and Feasibility of Hydrogen Storage for Large-Scale, Long-Term Energy Storage in the New Power System in China. Energies 2023, 16, 4837. [Google Scholar] [CrossRef]
  10. Cong, J.; Song, K. Review of energy storage technology for new energy power system. Adv. Technol. Electr. Eng. Energy 2014, 33, 53–59. [Google Scholar]
  11. Wei, Z.-F. Application of Distributed Energy Storage in New Power System. In Proceedings of the 11th International Conference on Power and Energy Systems (ICPES), Shanghai, China, 18–20 December 2021. [Google Scholar] [CrossRef]
  12. Ren, D.; Hou, J.; Xiao, J. Research on Development Potential and Path of New Energy Storage Supporting Carbon Peak and Carbon Neutrality. Electr. Power. 2023, 56, 17–25. [Google Scholar]
  13. Hao, L.; Chen, L.; Huang, Y. Challenges and Prospects of Primary Frequency Regulation of Coal-fired Thermal Power Units for New Power System. Power Syst. Autom. 2024, 48, 14–29. [Google Scholar]
  14. Yang, L.; Li, Y.; Chen, M. An accurate ladder-type ramp rate constraint derived from field test data for thermal power unit with deep peak regulation. IEEE Trans. Power Syst. 2024, 39, 1408–1420. [Google Scholar] [CrossRef]
  15. Li, C.-H.; Liu, M.-Y.; Guo, Y. Cost Analysis of Synchronous Condenser Transformed from Thermal Unit Based on LCC Theory. Processes 2022, 10, 1887. [Google Scholar] [CrossRef]
  16. Fu, H.; Sun, R.; Wang, J. Key technologies of adding a condenser function in thermal power units in the receiving end power grid given a background of carbon peak and neutrality. Power Syst. Prot. Control 2024, 52, 132–143. [Google Scholar]
  17. Jun, A.; Zhang, J.-Y.; Du, X.-Y. Enhance Transient Voltage Stability by Retrofitting Thermal Power Unit to Synchronous Condenser. In Proceedings of the 7th Asia Conference on Power and Electrical Engineering (ACPEE), Online, 16–17 April 2022. [Google Scholar] [CrossRef]
  18. Wang, F.; Yang, P.; Zhao, G.; Li, Q.; Liu, X.; Ma, S. Development and challenges of flexible operation technology for thermal power units in new power systems. Power Gener. Technol. 2024, 45, 189–198. [Google Scholar]
  19. Ma, H.; Liu, D.; Zhao, G. Power Grid Voltage Phasor Trajectory Fitting and Transient Stability Evaluation Index Construction Based on Alternate Direction Multiplier Method. Power Constr. 2023, 44, 136–147. [Google Scholar]
  20. Li, X.; Liu, C.; Xin, S. Coupling mechanism analysis and coupling strength evaluation index of transient angle stability and transient voltage stability. Chin. J. Electr. Eng. 2021, 41, 5091–5107. [Google Scholar]
  21. Guan, L.; Chen, Y.; Chen, H. An evaluation model of probability distribution of stability index based on new power system diagram deep learning considering the randomness of new energy. China South. Power Grid Technol. 2024, 18, 118–128+138. [Google Scholar]
  22. Sun, H.; Xu, S.; Xu, T. Research on Definition and Classification of Power System Security and Stability. CSEE 2022, 42, 7796–7809. [Google Scholar]
  23. GB 38755-2019; Code on Security and Stability for Power System. National Standard of the People’s Republic of China: Beijing, China, 2019.
  24. Li, S.; Duan, C.H.; Gao, Y. Classification Study of New Power System Stability Considering Stochastic Disturbance Factors. Sustainability 2023, 15, 16614. [Google Scholar] [CrossRef]
  25. Li, J.-C.; Li, R.-M.; Xun, C. Statistical Indicator System for New Generation Power System Construction. In Proceedings of the International Conference on Wireless Power Transfer (ICWPT), Weihai, China, 13–15 October 2023. [Google Scholar] [CrossRef]
  26. Zhu, L.; Jiang, T.; Xue, F. Evaluation of short-term active impact of low penetration of large-scale new energy caused by voltage drop. Power Syst. Autom. 2024, 1–18. Available online: http://kns.cnki.net/kcms/detail/32.1180.TP.20240814.1618.004.html (accessed on 15 December 2024).
  27. Li, X.; Fang, Y.; Wu, X. Quantitative index of transient voltage stability based on instability mechanism analysis. Electr. Power Autom. Equip. 2023, 43, 195–202. [Google Scholar] [CrossRef]
  28. Li, F. Short Circuit Ratio Index Considering HVDC Transient Characteristics. In Proceedings of the 6th ACEEE, Chengdu, China, 21–23 July 2023. [Google Scholar] [CrossRef]
  29. Lin, W.; Ren, X.; Zhang, G. Optimization of Voltage Ride-through Control Parameters of Renewable Energy Considering Power Angle Stability and Transient Overvoltage. Grid Technol. 2023, 47, 1323–1331. [Google Scholar] [CrossRef]
  30. Sadeghi, S.E.; Shahabi, M.; Akbari Foroud, A. A new approach for static voltage stability assessment in transmission networks in the presence of OLTC. Electr. Power Syst. Res. 2024, 236, 110941. [Google Scholar] [CrossRef]
  31. Yang, Y.; Huang, Q.; Li, P. Online prediction and correction control of static voltage stability index based on broad learning system. Expert Syst. Appl. 2022, 199, 117184. [Google Scholar] [CrossRef]
  32. Chintakindi, R.; Mitra, A. Wide-area voltage stability assessment using loading margin sensitivity for increasing linear load levels and wind power penetration. Electr. Power Syst. Res. 2024, 233, 110487. [Google Scholar] [CrossRef]
  33. Li, M.; Mei, W.; Liu, Y. Accurate Identification Method of Brittle Branches in Power Grid Based on Improved Load Flow Entropy Indexes. Power Syst. Technol. 2019, 43, 1026–1033. [Google Scholar] [CrossRef]
  34. Sevinç, A.; Gür, S.; Eren, T. Analysis of the Difficulties of SMEs in Industry 4.0 Applications by Analytical Hierarchy Process and Analytical Network Process. Processes 2018, 6, 264. [Google Scholar] [CrossRef]
  35. Ma, L.; Lu, Z.; Chang, L. Study of index system of economic operation of grid based on gray correlation degree. Power Syst. Prot. Control. 2011, 39, 22–26. [Google Scholar]
  36. Liu, Y.; Zhang, J.; Yang, X. Comprehensive Evaluation of Relay Protection Based on Expert Investigation and G1 Method. Power Grid Technol. 2020, 44, 3533–3539. [Google Scholar]
  37. Lin, Z.Z.; Wen, F.S. CRITIC-Based Node Importance Evaluation in Skeleton-Network Reconfiguration of Power Grids. IEEE Trans. Circuits Syst. II-Express Briefs. 2018, 65, 206–210. [Google Scholar] [CrossRef]
Figure 1. Weighted quantization analysis based on multi-binary tables.
Processes 12 02897 g001
Figure 2. Weighted quantitative analysis based on multiple binary criteria.
Processes 12 02897 g002
Figure 3. A typical PV curve of load bus.
Processes 12 02897 g003
Figure 4. The flowchart of stability evaluation index system construction for receiving-end power grid.
Processes 12 02897 g004
Figure 5. The flowchart of the evaluation methodology for the stability of the receiving-end power grid.
Processes 12 02897 g005
Figure 6. Construction of membership function model.
Processes 12 02897 g006
Figure 7. CEPRI36-node topology geographical wiring diagram including renewable energy AC/DC system. The red line represents the 500 kV bus voltage and the green line represents the 220 kV bus voltage in Figure 7.
Processes 12 02897 g007
Figure 8. Comparison of stability evaluation indices and scores of the system before unit retrofitting.
Processes 12 02897 g008
Figure 9. Comparison of stability evaluation indices and scores of the system after unit retrofitting.
Processes 12 02897 g009
Figure 10. Comprehensive evaluation scores of system stability before and after unit retrofitting.
Processes 12 02897 g010
Table 1. Evaluation index set table.
V//LevelPercentage
v1A70–100
v2B62–70
v3C54–62
v4D46–54
v5E38–46
v6F30–38
v7G0–30
Table 2. Membership function parameters table.
IndexMembership Function Parameters
a 1 a 2 a 3 a 4 a 5 a 6 a 7
ξ V i 0.80.70.60.50.40.30.2
ζ V i 0.80.70.60.50.40.30.2
P 3.53.2532.752.52.252
δ T A S I 0.80.70.60.50.40.30.2
L J 0.80.70.60.50.40.30.2
Table 3. Score table of system evaluation before and after retrofitting.
Fault Bus\ScoreBefore RetrofittingAfter Retrofitting
BUS34B(66.0145)A(75.7719)
BUS33A(72.6398)A(78.0199)
BUS19B(68.1397)A(76.9347)
BUS26B(63.5372)A(70.8428)
Disclaimer/Publisher’s Note: The statements, opinions and data contained in all publications are solely those of the individual author(s) and contributor(s) and not of MDPI and/or the editor(s). MDPI and/or the editor(s) disclaim responsibility for any injury to people or property resulting from any ideas, methods, instructions or products referred to in the content.

