Article

Evaluation Study of the Passivation Effect of Arsenic-Contaminated Farmland Soil

1
School of Environment and Energy, South China University of Technology, Guangzhou 510006, China
2
Xinsha Stevedoring Co., Ltd., Guangzhou Port, Guangzhou 510006, China
3
Guangdong Yuegang Water Supply Co., Ltd., Shenzhen 518000, China
*
Author to whom correspondence should be addressed.
Processes 2024, 12(12), 2802; https://doi.org/10.3390/pr12122802
Submission received: 24 October 2024 / Revised: 2 December 2024 / Accepted: 3 December 2024 / Published: 8 December 2024
(This article belongs to the Special Issue Soil Remediation Processes)

Abstract

:
In situ passivation technology, by reducing the bioavailability of arsenic in soil, thereby reducing its uptake by crops, is currently the main remediation method for arsenic-contaminated farmland soil. However, applying stabilizing materials may also affect the other properties of soil, ultimately influencing the growth of crops. The long growth cycles of crops and their susceptibility to factors such as agronomic measures make plant-based indicators less practical as evaluation indicators. In this study, five kinds of passivation materials, including iron-based biochar (T1), coffee residue (T2), red mud (T3), chitosan-modified iron filings (T4), and modified minerals (T5) were applied in pot experiments. The study analyzed the effects of the passivation materials on soil properties and the growth and safety traits of plants. Key soil indicators influencing biomass were identified, the passivation remediation effects were evaluated, and a method using soil property indicators instead of plant indicators for passivation remediation evaluation was developed. The results showed that key indicators influencing the biomass change of water spinach due to passivation treatment included total nitrogen, total phosphorus, and catalase activity. The improved comprehensive evaluation indicators for passivation effects include available arsenic in soil, total nitrogen, total phosphorus, and catalase activity. I-SI can be expressed as I - S I = 0.6 A s s o i l + 0.4 2.152 T N + 0.422 T P + 0.334 C A T 0.261 . I-SI is highly feasible, where a higher value indicates better remediation efficacy. After evaluation, iron-based biochar was the best passivation effect. An evaluation method for the passivation effect was constructed based on these findings, aiming to simplify the process of comprehensive evaluation of the passivation effect and shorten the evaluation time, providing a new idea for assessing the passivation effect.

1. Introduction

About 80% of soil pollution in China is caused by heavy metals, and about 20% of farmland is contaminated by arsenic, cadmium, and lead [1]. On the one hand, the accumulation of arsenic in soil causes soil crusting and nutrient loss, affecting the soil fertility and leading to a decrease in crop yield and quality [2]. On the other hand, the long-term accumulation of arsenic increases its uptake by vegetables, and the arsenic can enter the human body through the food chain, posing a threat to human health [3].
In situ passivation remediation, widely used in arsenic-contaminated soil, is currently the primary remediation method due to its advantages such as fast effect, low cost, and practicality [4,5]. Applying organic substances [6], clay minerals [7], iron-based materials [8], silicon-based materials [9], phosphorus-containing substances [10], and other passivators reduces arsenic bioavailability through adsorption, complexation, ion-exchange, and precipitation to reduce arsenic uptake by crops [11]. However, while reducing arsenic bioavailability, passivators also affect soil physicochemical and biological properties, which may affect crop yield increase and safety.
Currently, the passivation effect is mainly evaluated by the concentration of bioavailable heavy metals in soil, and some of these also affect the crop biomass and heavy metal content in roots and leaves. Many studies chose one or more indicators to evaluate the passivation effect individually and expressed the passivation effect by describing the amount of change before and after passivation [7,12,13]. Vrînceanu et al. [13] used soil pH, DTPA-extractable heavy metal concentration, crop yield, and heavy metal concentration in crops as evaluation indicators to assess the benefits of heavy metal immobilization, and the evaluation results were qualitatively described by the magnitude of change in a single indicator. There are also a few evaluation methods that integrate soil properties and crop indicators to evaluate the remediation effect [14,15,16]. Chen et al. [14] designed a method to evaluate the feasibility and effectiveness of three immobilization agents (wollastonite, dolomite, and calcite) in cadmium-polluted soil using four criteria and 11 indicators of soil quality, rice response, environmental safety, and economic benefits. This method, however, had the disadvantages of redundant indicators, overlapping information, and poor accuracy. Therefore, the selection of appropriate evaluation indicators is particularly critical.
The long growth cycle of crops and their susceptibility to factors such as agronomic measures make plant-based indicators less practical as evaluation indicators, limiting their application in the evaluation system of the passivation effect. In this study, we designed a method that used soil property indicators to replace plant indicators to construct a comprehensive evaluation system, enabling rapid assessment of the effect of passivation technology. Using arsenic-contaminated farmland soil as the test soil, representative arsenic passivators were selected as the test materials to investigate the effects of their application on soil properties. The total arsenic concentration and biomass of the edible part of water spinach were determined through pot experiments. The response to the application of the passivation materials, and the key soil property indicators of the changes in the biomass of the water spinach caused by passivation were screened through correlation analyses. A new comprehensive evaluation method was constructed to simplify the evaluation process, shorten the evaluation time in arsenic-contaminated farmland, and provide new ideas for the evaluation of the passivation effect.

2. Materials and Methods

2.1. Materials

Experimental soil: The experimental soil was taken from farmland around the mining area of Nandan County, Guangxi Province, China (near 24°28′ N, 107°34′ E). The sampling method of randomized point sampling was selected, and the soil was taken from multiple points for mixing, with a sampling depth of 0–20 cm. The soil samples were naturally dried, ground after removing stones and weeds, and then passed through a 10-mesh nylon sieve for preservation and spare. Before applying the amendments, the specific properties were evaluated, as shown in Table 1. The soil pH was 6.41 and it had a loam texture with 45.86% sand, 40.68% silt, and 13.46% clay. The total As concentration in the soils was measured as 256.23 mg·kg−1, which exceeded the risk screening value (30 mg·kg−1) defined in the Chinese national standard (GB 15618-2018) for soil contamination in agricultural land [17].
Experimental materials: Iron-based biochar, red mud, coffee grounds, chitosan-modified iron filings, and modified minerals. Iron-based biochar, in powder form, was mainly composed of reduced iron, activated carbon, and fillers, with a total iron content of ≥5%, a pH of 6.50, and a total arsenic content of 3.69 mg/kg. Coffee grounds, taken from a coffee shop and used after sun-drying, were pH 5.72. Red mud, in powder form, contained iron oxides, titanium dioxide, quartz, and so on, and was pH 8.25. In chitosan-modified iron filings, the main raw materials were chitosan and waste iron filings, particle size was 35–80 mesh, and pH was 4.05. Modified minerals were in powder form. The main ingredients included modified montmorillonite, modified humic acid, and sulfate, and pH was 12.93. The physical appearance of the five materials is shown in the Figure S1a.
Experimental crop: water spinach (Ipomoea aquatica).

2.2. Pot Experiment

For this study, six treatments with three replicates each were set up: control (CK), application of 3% iron-based biochar (T1), 1% coffee grounds (T2), 3% red mud (T3), 6% chitosan-modified iron filings (T4), and 1.5% modified minerals (T5). The specific additive amount was the optimal additive amount recommended by the manufacturer and the results of the pre-experiment to determine the optimal additive amount. The soil was weighed, 500 g was placed in each plastic pot, and the passivator was mixed fully with the soil according to the experimental design. This was followed by sowing 8 seeds in each pot and retaining 4 seedlings with the same growth to be planted into the pots after germination. All pots were kept at 60% of the maximum water-holding capacity during planting by the weighing method, using distilled water, with no additional fertilizers being added in the planting process. Thirty days after planting, soil and plant samples were collected. An illustration of the pots in the in situ immobilization experiment is shown in Figure S1b.

2.3. Measurement Items and Methods

According to the suggestions of Li et al. [18], indicators were selected based on a high frequency of research and a greater impact on the quality of soil fertility (Table S1). The physical indicators affecting the structure of the soil are soil bulk weight (BD) and texture. The chemical indicators affecting the transformation, release, and effectiveness of soil nutrients are pH, electrical conductivity (EC), and cation exchange capacity (CEC). The nutritional indicators affecting the soil nutrients are organic matter (OM), total nitrogen (TN), total phosphorus (TP), alkaline nitrogen (AN), available phosphorus (AP), and available potassium (AK). Indicators of enzyme activities that are closely related to soil fertility and catalyze the transformation of soil substances are catalase (CAT), urease (UE), sucrase (SC), and phosphatase (ACP).

2.3.1. Sample Collection and Pre-Treatment

At harvest time, plants from each of the treatment plots were collected and the rhizosphere soil attached to their roots was separated. The biomass of each plot was weighed after drying. Then, the plant samples were dried in an oven at 65 °C until they reached constant weight. The dried plants were ground in a high-density grinding tank and passed through a 0.15 mm sieve. The soil samples were air-dried and screened by a 10-mesh nylon sieve and then screened by a 100-mesh nylon sieve after grinding.

2.3.2. Soil Analyses

The basic physical and chemical properties of the soil were determined according to Lu [19]. Among these properties, soil bulk weight was determined using the ring knife method and texture was determined using the specific gravity meter rapid method. Soil pH was measured by a pH meter (SGB-8, Mettler Toledo, Greifensee, Switzerland), and the ratio of the soil sample to the deionized water (CO2 removed) was 1:2.5. Electrical conductivity was determined using a conductivity meter. Cation exchange was determined using the ammonium acetate method. Organic matter was determined using potassium dichromate oxidation (UV-2550, Shimadzu, Kyoto, Japan). Total nitrogen was determined using Kjeldahl distillation titration. Alkaline nitrogen was determined using the alkaline diffusion method. Total phosphorus was determined using the wet digestion molybdenum–antimony anti-colorimetric method (UV-2550, Shimadzu, Japan). Available phosphorus was determined by the hydrochloric acid–ammonium fluoride extraction molybdenum–antimony colorimetric method (UV-2550, Shimadzu, Japan). Available potassium was determined by ammonium acetate extraction-flame atomic absorption spectrophotometry (PinAAcle 900T, PerkinElmer, Shelton, CA, USA). Catalase activity was determined by potassium permanganate titration [20]. Urease activity was determined by the sodium phenol–sodium hypochlorite colorimetric method (UV-2550, Shimadzu, Japan) [21]. Sucrase activity was determined by the colorimetric method of 3,5-dinitrosalicylic acid (UV-2550, Shimadzu, Japan). Phosphatase activity was determined by the colorimetric method of disodium benzene phosphate (UV-755B, Shanghai Precision Scientific Instrument, Shanghai, China). Available arsenic concentration was determined by NaHCO3 leaching atomic fluorescence spectrometry (BAF-3000, Baode Instrument, Beijing, China) [22,23]. All samples were analyzed using reagent blanks, parallel samples, and national standard samples (GSS-34) for quality assurance and quality control, the recoveries were in the range of 93–103%, and the relative deviations of the parallel samples were controlled to within 10%.

2.3.3. Plant Analyses

The biomass of the edible part of the plant was determined by the weighing method (BT124S, Sartorius, Goettingen, Germany). Total arsenic concentration of the edible part was determined by hydride generation atomic fluorescence spectrometry (BAF-3000, Baode Instrument, China) (GB 5009.11-2014) [24].

2.4. Evaluation Method

The indicators for the evaluation of the passivation effect include dry weight and total arsenic concentration of edible parts of crops to meet the requirements of food safety and green development. The plant indicators were standardized by the rate of change before and after passivation [25], and then the evaluation score of passivation effect SI was calculated by multiplying the score of each indicator by the standard weight [14,26].
M = C 0 C i C 0
B = B i B 0 B 0
S I = 0.6 M + 0.4 B             C i 0.5
where C 0 (mg As/kg dry biomass) is the total As concentration of edible part of crops before passivation; C i (mg As/kg dry biomass) is the total As concentration of edible part of crops after passivation; 0.5 is the limit value of As concentration in vegetables (GB 2762-2022) [27]; B 0 (g dry biomass/pot) is the dry weight of edible part of crops before passivation; B i (g dry biomass/pot) is the dry weight of edible part of crops after passivation; ∆M is the reduction rate of As in water spinach; ∆B is the crop biomass increase rate; and 0.6 and 0.4 represent the weights of total arsenic concentration and biomass of edible parts, respectively. The total As concentration was set to a passing line of 0.6 for the sake of food safety and was combined with the percentage system [28]. The larger value of SI indicates the best effect of passivation treatment.

2.5. Improvement of Comprehensive Evaluation Method of Passivation Effect

Changes in soil quality can directly or indirectly affect the growth of crops [29]. This study proposes to improve the comprehensive evaluation system of the passivation effect by using soil indicators instead of crop indicators. The specific approaches are as follows: first, soil available heavy metal concentration can better predict the risk of heavy metal exceeding in crops [30,31,32], so soil available As concentration can be used instead of total arsenic content of edible part of crops for evaluation in this study; then, correlation analysis was utilized to screen the key soil indicators affecting the biomass of the edible portion of the water spinach, and then the relationship between the biomass of the edible part of the water spinach and the soil indicators was described by multinomial linear fitting; finally, the improved comprehensive evaluation method of passivation effect was obtained by combining Equation (3).

2.6. Data Analysis

Excel 2016 was used for experimental data processing and calculation, and SPSS 26.0 was used for one-way analysis of variance (ANOVA) to test the significant differences and correlation analysis of the experimental data. Origin 2021 software was used for graphical visualization. The data are presented as means ± standard deviation (n = 3).

3. Results and Discussion

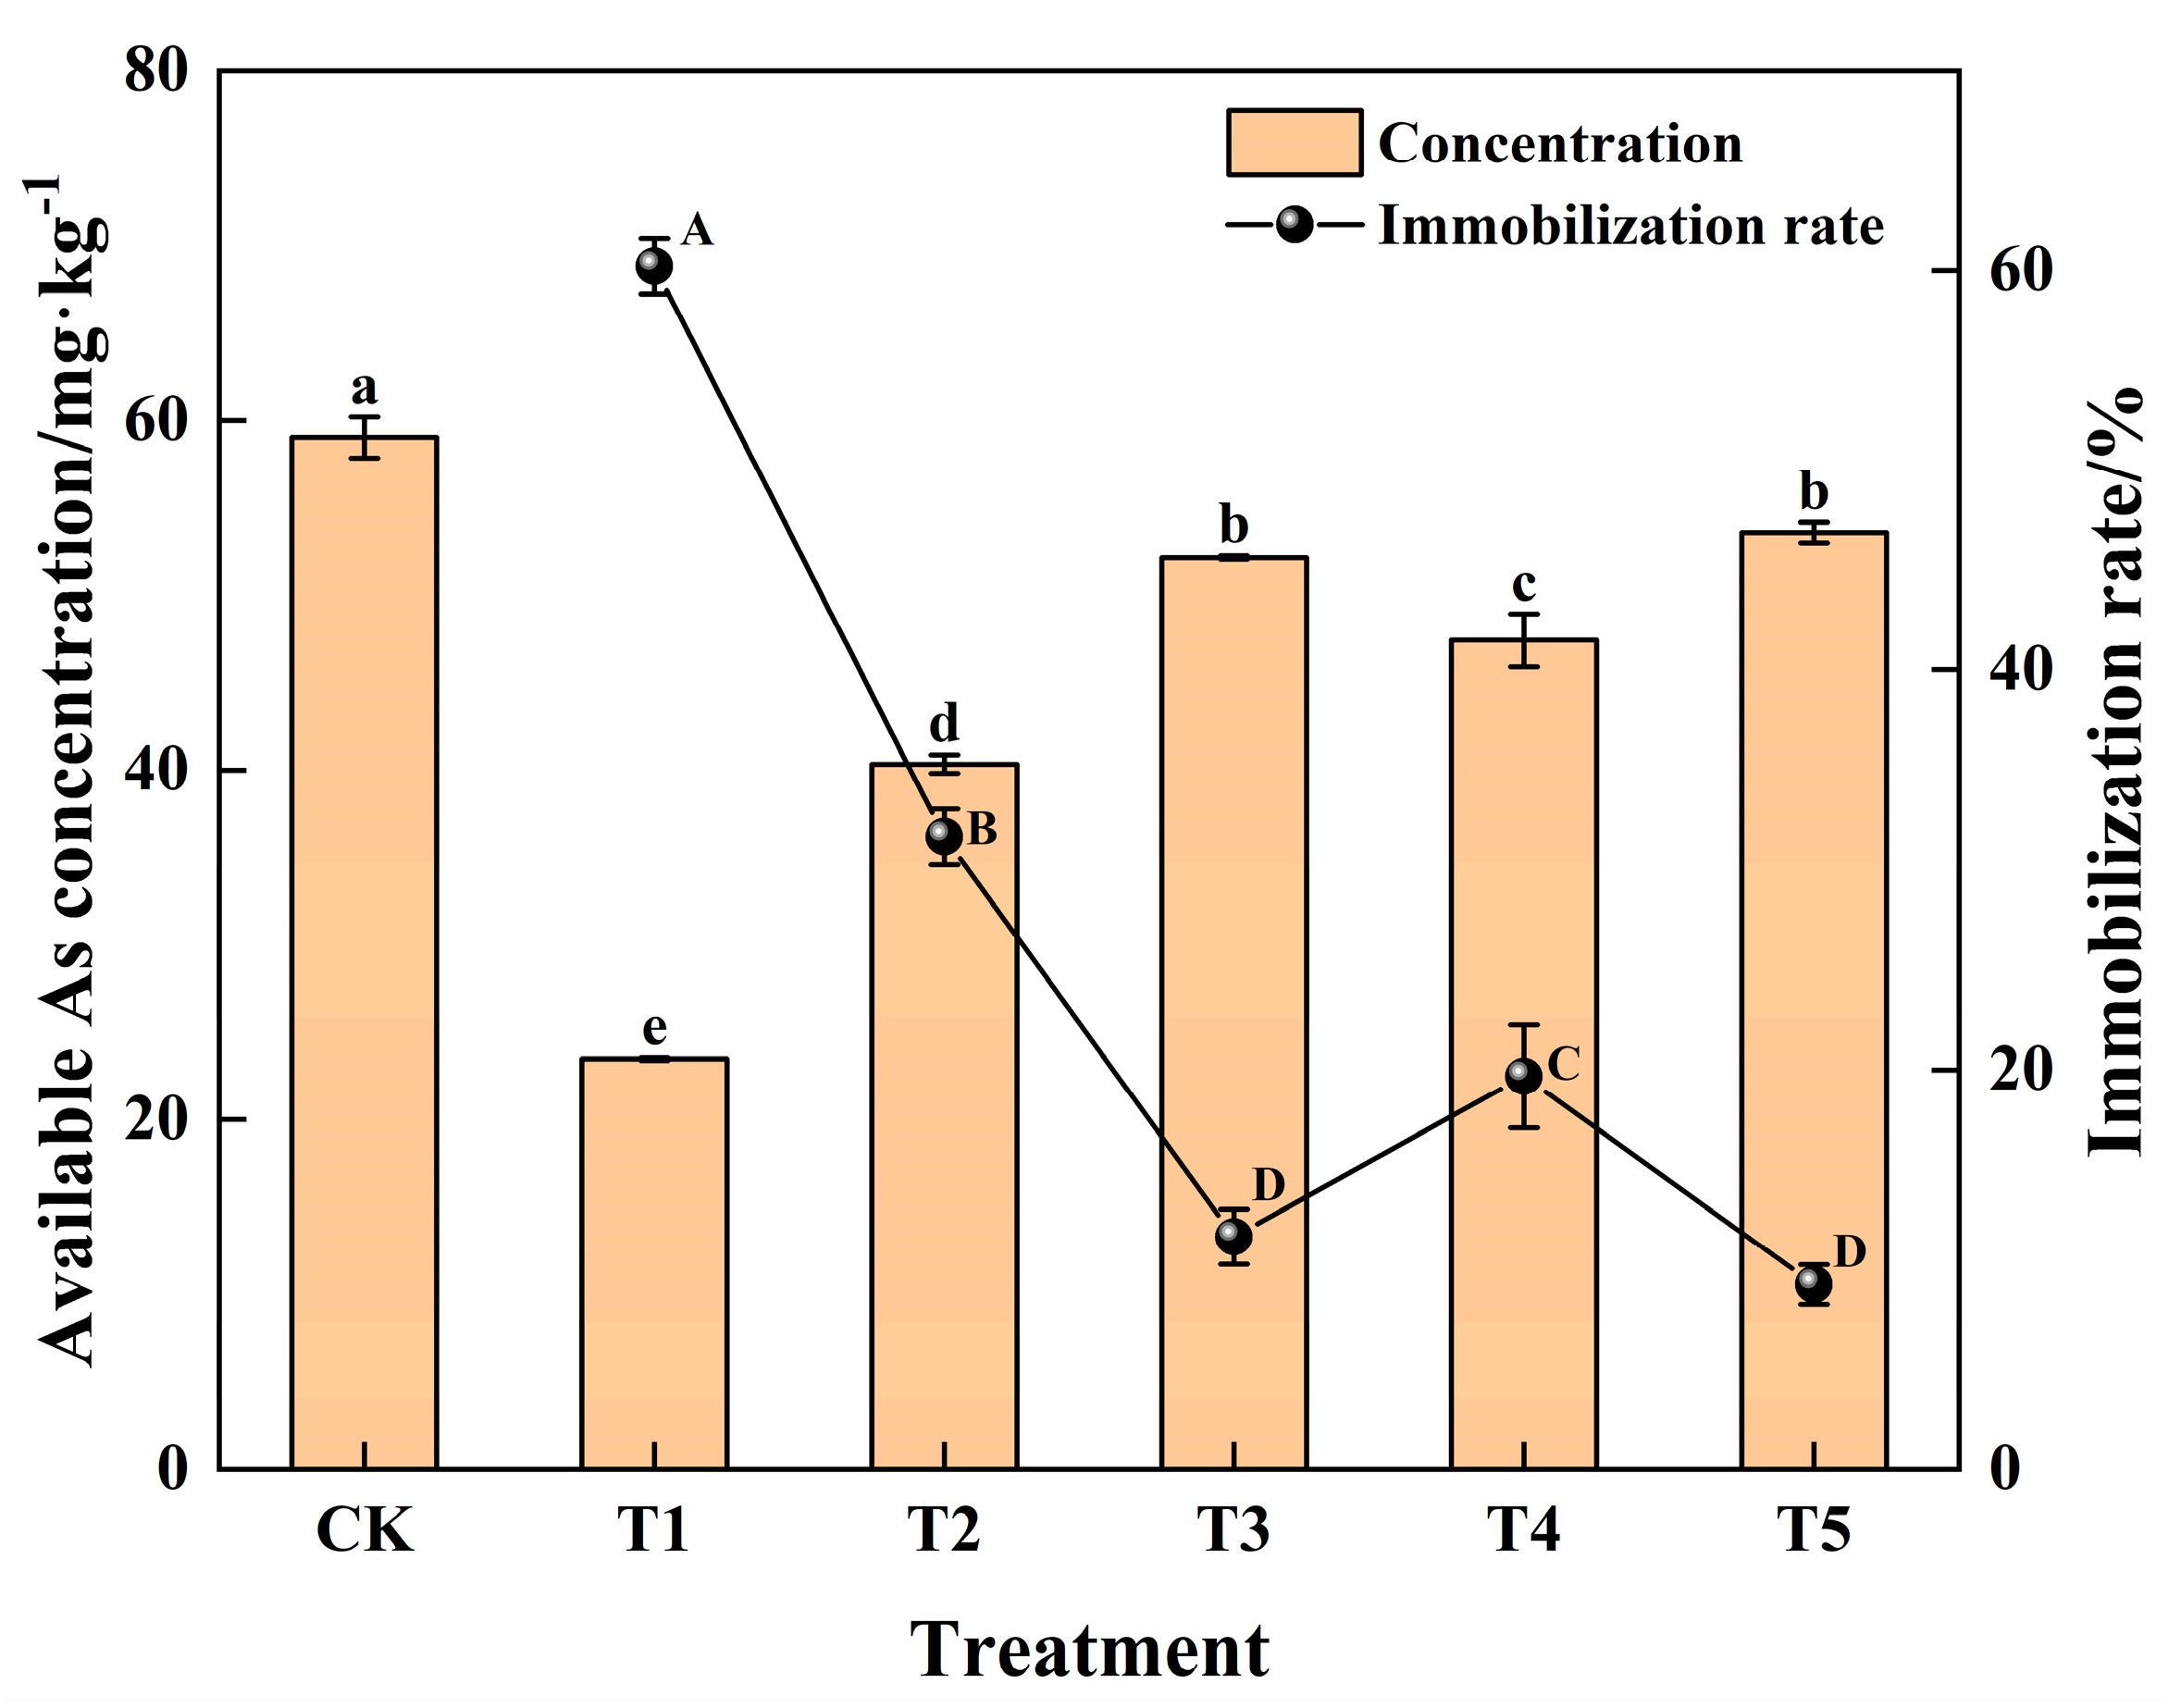
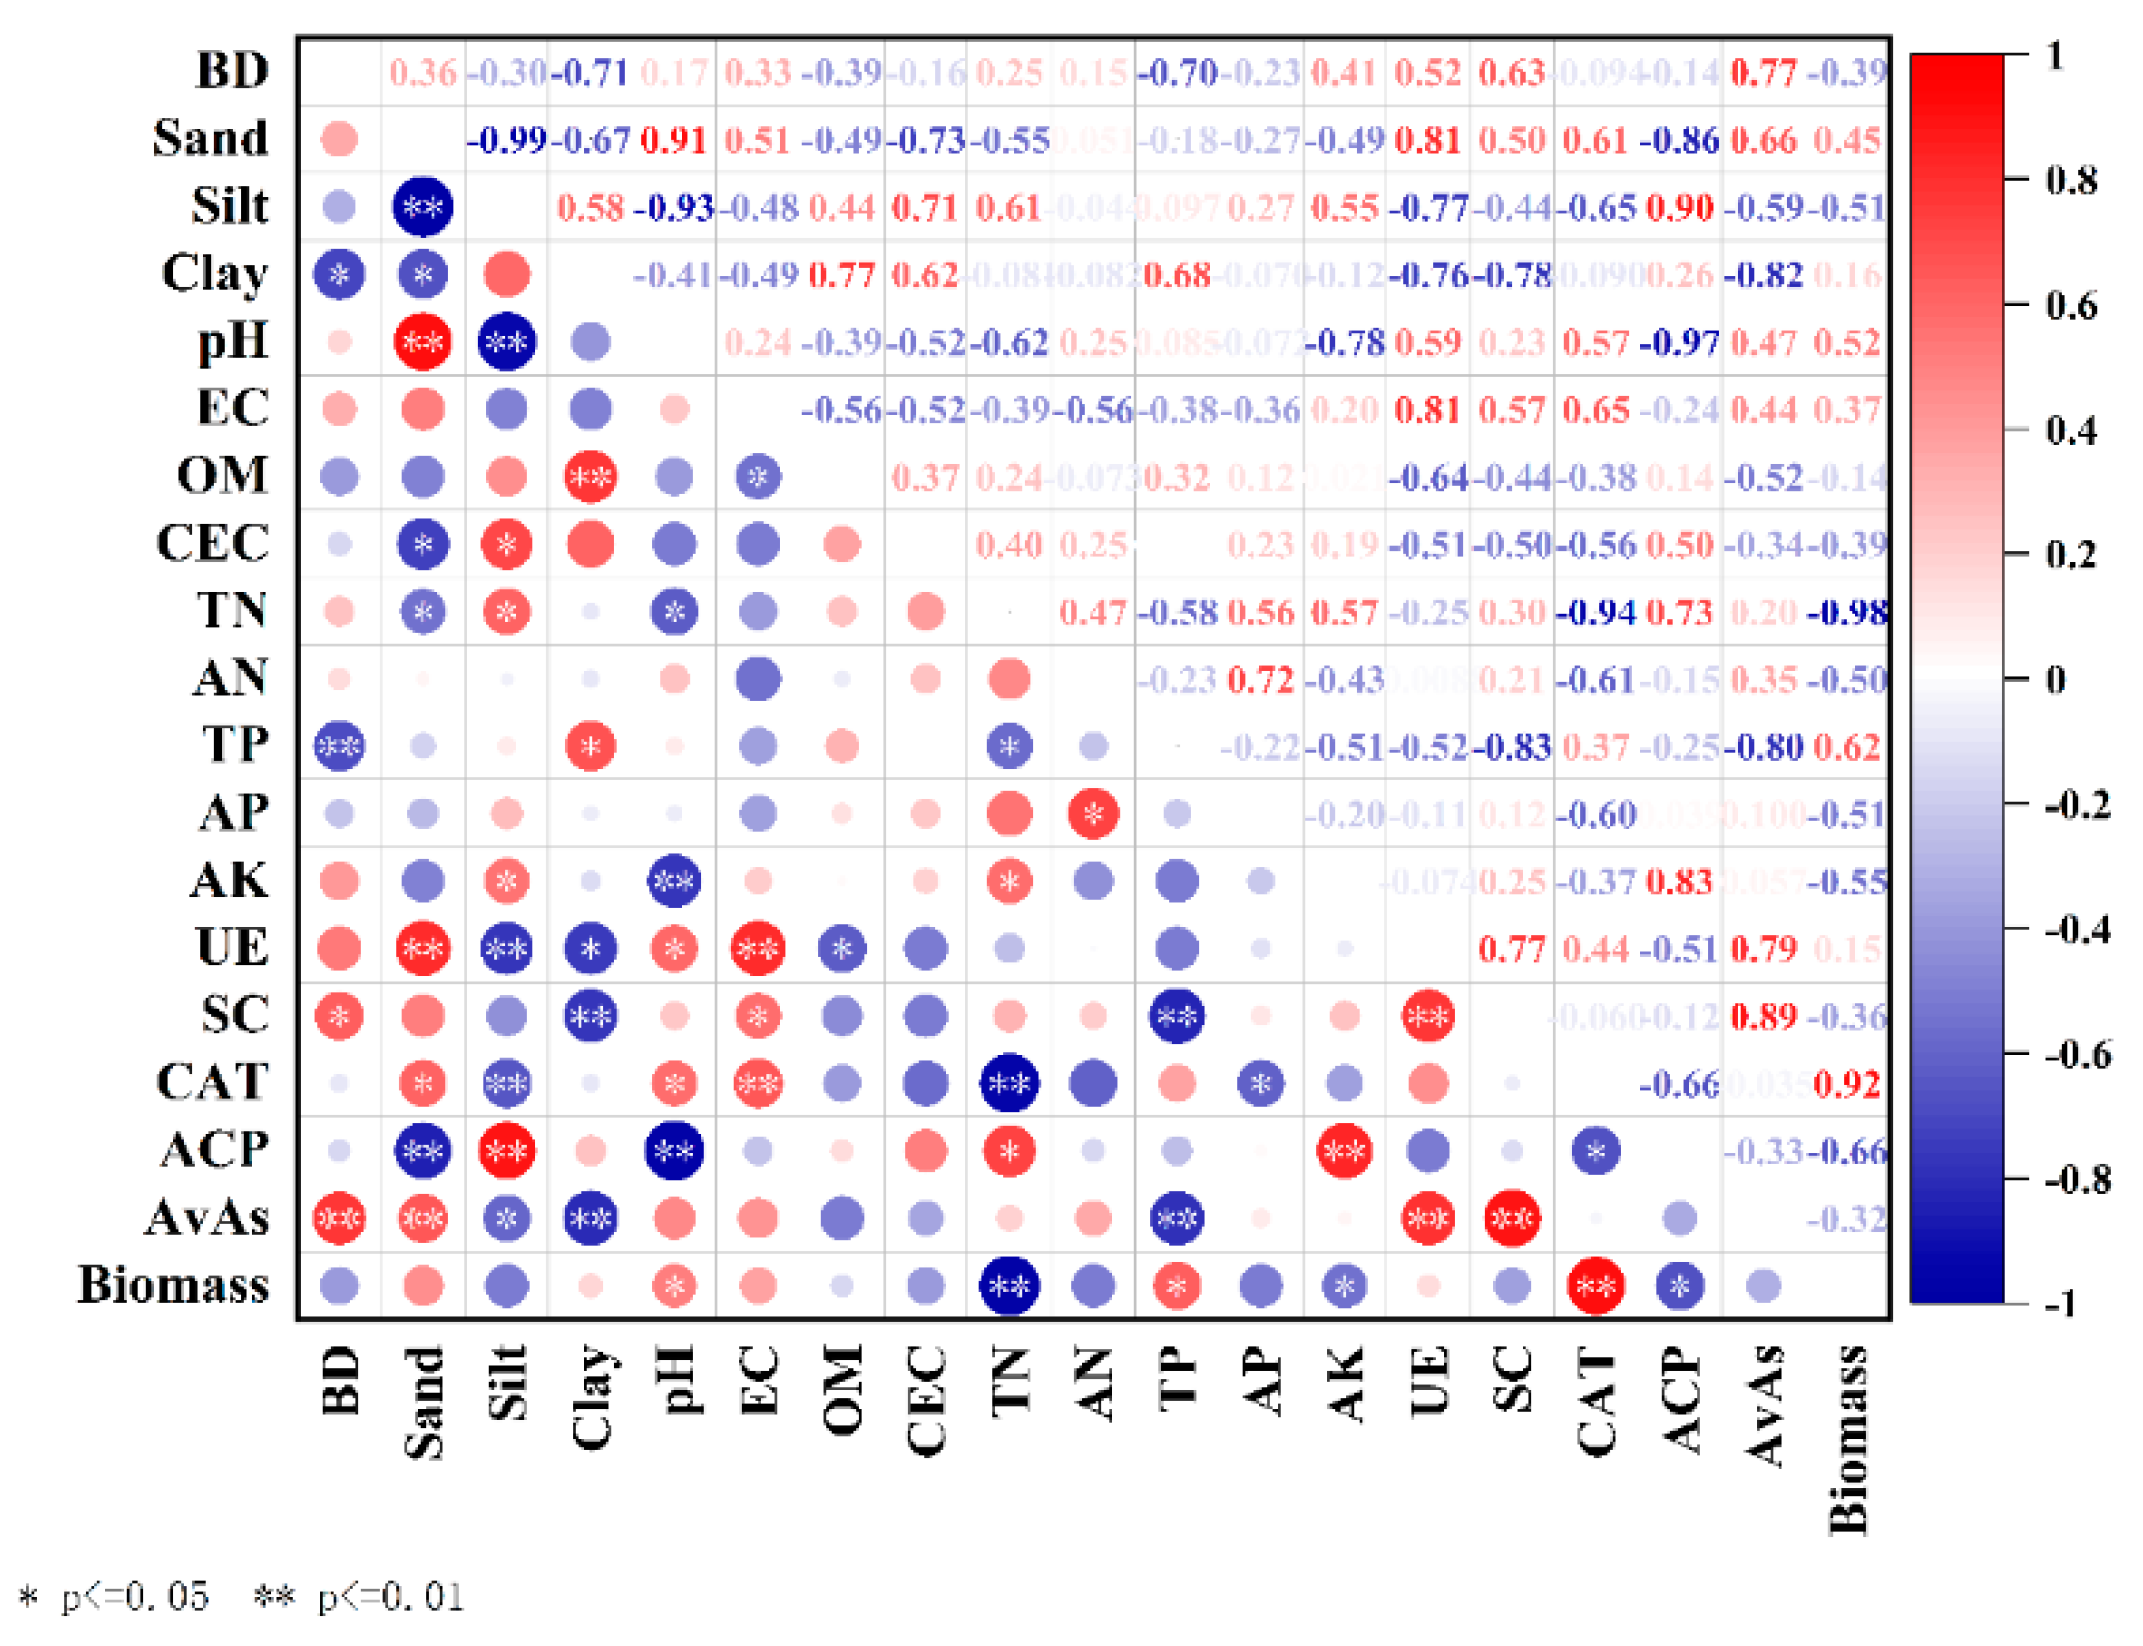
3.1. Influence of Passivated Material Application on Soil Properties

We first analyzed the influences of passivated material application on soil properties. As shown in Table 2, there were significant differences in the influences of passivated materials on soil texture, pH, EC, AK, AP, AN, TN, TP, UE, SC, ACP, and CAT, but there were lesser influences on soil BD, OM, and CEC.
In terms of physical indicators, compared with CK, T3, T4 and T5 treatments significantly reduced the content of soil clay content; the silt content in T3 and T5 treatments was significantly lower than in CK; and the sand content in T3 and T5 treatments was significantly higher than in CK. After passivation, T3 and T5 treatments changed the soil texture (Figure S2), presumably because the passivation material played a bonding role in the soil–passivator system to make the particle size larger to promote the increase in the proportion of sand particles, thus changing from loamy soil to sandy loam. Red mud contains a large amount of calcium compounds, which can play a cementing role in the soil, causing smaller soil particles to aggregate and form larger particle agglomerates. Zhou et al. [33] found that the addition of red mud can also bring in more organic matter, which promotes soil agglomeration.
In terms of chemical indicators, the soil pH of all had changed significantly after passivator application, and all treatments except T3 and T5 had significantly reduced soil pH, with the pH in the order of T5 > T3 > CK > T1 > T4 > T2. Red mud and modified minerals are alkaline materials, and the pH of soil increased after application, which contradicts the common sense idea that the increase in pH can enhance the mobility and bioavailability of arsenic in the soil [34]. Red mud treatment significantly reduced the available arsenic concentration. This was attributed to the increase in effective calcium content and soil pH. The high calcium content in red mud led to arsenic immobilization by adsorption or formation of Ca–As precipitation [35]. The main components of modified minerals include modified montmorillonite, modified humic acid, and sulfate, and the immobilizing effect on arsenic is mainly due to the binding of As to humic acid through cationic bridges involving Al, Fe, and Ca impurities present in the humic acid, or by directly binding to humic acid amino groups [36]. We believe that the addition of alkaline materials contributed to the increase in pH resulting in less arsenic desorption than its fixation of arsenic, thus immobilizing arsenic. There were significant differences in the EC of the different treatments, with the T3 treatment significantly increasing EC compared to CK, due to the fact that the Na content in red mud can increase the soil conductivity (EC), inducing the displacement of mobile HM cations, promoting their binding to negatively charged soil particles [33]. None of the soil CECs were significantly different from CK after applying passivated materials, but CEC was elevated after passivation treatment, probably because the application of passivated materials changed the surface properties of the soil, making it more susceptible to absorption, retention, and exchange of cations. The acidic aromatic carbon on the surface of iron-based biochar (T1) was oxidized to form abundant functional groups (-OH, -COOH), which enhanced the adsorption capacity of soil cations and increased soil CEC [37].
In terms of nutrient indicators, although soil organic matter was not significantly different from CK in all treatments, T2 and T3 treatments increased OM by 6.64% and 3.00%, respectively, while in all other treatments it decreased. Soil total nitrogen was significantly elevated by 19.64% and 12.5% with T2 and T4 treatments compared with CK. T5 and T2 treatments elevated soil alkaline nitrogen by 104.52% and 75.33%, respectively, while the rest of the treatments resulted in a significant decrease. All treatments except T1 significantly decreased soil total phosphorus. All treatments except T2 significantly increased soil available phosphorus, while the rest of the treatments decreased it. Compared with CK, coffee residue passivator T2 resulted in an increase in AN, AP, and AK by 75.33%, 21.01%, and 21.05%, respectively, which suggests that coffee residue passivator can help to equalize and enhance the active nutrients of the soil, probably because the coffee grounds themselves contain considerable amounts of nutrients such as nitrogen, potassium, and phosphorus [38].
In terms of enzyme activity indicators, passivator application significantly increased soil urease and sucrase activity compared to CK, and the trends of urease and sucrase were consistent, which was consistent with the result of significant positive correlation between urease and sucrase (Figure 3). The soil catalase activity increased in all treatments except T2 where it significantly decreased. Soil phosphatase activity content was increased in all treatments except T5. The significant increase in soil urease and sucrase by passivator application may be due to the fact that passivated materials can adsorb and immobilize arsenic in the soil, reduce its toxicity to water spinach, minimize harmful effects on microorganisms, and indirectly affect the metabolism of vegetable root exudates such as amino compounds, sugars, and organic acids [39], which act as microbial nutrients and indirectly increase soil enzyme activity content [40].
In situ passivation is a process in which the total amount of heavy metals remains unchanged and the content of the effective state is reduced. After the application of different passivators, the available As concentration of soil was significantly reduced (Figure 1), with T1 passivator having the best treatment effect with an immobilization rate of 60.22%. The passivation rate in descending order was T1 (60.22%) > T2 (31.65%) > T4 (19.67%) > T3 (11.64%) > T5 (9.24%).

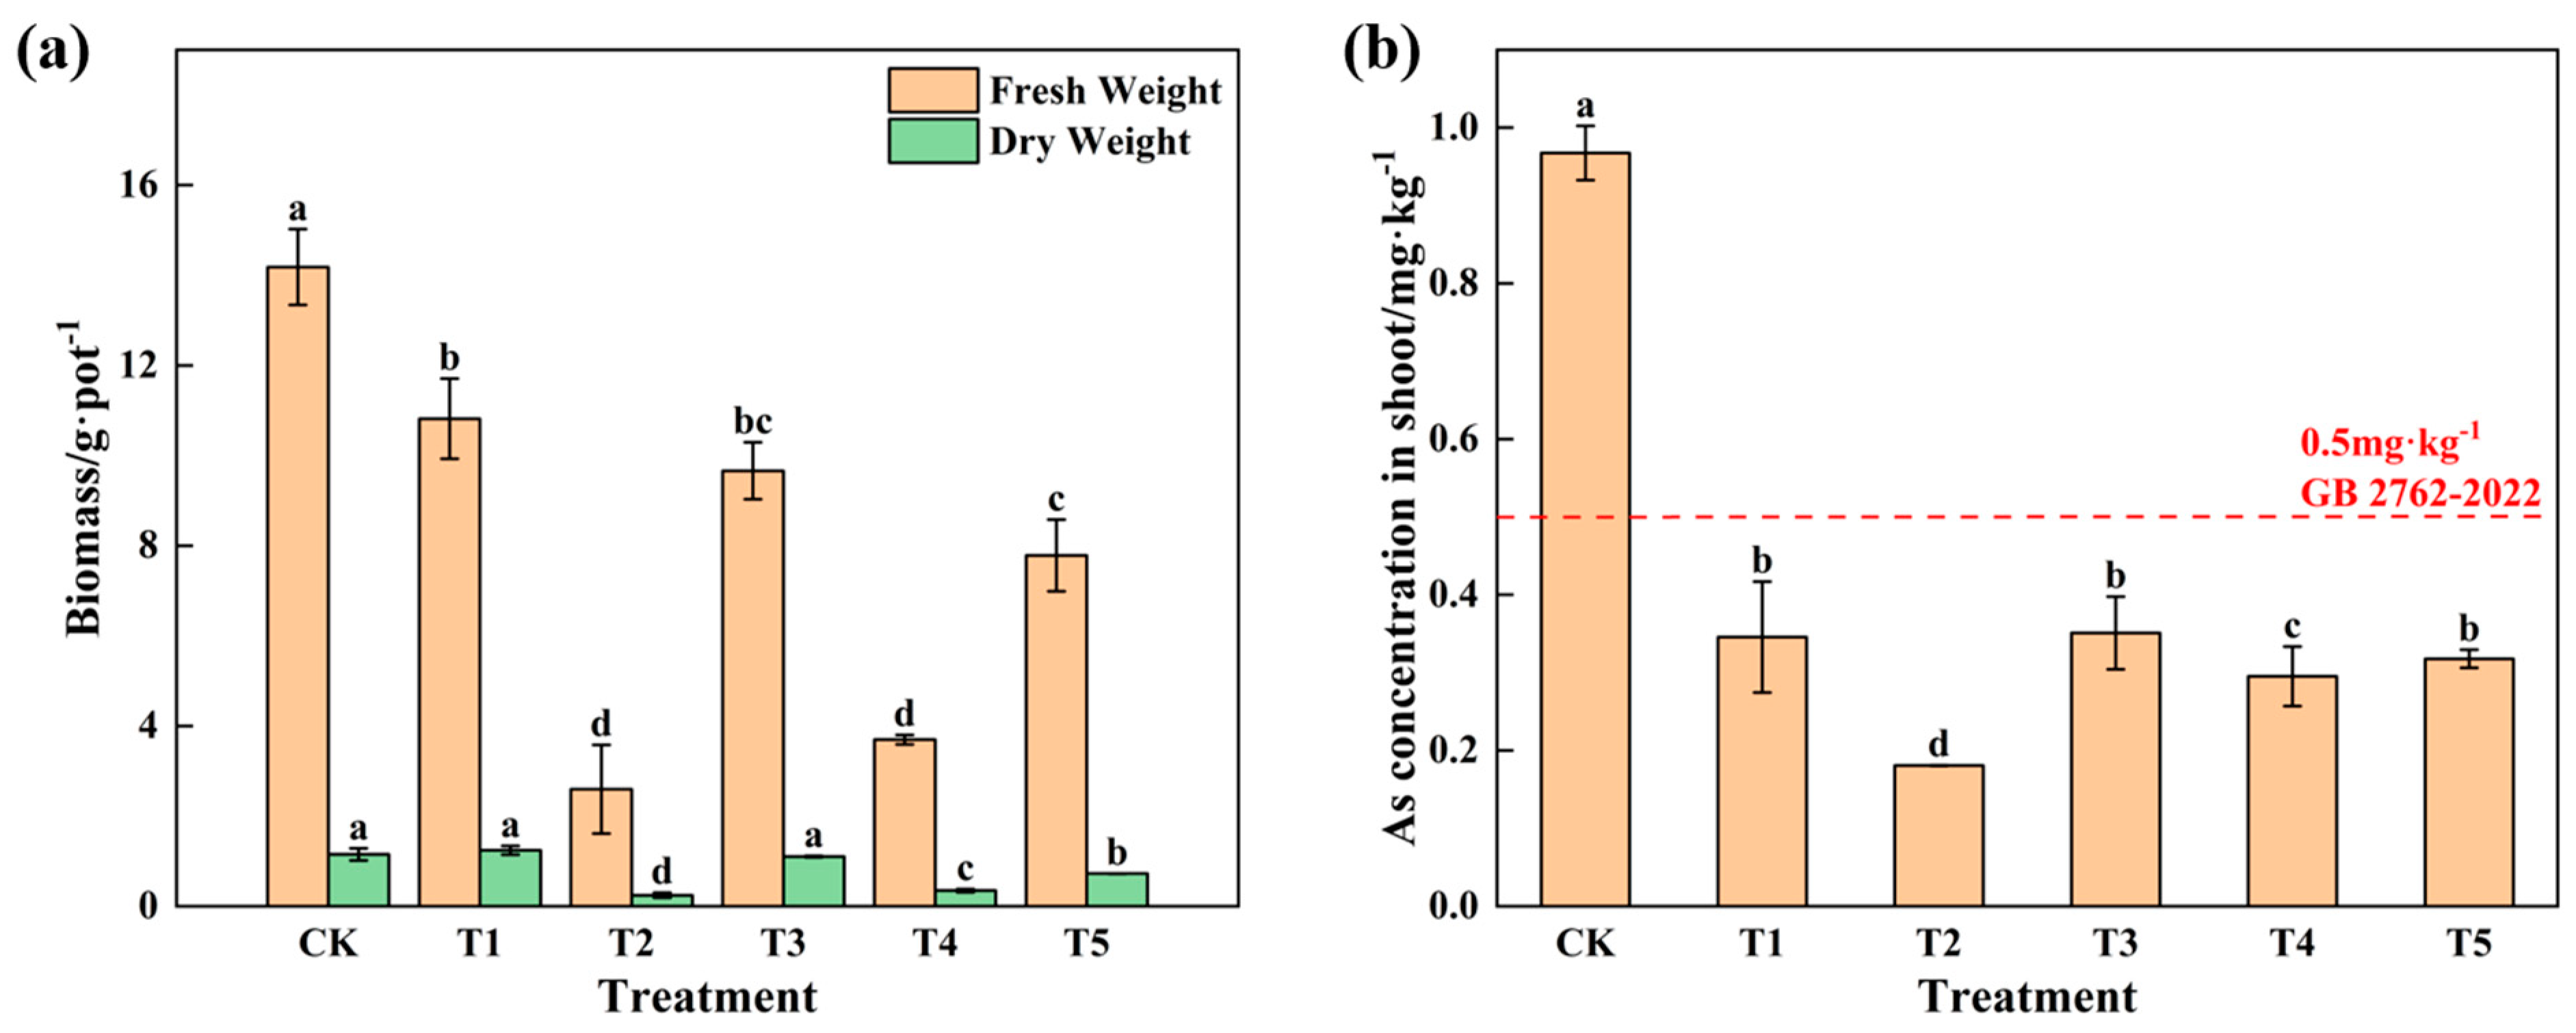
3.2. Influence of Passivated Material Application on Growth and Safety Traits of Water Spinach

Biomass reflects the growth of a crop. Compared to CK, T2, T4, and T5 treatments significantly reduced the biomass of the edible portion (Figure 2a). Although the application of passivator did not significantly promote the growth of the crop, it significantly reduced the total As concentration in the edible portion of water spinach (Figure 2b). Whether the accumulation of heavy metals in agricultural products exceeds the limit value of national food safety standards is one of the important indicators for evaluating the effect of passivator, and the safety limit value of total As in vegetables is 0.5 mg·kg−1. As shown in Figure 2b, the total As concentration of water spinach before passivation treatment was 0.97 mg·kg−1, which is more than the safety limit value, and the total As concentration of the edible portion was significantly reduced to 0.18–0.35 mg·kg−1 after addition of the passivator, which is lower than the national safety limits, indicating that the five passivators were able to achieve a better passivation effect. Overall, the lowest total arsenic content in the edible portion after T2 treatment was 0.18 mg·kg−1, indicating that the treatment effect of coffee residue passivator was relatively good.

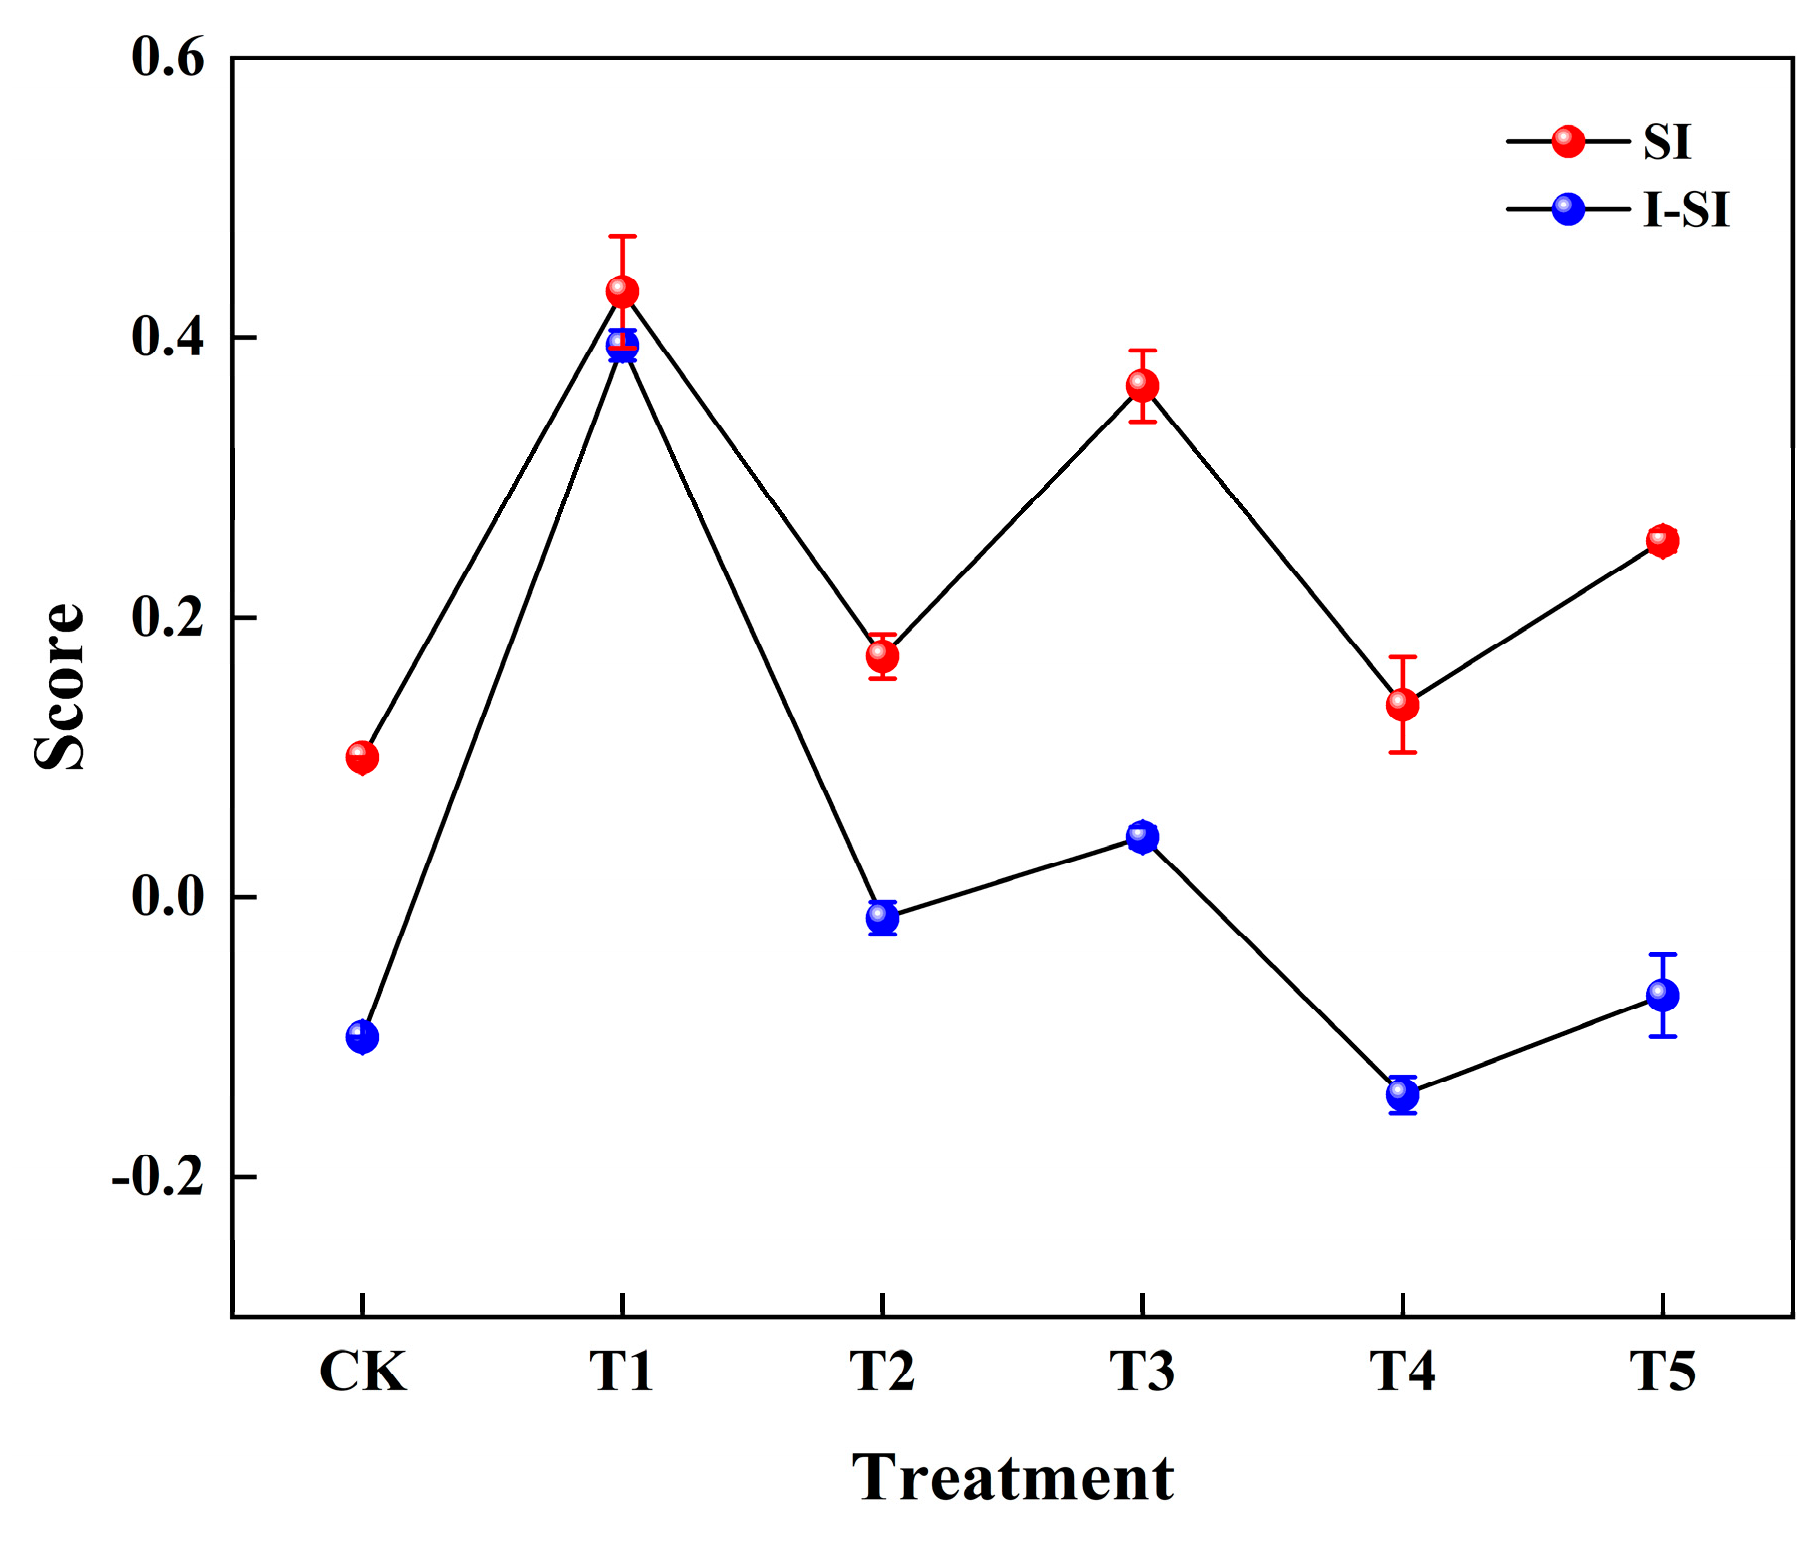
3.3. Comprehensive Evaluation of Passivation Effect

The dry weight of the edible portion was standardized with the total arsenic concentration, so as to calculate the evaluation score of the passivation effect (Table 3). Compared with the control group, the passivator improved the composite score, which was T1 > T3 > T5 > T2 > T4 from high to low. However, due to the radioactive elements (such as uranium and thorium) contained in red mud, it is not recommended to use red mud in soil remediation [41]. In conclusion, the combined evaluation of iron-based biochar T1 was the best.

3.4. Improvement of Comprehensive Evaluation of Passivation Effect

In the pot experiment, correlation analysis (Figure 3) revealed that the rate of change in dry weight of the edible part of water spinach was correlated with the rate of change in soil pH, total nitrogen, total phosphorus, fast-acting potassium, catalase, and phosphatase activity. Since pH and catalase were positively correlated and the correlation coefficient between the rate of change in dry weight of the edible part of water spinach and the rate of change in catalase activity (0.92) was higher than the rate of change in pH (0.52), the indicator of catalase activity was selected. Since total nitrogen was positively correlated with available potassium and phosphatase activity and the correlation coefficient between the rate of change of biomass of edible portion of water spinach and the rate of change of soil total nitrogen (−0.98) was the largest, total nitrogen was chosen as a negative correlation indicator of the rate of change of biomass of edible portion of water spinach affected by passivation treatments. In summary, soil total nitrogen, total phosphorus, and catalase activity were selected as the key indicators affecting the biomass of water spinach, and the relationship between the dry weight of the edible part and the soil indicators could be obtained after multivariate linear fitting, which could be described as the following Equation (4):
Biomass = - 2.152 TN + 0.422 TP + 0.334 CAT 0.261
R 2 = 0.954       p < 0.01
This comprehensive evaluation considered total soil nitrogen, total phosphorus, and catalase activity as crop growth indicators, and soil available arsenic concentration as a crop safety indicator for the comprehensive evaluation of the passivation effect. Combining Equations (3) and (4), the improved integrated score I-SI can be described as follows:
I - SI = 0.6 As soil + 0.4 2.152 TN + 0.422 TP + 0.334 CAT 0.261
The results of the improved comprehensive score calculated by Equation (5) (Figure 4) show that the passivation effect of T1 treatments performed the best, which was consistent with the results of the score before the improvement, indicating that the results of the improved evaluation were feasible.
The improved comprehensive evaluation system of the passivation effect includes soil available arsenic concentration, total nitrogen, total phosphorus, and catalase activity indicators. Currently, two officially released agricultural industry standards at the national level involve the evaluation of contaminated soil treatment and remediation—Criterion for effectiveness evaluation of pollution control of cultivated land (NY/T 3343-2018) and Guidelines for pollution control and soil remediation of contaminated cultivated land (NY/T 3499-2019)—which take the agricultural products as the evaluation indicators, and individually examine whether the content of the target pollutants reaches the food concentration limits and the yield of agricultural products is reduced by ≤10%. In this study, the evaluation method utilized an analytic hierarchy process to organically link the yield of agricultural products and pollutant content under the premise of satisfying the safety and edibility of crops. This improved evaluation method replaces agricultural product indicators with soil indicators, which has the advantages of convenience and ease of operation.
The soil indicators in this evaluation method were based on the screening of a crop of water spinach, and further development is needed to determine whether they differ according to the type of crop. The soil indicators involved soil trace elements, soil macro elements, and soil microorganisms, which correspond to multiple types of testing equipment, so the generalizability of this evaluation method needs to be further verified. On the other hand, soil properties are affected by soil-forming factors and anthropogenic activities [42], especially in the study area, which has experienced the superposition of mineral extraction and agricultural activities, and the intensity of anthropogenic interference is high [43]. The evaluation method of passivation effect was only applied in laboratory potting experiments at a small scale, so whether the evaluation method is of value for generalization needs to be further verified in a large number of field experiments.

4. Conclusions

This study proposed a method for evaluating the effectiveness of passivation remediation of arsenic-contaminated agricultural soils by replacing plant indicators with key soil indicators, with a view to evaluating the effectiveness of passivation remediation in a fast and simple way. In the pot experiments, the key indicators that affected the biomass change of water spinach by passivation treatment included total nitrogen, total phosphorus, and catalase activity. The indicators of available arsenic concentration, total nitrogen, total phosphorus, and catalase activity in soil were used to evaluate the improved passivation effect, and I-SI could be expressed as I - SI = 0.6 As soil + 0.4 2.152 TN + 0.422 TP + 0.334 CAT 0.261 . It was proved that I-SI has good feasibility, and the passivation effect of the iron-based biochar treatment was the best.

Supplementary Materials

The following supporting information can be downloaded at: https://www.mdpi.com/article/10.3390/pr12122802/s1, Figure S1: Pictures of physical appearance of materials and pot experiment; Figure S2: Soil texture under different treatment; Table S1: Soil indicator classification.

Author Contributions

Conceptualization, X.Y.; data curation, S.L. and Z.Z.; formal analysis, S.L.; funding acquisition, X.Y.; investigation, S.L. and J.S.; methodology, S.L.; supervision, X.Y.; validation, S.L.; writing—original draft, S.L.; writing—review and editing, S.L., J.S., Z.Z., Y.H., X.W. and X.Y. All authors have read and agreed to the published version of the manuscript.

Funding

This work was supported by the National Key Research and Development Program of China (2020YFC1807805).

Data Availability Statement

The original contributions presented in the study are included in the article/Supplementary Materials, further inquiries can be directed to the corresponding author.

Conflicts of Interest

Author Jikai Su was employed by Jikai Su Xinsha Stevedoring Co., Ltd. Authors Yajing Huang and Xiaoyao Wang were employed by Guangdong Yuegang Water Supply Co., Ltd. The remaining authors declare that the research was conducted in the absence of any commercial or financial relationships that could be construed as a potential conflict of interest.

References

  1. Chen, H.; Teng, Y.; Lu, S.; Wang, Y.; Wang, J. Contamination features and health risk of soil heavy metals in China. Sci. Total Environ. 2015, 512–513, 143–153. [Google Scholar] [CrossRef] [PubMed]
  2. Fei, X.; Lou, Z.; Xiao, R.; Ren, Z.; Lv, X. Source analysis and source-oriented risk assessment of heavy metal pollution in agricultural soils of different cultivated land qualities. J. Clean. Prod. 2022, 341, 130942. [Google Scholar] [CrossRef]
  3. Huang, Y.; Miao, Q.; Kwong, R.W.M.; Zhang, D.; Fan, Y.; Zhou, M.; Yan, X.; Jia, J.; Yan, B.; Li, C. Leveraging the One Health concept for arsenic sustainability. Eco-Environ. Health 2024, 3, 392–405. [Google Scholar] [CrossRef]
  4. Dai, Y.; Liang, Y.; Xu, X.; Zhao, L.; Cao, X. An integrated approach for simultaneous immobilization of lead in both contaminated soil and groundwater: Laboratory test and numerical modeling. J. Hazard. Mater. 2018, 342, 107–113. [Google Scholar] [CrossRef]
  5. Xia, W.-Y.; Feng, Y.-S.; Jin, F.; Zhang, L.-M.; Du, Y.-J. Stabilization and solidification of a heavy metal contaminated site soil using a hydroxyapatite based binder. Constr. Build. Mater. 2017, 156, 199–207. [Google Scholar] [CrossRef]
  6. Zou, Q.; An, W.; Wu, C.; Li, W.; Fu, A.; Xiao, R.; Chen, H.; Xue, S. Red mud-modified biochar reduces soil arsenic availability and changes bacterial composition. Environ. Chem. Lett. 2018, 16, 615–622. [Google Scholar] [CrossRef]
  7. Yan, X.L.; Lin, L.Y.; Liao, X.Y.; Zhang, W.B.; Wen, Y. Arsenic stabilization by zero-valent iron, bauxite residue, and zeolite at a contaminated site planting Panax notoginseng. Chemosphere 2013, 93, 661–667. [Google Scholar] [CrossRef]
  8. Fresno, T.; Moreno-Jiménez, E.; Zornoza, P.; Peñalosa, J.M. Aided phytostabilisation of As- and Cu-contaminated soils using white lupin and combined iron and organic amendments. J. Environ. Manag. 2018, 205, 142–150. [Google Scholar] [CrossRef]
  9. Ding, Y.; Wang, Y.; Zheng, X.; Cheng, W.; Shi, R.; Feng, R. Effects of foliar dressing of selenite and silicate alone or combined with different soil ameliorants on the accumulation of As and Cd and antioxidant system in Brassica campestris. Ecotoxicol. Environ. Saf. 2017, 142, 207–215. [Google Scholar] [CrossRef]
  10. Yuan, Y.; Chai, L.; Yang, Z.; Yang, W. Simultaneous immobilization of lead, cadmium, and arsenic in combined contaminated soil with iron hydroxyl phosphate. J. Soils Sediments 2017, 17, 432–439. [Google Scholar]
  11. Liang, Y.; Min, X.; Chai, L.; Wang, M.; Liyang, W.; Pan, Q.; Okido, M. Stabilization of arsenic sludge with mechanochemically modified zero valent iron. Chemosphere 2017, 168, 1142–1151. [Google Scholar] [CrossRef] [PubMed]
  12. Bian, R.; Joseph, S.; Cui, L.; Pan, G.; Li, L.; Liu, X.; Zhang, A.; Rutlidge, H.; Wong, S.; Chia, C.; et al. A three-year experiment confirms continuous immobilization of cadmium and lead in contaminated paddy field with biochar amendment. J. Hazard. Mater. 2014, 272, 121–128. [Google Scholar] [CrossRef] [PubMed]
  13. Vrînceanu, N.O.; Motelică, D.M.; Dumitru, M.; Calciu, I.; Tănase, V.; Preda, M. Assessment of using bentonite, dolomite, natural zeolite and manure for the immobilization of heavy metals in a contaminated soil: The Copșa Mică case study (Romania). Catena 2019, 176, 336–342. [Google Scholar] [CrossRef]
  14. Chen, F.; Mao, P.; Wang, M.; Li, Y.; Li, Y.; Xia, K.; Chen, J.; Mo, H.; Wang, F.; Li, Z.; et al. Benefit evaluation of in-situ Cd immobilization with naturally occurring minerals using an analytical hierarchy process. Chemosphere 2024, 347, 140720. [Google Scholar] [CrossRef]
  15. Li, Y.C.; Wang, Y.H.; Chen, Y.; Tang, M.D.; Li, Q.; Li, L.F.; Lin, X.Y.; Yin, Y.L.; Ai, S.Y. A comprehensive evaluation of remediation effects on cadmium contamination in paddy fields based on soil quality. J. Agro-Environ. Sci. 2021, 40, 1219–1228. (In Chinese) [Google Scholar]
  16. Zhao, Y.H.; Yang, Y.H.; Zhao, H.D.; Du, L.Y. Evaluating remediation effects of remediation agents on cadmium-contaminated paddy soil in shenyang based on principal component analysis method. Chin. J. Soil Sci. 2021, 52, 1220–1226. (In Chinese) [Google Scholar]
  17. GB 15618-2018; Soil Environmental Quality—Risk Control Standard for Soil Contamination of Agricultural Land. Standardization Administration of China: Beijing, China, 2018.
  18. Li, X.; Zhang, W.J.; Wu, L.; Ren, Y.; Zhang, J.D.; Xu, M.G. Advance in indicator screening and methodologies of soil quality evaluation. Sci. Agric. Sin. 2021, 54, 3043–3056. (In Chinese) [Google Scholar]
  19. Lu, R. Analysis Method of Soil and Agricultural Chemistry; China Agricultural Science and Technology Press: Beijing, China, 2000. (In Chinese) [Google Scholar]
  20. Jin, K.; Sleutel, S.; Buchan, D.; De Neve, S.; Cai, D.X.; Gabriels, D.; Jin, J.Y. Changes of soil enzyme activities under different tillage practices in the Chinese Loess Plateau. Soil Tillage Res. 2009, 104, 115–120. [Google Scholar] [CrossRef]
  21. Ma, H.; Wei, M.; Wang, Z.; Hou, S.; Li, X.; Xu, H. Bioremediation of cadmium polluted soil using a novel cadmium immobilizing plant growth promotion strain Bacillus sp. TZ5 loaded on biochar. J. Hazard. Mater. 2020, 388, 122065. [Google Scholar] [CrossRef]
  22. Shiowatana, J.; McLaren, R.G.; Chanmekha, N.; Samphao, A. Fractionation of Arsenic in Soil by a Continuous-Flow Sequential Extraction Method. J. Environ. Qual. 2001, 30, 1940–1949. [Google Scholar] [CrossRef]
  23. Yin, D.; Wang, X.; Chen, C.; Peng, B.; Tan, C.; Li, H. Varying effect of biochar on Cd, Pb and As mobility in a multi-metal contaminated paddy soil. Chemosphere 2016, 152, 196–206. [Google Scholar] [CrossRef] [PubMed]
  24. GB 5009.11-2014; National Food Safety Standard Determination of Total Arsenic and Abio-Arsenic in Food. Standardization Administration of China: Beijing, China, 2014.
  25. Dong, M.; Huang, R.; Mao, P.; Lei, L.; Li, Y.; Li, Y.; Xia, H.; Li, Z.; Zhuang, P. Immobilization of Cadmium by Molecular Sieve and Wollastonite Is Soil pH and Organic Matter Dependent. Int. J. Environ. Res. Public Health 2021, 18, 5128. [Google Scholar] [CrossRef] [PubMed]
  26. Xue, R.; Wang, C.; Liu, M.; Zhang, D.; Li, K.; Li, N. A new method for soil health assessment based on Analytic Hierarchy Process and meta-analysis. Sci. Total Environ. 2019, 650, 2771–2777. [Google Scholar] [CrossRef]
  27. GB 2762-2022; National Food Safety Standard Maximum Levels of Contaminants in Foods. Standardization Administration of China: Beijing, China, 2022.
  28. Su, J.K.; Dong, Z.; Liu, S.Y.; Zhang, L.; Yi, X.Y. Comprehensive evaluation study on soil quality of agricultural land around Nandan mining areas. Acta Sci. Circumstantiae 2023, 43, 314–326. (In Chinese) [Google Scholar]
  29. Doran, J.W.; Parkin, T.B. Defining and Assessing Soil Quality. Defin. Soil Qual. A Sustain. Environ. 1994, 35, 1–12. [Google Scholar]
  30. Chen, H.; Zhang, W.; Yang, X.; Wang, P.; McGrath, S.P.; Zhao, F.-J. Effective methods to reduce cadmium accumulation in rice grain. Chemosphere 2018, 207, 699–707. [Google Scholar] [CrossRef]
  31. Ma, Q.; Zhao, W.; Guan, D.-X.; Teng, H.H.; Ji, J.; Ma, L.Q. Comparing CaCl2, EDTA and DGT methods to predict Cd and Ni accumulation in rice grains from contaminated soils. Environ. Pollut. 2020, 260, 114042. [Google Scholar] [CrossRef]
  32. Wen, Y.; Li, W.; Yang, Z.; Zhuo, X.; Guan, D.-X.; Song, Y.; Guo, C.; Ji, J. Evaluation of various approaches to predict cadmium bioavailability to rice grown in soils with high geochemical background in the karst region, Southwestern China. Environ. Pollut. 2020, 258, 113645. [Google Scholar] [CrossRef]
  33. Zhou, Y.; Cui, Y.; Yang, J.; Chen, L.; Qi, J.; Zhang, L.; Zhang, J.; Huang, Q.; Zhou, T.; Zhao, Y.; et al. Roles of red mud in remediation of contaminated soil in mining areas: Mechanisms, advances and perspectives. J. Environ. Manag. 2024, 356, 120608. [Google Scholar] [CrossRef]
  34. Yu, H.-Y.; Wang, X.; Li, F.; Li, B.; Liu, C.; Wang, Q.; Lei, J. Arsenic mobility and bioavailability in paddy soil under iron compound amendments at different growth stages of rice. Environ. Pollut. 2017, 224, 136–147. [Google Scholar] [CrossRef]
  35. Lee, S.-H.; Kim, E.Y.; Park, H.; Yun, J.; Kim, J.-G. In situ stabilization of arsenic and metal-contaminated agricultural soil using industrial by-products. Geoderma 2011, 161, 1–7. [Google Scholar] [CrossRef]
  36. Mikutta, C.; Kretzschmar, R. Spectroscopic evidence for ternary complex formation between arsenate and ferric iron complexes of humic substances. Environ. Sci. Technol. 2011, 45, 9550–9557. [Google Scholar] [CrossRef] [PubMed]
  37. Atkinson, C.J.; Fitzgerald, J.D.; Hipps, N.A. Potential mechanisms for achieving agricultural benefits from biochar application to temperate soils: A review. Plant Soil 2010, 337, 1–18. [Google Scholar] [CrossRef]
  38. El-Sayed, I.M.; Salama, W.H.; Badr, M.A. Nitrogen and spent coffee ground for enhancing nutritional, morphological, flowering and antioxidant properties of Chrysanthemum (Chrysanthemum morfolium Ramat). Plant Physiol. Biochem. 2024, 207, 108406. [Google Scholar] [CrossRef] [PubMed]
  39. Deng, M.; Li, K.; Yan, Y.-J.; Huang, F.; Peng, D. Enhanced cadmium removal by growing Bacillus cereus RC-1 immobilized on different magnetic biochars through simultaneous adsorption and bioaccumulation. Environ. Sci. Pollut. Res. 2022, 29, 18495–18507. [Google Scholar] [CrossRef] [PubMed]
  40. Wu, B.; Cheng, G.; Jiao, K.; Shi, W.; Wang, C.; Xu, H. Mycoextraction by Clitocybe maxima combined with metal immobilization by biochar and activated carbon in an aged soil. Sci. Total Environ. 2016, 562, 732–739. [Google Scholar] [CrossRef]
  41. Smirnov, D.I.; Molchanova, T.V. The investigation of sulphuric acid sorption recovery of scandium and uranium from the red mud of alumina production. Hydrometallurgy 1997, 45, 249–259. [Google Scholar] [CrossRef]
  42. Li, J.; Du, J.; Zhong, S.; Ci, E.; Wei, C. Changes in the profile properties and chemical weathering characteristics of cultivated soils affected by anthropic activities. Sci. Rep. 2021, 11, 20822. [Google Scholar] [CrossRef]
  43. Dror, I.; Yaron, B.; Berkowitz, B. The Human Impact on All Soil-Forming Factors during the Anthropocene. ACS Environ. Au 2022, 2, 11–19. [Google Scholar] [CrossRef]
Figure 1. Effects of different treatments on the available concentration of arsenic in soil. Note: Lowercase letters indicate significant differences in the available concentration of arsenic (p < 0.05). Uppercase letters indicate significant differences on immobilization rate (p < 0.05).
Processes 12 02802 g001
Figure 2. Growth and safety traits of vegetables in different treatments. (a,b) show the effect of different treatments on the biomass of edible part and total As concentration, respectively. Note: Lowercase letters indicate significant differences (p < 0.05).
Processes 12 02802 g002
Figure 3. Correlation analysis of biomass and soil indicators.
Processes 12 02802 g003
Figure 4. Comparison of comprehensive score evaluation results before and after improvement.
Processes 12 02802 g004
Table 1. Basic properties of the soil.
pHOM g·kg−1CEC cmol·kg−1TN g·kg−1TP mg·kg−1TK mg·kg−1Clay %Silt %Sand %As mg·kg−1
6.4117.0117.171.55124.95307.2613.4640.6845.86256.23
Note: OM: organic matter; CEC: cation exchange capacity; TN: total nitrogen; TP: total phosphorus; TK: total potassium; As: total arsenic concentration in soil.
Table 2. Effect of different soil amendments on soil properties.
IndicatorsCKT1T2T3T4T5
BD/g·cm−31.29 ± 0.07 a0.99 ± 0.02 a1.05 ± 0.03 a1.12 ± 0.04 a1.22 ± 0.01 a1.13 ± 0.03 a
Clay/%11.68 ± 0.10 ab12.16 ± 0.47 a11.23 ± 0.11 abc9.59 ± 0.12 c9.94 ± 1.11 c9.82 ± 0.29 c
Sand/%47.44 ± 0.46 bc50.48 ± 1.10 bc44.78 ± 0.38 c64.99 ± 1.88 a51.94 ± 1.66 b65.79 ± 3.72 a
Silt/%40.88 ± 0.36 ab37.37 ± 1.58 b43.99 ± 0.49 a25.42 ± 1.76 c38.12 ± 0.56 ab24.39 ± 3.43 c
pH5.79 ± 0.06 c5.72 ± 0.04 c5.19 ± 0.03 d6.27 ± 0.04 b5.30 ± 0.06 d6.78 ± 0.01 a
EC/μS·cm−1871.67 ± 1.02 b47.37 ± 0.69 d2.18 ± 0.02 e1605.00 ± 2.12 a419.67 ± 4.99 c3.35 ± 0.05 e
OM/mg·g−113.41 ± 0.14 ab14.30 ± 1.99 a13.80 ± 1.16 ab11.15 ± 0.43 b12.70 ± 1.02 ab12.42 ± 1.04 ab
CEC/cmol·kg−116.03 ± 0.98 a16.90 ± 0.37 a17.36 ± 0.16 a16.25 ± 0.25 a16.87 ± 0.26 a16.63 ± 0.67 a
TN/g·kg−11.68 ± 0.01 c1.49 ± 0.03 d2.01 ± 0.03 a1.53 ± 0.01 d1.89 ± 0.01 b1.68 ± 0.05 c
AN/mg·kg−1370.06 ± 3.42 c124.37 ± 1.14 e648.85 ± 3.04 b125.13 ± 1.90 e173.81 ± 1.90 d756.86 ± 4.56 a
TP/mg·kg−1192.76 ± 2.12 a201.16 ± 5.20 a153.49 ± 3.70 b152.02 ± 1.77 b147.67 ± 3.94 b163.05 ± 1.30 b
AP/mg·kg−1173.53 ± 2.53 b93.00 ± 2.98 d209.99 ± 5.06 a108.97 ± 5.00 d94.99 ± 3.28 d140.97 ± 9.89 c
AK/mg·kg−1285.07 ± 5.62 d272.76 ± 1.79 e345.09 ± 0.23 b316.36 ± 2.83 c440.06 ± 3.01 a213.72 ± 1.76 f
UE/mg·(g·24 h)−10.28 ± 0.08 e0.85 ± 0.04 d0.92 ± 0.05 d2.17 ± 0.04 a1.29 ± 0.07 c1.53 ± 0.06 b
SC/mg·(g·24 h)−11.87 ± 0.10 d7.62 ± 0.39 c11.26 ± 0.16 b13.07 ± 0.48 a11.72 ± 0.33 ab11.62 ± 1.19 ab
CAT/mL·g−12.43 ± 0.10 cd2.86 ± 0.01 b1.92 ± 0.05 e3.12 ± 0.04 a2.27 ± 0.06 d2.49 ± 0.02 c
ACP/mg·kg−1152.73 ± 5.57 c193.46 ± 1.17 b273.32 ± 6.99 a155.90 ± 5.14 c270.09 ± 5.96 a116.31 ± 7.55 d
Note: Data in the table are mean ± standard deviation. Different lowercase letters in the same row indicate significant differences between treatments (p < 0.05).
Table 3. Evaluation score of passivation effect in different treatments.
IndicatorsCKT1T2T3T4T5
B 0.10000.0797−0.7801−0.0425−0.6983−0.3706
M 0.10000.64280.81330.63730.69490.6716
SI0.10000.41750.17230.36540.13760.2547
Disclaimer/Publisher’s Note: The statements, opinions and data contained in all publications are solely those of the individual author(s) and contributor(s) and not of MDPI and/or the editor(s). MDPI and/or the editor(s) disclaim responsibility for any injury to people or property resulting from any ideas, methods, instructions or products referred to in the content.

