Article

Multi-Target Irregular Behavior Recognition of Chemical Laboratory Personnel Based on Improved DeepSORT Method

School of Chemistry, Chemical Engineering and Life Sciences, Wuhan University of Technology, Wuhan 430070, China
*
Author to whom correspondence should be addressed.
Processes 2024, 12(12), 2796; https://doi.org/10.3390/pr12122796
Submission received: 18 October 2024 / Revised: 19 November 2024 / Accepted: 4 December 2024 / Published: 7 December 2024
(This article belongs to the Section AI-Enabled Process Engineering)

Abstract

:
The lack of safety awareness and the irregular behavior of chemical laboratory personnel are major contributors to laboratory accidents which pose significant risks to both the safety of laboratory environments and the efficiency of laboratory work. These issues can lead to accidents, equipment damage, and jeopardize personnel health. To address this challenge, this study proposes a method for recognizing irregular behavior in laboratory personnel by utilizing an improved DeepSORT algorithm tailored to the specific characteristics of a chemical laboratory setting. The method first extracts skeletal keypoints from laboratory personnel using the Lightweight OpenPose algorithm to locate individuals. The enhanced DeepSORT algorithm tracks human targets and detects the positions of the relevant objects. Finally, an SKPT-LSTM network was employed to integrate tracking data for behavior recognition. This approach was designed to enhance the detection and prevention of unsafe behaviors in chemical laboratories. The experimental results on a self-constructed dataset demonstrate that the proposed method accurately identifies irregular behaviors, thereby contributing to the reduction in safety risks in laboratory environments.

1. Introduction

In recent years, chemical laboratory safety accidents have occurred frequently, resulting in significant loss of life and property. University chemical laboratories are equipped with glassware, chemical reagents, gas cylinders, reactors, and other experimental equipment that poses more safety hazards than corporate factories [1]. Since 2000, China has experienced 113 chemical laboratory accidents resulting in 99 fatalities. Studies have found that human factors are the primary causes of these accidents [2,3], among which irregular behavior is one of the key factors leading to these accidents [4]. Many scholars have proposed strategies to enhance chemical laboratory safety from multiple perspectives [4,5,6], primarily focusing on formulating comprehensive management regulations and enhancing safety awareness among chemical laboratory personnel. However, the implementation of these measures often faces challenges due to their time-consuming and inefficient nature.
With continuous improvements in computer hardware, surveillance equipment, and algorithms, numerous methods for human behavior recognition have emerged. Many scholars have applied machine-learning-based methods to unsafe behavior detection tasks, significantly improving the efficiency of safety management. For example, Ding et al. [7] (2018) developed a method for detecting unsafe behaviors in construction sites and other work activities; Hung et al. [8] (2021) proposed a system for identifying dangerous behaviors of workers using transfer learning methods; and Niu et al. [9] established a classification framework for unsafe driving behaviors of truck drivers. However, there is a relative lack of learning-based methods for identifying unsafe behaviors of chemical laboratory personnel. Currently, human behavior recognition methods can be roughly divided into two categories: manual feature extraction and feature extraction based on deep-learning networks. In general, a method based on behavioral feature design is simpler. This process involves extracting action features from each frame of the video, encoding them into feature vectors, and then using machine-learning algorithms for classification. Bobick et al. [10] (2001) analyzed the differences in contour features between video frames and constructed momentum and motion history maps based on them for behavior recognition. Yang et al. [11] (2014) used data from RGBD cameras to capture 3D depth data of skeleton joints for human movement recognition. Willems et al. [12] (2008) introduced a spatiotemporal interest point detection method capable of detecting the location of spatiotemporal interest points in video 3D data at multiple scales. Wang et al. [13] (2009) proposed a spatiotemporal interest point extraction method based on dense sampling to effectively improve the accuracy of behavioral recognition. Subsequently, Wang et al. [14] (2011) proposed a dense trajectories (DT) extraction method to obtain more detailed video motion information by extracting dense trajectories, including Histograms of Oriented Gradient (HOG), Histograms of Oriented Optical Flow (HOF) and Motion of Boundary History (MBH) features. Finally, Wang et al. [15] (2013) proposed an improved dense trajectory (iDT) method to further enhance recognition accuracy by fusing features such as HOG, HOF, and MBH, as well as optimizing optical flow images, feature normalization, and coding methods. Gao et al. [16] (2015) proposed a multidimensional human action recognition model based on image sets and group sparsity which improved action recognition performance by extracting dense trajectory features, constructing a shared codebook, and utilizing group sparsity on multi-view action datasets. Azher et al. [17] (2017) introduced an adaptive local motion descriptor (ALMD) to analyze static textures and generate persistent codes to describe local textures and finally used random forests to recognize human motion. Weng et al. [18] (2018) proposed a method to achieve effective and compact action representation using Length Variable Edge Trajectories (LV-ET) and Spatiotemporal Motion Skeletons (STMS) to address the challenges posed by camera motion, cluttered backgrounds, and occlusion in unconstrained videos. Khursheed et al. [19] (2019) proposed the MtFR method to fuse multiple types of features and reduce irrelevant features and then used the SVM classifier for behavior recognition. Franco et al. [20] (2020) took full advantage of the potential of the Kinect sensor and designed a method that combined skeleton and RGB data stream analyses to identify robust activities.
Behavior recognition algorithms based on deep learning primarily employ end-to-end detection methods and training models to directly extract features from input videos and identify and classify behaviors. These methods commonly utilize two-stream convolutional neural networks (CNNs), three-dimensional (3D) convolutional neural networks, and long- and short-term memory (LSTM) networks. The two-stream convolutional neural network, introduced by Simonyan et al. [21] (2014), learns features from both temporal and spatial streams, effectively addressing the neglect of temporal stream features in traditional methods. In 2012, Ji et al. [22] proposed a 3D convolutional neural network (C3D) that efficiently fused temporal and spatial feature dimensions for video behavior recognition classification. However, a substantial number of parameters in C3D require significant computational resources and video memory. To mitigate this, Kondratyuk et al. [23] (2021) proposed a three-step approach to improve computational efficiency. Additionally, Wang et al. [24] (2016) introduced the time-domain segmentation network (TSN) in 2016, enhancing the model’s capability to process long-duration videos by recognizing human behaviors through time-domain segmentation and random sampling of videos. Donahue et al. [25] (2015) presented a long recurrent convolutional neural network (LRCN) in 2015, a model that integrates convolutional neural networks with long- and short-term memory networks for enhanced behavior recognition. Compared to methods based on artificial feature design, deep learning-based approaches extract features directly from videos, leading to a significant improvement in recognition accuracy. However, high computational resources and equipment requirements present challenges for real-time detection tasks, particularly in scenarios involving multi-target behavior recognition where recognition performance may be significantly affected.
This study focuses on the characteristics of chemical laboratory environments, such as closed space, complex background, relatively sparse density of experimenters, and high behavioral similarity. It combines deep learning-based methods with traditional manual feature design-based methods to propose a new behavior recognition method based on an improved multi-target tracking algorithm (DeepSORT). This method integrates a deep learning-based approach with a traditional manual feature design. Initially, the lightweight OpenPose algorithm was employed to extract skeletal keypoints from the video data for individual localization. Subsequently, the improved DeepSORT algorithm tracks the human target, whereas the YOLOv5 algorithm detects relevant items during the tracking process. Finally, the SKPT-LSTM network, which is a designed behavior recognizer, fuses the tracked target pose and item location information to identify behavior. A flowchart of this method is shown in Figure 1. The method was tested on a self-built chemical laboratory personnel behavior dataset, and its effectiveness was evaluated using performance indicators. An end-to-end network model was used for the comparison. Finally, a practical scenario application flowchart was designed to test the method in real scenarios. The experimental results show that this method can efficiently and accurately identify irregular behaviors of experimental personnel, significantly contribute to reducing chemical laboratory work accidents, promote safe working conditions, and provide an effective guarantee for the early warning of chemical laboratory accidents.
The unique contributions of this study are as follows:
(1)
For the first time, a behavior recognition method based on skeleton key points was used to identify abnormal behaviors of multiple chemical laboratory personnel.
(2)
We improved the structure of the DeepSORT algorithm so that it could track human targets while identifying their behavior; this is called the improved DeepSORT algorithm.
(3)
We applied the SKPT-LSTM network to fuse the tracked human skeleton keypoint position sequence and related object position sequence for behavior recognition.
(4)
The proposed method effectively improved the recognition accuracy of high-similarity behaviors.

2. Materials and Methods

2.1. Data Collection

The data collection in this study adheres to ethical standards and has obtained appropriate informed consent.
According to research on the management of unsafe behaviors in laboratories, irregular behaviors in chemical laboratories are defined as actions that violate standard management and operational protocols. These behaviors negatively impact laboratory personnel, equipment, and the environment and may even threaten safety. Several universities have established stringent safety regulations regarding laboratory personnel. For instance, the Laboratory Safety Manual [26] of the Department of Chemistry and Chemical Biology at Harvard University stipulates that all individuals engaged in experimental research must complete the CCB laboratory safety training. The “Large Instrument Management Regulations” [27] in the rules and regulations of the Modern Life Science Experimental Teaching Center of the National Experimental Teaching Demonstration Center for Life Sciences at Tsinghua University explicitly prohibits snacking in the laboratory. Likewise, the “Laboratory Safety Manual” [28] of Anhui Jianzhu University clearly stipulates that smoking, eating, and sleeping are prohibited within the laboratory. The Laboratory Safety and Environmental Protection Management Regulations of East China University of Science and Technology [29] explicitly state that personal belongings are not permitted to be stored in the laboratory, activities unrelated to the experiment are not allowed in the laboratory, carrying and using mobile phones are prohibited, and smoking and eating are prohibited in the instrument room, storage room, and experimental site. These laboratory rules and regulations provided the foundation for the selection and definition of irregular behaviors in our study.
Based on our research on actual conditions in chemical laboratories, we identified “playing with a mobile phone”, “sleeping”, and “eating” as the most common instances of irregular behavior. These behaviors pose safety risks, such as distraction during experiments and the ingestion of toxic chemicals. Therefore, the timely recognition of these behaviors is crucial for enhancing chemical laboratory safety and management efficiency.
To ensure the applicability of our proposed method to real-world scenarios, we collected data from the microbial chemical laboratory, chemical photocatalytic reaction laboratories, and the chemical engineering simulation operation training laboratory (Figure 2).
In university chemistry laboratories, students generally have lower safety awareness than experienced teachers and accidents are more likely to occur during the experimental stage [30,31]. In recent years, the age distribution of student experimenters has generally been concentrated between 20 and 35 years old. Therefore, to make our experimental data more universal, we selected 12 participants and listed their basic information (age, sex, height, weight, physical health status, and whether they had diseases that might have affected the experimental results) in Table 1. They were then asked to perform three deviant and multiple normal behaviors, as shown in Figure 3. The rear wide-angle camera of the Honor Magic3 Pro smartphone was used for data collection, capturing videos from two different perspectives (“overhead” and “level”) at a resolution of 1920 × 1080 and a frame rate of 30 frames per second.
To facilitate model training, long videos were segmented into 5 s clips, each containing only one behavior per laboratory personnel.
We show the details of data collection in Table 2 (mainly including the number of times each experimenter performed the behavior in strict accordance with the collection standards of various behaviors, where the numbers in “()” are the number of video samples collected from the “Eye level” angle, and the numbers outside “()” are the number of video samples collected from the “Overlook” angle). A total of 5328 video samples were divided into training, validation, and test sets at a ratio of 7:1:2.
Explanation of data collection criteria for various behaviors:
“Sleeping” behavior: Defined into two modes, namely sleeping on the laboratory bench and sleeping while lying on one’s side in a chair.
“Eating” behavior: Involves bringing food to the mouth over a period of time, with each dataset containing at least one such action.
“Playing with a mobile phone” behavior encompasses scenarios such as sitting at the laboratory bench while using a mobile phone, walking around the laboratory while making or receiving phone calls, and standing while engaged with a mobile phone.
“Normal” behavior: Refers to laboratory personnel performing regular activities such as conducting experiments, reading, walking, etc., without exhibiting the aforementioned three irregular behaviors.
When constructing the dataset, we found that the behaviors of “Sitting at the laboratory table and playing with mobile phone” and “normal reading and note-taking” have high behavioral similarity; “answering and making phone calls” and “normal walking” and “sitting or standing and playing with mobile phone” have high behavioral similarity; “normal experimental behavior” and “eating” behavior have high behavioral similarity.

2.2. Method Framework

This subsection describes the principles of the Lightweight OpenPose, YOLOv5, SKPT-LSTM, and improved DeepSORT algorithms utilized in this study.

2.2.1. Lightweight OpenPose Algorithm

The behavioral postures of the human body are primarily determined by the relative positions of the human skeletal joints. Human posture estimation algorithms accurately locate skeletal keypoints in complex scenarios. The Lightweight OpenPose [32] algorithm is one of the most widely adopted skeletal keypoint extraction methods. Developed by Intel in response to the computationally intensive nature of the OpenPose [33] algorithm, it has gained widespread application in various fields [34,35,36]. Utilizing a “bottom-up” approach, this algorithm achieves the real-time detection of skeletal information for multiple individuals and exhibits excellent robustness.
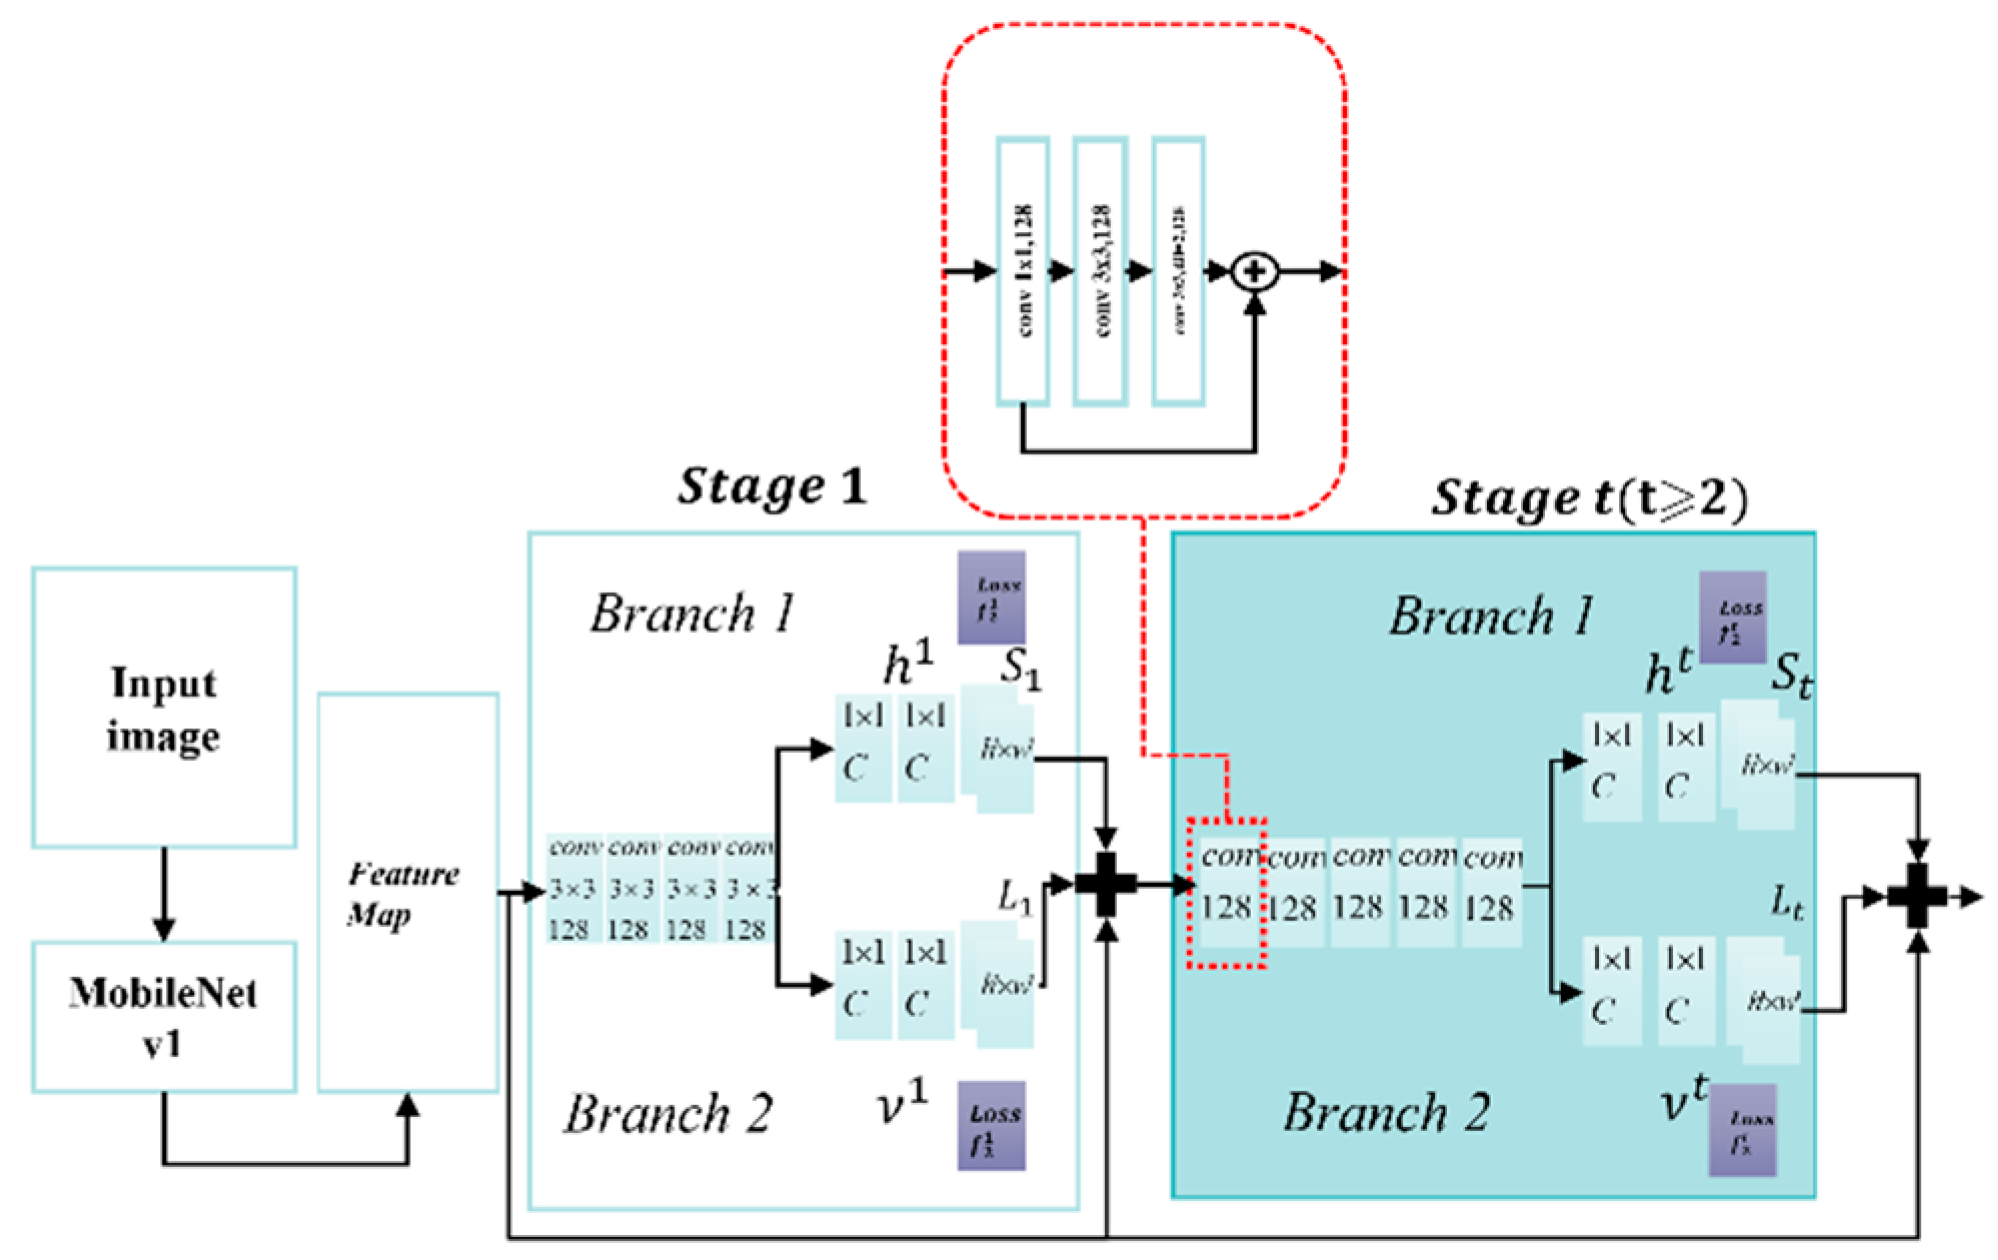
The network architecture of the Lightweight OpenPose algorithm is illustrated in Figure 4. It employs MobileNet v1 [37] as the backbone for the feature extraction. Following the feature extraction, the network underwent several refinement modules that were divided into two branches. One branch predicts the confidence map of keypoints and generates a heat map (point confidence map (PCM)) whereas the other predicts the part affinity fields between each keypoint to produce a vector map (part affinity fields (PAF)). Loss calculations and optimization were conducted for both PCM and PAF at each stage, as shown in Equations (1) and (2). Post-processing of the PCM and PAF outputs results in a skeletal keypoint group P for all human bodies in the input image, as outlined in Equation (3).
S 1 = ρ 1 ( F ) L 1 = φ 1 ( F )
S t = ρ t ( F , S t 1 , L t 1 ) , t 2 L t = φ t ( F , S t 1 , L t 1 ) , t 2
The symbols S 1 and S t represent the confidence maps of the keypoints for the first and t stages, respectively. Similarly, L 1 and L t denote the vector fields for the first and tth stages, respectively. ρ ( · ) represents the prediction network for point confidence maps (PCM) and φ ( · ) represents the prediction network for part affinity fields (PAF).
P = { p o s e 1 , p o s e 2 , p o s e i }
p o s e i = { B ^ , k e y p o i n t , c o n f }
B ^ = { t o p , l e f t , w i d t h , h e i g h t }
k e y p o i n t = x 0 , y 0 , c o n f , 0 [ x j , y j , c o n f , j ]
In Equation (3), p o s e i represents the skeletal keypoint group of the ith individual in the current image. In Equation (4), B ^ represents the minimum outer bounding rectangle of all keypoints, that is, the target box, and c o n f is the confidence level of the current keypoint group. In Equation (5), t o p , l e f t represents the coordinates of the upper-left corner of the human target box, and w i d t h , h e i g h t represent the width and height of the target box, respectively. In Equation (6), x j and y j represent the horizontal and vertical coordinates of the skeletal keypoints, respectively, and j represents the ID pair of skeletal keypoints.
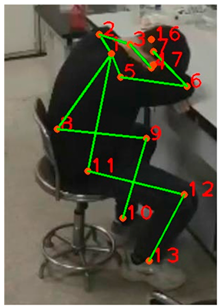
The information of 18 skeletal keypoints extracted by the Lightweight OpenPose algorithm is depicted in Figure 5.

2.2.2. YOLOv5 Object Detection Algorithm

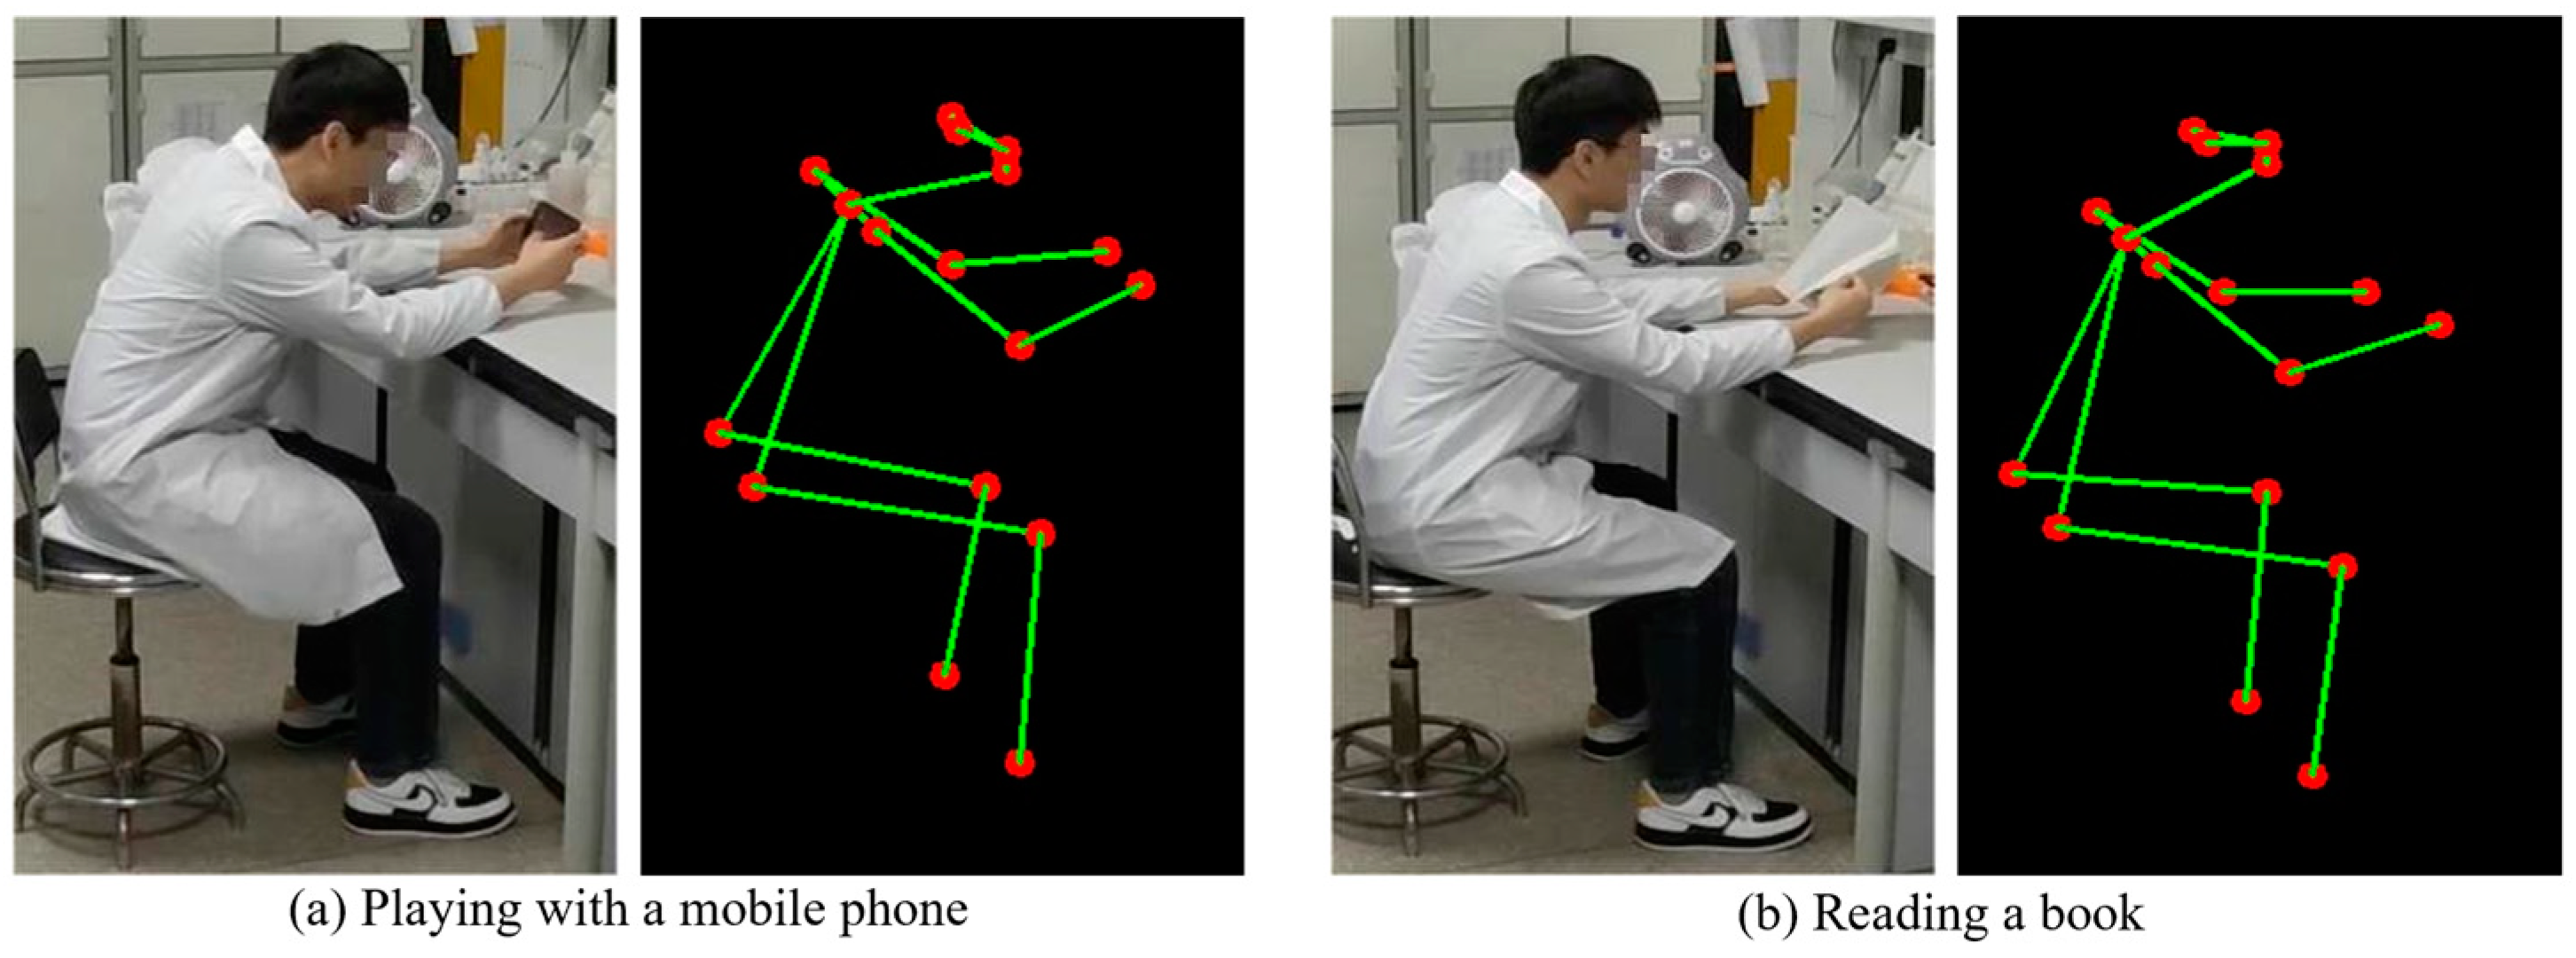
For behaviors with high similarity, relying solely on the position features of skeletal keypoints can make it difficult to distinguish between them, as shown in Figure 6, where the left side depicts the “Reading a book” behavior and the right side depicts the “Playing with a mobile phone” behavior. Therefore, this study adopted the YOLOv5 algorithm as an item detector to detect the positions of relevant items, thereby improving the recognition accuracy for highly similar behaviors.
The YOLOv5 algorithm is a one-stage object detection algorithm [38] which treats the object detection task as a regression problem. It can accurately and rapidly locate objects in images for classification and return their positions to the images. YOLOv5 is suitable for a wide range of scenarios [39,40,41].
The network architecture of YOLOv5, as depicted in Figure 7, accepts images with a resolution of 640 × 640 pixels as the input. After feature extraction using the backbone, the features were passed through the neck layer. In the neck layer, features of different scales were fused, resulting in the generation of three feature maps of sizes 20 × 20, 40 × 40, and 80 × 80. Subsequently, after Non-Maximum Suppression (NMS) processing, the algorithm outputs the category c l s and confidence c o n f of the target objects, as well as the bounding box positions O x 1 , O y 1 , O x 2 , O y 2 where O x 1 and O y 1 represent the horizontal and vertical coordinates of the upper-left corner of the bounding box, respectively, and O x 2 and O y 2 represent the horizontal and vertical coordinates of the lower-right corner of the bounding box, respectively.

2.2.3. SKPT-LSTM Behavior Recognizer

Human behavior can be regarded as a time-series classification problem determined by changes in a series of human poses over a certain period of time. Recurrent neural networks (RNNs) [42] are designed to handle data with temporal properties. They possess a “memory” characteristic, allowing them to utilize previous input information to influence the current output. However, traditional RNNs suffer from vanishing or exploding gradient problems, which lead to training failure.
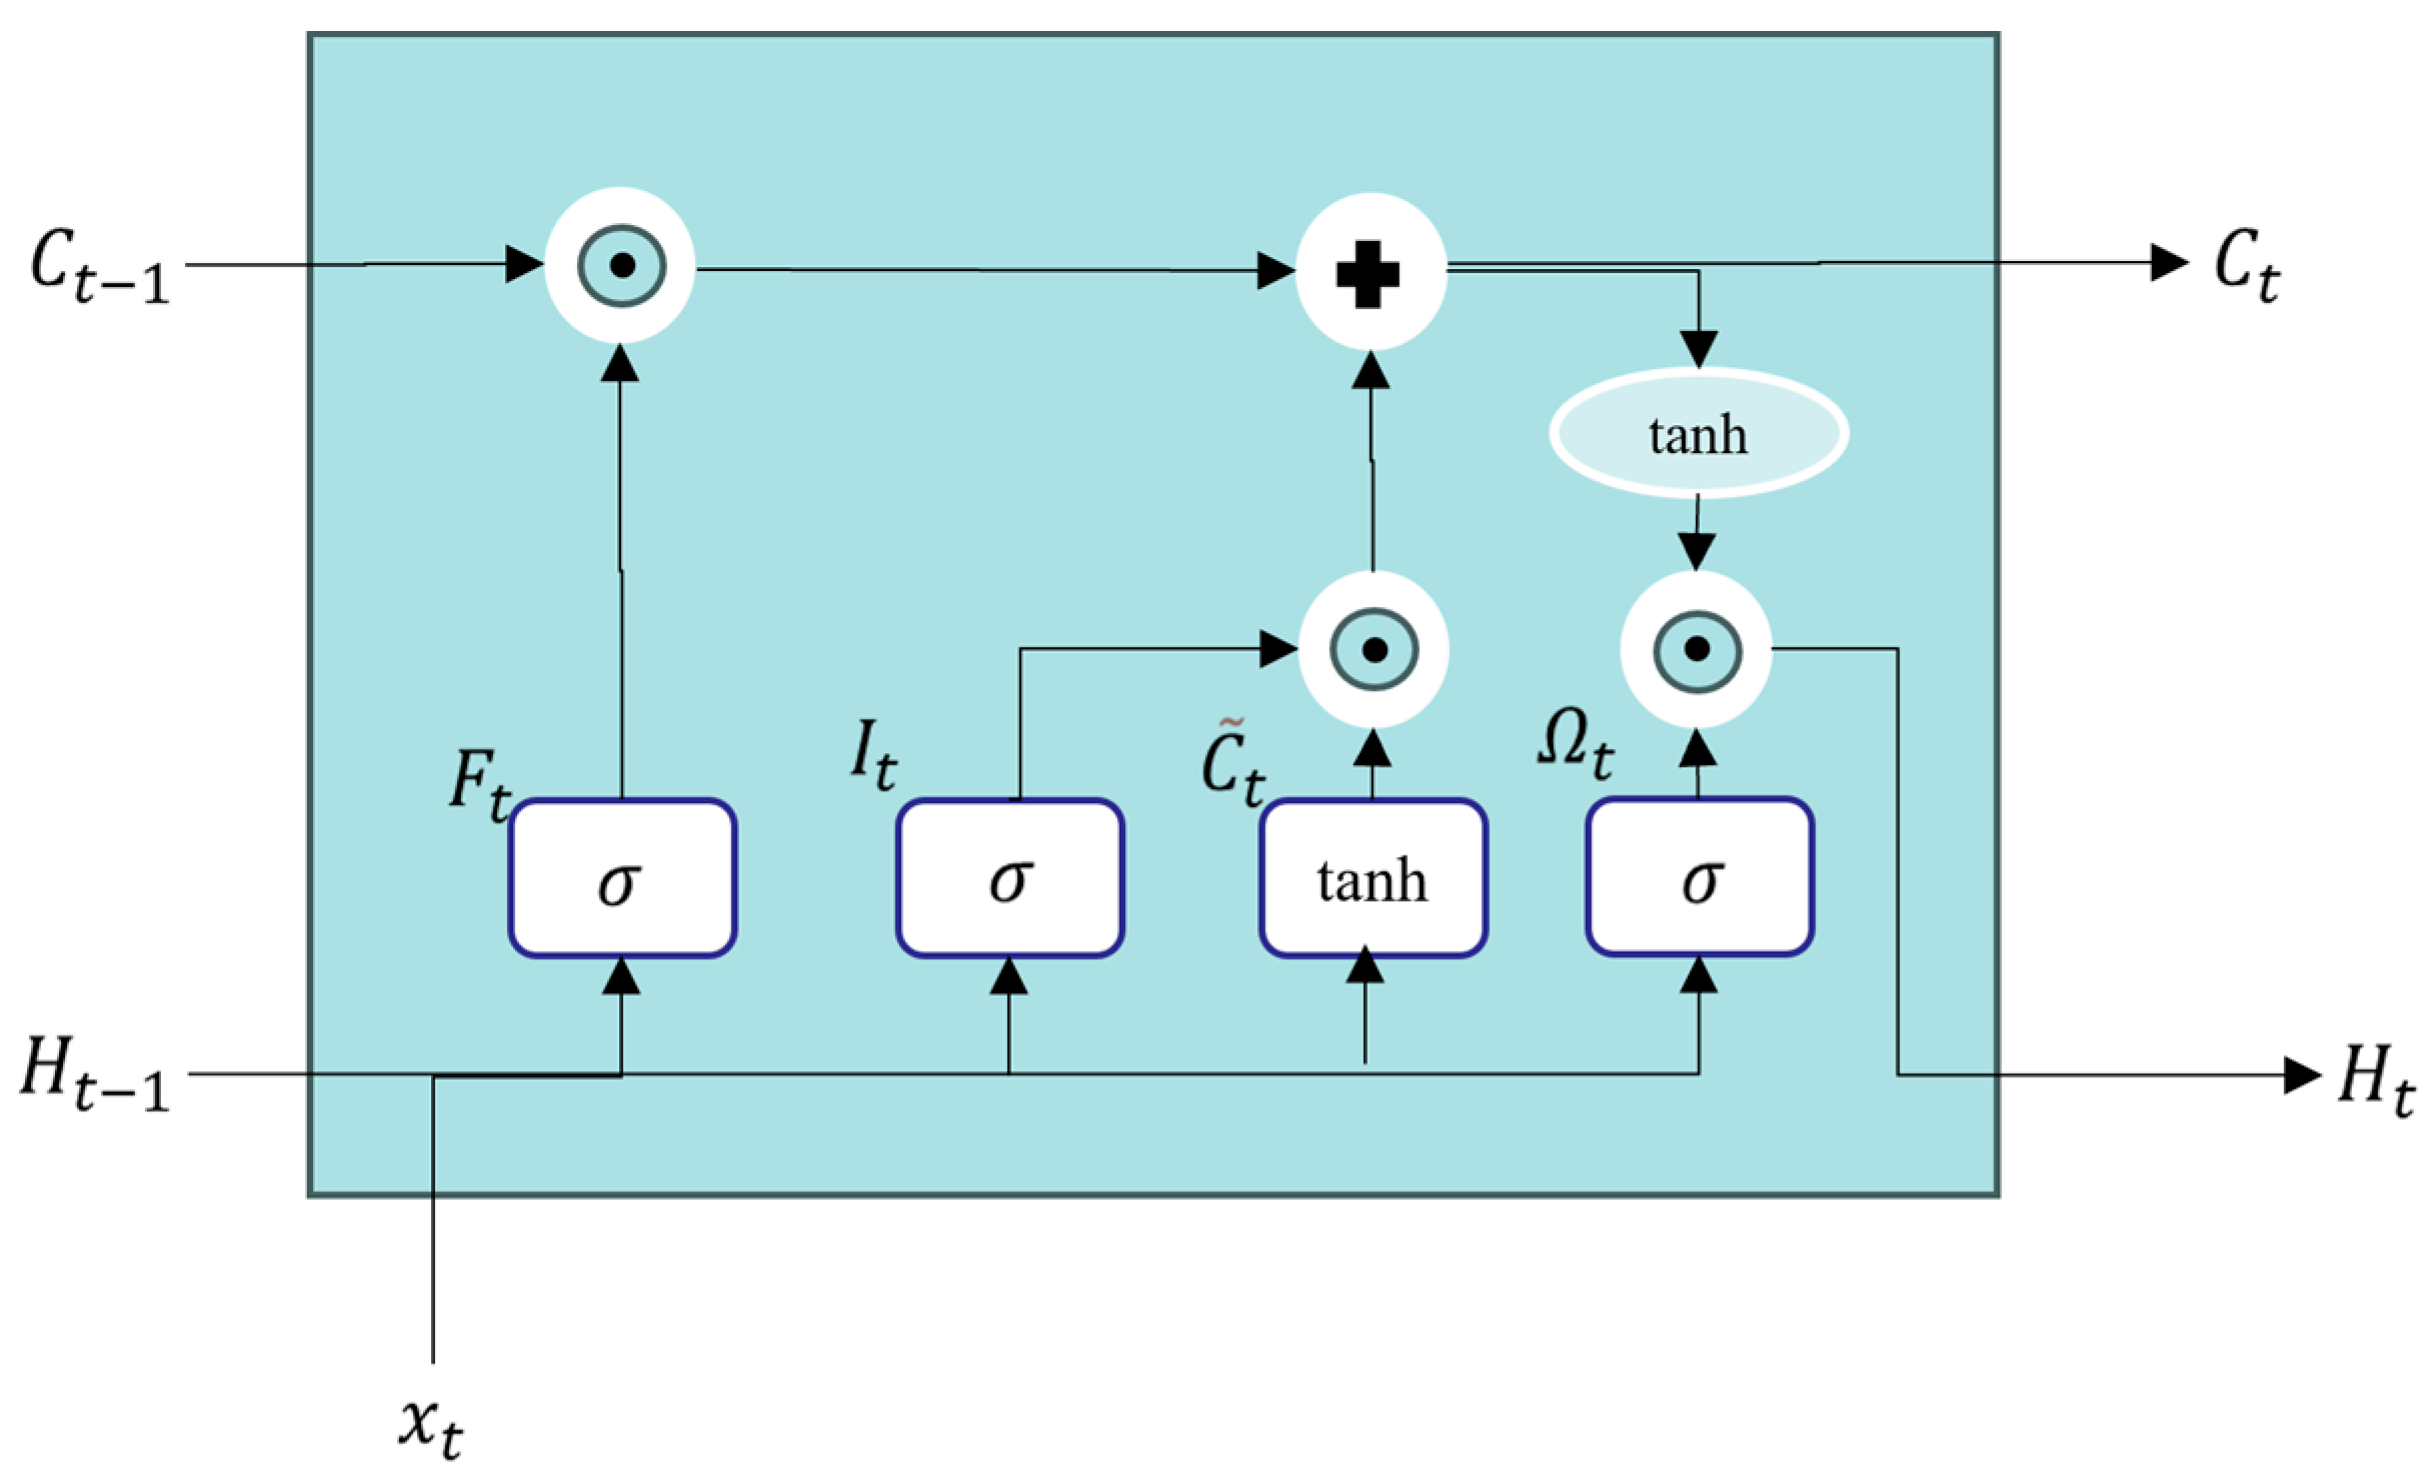
Long Short-Term Memory (LSTM) networks [43] are a variant of RNNs that address this issue by introducing gate units to control the importance of sequence information, enabling the network to effectively learn long-term dependencies and successfully accomplish tasks. The structure of the LSTM unit is shown in Figure 8.
In Figure 8, F t represents the forget gate, I t represents the input gate, C ^ t represents the candidate memory, and Ω t represents the output gate.
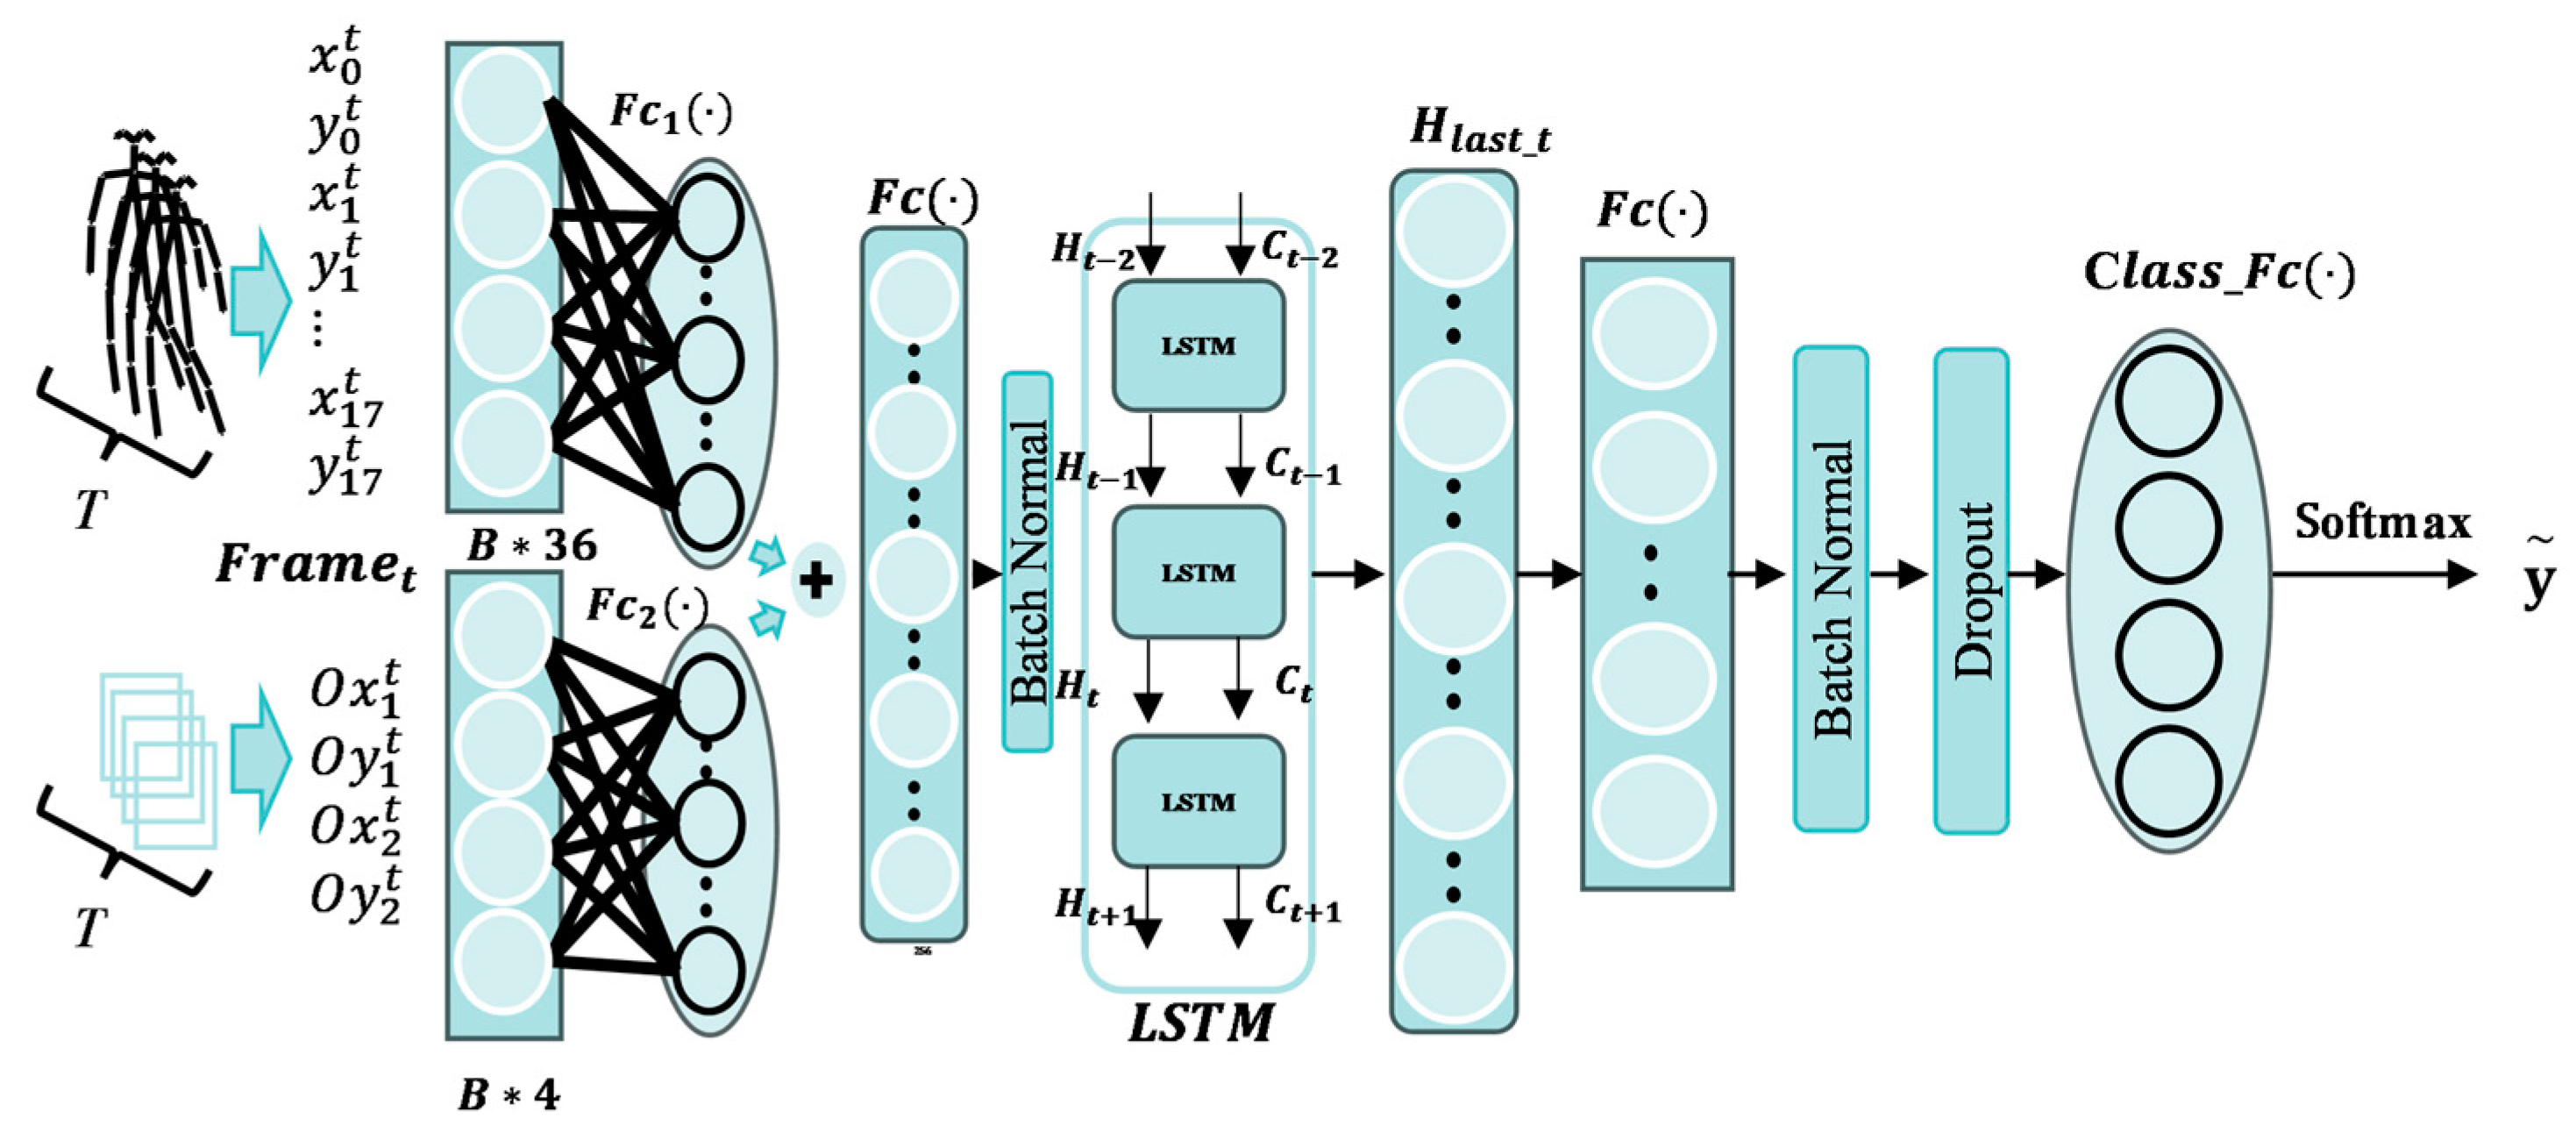
To accomplish the behavior recognition task in this study, we improved the LSTM network by integrating the sequences of skeletal keypoint coordinates and object position coordinates of the target over a certain time range to identify its behavior. This improved network is referred to as the Sequence Key Point Tracking LSTM (SKPT-LSTM) network. The structure of this network is illustrated in Figure 9.
In Figure 9, the SKPT-LSTM network structure diagram, T represents the total number of time steps in a sample, F r a m e t represents the input data from the tth time step; x 0 t , y 0 t represent the horizontal and vertical coordinates of the skeletal keypoints representing “nose” at time step t; O x 1 t , O y 1 t , O x 2 t , O y 2 t represent the positions of the object detected by the object detector at time step t; F c 1 ( ) is a fully connected layer capable of extracting features from skeletal keypoint coordinates; F c 2 ( ) is a fully connected layer capable of extracting features from object position coordinates; F c ( ) is the feature fusion layer. As shown in Equations (7)–(10).
f p t = F c 1 ( x 0 t , y 0 t , x 1 t , y 1 t x 17 t , y 17 t )
f b t = F c 2 ( O x 1 t , O y 1 t , O x 2 t , O y 2 t )
H t = L S T M ( B N ( f p t + f b t ) )
y ~ = S oftmax ( C l a s s _ F c ( B N ( F c ( H l a s t _ t ) ) ) )
The SKPT-LSTM network divides the data into two streams before inputting them into the LSTM network: a stream of human-body keypoint coordinates and a stream of item location coordinates. After extracting the features through two fully connected layers (512 neurons per layer), the features of the two streams were summed, fused, and batch-normalized before being inputted into the LSTM network (containing two LSTM units, each with a hidden layer containing 512 neurons). In the last time step of the SKPT-LSTM network, the final hidden layer states of the LSTM network were passed through two fully connected layers containing 256 neurons to extract the features. Finally, a Class_FC layer was processed using a softmax activation function to output the class probabilities of the behaviors. The ReLU activation function was used for all the fully connected layers, except for the last Class_FC layer. The output of the SKPT-LSTM network is the probability that a series of poses from the current input belong to a certain behavior.
  • Input of the SKPT-LSTM Network.
The input of the SKPT-LSTM network is represented by (11):
X = ( x 0 1 , y 0 1 ) , ( x 1 1 , y 1 1 ) , ( x 17 1 , y 17 1 ) , ( O x 1 1 , O y 1 1 ) , ( O x 2 1 , O y 2 1 ) ( x 0 2 , y 0 2 ) , ( x 1 2 , y 1 2 ) , ( x 17 2 , y 17 2 ) , ( O x 1 2 , O y 1 2 ) , ( O x 2 2 , O y 2 2 ) ( x 0 t , y 0 t ) , ( x 1 t , y 1 t ) , ( x 17 t , y 17 t ) , ( O x 1 t , O y 1 t ) , ( O x 2 t , O y 2 t ) ( x 0 T , y 0 T ) , ( x 1 T , y 1 T ) , ( x 17 T , y 17 T ) , ( O x 1 T , O y 1 T ) , ( O x 2 T , O y 2 T )
In Equation (11), x i d t , y i d t ,   O x 1 t , O y 1 t ,   ( O x 2 t , O y 2 t ) represent the normalized and standardized coordinates of the skeletal keypoints i d at time step t and the detected bounding box positions of the relevant objects, including the upper-left and lower-right corners, respectively. T represents the total number of time steps in a sample. The normalization and standardization equations are represented by Equations (12)–(14), respectively.
n o r m ( x ) = x o r i g f r a m e _ w
n o r m ( y ) = y o r i g f r a m e _ h
In the above equation, x o r i g , y o r i g represent the original unprocessed initial horizontal and vertical coordinate points, respectively, and f r a m e _ w ,   f r a m e _ h denote the width and height of the current video frame, respectively.
x = n o r m ( x ) μ σ
In Equation (14), the n o r m ( x ) represents the normalized coordinate value, where μ , σ denote the mean and standard deviation of the normalized samples, respectively.
  • Loss function of SKPT-LSTM.
The loss function chosen for training the SKPT-LSTM network was the multiclass cross-entropy loss function, as represented by Equation (15).
L o s s = i = 0 C 1 y i log p i = l o g ( p c )
In the above equation, p = [ p 0 , p 1 , , p C 1 ] represents the probability of each behavior category output by the SKPT-LSTM network, y = [ y 0 , y 1 , , y C 1 ] represents the true category to which the training sample belongs; C is the number of categories for the sample, and i represents the current sample.
  • Evaluation Metrics of SKPT-LSTM.
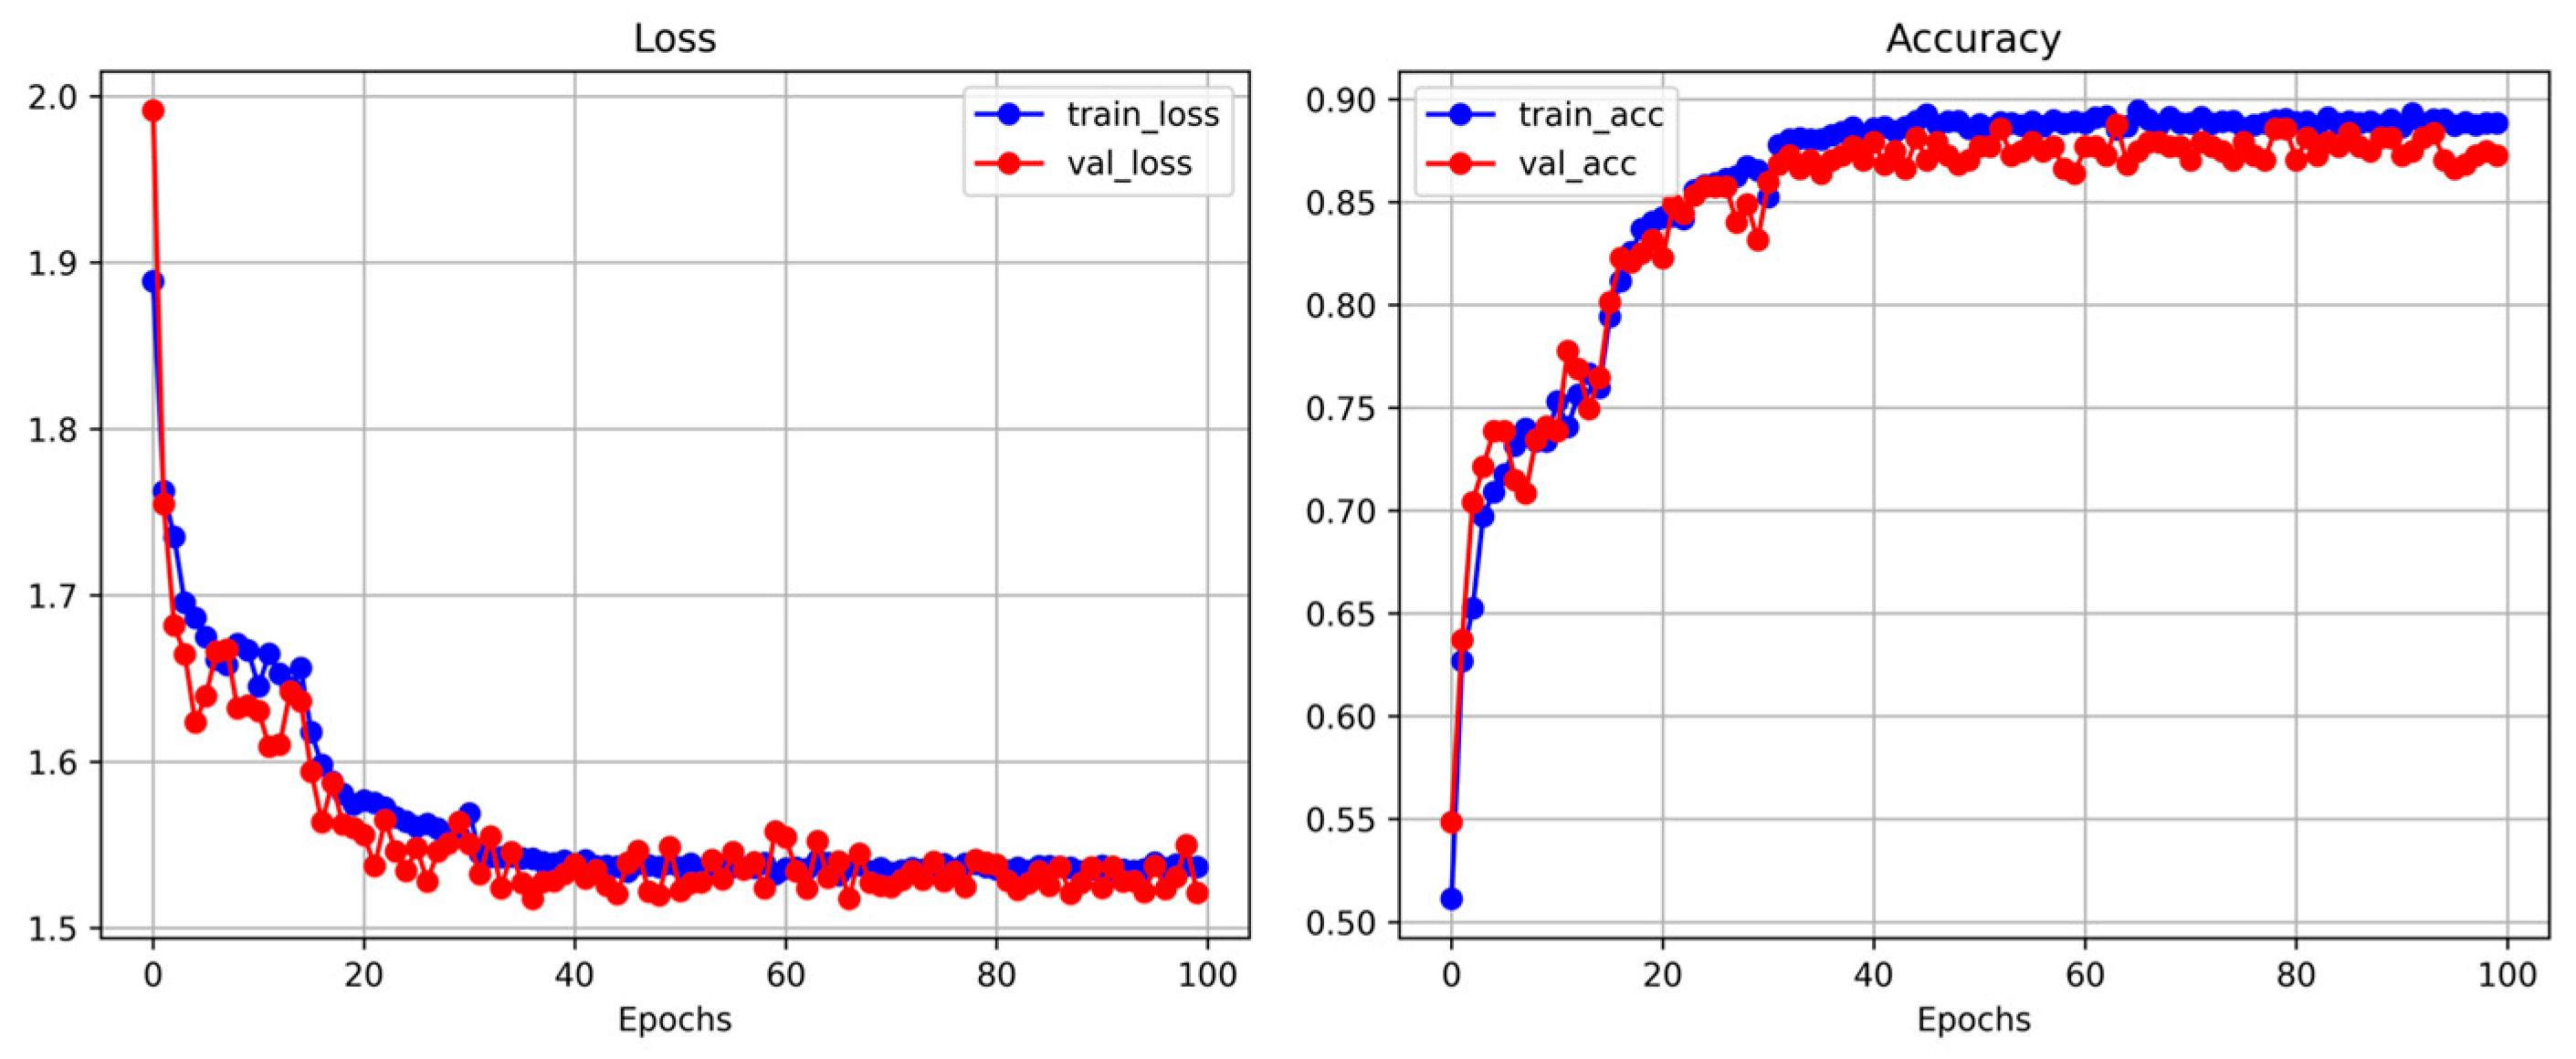
The performance of the SKPT-LSTM network was evaluated using the accuracy, precision, recall, and F1 score metrics. Accuracy was calculated as the ratio of the number of correctly detected samples to the total number of samples detected by the model. Precision represents the ratio of correctly predicted positive samples to all samples predicted as positive by the model. Recall, also known as sensitivity, is the ratio of the correctly predicted positive samples to the total number of positive samples. The F1 score, which balances precision and recall, was computed as the harmonic mean of the precision and recall. The formulas for these evaluation metrics are derived from Table 3 and are shown in Equations (16)–(19).
A c c u r a c y = T P + T N T P + T N + F P + F N
P recision = T P T P + F P
R ecall = T P T P + F N
F 1   s c o r e = 2 × R ecall × P recision R ecall + P recision
In Table 3, TP represents the number of positive samples correctly classified by the model, FP represents the number of positive samples incorrectly classified by the model, FN represents the number of negative samples incorrectly classified by the model, and TN represents the number of negative samples correctly classified.

2.2.4. Improved DeepSORT Algorithm

The DeepSORT algorithm [44] is a simple, high-precision, and fast multi-target tracking algorithm. It first utilizes a detector to obtain the detection information of targets in the previous moment and then uses Kalman filtering to predict the position information of the targets in the next moment. Next, by combining the appearance features, motion information, and target information detected by the detector at the next moment, the similarity between the targets at the two moments was calculated, and the Hungarian algorithm was used for matching. Finally, it completes the trajectory update, thereby achieving the target-tracking task. Owing to its excellent performance, the DeepSORT algorithm is widely used for various tracking tasks [45,46,47,48].
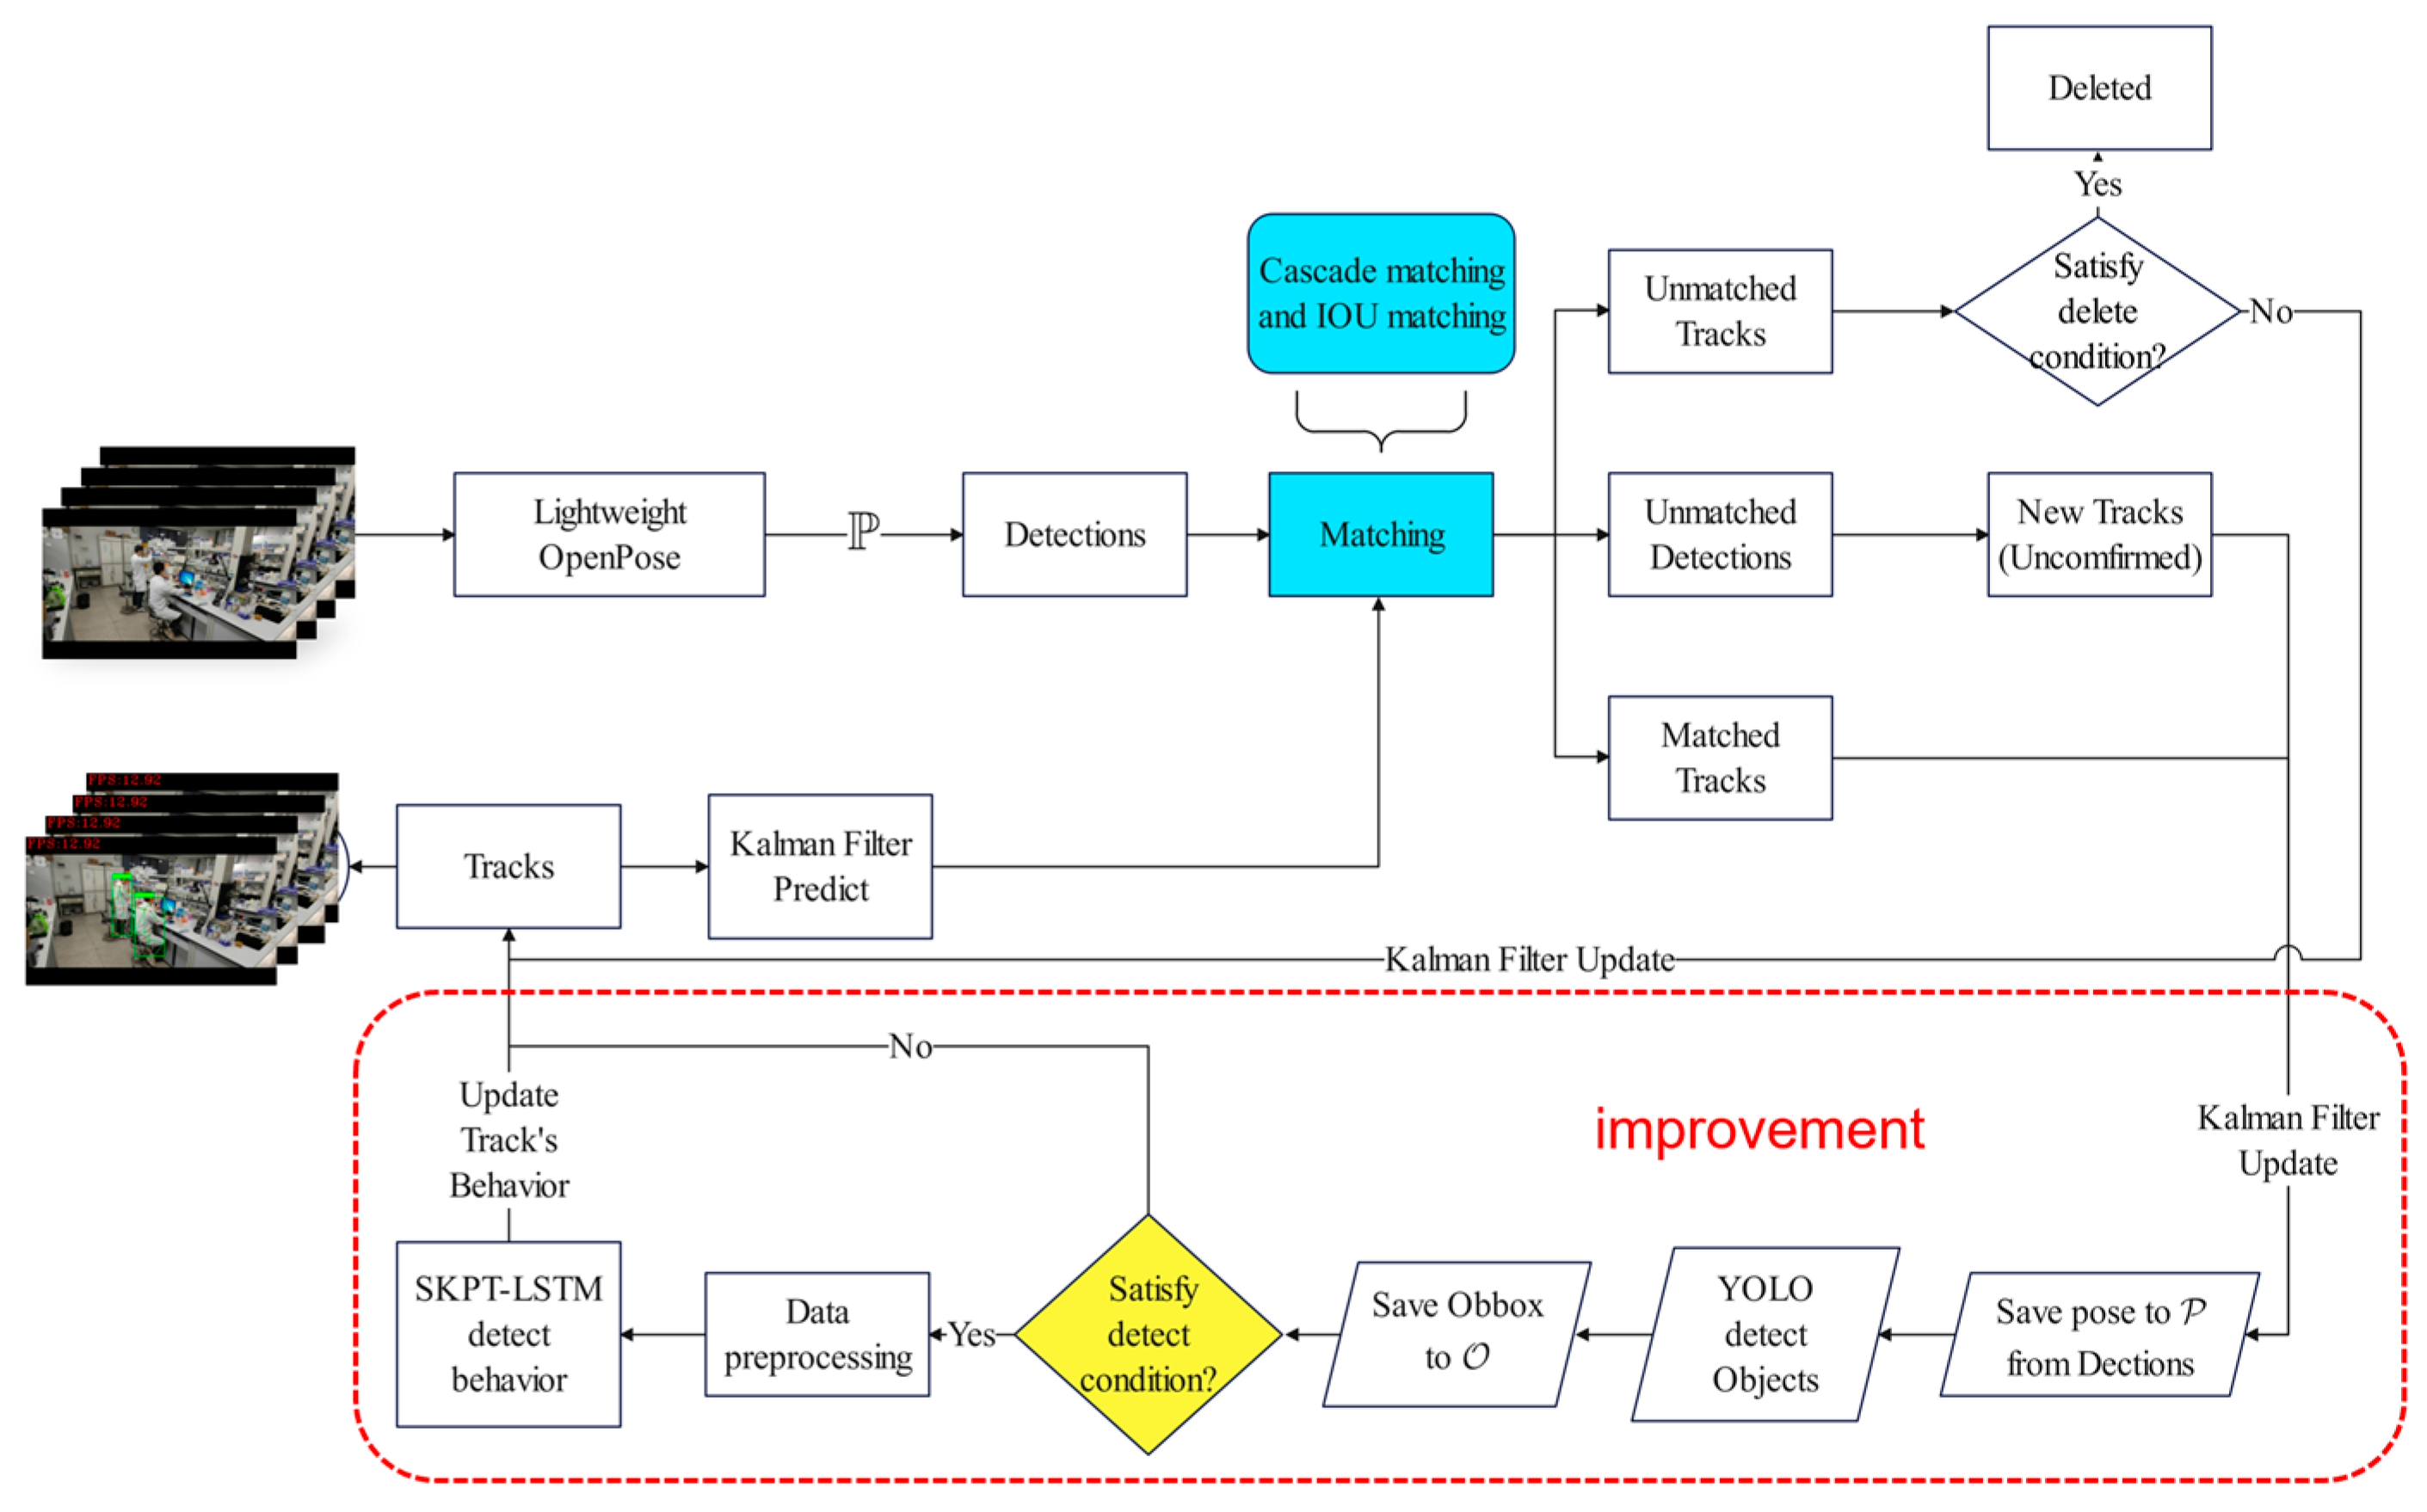
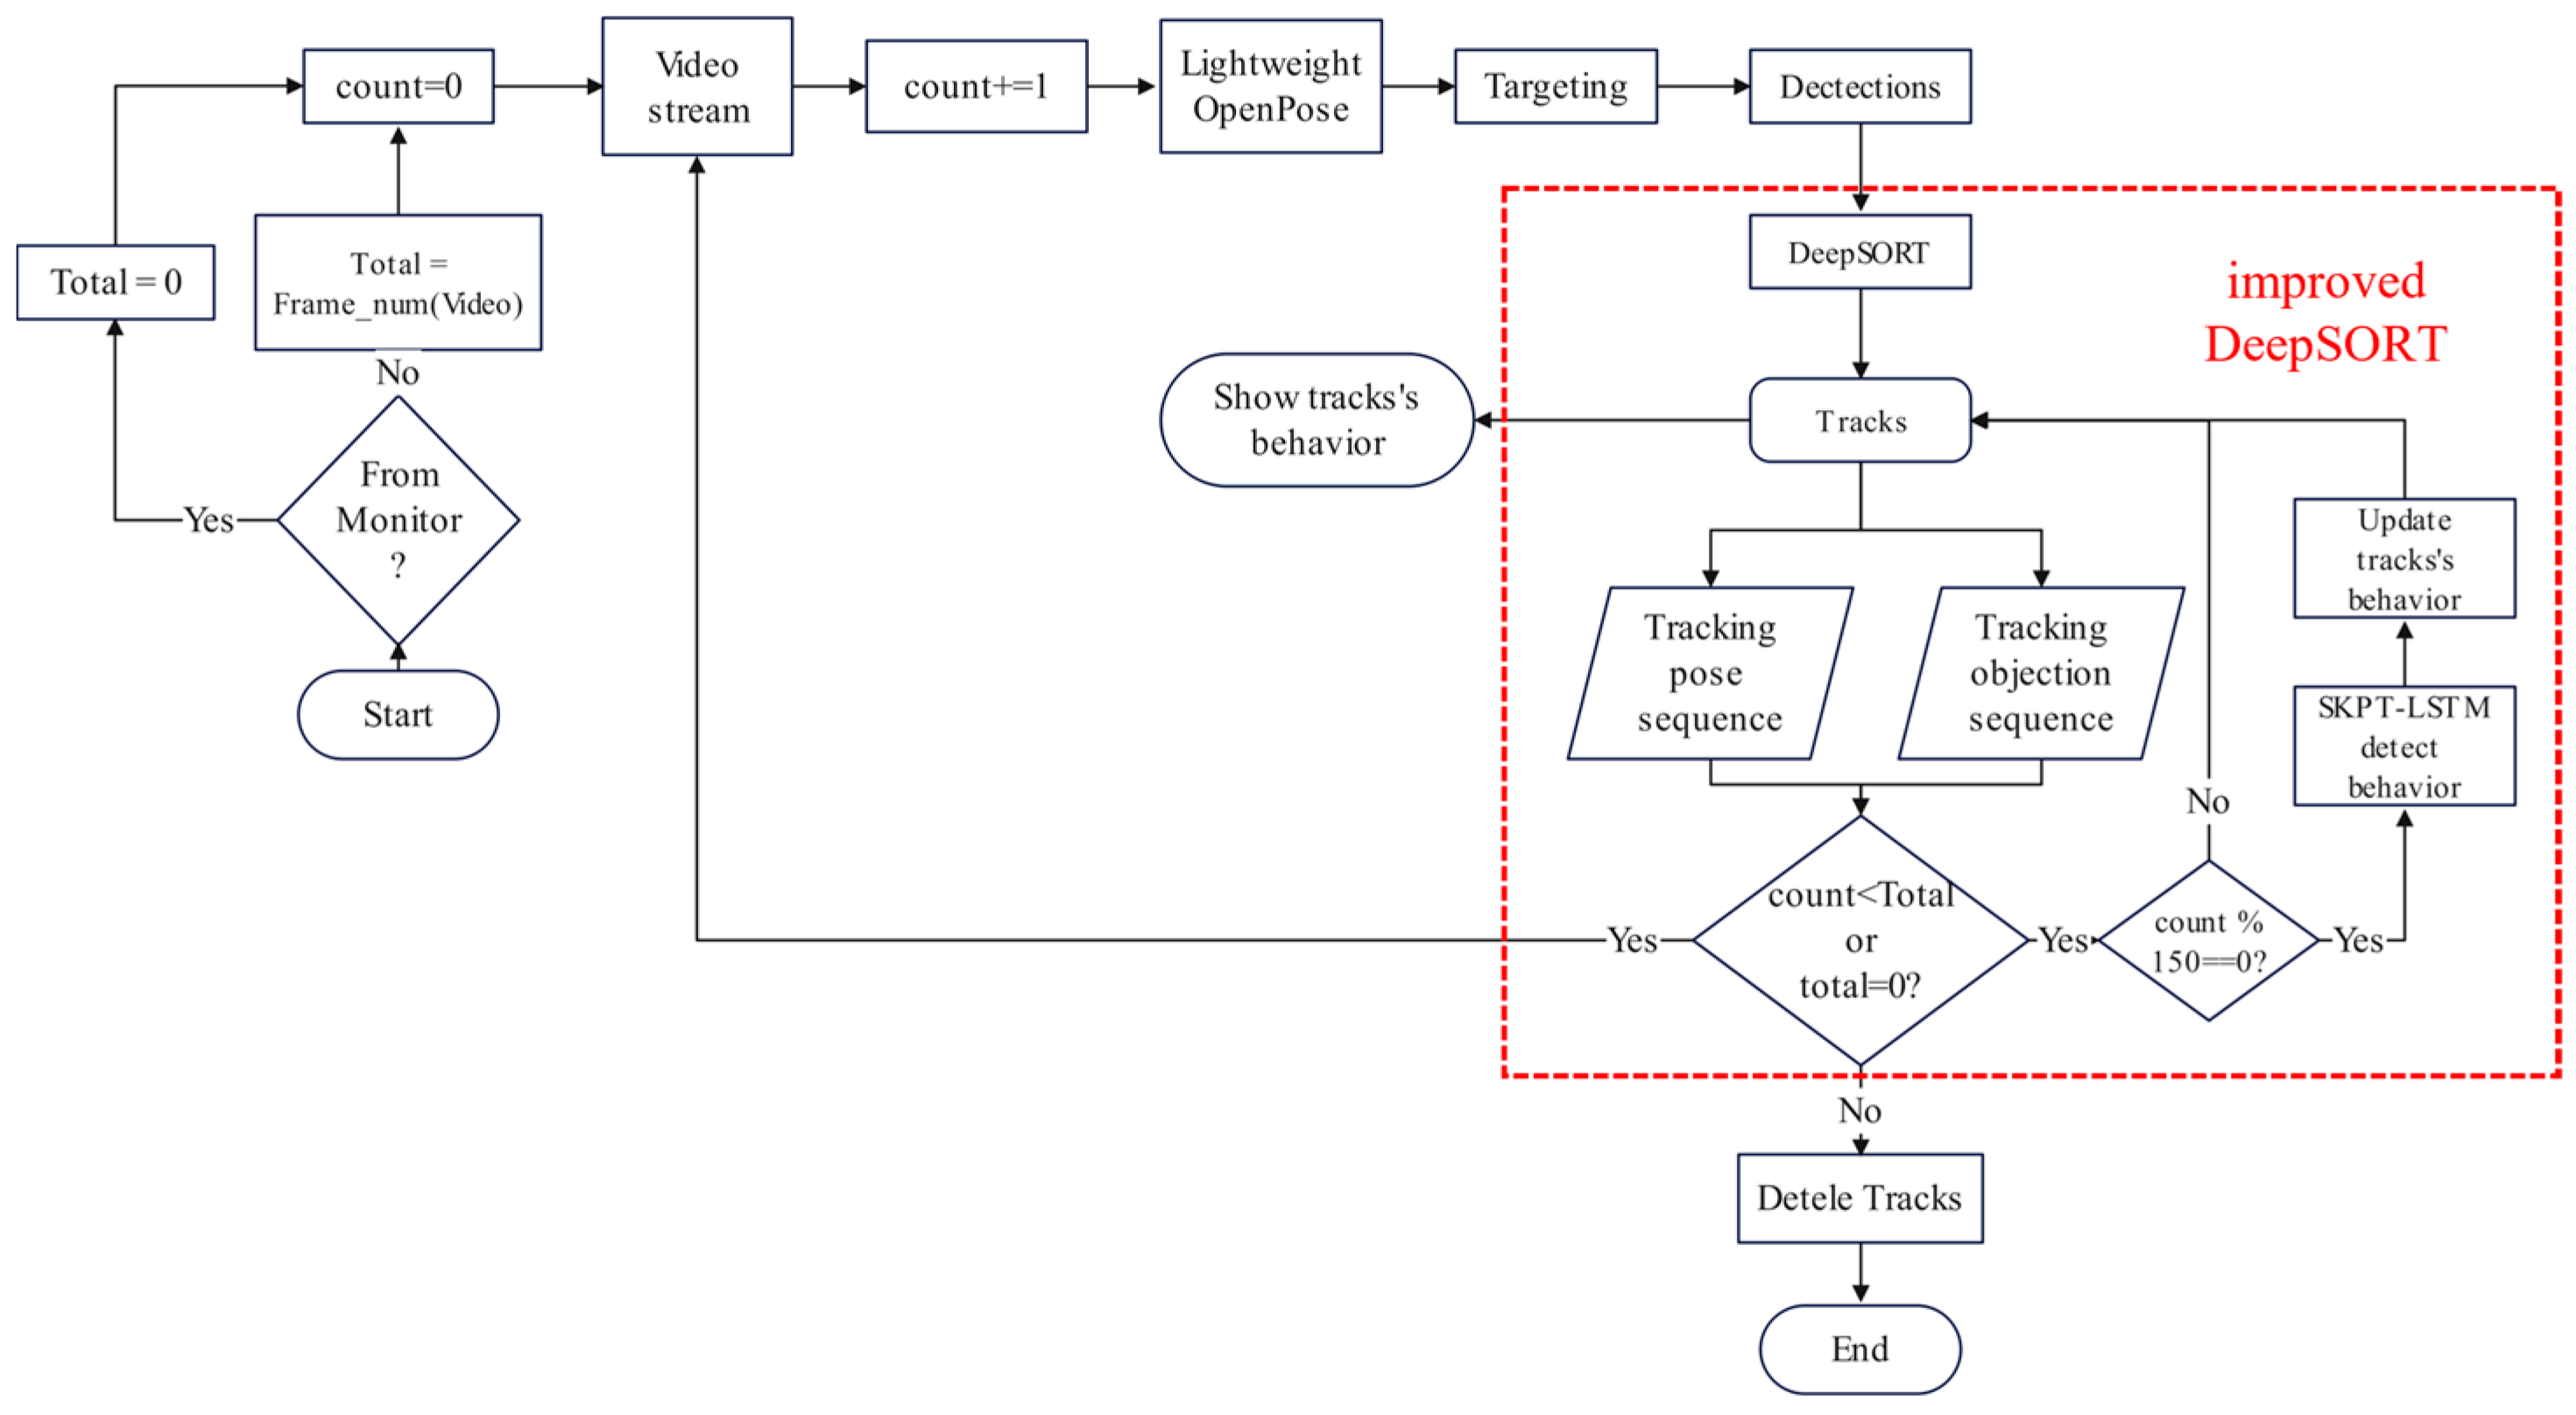
In the task of human behavior recognition, the DeepSORT algorithm can track the position of each human target in consecutive video streams frame-by-frame, forming trajectories and assigning each target a unique “ID” to distinguish different targets. However, it cannot recognize the behavior of targets at the current moment. In this study, we improved the DeepSORT algorithm for laboratory personnel behavior recognition. The improved DeepSORT algorithm is shown in Figure 10.
Step 1: Input the video stream frame by frame into the Lightweight OpenPose human posture estimator to obtain all the human skeletal keypoints group P in the current video frame as in Equation (3) and generate an external rectangular box B ^ (Equation (5)) with all the skeletal keypoints to select the human body. The body frame position information and human skeletal keypoint information are input into the DeepSORT algorithm as detection information (Equation (20)) to generate a new Track ( T i , i { 1 , M } ) (Equation (21)).
Step 2: Kalman filtering predicts the position of the target trajectory at the next moment after transforming the target frame information obtained from the detector (Equation (5)) into the target frame center coordinates, aspect ratio, height, and motion information. This matches the detector’s detection information at the next moment. For a target that fails to match, the decision is made according to the corresponding rules, that is, whether to delete it or match it again in the next frame.
Step 3: For successfully matched target trajectories, the position is updated, and the information of human skeleton points from the matched detection data are stored sequentially in P (Equation (22)). The area where the target was located was then extended outwards by a certain number of pixels (ensuring that all parts of the target were included), cropped, and detected using the YOLO object detector (Equation (24)). The detected relevant object position information is synchronized and stored in O (Equation (23)), and the process then moves to the next frame of target tracking.
Step 4: When a target is successfully tracked for a certain period (i.e., when the information saved in the target trajectory reaches a certain quantity), the tracked sequential skeleton keypoint and object position information are processed. They were fed into the SKPT-LSTM network to recognize the target behavior and simultaneously update the behavioral state B of the target (Equation (25)).
D i = p o s e i ,   f e a t u r e s
T i = { m , v , I D , s t a t e , f e a t u r e s , P , O , B }
P = p o s e 0 , p o s e 1 , p o s e t
O = O b b o x 0 , O b b o x 1 , O b b o x t
O b b o x t = Y O L O ( c r o p ( i m g , t o _ b b o x ( m t , v t ) + margin ) )
B = S K P T L S T M ( p r e p r o c e s s ( P , O ) )
In Equation (20), i represents the ith detected target, and f e a t u r e s denotes the appearance feature vector used during cascade matching.
In Equation (21), m and v represent the mean and variance of the trajectory used by the Kalman Filter (KF) for prediction and update, respectively. I D , s t a t e , f e a t u r e s denote the target’s identifier (used to distinguish it from other targets), state of the trajectory, and appearance feature vector of the currently tracked target, respectively.
In Equation (22), P stores the poses from time 0 to t, and is updated using the pose from the latest detection at time t.
Equation (23), O represents the collection of the positions of relevant items detected by the YOLO object detector within the range of human targets from time 0 to t. The calculation formula is shown in (23).
In Equation (24), the function t o _ b b o x ( m t , v t ) converts the mean and variance of the target trajectory at time t into a bounding box. The function c r o p ( i m g , b o x + margin ) crops the area near the target with a margin specifying the extent to which the cropping area extends outwards. The Y O L O ( i m g ) function was used to detect the positions of the relevant items using the YOLO algorithm. If no detection was detected, O b b o x t = ( 0,0 , 0,0 ) . If multiple identical relevant items were found within the range, O b b o x t = O b b o x max ( c o n f ) .
The track successfully matched the detection information and underwent simultaneous updates of P and O during the Kalman filter-update process.
In Equation (25), B represents the behavior of the human target. When the target was successfully tracked for a certain period, its behavior was identified using the SKPT-LSTM behavior recognizer.

3. Results

The experimental setup of this study included a CPU: 12th Generation Intel(R) Core (TM) i9-12900H with a clock speed of 2.50 Gigahertz, 16 GB RAM, NVIDIA GeForce RTX 3060 GPU, and Windows 11 operating system. PyTorch2.21 [49] was used as the deep learning framework in this study, and the implementation code was written in Python3.8. NVIDIA CUDA and NVIDIA cuDNN were used for GPU acceleration during the training and inference of the deep learning networks.

3.1. Training and Testing of the Lightweight OpenPose Model

Considering issues such as varying environmental lighting conditions, the distance between experimenters and the camera, and different camera angles, video data in this study were sampled (with one frame sampled every 2 s) to construct the Lightweight OpenPose keypoints training dataset. Subsequently, the dataset was annotated using COCO-Annotator, a web-based image-annotation tool. The Lightweight OpenPose model with a Refinement Stage consisting of three layers and pre-trained on the COCO-Keypoints2017 dataset was trained using the self-constructed dataset. Finally, the trained Lightweight OpenPose model detected the skeletal keypoints of the experimenter, and the detection results are shown in Figure 11.
As shown in Table 4, the trained Lightweight OpenPose model effectively predicts the occluded points. Although keypoints 0, 14, and 15 were obscured owing to the serious occlusion of the human body posture, and the confidence level of keypoint 4 was low, the average confidence level of the detected points still reached 0.70, indicating the capability of the trained Lightweight OpenPose model to perform the detection task in this study.

3.2. Training and Evaluation of YOLOv5 Model

This study used the YOLOv5-s model as the object detector. Compared with other versions of the YOLO series, the YOLOv5 model can maintain high accuracy while having a very fast inference speed and is lightweight. Therefore, resource-constrained devices are easy to deploy and suitable for real-time application scenarios.
First, we prepared a dataset for training the item detector. We used the trained Lightweight OpenPose model as a human detector for the keypoint image dataset and cropped a 50-pixel region around the target (to ensure the integrity of the item target). We then used the LabelImg1.8.6 software to label cropped images with cell phone items. Next, we converted the labeled images into the format of the YOLO model training evaluation dataset and trained the YOLOv5-s model for 100 epochs. The training and testing results are shown in Figure 12.
As illustrated in Figure 12, the trained YOLOv5 model demonstrated satisfactory performance, achieving an mAP@0.5 of 97.31% and an mAP@0.5:0.95 of 65.12% for the validation set. Because the YOLO algorithm was exclusively employed for detecting “phone” items in this study, the category loss value consistently remained at zero.
The trained Lightweight OpenPose model combined with the YOLOv5 target detector was integrated into the DeepSORT algorithm to track the pose and identify the target’s items. As shown in Figure 13, the object detector performed well.

3.3. Training and Evaluation of SKPT-LSTM Network

Training of SKPT-LSTM Network

We utilized the DeepSORT algorithm in conjunction with the Lightweight OpenPose model and the YOLOv5 model to process our self-constructed video dataset of chemical laboratory personnel behavior. This process involved extracting the location sequences of keypoints on the skeleton of the experimenter as well as the location sequences of related items for each video sample. Subsequently, we created a training evaluation dataset for the SKPT-LSTM network based on Equation (11).
For the training process, we configured the following parameters: Batch size: 32; Initial learning rate: 0.001; Learning rate schedule: the learning rate was reduced by a factor of 10 every 20 epochs; Total epochs: 100; Optimizer: Adam optimizer; Dropout rate: 0.5; L2 Regularization: Coefficient was set to 0.01.
The loss reduction and accuracy curves for the training process are shown in Figure 14.
Figure 14 shows that the training status of the model was satisfactory. Throughout the training process, both the loss value and accuracy of the model on the test set stabilized within a certain range, indicating that the SKPT-LSTM network that we designed was structurally reasonable.

4. Discussion

4.1. Evaluation of SKPT-LSTM Network

The performance of the trained SKPT-LSTM network was evaluated using a self-built chemical laboratory behavior test dataset.
We used a self-built chemical laboratory behavior test dataset to evaluate the performance of the SKPT-LSTM network. We mixed the validation and test set data to form a test dataset containing 1390 behavior samples, accounting for one-quarter of the entire dataset. Among them, there were 124 samples of “eating” behavior, 179 samples of “sleeping on the laboratory table” behavior, 193 samples of “sleeping on the side of the chair” behavior, 169 samples of “sitting and playing with mobile phones” behavior, 133 samples of “standing and playing with mobile phones” behavior, 125 samples of “making and receiving phone calls” behavior, 189 samples of “normal reading and taking notes” behavior, 169 samples of “normal experiment” behavior, and 109 samples of “normal walking” behavior. Using the method proposed in this paper, we identified the above nine behaviors in the test set, drew a confusion matrix (as shown in Figure 15), and calculated indicators, such as P, R, and F1. Table 5 presents the results of this study.
In Figure 15, we have simplified the behavior descriptions to enhance clarity and ease of representation. The revised labels are as follows:
“Sleeping (Desk Rest)” is simplified to “sleeping_desk”
“Sleeping (Chair Lean)” is simplified to “sleeping_chair”
“Phone Use (Sit)” is simplified to “play_phone_sit”
“Phone Use (Stand)” is simplified to “play_phone_stand”
“Phone Use (Call)” is simplified to “play_phone_call”
“Normal (Read)” is simplified to “normal_read”
“Normal (Experiment)” is simplified to “normal_experiment”
“Normal (Walk)” is simplified to “normal_move”
These simplifications ensure that the behavior labels are more concise and easily understandable.
By combining the indicator calculation results in Table 5 and the confusion matrix in Figure 15, we analyzed the performance of the SKPT-LSTM model in detail. The model performs best in identifying the two “sleeping” behaviors because in this type of behavior, the sequence position fluctuation of the key points of the human skeleton is small, and the behavior characteristics are relatively obvious. The recall rate of the “eating” behavior is low. By analyzing the confusion matrix, we found that the model misclassified a small number of “eating” behaviors as “normal experiment” and “normal reading and note-taking”. This may be because the titration operation in the chemical experiment and the operation of turning pages in the book are also accompanied by the movement of the “wrist” key point, which leads to the similarity of the characteristics of the “eating” behavior with other behaviors, thereby affecting the recall rate. Among the three types of “playing with mobile phones”, the recall rate of “making and receiving phone calls” behavior is the lowest. Specifically, 11 and 18 “making and receiving phone call“ samples were misclassified as “playing with mobile phones while sitting” and “playing with mobile phones while standing”, respectively, and nine samples were misclassified as “normal walking”. This is because the behavior of “making or receiving calls” usually involves the use of mobile phones, and the SKPT-LSTM network identifies mobile phone usage behaviors in different situations by analyzing the positional relationship between the “mobile phone” position and related skeleton key points. However, owing to the influence of the shooting angle, errors occur in the extraction of the positional relationship features, resulting in behavior recognition errors. In addition, in the process of “making or receiving calls”, “mobile phone” objects are often blocked, making it impossible for the object detector to detect the position of the relevant object and then misjudging it as “normal walking” behavior, which also leads to a low recognition accuracy rate for “normal walking” normal walking behavior.
Figure 16 shows the integration of the trained SKPT-LSTM network into the improved deep-SORT algorithm and identifies various behaviors of the laboratory personnel. It accurately identifies the various behaviors of the laboratory personnel, which shows that the proposed method is practical and effective.

4.2. Comparison of SKPT-LSTM Network

In order to verify that the SKPT-LSTM network can effectively extract behavior recognition features from the positional relationship between sequence human skeleton key points and related items, we selected the basic LSTM, basic recurrent neural network (RNN), and basic convolutional neural network (CNN) for comparison. Initially, we trained these three networks separately, using the same training data and parameters. Subsequently, we tested the trained network models on an identical test dataset and assessed the average accuracy, precision, recall, and F1 score for each behavioral category as well as the number of samples processed per second (PS, Processing Speed).
It can be clearly observed from Table 6 and Figure 17 that the SKPT-LSTM network designed in this study can effectively fuse the tracked sequence of human skeleton keypoint groups with the location information of related objects and extract features for behavior recognition. In contrast, the three types of basic neural networks used for comparison exhibited poor model performance when processing the same test dataset because of their inability to extract key features effectively. For example, for the “making and receiving phone calls” behavior, the three models often misclassify it as “sitting and playing with mobile phone” or “standing and playing with mobile phone”. However, because the SKPT-LSTM network considers the spatial position relationship characteristics between the key points of the human skeleton and related items, the recognition speed of the algorithm was lower. However, in terms of laboratory safety, the recognition accuracy of the algorithm was more important than that of the algorithm. Therefore, the design of the SKPT-LSTM network proved reasonable and effective.

4.3. The Impact of Different Shooting Angles on the Performance of the Improved DeepSORT Algorithm

When constructing the dataset for identifying irregular behaviors of laboratory personnel, we used two different angles of equipment for data collection, namely the “horizontal angle” and the “overhead angle”. After data cleaning, the dataset also contained 2297 behavior samples from the “horizontal angle” and 2339 behavior samples from the “overhead angle”. To verify the impact of data samples from different shooting angles on model performance, we divided the datasets of these two angles into training, validation, and test sets in a ratio of 7:1:2 and trained and tested the improved DeepSORT algorithm. The evaluation indicators included average accuracy, average precision, average recall and F1-Score.
It can be clearly seen that Table 7 shows that the model trained with the “Eye level” angle data has better overall performance than the model trained with the “Overlook” angle data. The dataset was analyzed in combination with the experimental results. In the “Overlook” angle dataset, the positional relationship between the key points of the human skeleton will shift due to changes in the shooting angle. Because this study uses a 2D human posture estimation algorithm, it cannot accurately represent the three-dimensional spatial positional relationship between the key points of the skeleton, which increases the difficulty of the model to extract behavioral features from the spatial positional relationship, resulting in a decrease in recognition accuracy. The data at the “Eye level” angle were closer to the human visual angle, and the distance between the key points of the skeleton was less affected by the shooting angle. Therefore, it can more accurately represent the spatial positional relationship between the key points of the human skeleton.

4.4. Improved DeepSORT Performance Comparison

To verify the superior performance of the improved DeepSORT algorithm proposed in this study in identifying irregular laboratory personnel behaviors, we conducted a comparative analysis with several popular end-to-end behavior recognition networks, including C3D and R3D networks.
R3D (ResNet3D) and C3D (convolutional 3D) networks are deep learning networks dedicated to video and three-dimensional convolution operations, respectively. They are widely employed in tasks such as video analysis and action recognition. Both are predicated on 3D convolution operations, which capture spatiotemporal information within the video by extending 2D convolution in the temporal dimension. However, their implementation approaches and characteristics vary.
The C3D network was among the earliest 3D convolution networks proposed for video comprehension, and its principal attributes are simplicity and directness. It conducts convolution in three-dimensional space to capture the temporal information between video frames. The R3D network is an extension of the ResNet network in three-dimensional convolution. The R3D network incorporated a residual structure into the 3D convolution network, thereby enhancing the training stability and performance of the deep model. In contrast to C3D, R3D possesses a superior gradient transfer capacity in deep structures and is suitable for spatiotemporal modeling of longer video sequences.
We trained these models using our own chemical laboratory personnel behavior dataset and evaluated them using the same test dataset. The comparison indicators included accuracy, average precision, average recall, F1 index, number of parameters(M), applicability to multi-target scenarios, algorithm calculation speed in a single-target scenario (SFPS, the number of video frames processed per second by the algorithm in a single target scene), and algorithm calculation speed in a multi-target scenario (MFPS, the number of video frames processed per second by the algorithm in multi-target scenarios). A comparison of the results is presented in Table 8.
As is conspicuously evident in Table 8, the C3D model showcases the optimal performance metrics on the same test dataset; nevertheless, it also has the highest parameter count, attaining 78.03 M, which imposes substantial demands on the deployment hardware. Additionally, both deep learning-based end-to-end behavior recognition algorithms are ill suited for multi-target scenarios, such as those encountered in chemical laboratory environments. In contrast, the improved DeepSORT algorithm proposed in this study not only has a significantly lower parameter count but also delivers robust performance, providing a superior balance between efficiency and effectiveness. Because the improved DeepSORT algorithm not only has the function of target tracking but also considers behavior recognition, whereas C3D and R3D merely focus on the behavior recognition task, Table 8 presents the average calculation speed of the improved DeepSORT algorithm in single-target and multi-target scenarios.

4.5. Application in Actual Scenarios

To further explore the performance of the SKPT-LSTM network for detailed behavior recognition, we made detailed predictions for various behaviors based on dataset collection standards. However, in actual chemical laboratory application scenarios, we mainly focus on whether the experimenters have irregular behaviors, and the specific details of irregular behaviors are not very important (for example, people only care about whether there is “playing with mobile phones” behavior and will not pay special attention to “sitting”, “standing” or “making phone calls”). Therefore, in actual applications, we simplify the behavior categories into four categories: “eating”, “sleeping”, “playing with mobile phones” and “normal” behavior, and calculate the performance indicators of the simplified four categories of behavior recognized by the improved DeepSORT according to Figure 15, Table 9.
Table 9 indicates that the proposed method exhibited a higher recognition effect in the simplified behavior categories where the accuracy of each behavior reached 92.45%.
Testing conducted in real chemical laboratory environments validated the robustness, generalization ability, and real-time multi-target behavior recognition capability of the proposed method. The testing data were captured using the rear wide-angle camera of Honor Magic3 Pro with a video frame rate of 30 frames per second (fps). The capture locations included the three aforementioned chemical laboratories with personnel in a normal experimental state.
Considering the possibility of multiple laboratory personnel in the laboratory, each with varying appearance times, recognition failures may occur if the appearance time of the laboratory personnel is short and the tracked posture actions are insufficient. Therefore, the behavior recognizer only identifies laboratory personnel who appear for more than 3 s. This testing setup enabled a more realistic assessment of the application of the proposed method in practical scenarios.
Based on the flowchart depicted in Figure 18, the method described in this study was applied to real chemical laboratory scenarios as follows. The video stream is continuously fed into the improved DeepSORT algorithm. Every 5 s, the SKPT-LSTM behavior recognizer identifies the behavior of all tracked human targets that satisfy the tracking conditions (i.e., appearing for more than 3 s) and presents the recognition results in real-time. The parameters “count” indicate the current number of processed video frames, “Total” represents the total number of frames in the video stream, and “Frame_num(Video)” is a function used to obtain the total number of frames in the video stream. If the input data are from a real-time monitoring device, then “Total” is set to zero.
The proposed method was applied in a microbial chemical culture laboratory, a chemical photocatalytic reaction laboratory, and a chemical engineering simulation operation training laboratory. Figure 19 shows the single-target behavior detection of laboratory personnel. It can be observed that the proposed method accurately detects the behavior of laboratory personnel, achieving an average frame rate of 17 fps, thus demonstrating its capability for real-time detection.
Given that both the Lightweight OpenPose and DeepSORT algorithms are suitable for multi-target tasks, the performance of the proposed method was evaluated in scenarios involving multiple laboratory personnel to assess its generalization ability in multi-target behavior recognition tasks.
Figure 20 illustrates that when our method is used for multiple-target behavior detection, it is evident that although the algorithm can accurately identify the behaviors of laboratory personnel, the detection speed is relatively slower than that of single-target detection, stabilizing at approximately 14 frames per second (fps). As the number of laboratory personnel increased, the detection speed of the algorithm decreased. Therefore, our method is more suitable for chemical laboratory scenarios with relatively few personnel.
Even in cases where laboratory personnel are partially or fully occluded, the proposed method can continue to track the poses of targets and accurately identify their behavior, as shown in Figure 21.
Because the proposed method adopts offline data processing and model training, if behaviors or poses not included in the self-constructed dataset occur in practical applications, resulting in the inability of the behavior recognizer to identify them, we employ the strategy of adding unrecognized behaviors to the training dataset of the SKPT-LSTM network and then retrain the network.

5. Conclusions

In this study, we employed the lightweight OpenPose multi-target human pose estimation algorithm and YOLOv5 target detection algorithm to enhance the performance of the DeepSORT multi-target tracking algorithm. By integrating these algorithms, DeepSORT can track the sequence of skeletal keypoint locations and associated sequence of item locations for a target. In addition, we designed a network called SKPT-LSTM for integration into the improved DeepSORT algorithm. This network can fuse tracked sequence information to achieve behavioral recognition. This method was tested on a self-built chemical laboratory personnel behavior dataset. The results showed that the improved DeepSORT algorithm achieved an accuracy of 87.99% for the nine behavior recognition tasks defined in this study, with an average precision of 87.70% and an average recall of 86.40%. Furthermore, the SKPT-LSTM network designed in this study was compared and evaluated with three other classical baseline networks, and showed superior performance in terms of accuracy, precision, recall, and F1 score under the same test set conditions. The algorithm was tested and evaluated using the datasets obtained from various shooting angles. The results show that the performance of the proposed method was better than that of the “Overlook” angle at “Eye level” angle. Finally, we compared the performance of the improved DeepSORT algorithm with those of two end-to-end behavior recognition algorithms based on deep learning. The results showed that the improved DeepSORT algorithm is lightweight and suitable for deployment in chemical laboratory scenarios. When applying the method in this study in an actual chemical laboratory scenario, we first simplified the “nine behaviors” into “four types of behaviors”. The simplified algorithm showed higher performance in practical applications, with a recognition accuracy of 92.43%. The proposed method can accurately identify the behaviors of single- and multi-target experimenters with an average speed of 17.03 frames per second (fps17) and 14.42 frames per second (fps14), respectively, further verifying the effectiveness of the proposed method.
Although the method proposed in this study achieved certain results in the task of laboratory personnel behavior recognition, it also has some limitations. First, in the multi-target behavior recognition task, as the number of targets increases, the detection time also increases accordingly, which, to a certain extent, limits the applicability of this method in practical applications. Second, the definition criteria for irregular behaviors in this study are relatively simple, and it is impossible to effectively identify complex behaviors, such as “eating and playing with mobile phones”, and multiple behaviors simultaneously. To address these limitations, in the future, a lighter and more efficient algorithm model will be used to improve the proposed method, and the scale of the laboratory irregular behavior dataset will be expanded so that this method can identify more complex and important irregular behaviors.
In conclusion, the methodology outlined in this study presents an effective framework for accurately identifying irregular behavior among laboratory personnel. The ultimate goal of this method is to deploy it in a chemical laboratory and use it in the laboratory safety management department to reduce the pressure on laboratory safety management by using computer vision algorithms. Simultaneously, this method can effectively encourage experimenters to comply with regulations in chemical laboratories, reduce the occurrence of laboratory accidents, promote the establishment of a safe working environment, and provide strong guarantees for the early warning of laboratory accidents.

Author Contributions

Conceptualization, Y.D. and B.S.; methodology, Y.D. and B.S.; software, Y.D.; validation, Y.D.; formal analysis, Y.D.; investigation, B.S. and Z.L.; resources, B.S. and Z.L.; data curation, Y.D. and Z.L.; writing—original draft preparation, Y.D.; writing—review and editing, B.S.; visualization, Y.D.; supervision, B.S.; project administration, B.S.; funding acquisition, B.S. and Z.L. All authors have read and agreed to the published version of the manuscript.

Funding

This study was supported by the Wuhan University of Technology Teaching Reform and Research Project (W2024037).

Institutional Review Board Statement

Not applicable.

Informed Consent Statement

Informed consent was obtained from all participants involved in this study.

Data Availability Statement

The data that support the findings of this study are available from the corresponding author upon reasonable request.

Acknowledgments

Thanks are given for the support provided by the Wuhan University of Technology’s university-level teaching reform and research project.

Conflicts of Interest

The authors declare no conflicts of interest.

References

  1. Lestari, F.; Bowolaksono, A.; Yuniautami, S.; Wulandari, T.R.; Andani, S. Evaluation of the implementation of occupational health, safety, and environment management systems in higher education laboratories. J. Chem. Health Saf. 2019, 26, 14–19. [Google Scholar] [CrossRef] [PubMed]
  2. He, Y.; Kuai, N.S.; Deng, L.M.; Wang, Z.L.; Peng, M.J. An investigation into accidents in laboratories in universities in China caused by human error: A study based on improved CREAM and SPAR-H. Heliyon 2024, 10, e28897. [Google Scholar] [CrossRef] [PubMed]
  3. Lv, P.; Zhu, S.; Pang, L. Statistical analysis of laboratory accidents in Chinese universities from 2011 to 2021. Process Saf. Prog. 2023, 42, 712–728. [Google Scholar] [CrossRef]
  4. Xu, C.; Guo, L.; Wang, K.; Yang, T.; Feng, Y.; Wang, H.; Fu, G. Current challenges of university laboratory: Characteristics of human factors and safety management system deficiencies based on accident statistics. J. Saf. Res. 2023, 86, 318–335. [Google Scholar] [CrossRef] [PubMed]
  5. Robinson, C. …And the regulator clapped! New approaches to maximizing worker engagement in process safety management. Process Saf. Prog. 2023, 42, 556–560. [Google Scholar] [CrossRef]
  6. Shu, Q.; Li, Y.; Gao, W. Emergency treatment mechanism of laboratory safety accidents in university based on IoT and context aware computing. Heliyon 2023, 9, e19406. [Google Scholar] [CrossRef]
  7. Ding, L.; Fang, W.; Luo, H.; Love, P.E.D.; Zhong, B.; Ouyang, X. A deep hybrid learning model to detect unsafe behavior: Integrating convolution neural networks and long short-term memory. Autom. Constr. 2018, 86, 118–124. [Google Scholar] [CrossRef]
  8. Hung, P.D.; Su, N.T. Unsafe construction behavior classification using deep convolutional neural network. Pattern Recognit. Image Anal. 2021, 31, 271–284. [Google Scholar] [CrossRef]
  9. Niu, Y.; Li, Z.; Fan, Y. Analysis of truck drivers’ unsafe driving behaviors using four machine learning methods. Int. J. Ind. Ergon. 2021, 86, 103192. [Google Scholar] [CrossRef]
  10. Bobick, A.F.; Davis, J.W. The recognition of human movement using temporal templates. IEEE Trans. Pattern Anal. Mach. Intell. 2001, 23, 257–267. [Google Scholar] [CrossRef]
  11. Yang, X.; Tian, Y. Effective 3D action recognition using eigenjoints. J. Vis. Commun. Image Represent. 2014, 25, 2–11. [Google Scholar] [CrossRef]
  12. Willems, G.; Tuytelaars, T.; Van Gool, L. An Efficient Dense and Scale-Invariant Spatio-Temporal Interest Point Detector. In Proceedings of the Computer Vision—ECCV 2008, Proceedings of the European Conference on Computer Vision, Marseille, France, 12–18 October 2008; Lecture Notes in Computer, Science. Forsyth, D., Torr, P., Zisserman, A., Eds.; Springer: Berlin/Heidelberg, Germany, 2008; Volume 5303, pp. 650–663. [Google Scholar] [CrossRef]
  13. Wang, H.; Ullah, M.M.; Klaser, A.; Laptev, I.; Schmid, C. Evaluation of Local Spatio-Temporal Features for Action Recognition. In Proceedings of the BMVC 2009—British Machine Vision Conference, London, UK, 7–10 September 2009; BMVA Press: London, UK, 2009; pp. 124.1–124.11. [Google Scholar]
  14. Wang, H.; Kläser, A.; Schmid, C.; Liu, C.L. Action Recognition by Dense Trajectories. In Proceedings of the CVPR 2011, Colorado Springs, CO, USA, 20–25 June 2011; IEEE: New York, NY, USA, 2011; pp. 3169–3176. [Google Scholar] [CrossRef]
  15. Wang, H.; Schmid, C. Action Recognition with Improved Trajectories. In Proceedings of the 2013 IEEE International Conference on Computer Vision (ICCV 2013), Sydney, Australia, 1–8 December 2013; IEEE: New York, NY, USA, 2013; pp. 3551–3558. [Google Scholar] [CrossRef]
  16. Gao, Z.; Zhang, Y.; Zhang, H.; Xue, Y.B.; Xu, G.P. Multi-Dimensional Human Action Recognition Model Based on Image Set and Group Sparsity. Neurocomputing 2016, 215, 138–149. [Google Scholar] [CrossRef]
  17. Uddin, M.A.; Joolee, J.B.; Alam, A.; Lee, Y.-K. Human Action Recognition Using Adaptive Local Motion Descriptor in Spark. IEEE Access 2017, 5, 21157–21167. [Google Scholar] [CrossRef]
  18. Weng, Z.; Guan, Y. Action Recognition Using Length-Variable Edge Trajectory and Spatio-Temporal Motion Skeleton Descriptor. EURASIP J. Image Video Process. 2018, 2018, 8. [Google Scholar] [CrossRef]
  19. Aurangzeb, K.; Haider, I.; Khan, M.A.; Saba, T.; Javed, K.; Iqbal, T.; Sarfraz, M.S. Human Behavior Analysis Based on Multi-Types Features Fusion and Von Nauman Entropy Based Features Reduction. J. Med. Imaging Health Inform. 2019, 9, 662–669. [Google Scholar] [CrossRef]
  20. Franco, A.; Magnani, A.; Maio, D. A Multimodal Approach for Human Activity Recognition Based on Skeleton and RGB Data. Pattern Recognit. Lett. 2020, 131, 293–299. [Google Scholar] [CrossRef]
  21. Simonyan, K.; Zisserman, A. Two-Stream Convolutional Networks for Action Recognition in Videos. In Proceedings of the 27th International Conference on Neural Information Processing Systems (NIPS 2014), Montreal, QC, Canada, 8–13 December 2014; MIT Press: Cambridge, MA, USA, 2014; pp. 568–576. Available online: https://dl.acm.org/doi/10.5555/2968826.2968890 (accessed on 20 September 2024).
  22. Ji, S.; Xu, W.; Yang, M.; Yu, K. 3D convolutional neural networks for human action recognition. IEEE Trans. Pattern Anal. Mach. Intell. 2013, 35, 221–231. [Google Scholar] [CrossRef]
  23. Kondratyuk, D.; Yuan, L.; Li, Y.; Zhang, L.; Tan, M.; Brown, M.; Gong, B. MoViNets: Mobile Video Networks for Efficient Video Recognition. In Proceedings of the 2021 IEEE/CVF Conference on Computer Vision and Pattern Recognition (CVPR), Nashville, TN, USA, 20–25 June 2021; IEEE: New York, NY, USA, 2021; pp. 16015–16025. [Google Scholar] [CrossRef]
  24. Wang, L.; Xie, S.; Li, Y.; Zeng, W.; Zhang, S.; Li, Z. Temporal Segment Networks: Towards Good Practices for Deep Action Recognition. In Proceedings of the Computer Vision—ECCV 2016, Proceedings of the European Conference on Computer Vision (ECCV), Amsterdam, The Netherlands, 11–14 October 2016; Lecture Notes in Computer, Science. Leibe, B., Matas, J., Sebe, N., Welling, M., Eds.; Springer: Cham, Switzerland, 2016; Volume 9912, pp. 20–36. [Google Scholar] [CrossRef]
  25. Donahue, J.; Hendricks, L.A.; Rohrbach, M.; Venugopalan, S.; Guadarrama, S.; Saenko, K.; Darrell, T. Long-Term Recurrent Convolutional Networks for Visual Recognition and Description. IEEE Trans. Pattern Anal. Mach. Intell. 2017, 39, 677–691. [Google Scholar] [CrossRef]
  26. Harvard Department of Chemistry and Chemical Biology. Laboratory Safety Manual. Available online: https://www.chemistry.harvard.edu/files/chemistry/files/2012_1_9_safetymanual.pdf (accessed on 20 September 2024).
  27. Tsinghua University, National Experimental Teaching Demonstration Center of Life Sciences. Regulations for the Management of Large-Scale Instruments. Available online: https://www.biolab.tsinghua.edu.cn/index.php?m=content&c=index&a=show&catid=20&id=22 (accessed on 20 September 2024).
  28. Anhui Jianzhu University. Laboratory Safety Manual. Available online: https://www.ahjzu.edu.cn/_upload/article/files/09/81/ed55a85142b7be4cb8efcdd0249e/7711bbe8-0b1d-48c5-870a-c46b44da126b.pdf (accessed on 20 September 2024).
  29. East China University of Science and Technology. Laboratory Safety and Environmental Protection Management Regulations. Available online: https://hgxy.ecust.edu.cn/2016/0509/c1176a6612/page.htm (accessed on 20 September 2024).
  30. Abu-Siniyeh, A.; Al-Shehri, S.S. Safety in medical laboratories: Perception and practice of university students and laboratory workers. Appl. Biosaf. 2021, 26, S34–S42. [Google Scholar] [CrossRef]
  31. Al-Zyoud, W.; Qunies, A.M.; Walters, A.U.; Jalsa, N.K. Perceptions of chemical safety in laboratories. Safety 2019, 5, 21. [Google Scholar] [CrossRef]
  32. Osokin, D. Real-time 2D Multi-Person Pose Estimation on CPU: Lightweight OpenPose. In Proceedings of the 8th International Conference on Pattern Recognition Applications and Methods (ICPRAM), Prague, Czech Republic, 19–21 February 2019; SciTePress: Setúbal, Portugal, 2019; pp. 744–748. [Google Scholar] [CrossRef]
  33. Cao, Z.; Simon, T.; Wei, S.-E.; Sheikh, Y. Realtime Multi-person 2D Pose Estimation Using Part Affinity Fields. In Proceedings of the 2017 IEEE Conference on Computer Vision and Pattern Recognition (CVPR), Honolulu, HI, USA, 21–26 July 2017; IEEE: Piscataway, NJ, USA, 2017; pp. 1302–1310. [Google Scholar] [CrossRef]
  34. Zhang, X.; Xie, Q.; Sun, W.; Ren, Y.; Mukherjee, M. Dense Spatial-Temporal Graph Convolutional Network Based on Lightweight OpenPose for Detecting Falls. Comput. Mater. Contin. 2023, 77, 47–61. [Google Scholar] [CrossRef]
  35. Chen, P.; Shen, Q. Research on Table Tennis Swing Recognition Based on Lightweight OpenPose. In Proceedings of the 2023 16th International Conference on Advanced Computer Theory and Engineering (ICACTE), Hefei, China, 15–17 September 2023; pp. 207–212. [Google Scholar] [CrossRef]
  36. Lee, M.-F.R.; Chen, Y.-C.; Tsai, C.-Y. Deep Learning-Based Human Body Posture Recognition and Tracking for Unmanned Aerial Vehicles. Processes 2022, 10, 2295. [Google Scholar] [CrossRef]
  37. Howard, A.G.; Zhu, M.; Chen, B.; Kalenichenko, D.; Wang, W.; Wu, Y.; Yang, M.; Liao, R.; Szegedy, C. MobileNets: Efficient convolutional neural networks for mobile vision applications. arXiv 2017, arXiv:1704.04861. [Google Scholar] [CrossRef]
  38. Redmon, J.; Divvala, S.; Girshick, R.; Farhadi, A. You Only Look Once: Unified, Real-Time Object Detection. In Proceedings of the 2016 IEEE Conference on Computer Vision and Pattern Recognition (CVPR), Las Vegas, NV, USA, 27–30 June 2016; IEEE: Piscataway, NJ, USA, 2016; pp. 779–788. [Google Scholar] [CrossRef]
  39. Jiang, L.; Liu, H.; Zhu, H.; Zhang, G. Improved YOLO v5 with Balanced Feature Pyramid and Attention Module for Traffic Sign Detection. MATEC Web Conf. 2022, 355, 03023. [Google Scholar] [CrossRef]
  40. Fang, C.; Yang, Y.; Wang, Y.; Chen, W. Research on real-time detection of safety harness wearing of workshop personnel based on YOLOv5 and OpenPose. Sustainability 2022, 14, 5872. [Google Scholar] [CrossRef]
  41. Wang, Z.; Li, Y.; Chen, Y.; Li, C.; Zhao, L. Smoking behavior detection algorithm based on YOLOv8-MNC. Front. Comput. Neurosci. 2023, 17, 1243779. [Google Scholar] [CrossRef]
  42. Hopfield, J.J. Neural networks and physical systems with emergent collective computational abilities. Proc. Natl. Acad. Sci. USA 1982, 79, 2554–2558. [Google Scholar] [CrossRef]
  43. Hochreiter, S.; Schmidhuber, J. Long short-term memory. Neural Comput. 1997, 9, 1735–1780. [Google Scholar] [CrossRef]
  44. Wojke, N.; Bewley, A.; Paulus, D. Simple Online and Realtime Tracking with a Deep Association Metric. In Proceedings of the 2017 IEEE International Conference on Image Processing (ICIP), Beijing, China, 17–20 September 2017; IEEE: New York, NY, USA, 2017; pp. 3645–3649. [Google Scholar] [CrossRef]
  45. Yang, D.; Miao, C.; Liu, Y.; Wang, Y.; Zheng, Y. Improved foreign object tracking algorithm in coal for belt conveyor gangue selection robot with YOLOv7 and DeepSORT. Measurement 2024, 228, 114180. [Google Scholar] [CrossRef]
  46. Gandhi, R. UAV Object Detection and Tracking in Video Using YOLOv3 and DeepSORT. In Proceedings of the 2024 International Conference on Emerging Technologies in Computer Science for Interdisciplinary Applications (ICETCS), Bengaluru, India, 22–23 April 2024; IEEE: New York, NY, USA, 2024; pp. 1–6. [Google Scholar] [CrossRef]
  47. Kibet, D.; Shin, J.-H. Counting Abalone with High Precision Using YOLOv3 and DeepSORT. Processes 2023, 11, 2351. [Google Scholar] [CrossRef]
  48. Liu, Z.; Wang, L.; Liu, Z.; Wang, X.; Hu, C.; Xing, J. Detection of Cotton Seed Damage Based on Improved YOLOv5. Processes 2023, 11, 2682. [Google Scholar] [CrossRef]
  49. Paszke, A.; Gross, S.; Massa, F.; Lerer, A.; Bradbury, J.; Chanan, G.; Killeen, T.; Lin, Z.; Gimelshein, N.; Antiga, L.; et al. PyTorch: An Imperative Style, High-Performance Deep Learning Library. In Proceedings of the 33rd International Conference on Neural Information Processing Systems (NeurIPS), Red Hook, NY, USA, 8–14 December 2019; Curran Associates Inc.: Red Hook, NY, USA, 2019; pp. 1–12. Available online: https://dl.acm.org/doi/10.5555/3454287.3455008 (accessed on 20 September 2024).
Figure 1. Method flowchart.
Processes 12 02796 g001
Figure 2. Different types of chemical laboratory scenes: (a) Microbial chemical culture laboratory; (b) Chemical photocatalytic reaction laboratory; (c) Chemical engineering simulation operation training laboratory.
Processes 12 02796 g002
Figure 3. Various Behaviors of Chemical laboratory Personnel: (a) Sleeping (On Table); (b) Sleeping (Lying Down); (c) Eating; (d) Playing with a mobile phone (Sitting); (e) Playing with a mobile phone (Making a Call); (f) Playing with a mobile phone (Standing); (g) Normal (Performing Experiment); (h) Normal (Observing Equipment); (i) Normal (Reading).
Processes 12 02796 g003
Figure 4. Lightweight OpenPose network structure diagram.
Processes 12 02796 g004
Figure 5. Human skeletal keypoints.
Processes 12 02796 g005
Figure 6. High similarity behaviors (a) Playing with a mobile phone; (b) Reading a book.
Processes 12 02796 g006
Figure 7. YOLOv5 structure diagram.
Processes 12 02796 g007
Figure 8. An LSTM network unit.
Processes 12 02796 g008
Figure 9. The structure of the SKPT-LSTM network.
Processes 12 02796 g009
Figure 10. Improved DeepSORT algorithm.
Processes 12 02796 g010
Figure 11. Key point detection results for various behaviors: (a) Sleeping; (b) Eating; (c) Using Phone; (d) Normal.
Processes 12 02796 g011
Figure 12. Evaluation of the YOLOv5-s model.
Processes 12 02796 g012
Figure 13. Integrated DeepSORT algorithm for tracking human poses and mobile phone objects. (af) Tracking of a behavior sample, showing results every 25 frames.
Processes 12 02796 g013
Figure 14. Training loss and accuracy variation curves during training process.
Processes 12 02796 g014
Figure 15. Confusion matrix of SKPT-LSTM.
Processes 12 02796 g015
Figure 16. Improved DeepSORT algorithm identifies various behaviors of laboratory personnel: (a) Eating; (b) Sleeping (Desk Rest); (c) Sleeping (Chair Lean); (d) Phone Use (Sit); (e) Phone Use (Call); (f) Phone Use (Stand); (g) Normal (Experiment); (h) Normal (Walk); (i) Normal (Read).
Processes 12 02796 g016
Figure 17. Confusion matrix (a) SKPT-LSTM; (b) Conv2D; (c) RNN; (d) LSTM.
Processes 12 02796 g017
Figure 18. Flowchart of real-world application.
Processes 12 02796 g018
Figure 19. Single target behavior recognition results: (a) Playing with a mobile phone; (b) Sleeping Behavior; (c) Eating Behavior; (d) Normal (Experimenting) Behavior.
Processes 12 02796 g019
Figure 20. Multiple target behavior recognition: (a) Sleeping Behavior and Normal (Experimenting) Behavior; (b) Sleeping Behavior and Playing with a Mobile Phone Behavior; (c) Normal Behavior and Playing with a Mobile Phone Behavior; (d) Normal Behavior and Normal Behavior.
Processes 12 02796 g020
Figure 21. Interference recognition of laboratory personnel: (a) Before Personnel Interference; (b) During Interference Process; (c) Just After Interference Ends; (d) Behavior Recognition After Interference Ends.
Processes 12 02796 g021
Table 1. Summary of participant information.
Participant IDGenderAge (Years)Height (cm)Weight (kg)Health StatusMedical Conditions Affecting Experiment Results
Participant 1Male2217365HealthyNone
Participant 2Male2718080HealthyNone
Participant 3Male2516870HealthyNone
Participant 4Male3417575HealthyNone
Participant 5Female2316555HealthyNone
Participant 6Female2516050HealthyNone
Participant 7Male1917765HealthyNone
Participant 8Male2618590HealthyNone
Participant 9Female3315560HealthyNone
Participant 10Female2614945HealthyNone
Participant 11Female2717360HealthyNone
Participant 12Male2316055HealthyNone
Table 2. Summary of Behavioral Data Collection.
Participant IDSleeping (Desk Rest)Sleeping (Chair Lean)Phone Use (Sit)Phone Use (Stand)Phone Use (Call)EatNormal (Read)Normal (Experiment)Normal (Walk)Total
Participant 125 (33)24 (31)27 (34)29 (18)23 (21)25 (20)27 (31)26 (27)18 (19)224 (234)
Participant 222 (37)23 (32)25 (32)22 (20)23 (20)23 (20)21 (26)18 (28)17 (13)194 (228)
Participant 322 (38)25 (33)24 (32)24 (20)12 (17)20 (18)28 (29)25 (25)16 (22)196 (234)
Participant 423 (40)22 (22)30 (35)30 (15)30 (17)21 (15)32 (32)36 (33)15 (31)239 (240)
Participant 524 (36)25 (26)26 (37)34 (13)29 (17)21 (18)22 (34)23 (30)24 (19)228 (230)
Participant 624 (36)22 (26)29 (33)26 (16)20 (28)15 (17)26 (29)25 (34)18 (13)205 (232)
Participant 724 (32)23 (30)27 (34)28 (18)22 (21)25 (20)27 (30)25 (27)18 (19)219 (231)
Participant 821 (37)22 (31)24 (32)22 (19)22 (20)22 (19)20 (26)18 (28)16 (13)187 (225)
Participant 922 (37)24 (33)24 (33)23 (19)12 (17)20 (17)28 (29)25 (24)15 (21)193 (230)
Participant 1023 (40)21 (22)29 (35)30 (14)30 (17)21 (15)31 (32)35 (33)15 (31)235 (239)
Participant 1124 (36)25 (25)26 (37)33 (13)28 (16)21 (17)22 (34)22 (30)23 (18)224 (226)
Participant 1223 (36)22 (26)29 (33)27 (16)20 (28)15 (18)26 (29)24 (34)17 (12)203 (232)
Total277 (438)278 (337)320 (407)328 (201)271 (239)249 (214)310 (361)302 (353)212 (231)2547 (2781)
Table 3. Confusion matrix.
PredictionPositiveNegative
Actual
PositiveTrue Positive(TP)False Negative(FN)
NegativeFalse Positive(FP)True Negative(TN)
Table 4. Coordinates and confidence scores of key points of the “sleep” behavior.
Keypoints IDXYConfidenceBehavioral Pictures
1150690.755Processes 12 02796 i001
2133420.872
3176560.443
4206890.214
51631020.694
62561150.872
7209660.583
8741750.722
91991880.881
101663000.900
111172340.622
122522670.848
132033600.702
16206490.729
17209850.638
Table 5. Evaluation results of the SKPT-LSTM model for each behavior.
MetricsPrecisionRecallF1 Score
Behavior
Sleeping (Chair Leaning) 94.97%97.93%0.9643
Sleeping (Desk Resting)96.07%95.53%0.9580
Eating88.34%73.39%0.8017
Phone Use (Sit)83.33%88.76%0.8596
Phone Use (Stand)85.31%91.73%0.8840
Phone Use (Call)92.77%61.60%0.7404
Normal (Read)87.38%95.24%0.9114
Normal (Experiment)85.88%89.94%0.8786
Normal (Move)75.21%83.49%0.7913
Average87.70%86.40%0.8654
Table 6. Performance comparison of four networks.
MetricsAccuracyAverage PrecisionAverage RecallF1 ScorePS
Model
Conv2D59.14%63.66%47.94%0.5469119.82
RNN69.64%68.95%62.57%0.656081.79
LSTM70.22%67.21%61.40%0.641778.84
SKPT-LSTM87.99%87.70%86.40%0.865420.96
Table 7. Network performance table under different angle dataset training.
MetricsAccuracyAverage PrecisionAverage RecallF1 Score
Angle
Eye level87.28%86.42%83.35%0.8486
Overlook84.63%85.38%82.24%0.8378
Table 8. Behavior recognition algorithm performance comparison table.
MetricsAccuracyAverage PrecisionAverage RecallF1 ScoreParameters (M)Multi-Target SuitabilitySFPSMFPS
Algorithm
C3D89.96%89.40%86.84%0.88178.03NO
R3D76.67%76.81%74.68%0.757333.18NO
Proposed Method87.99%87.70%86.40%0.87024.86Yes17.0314.42
Table 9. Improved DeepSORT algorithm for each behavior recognition index after category simplification.
MetricsAccuracyPrecisionRecallF1 Score
Behavior
Eating92.45%88.35%73.39%0.8018
Sleeping97.35%98.66%0.98
Playing with phone94.33%89.70%0.9196
Normal88.10%95.07%0.9145
Average92.03%89.21%0.9040
Disclaimer/Publisher’s Note: The statements, opinions and data contained in all publications are solely those of the individual author(s) and contributor(s) and not of MDPI and/or the editor(s). MDPI and/or the editor(s) disclaim responsibility for any injury to people or property resulting from any ideas, methods, instructions or products referred to in the content.

