Article

Pre-Commercial Demonstration of a Photosynthetic Upgrading Plant: Investment and Operating Cost Analysis

by
César Ruiz Palomar
1,2,
Alfonso García Álvaro
1,2,*,
Raúl Muñoz
2,3,
Carlos Repáraz
4,
Marcelo F. Ortega
5 and
Ignacio de Godos
1,2,*
1
Department of Chemical Engineering and Environmental Technology, University of Valladolid, Campus Duques de Soria, s/n, 42004 Soria, Spain
2
Institute of Sustainable Processes, University of Valladolid, Dr. Mergelina, s/n, 47011 Valladolid, Spain
3
Department of Chemical Engineering and Environmental Technology, University of Valladolid, Dr. Mergelina, s/n, 47011 Valladolid, Spain
4
NTT DATA Europe & Latam Green Engineering S.L.U., Camino de la Fuente de la Mora, 1, Hortaleza, 28050 Madrid, Spain
5
Department of Energy and Fuels, Higher Technical School of Mining and Energy Engineers, Polytechnic University of Madrid, Ríos Rosas, 21, 28003 Madrid, Spain
*
Authors to whom correspondence should be addressed.
Processes 2024, 12(12), 2794; https://doi.org/10.3390/pr12122794
Submission received: 9 October 2024 / Revised: 27 November 2024 / Accepted: 3 December 2024 / Published: 7 December 2024
(This article belongs to the Special Issue Processes in Biofuel Production and Biomass Valorization)

Abstract

Pig farms have been identified as one of the most important sources of greenhouse gas emissions. This study demonstrates the production of vehicle biomethane in a demonstration prototype plant based on photosynthetic upgrading technology, where the CO2 and H2S present in biogas are consumed by a microalgae culture. The information collected during the prototype construction allowed for an assessment of the capital and operating costs of this novel biogas upgrading technology with other conventional systems. With this objective, the costs of the equipment comprising the biogas cleaning and purification system were calculated considering a biogas flow rate of 5 m3 h−1, corresponding to a small–medium biogas plant and an average pig farm size. The sustainability and competitiveness of the algae upgrading system and the low capital and operating costs vis à vis other upgrading technologies were proven. With a net energy production of 687 kWh day−1 and an annual profit of €30,348 in a 3500 head pig farm, this technology can be easily installed in livestock farms, increasing the benefits and reducing the carbon footprint.

1. Introduction

The production of biogas plays a crucial role in the transition to a carbon-free economy. The anaerobic digestion of organic waste reduces greenhouse gas (GHG) emissions and provides a clean energy source in the form of renewable natural gas. The agricultural waste poses the potential to lead this transformation due to their high availability and widespread production [1]. Livestock manure can easily be transformed into biogas in low-cost digesters without large investment requirements. Raw biogas obtained in digesters can be used for heat or electricity production. A further step in the decarbonization involves the transformation of the biogas into biomethane (compatible with natural gas applications). Therefore, a purification step is needed. The biogas obtained from the digestion of swine manure usually contains the following compounds expressed in volume percentages—CH4 (40–70%), CO2 (35–55%), H2S (0.1–3%), O2 (0–0.5%), N2 (0–1%)—and a small amount of moisture and other trace gases [2,3,4,5]. The regulations for biomethane applications (grid injection or vehicle use) restrict the concentration of sulfur compounds, oxygen and water; additionally, a minimum concentration of methane is required to reach the adequate calorific value [6]. The upgrading process involves the removal of CO2 and H2S from the biogas. Different upgrading methods, based on physical–chemical processes are commercially available: adsorption, absorption, membrane separation and chemical and cryogenic separation [7,8]. Although biogas upgrading technologies have reached a high level of maturity, most of the systems are only accessible for large-scale use. In this context, the development of low-cost upgrading technologies with minimum capital and operation investment is receiving increasing attention [9]. Among the alternatives proposed, biological processes that allow for carbon dioxide and hydrogen sulphide removal have been demonstrated at different scales (from laboratory scale to pre-commercial pilot units). Biological filtration (biotrickling), microaerophilic anaerobic digestion, hydrogenotrophic reduction of CO2 to CH4 and photosynthetic systems have been reported as doable options [10,11,12].
The biological upgrading process with microalgae has advantages over other conventional systems, since it allows the simultaneous elimination of undesirable compounds from biogas, CO2 and H2S, with the fixation of the carbon into algae biomass. This process also allows for treatment of the anaerobic digestion subproduct (named digestate), which still has a high nutrient content. Another benefit lies in the low energy consumption, since the main source of energy for CO2 and H2S consumption comes from the sunlight. [2,13,14]. The most common photosynthetic upgrading system is formed by an absorption column [15] and a High-Rate Algal Pond (HRAP) reactor type [13,16,17]. This reactor is a shallow pond with continuous recirculation where microalgae grow using the carbon provided by biogas and the nutrients present in digestate. The biogas is cleaned in the absorption column where CO2 and H2S are dissolved in the microalgae culture broth which is pumped from the HRAP. This algae culture broth usually presents a high pH level of 9.5–10.5, favoring CO2 absorption [13]. The final gas has a methane content greater than 90% and trace concentrations of sulfur components [9,18,19,20]. This biomethane, once compressed, can be used in agricultural vehicles, tractors or cargo vehicles used in agricultural tasks. In such a way, farmers could be final users of the energy generated in the process. This decentralized concept of bioenergy generation in the form of gaseous biofuel for its final use in agricultural mobility increases the economic return of livestock activity, promoting the circular economy and reducing the environmental impact [9,13,21,22,23]. Although photosynthetic upgrading systems have been tested at different scales, to the best of the authors’ knowledge, industrial-scale systems have not been previously reported. Consequently, the investment and operational costs of this technology have not been documented using an evidence-based approach.
In this study, the installation and operational costs of a large-scale photosynthetic upgrading biomethane plant were evaluated and compared with the expenses of commercially available technologies. On the one hand, the investment costs were analyzed based on the biogas processing capacity, and on the other hand, the operational cost was considered and compared with other systems. Data required for this evaluation, such as equipment cost, civil works or electricity consumption, among others, were collected during the construction and operation of a prototype plant. This facility is located in a swine farm and developed under a collaborative project focused on the demonstration of vehicle biomethane production [24]. Evidence of prices and consumables was documented throughout two years of operation, proving the robustness of the proposed upgrading system study.

2. Materials and Methods

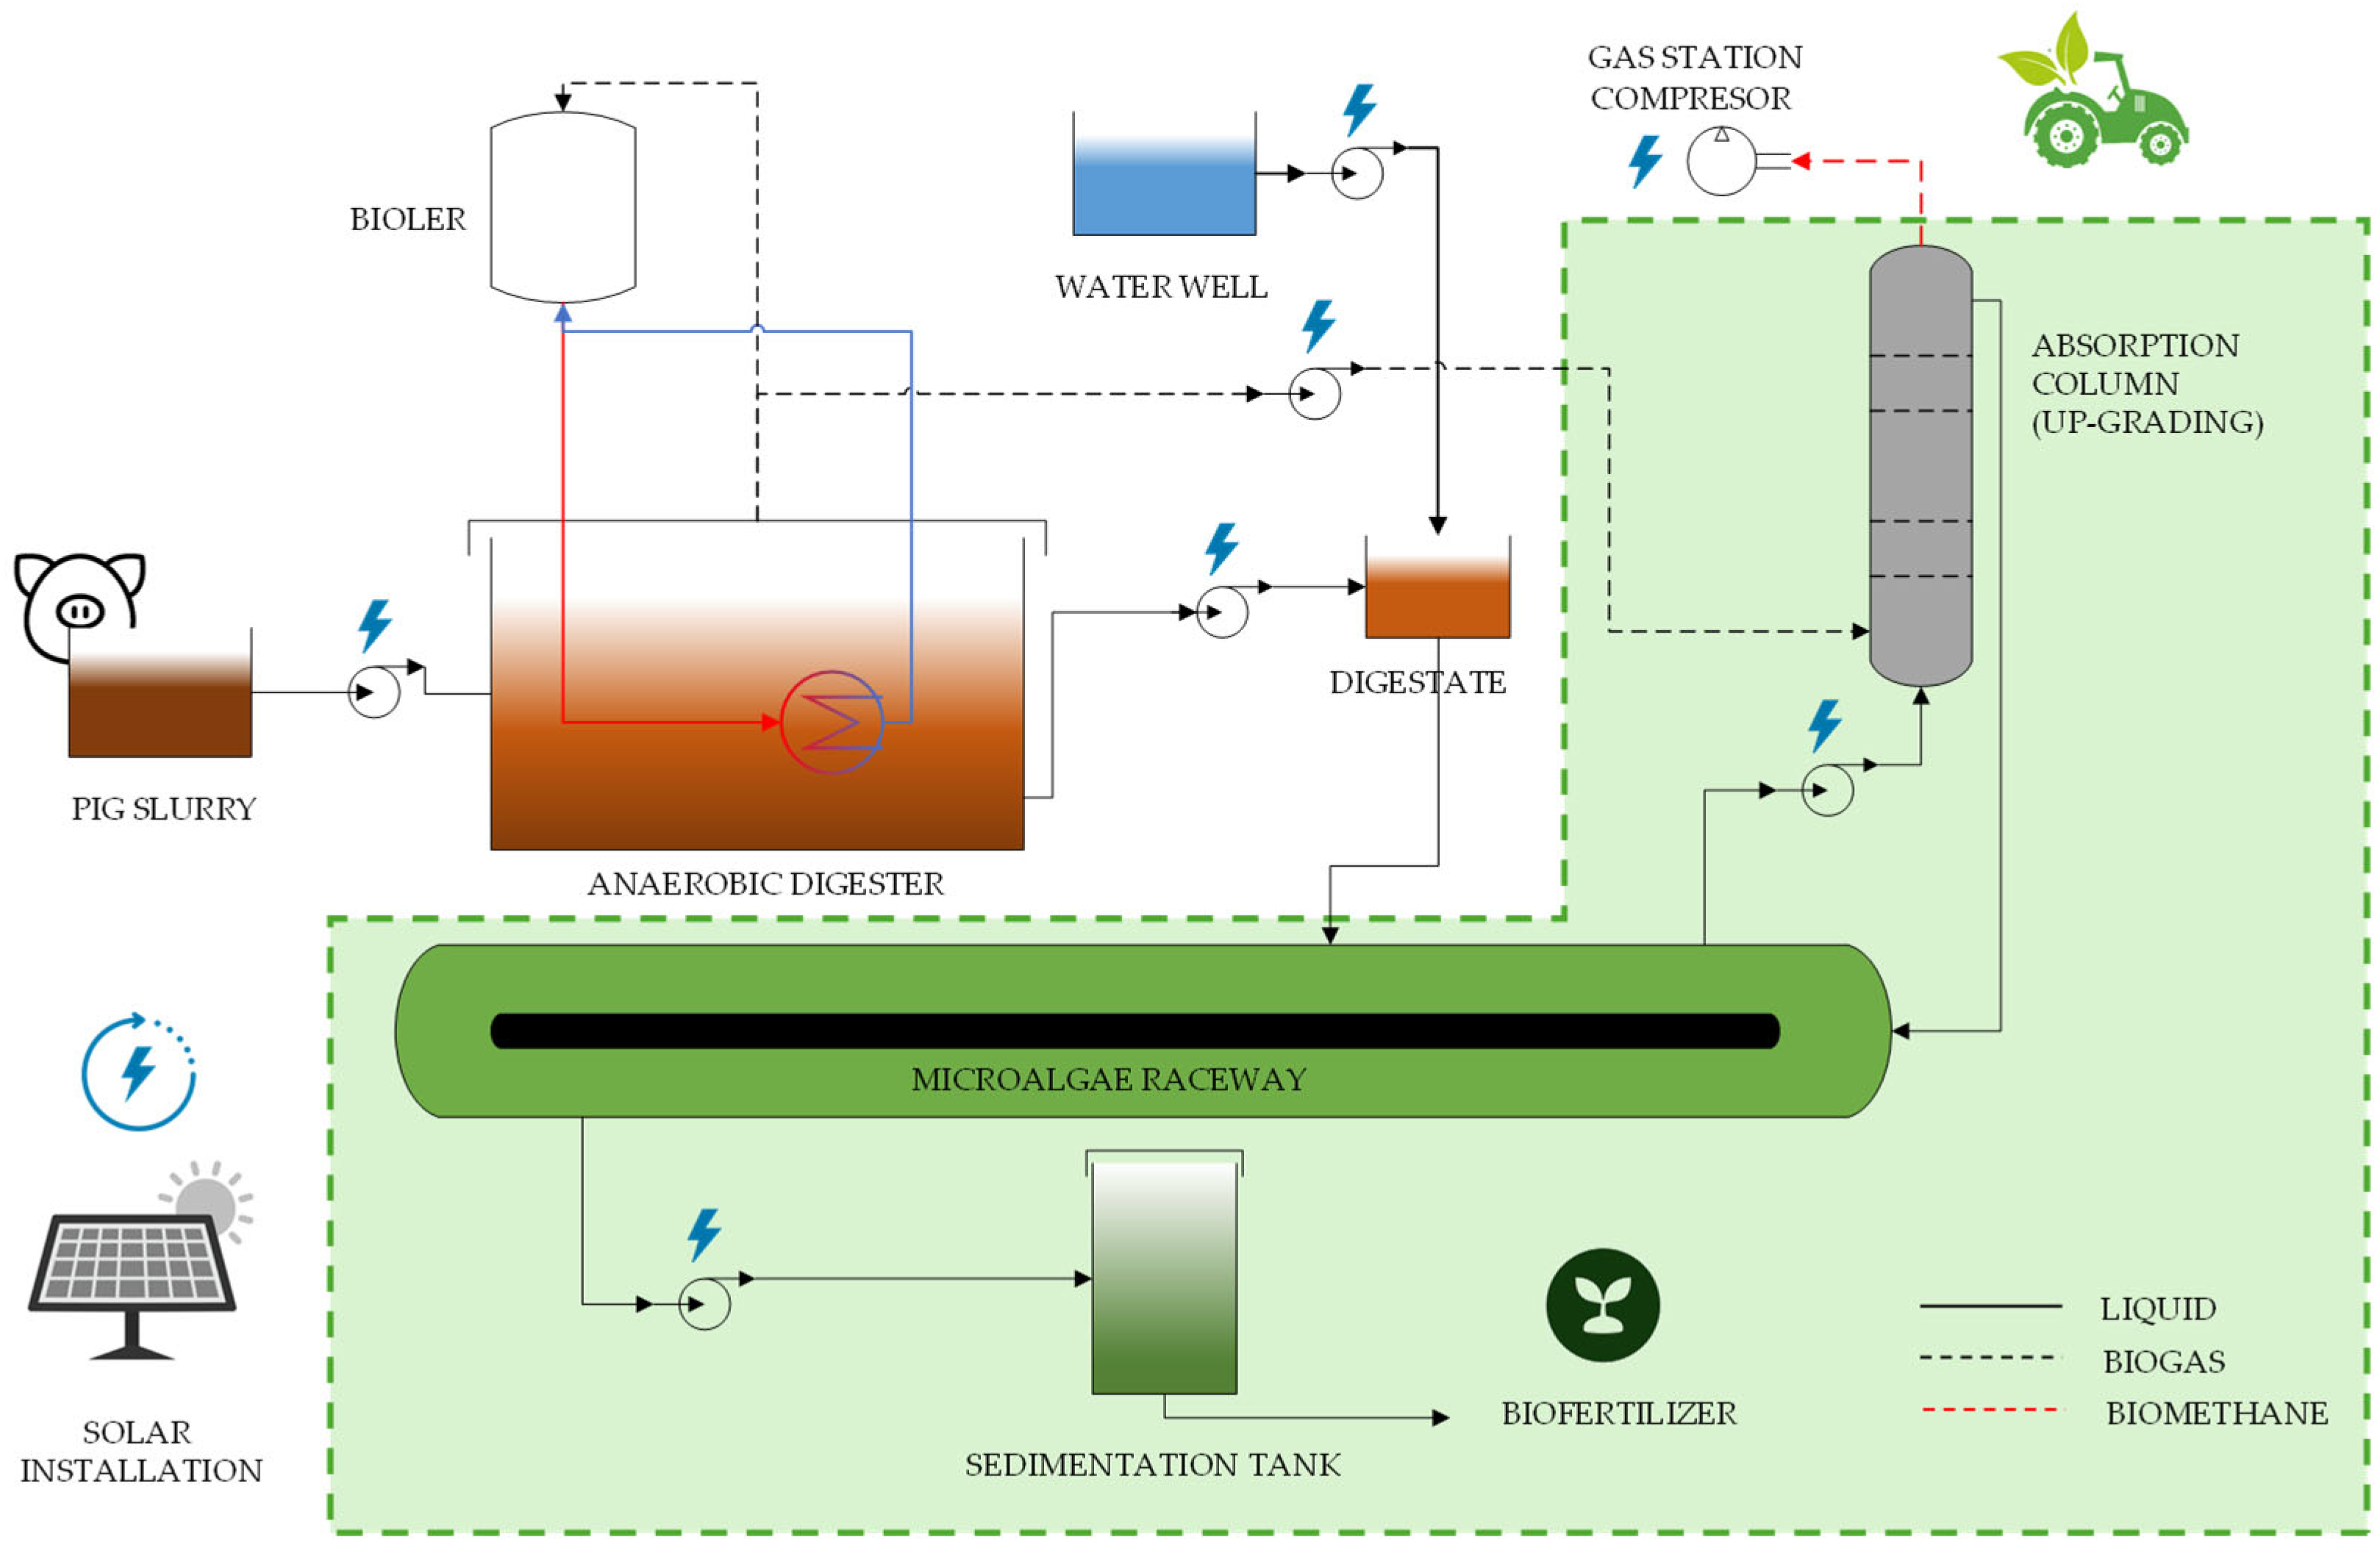
2.1. Biomethane Plant Description

The research was developed in a biomethane plant located in Sauquillo de Boñices (Soria, Spain) in a 3500-head pig farm. This plant is part of “LIFE Smart Agromoblity” project www.lifesmartagromobility.eu (accessed on 4 December 2024), with the goal of producing vehicle biomethane using swine manure as organic substrate in an anaerobic digestion process followed by a photosynthetic upgrading system. The prototype contains all the necessary equipment for biogas production, subsequent transformation into biomethane and compression and refueling for final use as CNG (Compressed Natural Gas) in vehicles. Figure 1 shows the process flow diagram.
The process started with an anaerobic digestion in a bag-type digester [25] with a capacity of 150 m3 volume, installed in a ground shallow pit (1 m depth). This digester was operated in the psychrophilic range (0–35 °C) and fed with swine manure from the pig farm [26,27]. The hydraulic residence time (HRT) applied was 40 days [28]. The design makes the construction simple and results in low-cost installation. The biogas produced directly from the anaerobic digester was continuously counted by a gas flow meter (VA-570 ATEX, CS Instruments, Tannheim, Germany). At this point, it must be mentioned that biogas production materials (digester) were not included in the capital or operational evaluation herein reported, which was limited to the upgrading system as seen in green in Figure 1.

Upgrading Facilities

The biogas went through an upgrading system involving the biological consumption of CO2 and H2S. This process was carried out in a raceway-type microalgae growth lagoon (Figure 1). This lagoon was fed with the liquid effluent or digestate from the anaerobic digester diluted with well water to reduce the organic load and clarify the culture medium, thus ensuring light passage and favoring the growth of microalgae. The dissolution of CO2 and H2S was achieved by means of an absorption column where the microalgae were brought into contact with the biogas from the digester. This column was operated by a controlled biogas compressor and a liquid pump that guaranteed maximum dissolution of unwanted components and minimum methane losses. Biogas was fed into the column by a Lubricated vane compressor (GC6 ATEX 2G, General Europe Vacum, Buccinasco, Italy), with a variable flow rate between 1 and 25 m3 h−1. On the other hand, a helicoidal positive displacement pump (EZstrip MK3 Monobloc, MONO, Manchester, UK) introduced the liquid inside the column. This pump was equipped with a frequency inverter (ATV320 U22N4C, Schneider electric, Paris, France) to control the liquid flow rate between 1 and 12 m3 h−1. In this way, a liquid–gas ratio (L/G) equal to 1 was achieved following the operational conditions reported by Marín and Toledo-Cervantes et al. [15,20]. The resulting biomethane was passed through silica gel filters 2–4 mm orange (CAS: 7631-86-9, Synthetika, Łódź, Poland) for removal of H2S traces and moisture in the biomethane. In this way, biomethane was made suitable for being compressed, and a small gas station served to dispense the biofuel into agricultural vehicles.

2.2. Equipment Costs

The equipment costs considered were based on the LIFE Smart Agromobility experience. In this sense, during the design and construction phase of the project, budgets for each equipment and service were requested at different scales from various local providers. This information was collected and applied as specific coefficients for the calculations of the overall upgrading system cost. These coefficients were estimated as a result of the material and services needed for each equipment. In the case of motors and pumps, the flow ranges were considered to optimize the selection. The case study prototype was defined with the factor scale 1, and different levels were considered regarding the possible size of the swine farms (from 0.5 to 10) (Table 1). In this approach, the minimum number of heads was 500 and maximum was 10,000, according to the reported capacity of these kinds of facilities [29].
The technology for biogas upgrading through the photosynthetic activity of microalgae has been studied at laboratory scale and outdoor small-scale prototypes in recent years [2,9,39,40,41,42]. The biomethane plant herein described is the first industrial-scale demonstration with the final use of biomethane as biofuel. To compare the investment costs with other industrial-scale biogas cleaning technologies, capital cost was related with the raw biogas processing capacity of the demonstration plant. In Figure 2, each equipment is represented with pictures.

2.2.1. The Absorption Column

The absorption column (see Figure 2(1)) consists of a PVC column 4 meters in height and 0.5 meters in diameter. A teflon diffuser was placed in the bottom of the column. These kinds of diffusers are commonly utilized in environmental applications requiring aeration [18] (Figure 2(1)). In addition, the column was equipped with a biomethane sensor (CO2, H2S, CH4 and N2) and a continuous electrochemical analyzer (INCA Multitec® BioControl, Sewerin, Gütersloh, Germany,). A medium scale factor (0.7–5) was considered for this unit, since the price of this equipment depends mainly on the construction costs rather than on the amount of material used. At this point, it must be noted that a column with these characterizes can easily be adapted for a wide range of biogas flows to be treated between 0 and 50 m3 h−1 biogas.

2.2.2. Microalgae Culture, High-Rate Algae Pond

The microalgae lagoon (see Figure 2(2)) was waterproofed with a 2 mm-thick insulating polymer to prevent leaks using HDPE geotextile polyethylene sheets UNE EN-13361/2-13491-13492/3-15382 [1] (Numapol HDPE Geomembrane, Numa Industrial, Barcelona, Spain, Vic). These are used in rafts for their waterproofing qualities and resistance to attack by chemical agents, UV rays, impact of acids or extreme temperatures. They have a life cycle of up to 20 years [43]. The layout of the lagoon is in the form of a carousel with an elongated gate (Figure 2(2)). The overall dimensions are 130 m long and 11 m wide, resulting in a total surface of 1405 m2 and an effective cultivation area of 1008 m2 and an effective volume of 320 m3. A 1 m-thick central wall divides the lagoon into a channel with a homogeneous surface. The construction of the entire lagoon was carried out on compacted earth. A medium–high scaling factor (0.5–7) was applied, as the price depends on the m2 of construction and the transportation of heavy machinery to the construction site [32]. This factor was calculated based on projections and budgets collected during the engineering and construction phase.
In this channelized pond with semi-circular ends, flow deflectors (see Figure 2(2)) were installed at both ends to ensure that the flow remains uniform in all the curves, and in this way, the appearance of dead zones at the ends of the pond was reduced in the areas where the water flowed at a lower speed [44]. Dead zones are not ideal as they negatively affect mixing, allow solids to settle and cause unnecessary energy losses [43]. Each curve was equipped with two lines of concentric deflectors to guide the flow and facilitate the return of the liquid through the opposite channel. The deflectors are made of stainless-steel sheets, joined at the top by means of tensioners, made of steel profiles. A medium scale factor (0.6–6) was applied, as the price depends on the amount of material used and the construction.
For the movement of the liquid, necessary for the operation, the lagoon was equipped with a single wheel with 8 flat blades (see Figure 2(7)) since this is the most efficient method to produce water flow in the lagoon [43]. The total height of each blade was about 0.52 m, and the diameter of the paddle wheel was 1.04 m. The blades were made of stainless steel and fiberglass-reinforced plastic. The blades were supported on the shaft in such a way that they would not bend due to the pressure of the water during rotation. The motor (T 100 A 4 IEC, Cemp, Sabadell, Spain) that rotates the paddle wheel had a nominal power of 2.2 kW and was equipped with a frequency inverter to modulate its speed (ATV320 U22N4C, Schneider electric, Paris, France). This system guaranteed a liquid circulation speed between 0.15 and 0.5 m s−1 (linear speed). To calculate the costs of this equipment, a low scale factor (0.7–2) was applied, since for a channel width of 5 m or more, the same width of the paddle wheel was maintained and what was modified was the width of the channel. A low scale factor was applied to this equipment since the price remains constant from the sizing of the plant on the quadruple scale [43].

2.2.3. The Settler

For the algal biomass control and separation of microalgae from the effluent water [45], a conical decanter (Bupolsa, Burgos, Spain) (see Figure 2(3)) with a working capacity of 5 m3, with a total height of 3.51 m and a diameter of 1.62 m, was installed [46,47,48]. The slight material used in its construction was fiberglass for its resistance to corrosion. A medium–low scale factor (0.6–4) was used in this equipment, since the price does not depend as much on the size and use of materials as on the manufacturing costs [49].

2.2.4. The Mixing Tank

To mix the digestate from the swine manure anaerobic digestion with water, a mixing tank was used (Bupolsa, Burgos, Spain) (see Figure 2(4)). The dilution of digestate with water was at a ratio of 1:40 to achieve an adequate growth yield in the cultivation of microalgae [50,51]. By diluting the digestate, the turbidity was reduced, and the values of organic matter suitable for assimilation by microalgae were adjusted [52,53]. The tank had two inlets, one for water and one for digestate, at the top, and an outlet for diluted substrate at the bottom. This diluted substrate was pumped into the microalgae lagoon. This substrate provides the microalgae with the necessary nutrients for their growth. A medium–low scale factor (0.6–4) was used in this equipment, since the price is influenced less by the size and materials used and more by the manufacturing costs [49].

2.2.5. Pumping and Piping

A medium–low scaling factor (0.6–4) was applied for pump scaling, since there is no direct correlation between installation capacity and pump size. In this sense, adaptation of the flows or operational times of the pumps used on the prototype could cover installations of a higher capacity. Similarly, the price of the pumps of higher capacity does not present a linear correlation with the flow. Low scaling coefficients (0.7–1.5) are used to calculate electrification costs. The electrification equipment would be similar in a small-scale plant than in a larger one as the length of cables would be similar. The pipes (see Figure 2(5)) used in the construction of a photosynthetic upgrading plant are subjected to low pressure. Investment costs are low, using medium scaling coefficients (0.6–5). Therefore, the scaling of the biomethane plant slightly affects the cost of the pipes, since, when increasing the flows, the diameter of the pipes must be greater. The length of the pipes does not affect the price since similar lengths of pipe are used in the scale-up of the plant.

2.3. Operating Costs

After one year of operation, the costs derived from electricity consumption and consumable materials were quantified. Consumables were required for the biogas compressor (oil), biogas pretreatment (activated carbon) and biomethane drying (silica gel and activated carbon). The costs were calculated for a refining capacity of 5 m3 of biogas per hour (120 m3 per day), corresponding to medium-size farms. The energy consumption is expressed in kWh per m3 by dividing the total energy consumption in kWh per hour by the biogas upgrading capacity in m3 per hour. Operational costs are summarized in Table 2.

3. Results

3.1. Biogas and Biomethane Production

Figure 3a shows that the composition of CH4 in the biogas remained stable throughout the year, 69.3 ± 3.2%, with slight fluctuations in its composition. CO2 is more soluble than CH4 and showed slight variations due to temperature changes with an average composition of 30.4 ± 2.9%. These fluctuations in ambient temperature affect the solubility of gases in the microalgae culture broth: the lower the temperature, the higher the solubility. Summer conditions were characterized by a relatively lower methane content (67.9 ± 2.5%), while winter conditions resulted in a considerably higher methane content (71.6 ± 3.7%). Biogas contamination by air (N2 and O2) entering the digester was relatively null, with a composition of 1.38 ± 2.23% and 0.17 ± 0.10%, respectively. The H2S composition was very high throughout the year 4495 ± 1159 ppm due to the substrate used, pig slurry, which contains sulfates that are reduced during the anaerobic digestion to H2S.
The biomethane composition after the photosynthetic upgrading process is shown in Figure 3b. During the summer months, the system was more efficient due to higher photosynthetic activity. In winter, the biomethane quality was slightly lower because the N2 content dissolved in the microalgae culture was higher (6.51 ± 3.00%) than in summer (1.73 ± 0.62%), which caused part of this gas to be incorporated into the biomethane, reducing the biomethane quality during the winter period. This feature indicates that in summer, the biomethane obtained has a higher proportion of CH4 (94.04 ± 4.12%) than in winter (88.19 ± 5.56%).
Figure 4 illustrates the difference between the average annual composition of the biogas directly produced in the anaerobic digester and the outlet biomethane after the upgrading process in the absorption column. With an average biomethane production of 70 m3 per day, corresponding with 120 m3 of biogas, the prototype produces 710 kWh per day of energy in the form of gaseous biofuel suitable for a vehicle use [54]. According to the data obtained in the plant, the upgrading system achieves concentrations greater than 95% CH4, eliminating most of the CO2 and H2S, resulting in a biomethane compatible with the standard requirements for CNG vehicles [55,56].
According to the biomethane regulations for vehicular use [57], the concentration of siloxanes should not exceed 0.3 mg Siloxanes m−3 [58]. The analyzed biomethane presents a value of 0 in terms of siloxanes, because the substrate used in anaerobic digestion, pig slurry, does not contain contaminants such as silicones. As for ammonia, the regulations establish a limit of 10 mg of amines m−3. The concentration of ammonia in biogas is commonly between 0 and 200 mg NH3 m−3 [59,60]. The aqueous solubility of ammonia is very high (with a dimensionless Henry’s constant of 1462 at 25 °C), compared to other pollutants such as CO2 (0.83) and H2S (2.44), resulting in a total absorption of the NH3 present in the biogas during the upgrading process in the column [61,62]. Subsequently, once the ammonia is dissolved, it is transformed by means of an algae–bacteria consortium assimilated in algae biomass or oxidized to nitrite (NO2) and nitrate (NO3) [63,64].
When comparing photosynthetic upgrading technology with other technologies, it is observed that it is more economical (See Figure S3), and in terms of efficiency, photosynthetic upgrading achieves a wide range of CH4 concentration (90–98%) in the biomethane obtained, when compared to other technologies such as PSA (96–98%), membranes (96–98%), organic scrubbing (96–98.5%), chemical scrubbing (96–99%), water scrubbing (96–98%) and cryogenic separation (97–98%) [59,65].

3.2. Microalgae Biomass Production

Algal biomass production varied during the experimental period with marked higher productivities in summer and considerable low production in winter. However, in spite of the very low photosynthetic activity, even in the harsh conditions of winter, sufficient carbon dioxide and H2S were provided in the raceway system (See Figure S1). Considering the stoichiometry of photosynthesis, with 1.83 g of CO2 for 1 g of biomass and variable superficial productivities ranging between 10 and 30 g biomass m−2 d−1 [66], the algae lagoon provided assimilation ranging from 10 to 40 kg of CO2 per day, equivalent to 10 to 50 Nm3 of biogas treated. These biomass productivities are in the range of similar microalgae production systems placed in temperate climates [67].
In addition, to understand the robustness of the microalgal consortium in the microalgal pond, a study was conducted to measure the taxonomic relative abundance of microalgae in winter and summer. The top 10 taxa from the “Winter algae” and “Summer algae” samples were selected in the familiar taxonomic range to perform the bar plot of relative abundance distribution of taxa (See Figure S2). The most predominant microalgae correspond to the family Chlorellaceae with a relative abundance of more than 50%. Comparing the summer and winter periods, the difference is minimal, with a slight increase in the Aphelidea family. The digestate generated during anaerobic digestion provides sufficient nutrients for microalgae growth without the need for additional nutrient expenditures. Light availability and temperature depend on seasonality. However, the quality of the biomethane generated is little influenced by the growth rates of the microalgae culture, since other parameters such as solubility, pH or alkalinity of the culture medium are more involved in the gas absorption process [9,39].

3.3. Investment Cost Study

The investment cost of this photosynthetic upgrading was compared with conventional technologies. Since the biological process was conditioned by microalgae activity, 7 h a day was considered as the biomethane production operation time (during the daylight). An estimation of the costs of the equipment composing the improvement system was made, at six different scales (Table 3). The HRAP waterproofing showed a direct correlation since it directly depends on the amount of polyethylene required. On the contrary, the equipment with the highest deviation from the scale was the paddle wheel, since a relatively small variation in the channel width from 5 to 6 m corresponds to a double biogas treatment capacity [43,68].

3.4. Operating Cost Study

The results of the operational study based on energy consumed and biogas cleaning capacity are summarized in Table 4. The energy consumption per cubic meter of biogas treated by the photosynthetic upgrading plant was 0.191 kWh m⁻3.
Alternatively, the economic balance of the plant is positive, with a net energy production of 687 kWh per day with a yearly profit obtained of €30,348. For these calculations, a biomethane price of 0.15 €/kWh and an electricity price in the industry of 0.12 €/kWh were considered [69]. The consumables’ prices were defined considering the daily operation plant experience using the local provider’s prices. Operational costs are defined in Table 5.

4. Discussion

To evaluate the competitiveness of the photosynthetic upgrading systems, the results found in the analysis of the investment were compared to commercially available technologies. Figure 5 shows the relative investment costs per volume of biogas treated of different technologies previously reported together with the results of this study [7,47,65,68,70]. Low range of biogas flow, from 10 to 200 m/h, is characterized by an exponential increase in the investment costs, which hinders the implementation of biogas upgrading systems in smaller biogas plants like farms, where the biogas production is directly dependent on the number of livestock. At this point, it must be highlighted that although the size of farms depends on the legislation of each country, the number of livestock rarely exceeds 5000 in the case of pig farms [56].
The investment costs for a low-cost microalgae valorization plant are considerably higher for low flows of biogas to be treated: 5619 € Nm−3 h−1 for a flow rate of 24.3 m3 h−1. The installation expenditures are reduced when installing photosynthetic enhancement plants with higher biogas processing capacity to be treated, reaching 2805 € Nm−3 for a flow rate of 242.9 m3 h−1, since the price of the equipment is not proportional to the capacity. In this sense, this last value corresponds to the medium–large-size pig farms existing in Europe, North America or Asia.
The system studied here reaches its optimum in a small-scale business niche, between 50 and 400 Nm3 h−1, covering most pig farms where there are biogas production systems from livestock waste. Figure 5 shows how photosynthetic upgrading can compete with other technologies in farms of small–medium livestock capacity with low biogas production in small digesters. Since, the lowest-cost raw biogas technology currently available is chemical scrubbing, with a minimum processing capacity of 137 Nm3 h−1 at a capital cost of 2576.6 € m−3 h−1, resulting in higher costs compared to photosynthetic upgrading. Photosynthetic upgrading technology is proposed as a cheaper alternative to other upgrading technologies in low-capacity processing applications, as other technologies cannot compete due to their high cost at such a small scale [65]. The expansion of photosynthetic upgrading plants with microalgae is mainly based on increasing the surface area of the culture pond, always complying with local regulations on the areas allowed for its occupation. Additionally, a light increase in the volume of the absorption column is anticipated, which is not expected to pose a significant challenge.
In parallel, the energy balance of the upgrading system is positive, with daily net production of 687.1 kWh. According to the data collected, the energy consumption per unit of treated biogas is 0.191 kWh m−3, a lower value than other cleaning technologies [65,71] (see Figure 6). Within the conventional upgrading technologies, the technology that consumes the least energy is the membrane technology, with a consumption of 0.200 kWh/m3. In comparison, the energy consumption of other technologies is considerably higher. In addition, some of these technologies, such as amine washing and the use of organic solvents, also require thermal input. Although current technologies require a minimum refining capacity of 250 m3 h−1, photosynthetic upgrading technology can operate effectively at lower ranges, thus adapting to decentralized plants with low biogas production such as livestock farms or small–medium wastewater treatment plants.
In comparison to other studies on the operational costs of photosynthetic upgrading technologies [10], values of 0.09 kWh m⁻3 of biogas have been reported, which is lower than the figure recorded in this work. On the other hand, a study that simulated a real-scale system from a pilot-scale upgrading system reported a consumption of 0.056 kWh m⁻3 [13], a value much lower than the directly measured data from a pilot plant. Studies on industrial-scale photosynthetic upgrading are limited, resulting in limited data on the consumption of this technology. However, it must be noticed that as operations are scaled up, the energy cost per cubic meter of treated biogas tends to decrease. Regarding the problems identified during operation, it is important to note that this upgrading system is a robust process, whose performance is conditioned by the pH and the characteristics of the culture medium, which is distinguished by its alkalinity, which acts as a buffer effect. Although there are sporadic problems of clogging in biomethane pipelines, these can be solved by using additional materials (antifoams or traps), which would optimize the system.

5. Conclusions

Investment and operational costs of photosynthetic upgrading technology were presented in this study. This upgrading technology is competitive for decentralized biogas production systems, such as farms, where relatively low amounts of biogas are produced from the organic substrates and commercial technologies cannot be adopted. The investment costs of this technology can vary from 7138 to 2805 € Nm−3 h−1 for processing capacities between 12 and 250 Nm3 biogas h−1, respectively. The operating costs are low (0.029 € kWh−1 produced) compared to other conventional upgrading technologies, which require a significant amount of energy per cubic meter of biogas processed. Future lines of research could focus on corroborating the effectiveness of photosynthetic upgrading technology, extending its application to different types of facilities, evaluating its performance with various substrates, verifying its long-term robustness and optimizing the system. Our main conclusions can be summarized as follows:
  • The microalgae-based system demonstrated superior cost-effectiveness compared to other biogas upgrading technologies for the biogas production capacity typical of pig farms.
  • Biomethane quality was maintained throughout the year achieving the legal standard despite variable variations in meteorological conditions.
  • Operating costs proved to be competitive when compared to alternative upgrading technologies.
  • The production of vehicular biomethane using a photosynthetic upgrading system was successfully demonstrated for the first time at a pre-commercial scale.

Supplementary Materials

The following supporting information can be downloaded at: https://www.mdpi.com/article/10.3390/pr12122794/s1, Figure S1: Variation in the biomethane composition depending on seasonality. And interfering parameters: mean daily irradiation, precipitation and mean daily temperature; Figure S2: Relative microalgae abundance. Top 10 taxa of “Winter algae” and “Summer algae” sample at Family taxonomic rank were selected to form the distribution histogram of the relative abundance of taxa; Figure S3: Comparison of investment costs of different upgrading technologies.

Author Contributions

Conceptualization, C.R.P., A.G.Á., R.M. and I.d.G.; Methodology, C.R.P.; Software, C.R.P.; Validation, I.d.G., C.R. and R.M.; Formal analysis, A.G.Á. and C.R.; Research, C.R.P.; Resources, I.d.G.; Writing—original draft, C.R.P.; Writing—revising and editing, A.G.Á. and I.d.G.; Supervision, I.d.G., M.F.O. and R.M.; Project administration, I.d.G. and M.F.O.; Funding, I.d.G., M.F.O. and R.M. All authors have read and agreed to the published version of the manuscript.

Funding

This work has been supported by the LIFE SMART AgroMobility project (LIFE19-CCM-ES-001206) financed by the European Union, part of the LIFE program.

Data Availability Statement

The original contributions presented in the study are included in the article; further inquiries can be directed to the corresponding authors.

Conflicts of Interest

The authors declare no conflict of interest.

References

  1. Deng, L.; Ngo, H.H.; Guo, W.; Chang, S.W.; Nguyen, D.D.; Pandey, A.; Varjani, S.; Hoang, N.B. Recent Advances in Circular Bioeconomy Based Clean Technologies for Sustainable Environment. J. Water Process Eng. 2022, 46, 102534. [Google Scholar] [CrossRef]
  2. Meier, L.; Barros, P.; Torres, A.; Vilchez, C.; Jeison, D. Photosynthetic Biogas Upgrading Using Microalgae: Effect of Light/Dark Photoperiod. Renew. Energy 2017, 106, 17–23. [Google Scholar] [CrossRef]
  3. Appels, L.; Baeyens, J.; Degrève, J.; Dewil, R. Principles and Potential of the Anaerobic Digestion of Waste-Activated Sludge. Prog. Energy Combust. Sci. 2008, 34, 755–781. [Google Scholar] [CrossRef]
  4. Ferrari, G.; Holl, E.; Steinbrenner, J.; Pezzuolo, A.; Lemmer, A. Environmental Assessment of a Two-Stage High Pressure Anaerobic Digestion Process and Biological Upgrading as Alternative Processes for Biomethane Production. Bioresour. Technol. 2022, 360, 127612. [Google Scholar] [CrossRef]
  5. Massaccesi, L.; Sordi, A.; Micale, C.; Cucina, M.; Zadra, C.; Di Maria, F.; Gigliotti, G. Chemical Characterisation of Percolate and Digestate during the Hybrid Solid Anaerobic Digestion Batch Process. Process Biochem. 2013, 48, 1361–1367. [Google Scholar] [CrossRef]
  6. EN 16723-1:2016; Natural Gas and Biomethane for Use in Transport and Biomethane for Injection in the Natural Gas Network. Specifications for Biomethane for Injection in the Natural Gas Network. European Committee for Standardization: Brussels, Belgium, 2016.
  7. Toledo-Cervantes, A.; Estrada, J.M.; Lebrero, R.; Muñoz, R. A Comparative Analysis of Biogas Upgrading Technologies: Photosynthetic vs Physical/Chemical Processes. Algal Res. 2017, 25, 237–243. [Google Scholar] [CrossRef]
  8. Sahota, S.; Shah, G.; Ghosh, P.; Kapoor, R.; Sengupta, S.; Singh, P.; Vijay, V.; Sahay, A.; Vijay, V.K.; Thakur, I.S. Review of Trends in Biogas Upgradation Technologies and Future Perspectives. Bioresour. Technol. Rep. 2018, 1, 79–88. [Google Scholar] [CrossRef]
  9. Marín, D.; Carmona-Martínez, A.A.; Blanco, S.; Lebrero, R.; Muñoz, R. Innovative Operational Strategies in Photosynthetic Biogas Upgrading in an Outdoors Pilot Scale Algal-Bacterial Photobioreactor. Chemosphere 2021, 264, 128470. [Google Scholar] [CrossRef]
  10. Toledo-Cervantes, A.; Lebrero, R.; Cavinato, C.; Muñoz, R. Biogas Upgrading Using Algal-Bacterial Processes. In Microalgae-Based Biofuels and Bioproducts: From Feedstock Cultivation to End-Products; Woodhead Publish: Sawston, UK, 2017; pp. 283–304. [Google Scholar] [CrossRef]
  11. Kapoor, R.; Ghosh, P.; Kumar, M.; Vijay, V.K. Evaluation of Biogas Upgrading Technologies and Future Perspectives: A Review. Environ. Sci. Pollut. Res. 2019, 26, 11631–11661. [Google Scholar] [CrossRef]
  12. Gkotsis, P.; Kougias, P.; Mitrakas, M.; Zouboulis, A. Biogas Upgrading Technologies—Recent Advances in Membrane-Based Processes. Int. J. Hydrog. Energy 2023, 48, 3965–3993. [Google Scholar] [CrossRef]
  13. Ferreira, A.F.; Toledo-Cervantes, A.; de Godos, I.; Gouveia, L.; Munõz, R. Life Cycle Assessment of Pilot and Real Scale Photosynthetic Biogas Upgrading. Algal Res. 2019, 44, 101668. [Google Scholar] [CrossRef]
  14. Ángeles, R.; Arnaiz, E.; Gutiérrez, J.; Sepúlveda-Muñoz, C.A.; Fernández-Ramos, O.; Muñoz, R.; Lebrero, R. Optimization of Photosynthetic Biogas Upgrading in Closed Photobioreactors Combined with Algal Biomass Production. J. Water Process Eng. 2020, 38, 101554. [Google Scholar] [CrossRef]
  15. Marín, D.; Carmona-Martínez, A.A.; Lebrero, R.; Muñoz, R. Influence of the Diffuser Type and Liquid-to-Biogas Ratio on Biogas Upgrading Performance in an Outdoor Pilot Scale High Rate Algal Pond. Fuel 2020, 275, 117999. [Google Scholar] [CrossRef]
  16. Severi, C.A.; Lebrero, R.; Muñoz, R. Chapter 8—Biogas Upgrading Using Microalgae. In Sustainable Industrial Processes Based on Microalgae; Elsevier Science: Amsterdam, The Netherlands, 2024; pp. 157–184. [Google Scholar] [CrossRef]
  17. Nagarajan, D.; Lee, D.J.; Chang, J.S. Integration of Anaerobic Digestion and Microalgal Cultivation for Digestate Bioremediation and Biogas Upgrading. Bioresour. Technol. 2019, 290, 121804. [Google Scholar] [CrossRef]
  18. del Rosario Rodero, M.; Lebrero, R.; Serrano, E.; Lara, E.; Arbib, Z.; García-Encina, P.A.; Muñoz, R. Technology Validation of Photosynthetic Biogas Upgrading in a Semi-Industrial Scale Algal-Bacterial Photobioreactor. Bioresour. Technol. 2019, 279, 43–49. [Google Scholar] [CrossRef]
  19. Yan, C.; Zhu, L.; Wang, Y. Photosynthetic CO2 Uptake by Microalgae for Biogas Upgrading and Simultaneously Biogas Slurry Decontamination by Using of Microalgae Photobioreactor under Various Light Wavelengths, Light Intensities, and Photoperiods. Appl. Energy 2016, 178, 9–18. [Google Scholar] [CrossRef]
  20. Toledo-Cervantes, A.; Madrid-Chirinos, C.; Cantera, S.; Lebrero, R.; Muñoz, R. Influence of the Gas-Liquid Flow Configuration in the Absorption Column on Photosynthetic Biogas Upgrading in Algal-Bacterial Photobioreactors. Bioresour. Technol. 2017, 225, 336–342. [Google Scholar] [CrossRef]
  21. Burg, V.; Rolli, C.; Schnorf, V.; Scharfy, D.; Anspach, V.; Bowman, G. Agricultural Biogas Plants as a Hub to Foster Circular Economy and Bioenergy: An Assessment Using Substance and Energy Flow Analysis. Resour. Conserv. Recycl. 2023, 190, 106770. [Google Scholar] [CrossRef]
  22. Ó Céileachair, D.; O’Shea, R.; Murphy, J.D.; Wall, D.M. Alternative Energy Management Strategies for Large Industry in Non-Gas-Grid Regions Using on-Farm Biomethane. Appl. Energy 2021, 303, 117627. [Google Scholar] [CrossRef]
  23. García Álvaro, A.; Mediavilla, I.; Ruiz Palomar, C.; Esteban, L.S.; de Godos Crespo, I. Energy Valorization of Solid Residue from Steam Distillation of Aromatic Shrubs. Ind. Crops Prod. 2024, 222, 119485. [Google Scholar] [CrossRef]
  24. LIFE Smart Agromobility. 2024. Available online: https://lifesmartagromobility.eu/en/index (accessed on 27 November 2024).
  25. Mendieta, O.; Castro, L.; Escalante, H.; Garfí, M. Low-Cost Anaerobic Digester to Promote the Circular Bioeconomy in the Non-Centrifugal Cane Sugar Sector: A Life Cycle Assessment. Bioresour. Technol. 2021, 326, 124783. [Google Scholar] [CrossRef] [PubMed]
  26. García Álvaro, A.; Ruiz Palomar, C.; Valenzuela, E.I.; Hermosilla Redondo, D.; Muñoz Torre, R.; de Godos Crespo, I. Microbial Analysis of Anaerobic Digester Reveals Prevalence of Manure Microbiota. J. Water Process Eng. 2024, 60, 105162. [Google Scholar] [CrossRef]
  27. Rubio, J.A.; Fdez-Güelfo, L.A.; Romero-García, L.I.; Wilkie, A.C.; García-Morales, J.L. Start-up of the Mesophilic Anaerobic Co-Digestion of Two-Phase Olive-Mill Waste and Cattle Manure Using Volatile Fatty Acids as Process Control Parameter. Fuel 2022, 325, 124901. [Google Scholar] [CrossRef]
  28. Álvaro, A.G.; Palomar, C.R.; Torre, R.M.; Redondo, D.H.; de Godos Crespo, I. Hybridization of Anaerobic Digestion with Solar Energy: A Solution for Isolated Livestock Farms. Energy Convers. Manag. X 2023, 20, 100488. [Google Scholar] [CrossRef]
  29. IRTA (Ministerio de Agricultura). Datos y Censos—Bdporc. 2024. Available online: https://bdporc.irta.es/datos-y-censos/ (accessed on 27 November 2024).
  30. Chandra Mal, B. Raceways and Tanks. In Aquacultural Facilities and Equipment; Elsevier: Amsterdam, The Netherlands, 2021; pp. 239–268. [Google Scholar]
  31. Borowitzka, M.A. Algal biotechnology products and processes—matching science and economics. In Algal Biotechnology Products and Processes-Matching Science and Economics; Springer: Berlin/Heidelberg, Germany, 1992; Volume 4, pp. 267–279. [Google Scholar]
  32. Borowitzka, M.A. Commercial Production of Microalgae: Ponds, Tanks, and Fermenters. Prog. Ind. Microbiol. 1999, 35, 313–321. [Google Scholar] [CrossRef]
  33. Trading Economics, Polyethylene Price. 2024. Available online: https://tradingeconomics.com/commodity/polyethylene (accessed on 20 November 2024).
  34. Mehrabadi, A.; Craggs, R.; Farid, M.M. Wastewater Treatment High Rate Algal Ponds (WWT HRAP) for Low-Cost Biofuel Production. Bioresour. Technol. 2015, 184, 202–214. [Google Scholar] [CrossRef]
  35. Trading Economics, Steel Price. 2024. Available online: https://tradingeconomics.com/commodity/steel (accessed on 20 November 2024).
  36. NOV Mono’s PC Pumps for Waterworks. World Pumps 2014, 2014, 10. [CrossRef]
  37. Trading Economics, Cooper Price. 2024. Available online: https://tradingeconomics.com/commodity/copper (accessed on 20 November 2024).
  38. Statista Research Department. Monthly Prices for Polyvinyl Chloride (PVC) Worldwide. 2024. Available online: https://www.statista.com/statistics/1350554/monthly-polypropylene-price-worldwide/ (accessed on 20 November 2024).
  39. Marín, D.; Posadas, E.; Cano, P.; Pérez, V.; Blanco, S.; Lebrero, R.; Muñoz, R. Seasonal Variation of Biogas Upgrading Coupled with Digestate Treatment in an Outdoors Pilot Scale Algal-Bacterial Photobioreactor. Bioresour. Technol. 2018, 263, 58–66. [Google Scholar] [CrossRef]
  40. Serejo, M.L.; Posadas, E.; Boncz, M.A.; Blanco, S.; García-Encina, P.; Muñoz, R. Influence of Biogas Flow Rate on Biomass Composition During the Optimization of Biogas Upgrading in Microalgal-Bacterial Processes. Environ. Sci. Technol. 2015, 49, 3228–3236. [Google Scholar] [CrossRef]
  41. Posadas, E.; Marín, D.; Blanco, S.; Lebrero, R.; Muñoz, R. Simultaneous Biogas Upgrading and Centrate Treatment in an Outdoors Pilot Scale High Rate Algal Pond. Bioresour. Technol. 2017, 232, 133–141. [Google Scholar] [CrossRef]
  42. Posadas, E.; Serejo, M.L.; Blanco, S.; Pérez, R.; García-Encina, P.A.; Muñoz, R. Minimization of Biomethane Oxygen Concentration during Biogas Upgrading in Algal–Bacterial Photobioreactors. Algal Res. 2015, 12, 221–229. [Google Scholar] [CrossRef]
  43. Hirayama, A.; Sueyoshi, M.N.; Nakano, T.; Ota, Y.; Kurita, H.; Tasaki, M.; Kuroiwa, Y.; Kato, T.; Serizawa, S.; Kojima, K.; et al. Development of Large-Scale Microalgae Production in the Middle East. Bioresour. Technol. 2022, 343, 126036. [Google Scholar] [CrossRef] [PubMed]
  44. Dodd, J.C. Algae Production and Harvesting from Animal Wastewaters. Agric. Wastes 1979, 1, 23–37. [Google Scholar] [CrossRef]
  45. Ortiz, A.; García-Galán, M.J.; García, J.; Díez-Montero, R. Optimization and Operation of a Demonstrative Full Scale Microalgae Harvesting Unit Based on Coagulation, Flocculation and Sedimentation. Sep. Purif. Technol. 2021, 259, 118171. [Google Scholar] [CrossRef]
  46. Nurdogan, Y.; Oswald, W.J. Tube Settling of High-Rate Pond Algae. Water Sci. Technol. 1996, 33, 229–241. [Google Scholar] [CrossRef]
  47. Ryckebosch, E.; Drouillon, M.; Vervaeren, H. Techniques for Transformation of Biogas to Biomethane. Biomass Bioenergy 2011, 35, 1633–1645. [Google Scholar] [CrossRef]
  48. Zhu, G.; Zhang, Y.; Ren, J.; Qiu, T.; Wang, T. Flow Simulation and Analysis in a Vertical-Flow Sedimentation Tank. Energy Procedia 2012, 16, 197–202. [Google Scholar] [CrossRef]
  49. Omoregie, A.I.; Palombo, E.A.; Ong, D.E.L.; Nissom, P.M. A Feasible Scale-up Production of Sporosarcina Pasteurii Using Custom-Built Stirred Tank Reactor for in-Situ Soil Biocementation. Biocatal. Agric. Biotechnol. 2020, 24, 101544. [Google Scholar] [CrossRef]
  50. Racharaks, R.; Ge, X.; Li, Y. Cultivation of Marine Microalgae Using Shale Gas Flowback Water and Anaerobic Digestion Effluent as the Cultivation Medium. Bioresour. Technol. 2015, 191, 146–156. [Google Scholar] [CrossRef]
  51. Al-Mallahi, J.; Ishii, K.; Sato, M.; Ochiai, S. Static Supply of Different Simulated Flue Gases for Native Microalgae Cultivation in Diluted Cow Manure Digestate. J. Environ. Manag. 2023, 335, 117557. [Google Scholar] [CrossRef]
  52. Saranya, D.; Shanthakumar, S. Effect of Culture Conditions on Biomass Yield of Acclimatized Microalgae in Ozone Pre-Treated Tannery Effluent: A Simultaneous Exploration of Bioremediation and Lipid Accumulation Potential. J. Environ. Manag. 2020, 273, 111129. [Google Scholar] [CrossRef] [PubMed]
  53. Daneshvar, E.; Santhosh, C.; Antikainen, E.; Bhatnagar, A. Microalgal Growth and Nitrate Removal Efficiency in Different Cultivation Conditions: Effect of Macro and Micronutrients and Salinity. J. Environ. Chem. Eng. 2018, 6, 1848–1854. [Google Scholar] [CrossRef]
  54. EN 16723-2:2017; Natural Gas and Biomethane for Use in Transport and Biomethane for Injection in the Natural Gas Network—Part 2: Automotive Fuels Specification. European Committee for Standardization: Brussels, Belgium, 2017.
  55. Ferreira, A.; Melkonyan, L.; Carapinha, S.; Ribeiro, B.; Figueiredo, D.; Avetisova, G.; Gouveia, L. Biostimulant and Biopesticide Potential of Microalgae Growing in Piggery Wastewater. Environ. Adv. 2021, 4, 100062. [Google Scholar] [CrossRef]
  56. IDEA. Ahorro, Eficiencia Energética y Fertilización Nitrogenada. 2007. Available online: https://www.idae.es (accessed on 27 November 2024).
  57. UNE-EN 16723-2:2017; Normativa Española de Biometano para Uso Vehicular. Asociación Española de Normalización: Madrid, Spain, 2018.
  58. UNE-EN 16723-1:2017; Gas Natural y Biometano para Uso en Transporte y Biometano para Inyección en la Red de Gas Natural. Asociación Española de Normalización: Madrid, Spain, 2017.
  59. Angelidaki, I.; Treu, L.; Tsapekos, P.; Luo, G.; Campanaro, S.; Wenzel, H.; Kougias, P.G. Biogas Upgrading and Utilization: Current Status and Perspectives. Biotechnol. Adv. 2018, 36, 452–466. [Google Scholar] [CrossRef] [PubMed]
  60. Comesaña-Gándara, B.; García-Depraect, O.; Santos-Beneit, F.; Bordel, S.; Lebrero, R.; Muñoz, R. Recent Trends and Advances in Biogas Upgrading and Methanotrophs-Based Valorization. Chem. Eng. J. Adv. 2022, 11, 100325. [Google Scholar] [CrossRef]
  61. Sander, R. Compilation of Henry’s Law Constants (Version 5.0.0) for Water as Solvent. Atmos. Chem. Phys. 2023, 23, 10901–12440. [Google Scholar] [CrossRef]
  62. Franco-Morgado, M.; Toledo-Cervantes, A.; González-Sánchez, A.; Lebrero, R.; Muñoz, R. Integral (VOCs, CO2, Mercaptans and H2S) Photosynthetic Biogas Upgrading Using Innovative Biogas and Digestate Supply Strategies. Chem. Eng. J. 2018, 354, 363–369. [Google Scholar] [CrossRef]
  63. Winkler, M.K.; Straka, L. New Directions in Biological Nitrogen Removal and Recovery from Wastewater. Curr. Opin. Biotechnol. 2019, 57, 50–55. [Google Scholar] [CrossRef]
  64. García, A.; Valenzuela, E.I.; Vargas, A.; de Godos, I.; Muñoz, R.; Wang, M.; Vital-Jácome, M.; Quijano, G. Wastewater Treatment Potential, Light Penetration Profile and Biomass Settling Performance of a Photo-Sequencing Batch Reactor. J. Chem. Technol. Biotechnol. 2023, 98, 346–356. [Google Scholar] [CrossRef]
  65. Angelidaki, I.; Xie, L.; Luo, G.; Zhang, Y.; Oechsner, H.; Lemmer, A.; Munoz, R.; Kougias, P.G. Biogas Upgrading: Current and Emerging Technologies. In Biomass, Biofuels, Biochemicals: Biofuels: Alternative Feedstocks and Conversion Processes for the Production of Liquid and Gaseous Biofuels; Elsevier: Amsterdam, The Netherlands, 2019; pp. 817–843. ISBN 9780128168561. [Google Scholar]
  66. Chisti, Y. Biodiesel from Microalgae. Biotechnol. Adv. 2007, 25, 294–306. [Google Scholar] [CrossRef]
  67. de Godos, I.; Blanco, S.; García-Encina, P.A.; Becares, E.; Muñoz, R. Long-Term Operation of High Rate Algal Ponds for the Bioremediation of Piggery Wastewaters at High Loading Rates. Bioresour. Technol. 2009, 100, 4332–4339. [Google Scholar] [CrossRef] [PubMed]
  68. Craggs, R.; Sutherland, D.; Campbell, H. Hectare-Scale Demonstration of High Rate Algal Ponds for Enhanced Wastewater Treatment and Biofuel Production. J. Appl. Phycol. 2012, 24, 329–337. [Google Scholar] [CrossRef]
  69. Operador de Mercado Eléctrico Designado (OMIE). Precios Horarios del Mercado Diario en España. Available online: https://www.omie.es/ (accessed on 3 October 2024).
  70. Azadi Tabar, M.; Maghsoudi, H.; Karimi, K.; Hosseini, S.S.; Gholami, M.; Denayer, J.F.M. Techno-Economic Analysis of Vacuum Pressure Swing Adsorption Process for a Sustainable Upgrading of Biogas. J. Clean. Prod. 2024, 450, 141853. [Google Scholar] [CrossRef]
  71. Iglesias, R.; Muñoz, R.; Polanco, M.; Díaz, I.; Susmozas, A.; Moreno, A.D.; Guirado, M.; Carreras, N.; Ballesteros, M. Biogas from Anaerobic Digestion as an Energy Vector: Current Upgrading Development. Energies 2021, 14, 2742. [Google Scholar] [CrossRef]
Figure 1. Scheme of the LIFE Smart Agromobility project. In green shadow: the upgrading installation equipment. Red line: cold water. Blue line: hot water.
Processes 12 02794 g001
Figure 2. Equipment considered in the upgrading process. (1) Absorption column; (2) waterproofing, biological upgrading raft and baffles; (3) mixing tank; (4) settler; (5) liquid pumps and pipelines; (6) biogas compressor; (7) paddle wheel.
Processes 12 02794 g002
Figure 3. (a) Biogas and (b) biomethane composition before and after photosynthetic upgrading.
Processes 12 02794 g003
Figure 4. Comparison in the average annual composition of biogas and biomethane produced.
Processes 12 02794 g004
Figure 5. Comparison of investment costs of different upgrading technologies.
Processes 12 02794 g005
Figure 6. Energy consumption, comparing conventional upgrading technologies with the case study (Dark blue).
Processes 12 02794 g006
Table 1. Equipment costs and their scale coefficients at different installation sizes. Factor scale 1 corresponds to the demonstration unit of the project.
ReferencesEquipment Factor Scale
0.5123410
[30]Absorption columnCoefficient applied0.711.2235
Costs (€)34,02048,60058,32097,200145,800243,000
[31,32,33]WaterproofingCoefficient applied0.5123410
Costs (€)725014,50029,00043,50058,000145,000
[30,31,32,34]Biological upgrading raftCoefficient applied0.5122.83.57
Costs (€)893217,86435,72950,02062,526125,051
[31,32,35]BafflesCoefficient applied0.611.222.96
Costs (€)47157858943015,71622,78847,148
[31,32,33,35]Paddle wheelCoefficient applied0.711.51.822
Costs (€)6951993014,89517,87419,86019,860
[30]Mixing tankCoefficient applied0.611.52.22.54
Costs (€)1822303645546679759012,144
[30]SettlerCoefficient applied0.611.52.22.54
Costs (€)2201366955048072917314,676
[36]PumpsCoefficient applied0.611.22.534
Costs (€)24824137496410,34212,41016,547
[37]ElectrificationCoefficient applied0.711.11.21.31.5
Costs (€)15,31721,88224,07026,25828,44732,823
[38]PipelinesCoefficient applied0.611.22.535
Costs (€)29884979597512,44814,93824,896
Total costs (€) 86,678136,455192,440288,110381,531681,145
Table 2. Operational consumption per day in the photosynthetic upgrading.
EquipmentPower
(kW)
Time
(h/d)
Energy Consumption
(kWh/d)
Consumable MaterialsQuantity
Liquid pump0.424.09.60Oil pumps0.1 L/d
Biogas pump0.224.03.60Activated carbon0.25 kg/d
Paddle wheel0.210.02.00Silica gel0.5 kg/d
Digestate pump0.50.90.42
Setler pump0.66.03.66
SCADA0.224.03.60
T 22.88
Table 3. Investment costs per biogas processing capacity.
Factor ScaleCapacity Raw Biogas
(Nm3/h)
Costs
(€)
Capital Costs
(€/Nm3 h)
0.512.1486,6787138.19
124.29136,4555618.75
248.57192,4403962.01
372.86288,1103954.45
497.14381,5313927.52
10242.86681,1452804.72
Table 4. Energy consumption.
Energy consumption (kWh h−1)0.950
Upgrading biogas capacity (m3 h−1)5.00
Energy consumption (kWh m−3 biogas)0.191
Table 5. Energy and cost balance.
Cost per Day
(€/d)
Energy Balance
(kWh/d)
Cost Balance
(€/Year)
Oil pumps 6.23Energy production710.0Income 37,620
Activated carbon1.25Energy consumption22.9Expenditure 7272
Silica gel9.70Net energy687.1Benefits 30,348
Electricity2.75
Disclaimer/Publisher’s Note: The statements, opinions and data contained in all publications are solely those of the individual author(s) and contributor(s) and not of MDPI and/or the editor(s). MDPI and/or the editor(s) disclaim responsibility for any injury to people or property resulting from any ideas, methods, instructions or products referred to in the content.

