Article

A Time-Limited Adaptive Reclosing Method in Active Distribution Networks Considering Anti-Islanding Protection

1
State Grid Hubei Electric Power Research Institute, Wuhan 430077, China
2
College of Electrical and Electronic Engineering, Shandong University of Technology, Zibo 255000, China
*
Author to whom correspondence should be addressed.
Processes 2024, 12(12), 2781; https://doi.org/10.3390/pr12122781
Submission received: 6 November 2024 / Revised: 2 December 2024 / Accepted: 5 December 2024 / Published: 6 December 2024

Abstract

:
In active distribution networks (DNs), distributed energy resources (DERs) must be disconnected from the grid prior to automatic reclosing actions. Many scholars have proposed non-voltage checking reclosing methods, but a significant challenge arises; many substations lack line-side voltage transformers (LSVTs), making these schemes impractical. To address this, we introduce a time-limited adaptive automatic reclosing (TLAR) method that integrates DERs’ anti-islanding protection (AIP) with automatic reclosing. This method estimates the AIP action time using bus-side voltage measurements before the system-side protection (SSP) is tripped and adjusts the reclosing time accordingly to enhance power supply reliability. Simulations using PSCAD validate the method’s effectiveness. The TLAR method is well-suited for distribution lines without conditions for non-voltage checking, is cost-effective, easy to implement, and contributes to power system stability.
Keywords:
DN; DER; auto-reclosing; AIP

1. Introduction

The majority of faults in overhead distribution lines are transient [1,2], prompting the widespread use of automatic reclosing in distribution networks (DNs) to enhance power supply reliability. In traditional systems, when network protection trips, the reclosing mechanism reconnects the main power. If the fault is transient, normal power is rapidly restored [3,4]. However, with the integration of distributed energy resources (DERs), the DN has transitioned from a single power radial structure to a multi-terminal power resource configuration, impacting original protection and control strategies [5,6]. In active DNs, if a fault occurs and system protection trips, the arc at the fault point may persist if DERs remain connected [7,8]. Furthermore, if DERs are not disconnected before reclosing, it can result in reclosing failure. Additionally, distribution lines, DERs, and other equipment may suffer secondary impacts from inrush currents caused by non-synchronous reclosing. Therefore, in active DNs, DERs must be disconnected from the grid prior to reclosing actions.
In traditional DNs, when a fault occurs in the lines, the system protection acts promptly, triggering the reclosing mechanism after a brief delay of about 1 s. However, in active DNs, the scenario changes due to the limited output fault current of inverter-interfaced distributed energy resources (IIDERs) [9]. The current protection for IIDERs may not act reliably, necessitating their disconnection from the main grid via the anti-islanding protection (AIP) mechanism. If IIDERs lack low voltage ride-through (LVRT) capability, the AIP typically acts within 2 s. To ensure IIDERs are disconnected before reclosing, an additional reservation time is added to the reclosing sequence. Similarly, if IIDERs possess LVRT capability, the reclosing time must also be adjusted by adding an extra reservation time to account for this [10]. According to the IEEE 1547-2018 standard issued in 2018 [11], IIDERs with LVRT capability can have AIP action times exceeding 300 s, leading to prolonged reclosing waiting times and significantly impacting power supply reliability.
Researchers have conducted numerous studies related to the above question. Existing research primarily focuses on the influence of DERs on the protection of DNs and corresponding countermeasures, while the impacts on auto-reclosing and countermeasures for distribution lines are rarely addressed. In [12,13], different islanding control strategies for the isolated island operation status of wind farms are proposed to enhance the success rate of three-phase reclosing, but the LVRT capability of DERs is not considered. In [14,15], a reclosing scheme for parallel transmission lines with shunt reactors is proposed to improve the adaptability of automatic reclosing. In [16], the influences of different reclosing phases, amplitudes, and frequencies on reclosing impulse voltage and current are analyzed, and a synchronous check reclosing strategy applicable to the tie-line of IIDERs is proposed, which can effectively enhance the success rate of three-phase reclosing in the tie-line. In [17], protection coordination schemes for DER units of the synchronous generator type are proposed for distribution automatic reclosing and voltage sag. A novel reclosing algorithm that considers the superconducting fault current limiter recovery time in a distribution system with DER is proposed in [18]. The main idea is to use a carrier signal to distinguish whether the fault is transient or permanent after the tripping of the line by a recloser. Ref. [19] proposes a scheme that automatically adjusts the reclosing time according to the DER’s connection point voltage, and it is modeled based on the IEC 61850 standard [20] to achieve rapid action of the reclosing device. The authors of Ref. [21] propose a coordination method between DER LVRT and instant accelerated protection tripping by setting the reclosing time, which effectively avoids reclosing failure caused by DERs that have not been disconnected from the grid and are still providing fault current to the fault point. The authors of Ref. [22] present a method for installing a low-frequency, low-voltage automatic unwinding device on the DER side, coupled with an appropriate extension of the reclosing time. Meanwhile, Refs. [23,24] introduce reclosing techniques that rely on non-voltage detection, necessitating the presence of a voltage transformer on the line side.
Traditional reclosing schemes cannot differentiate between transient and permanent faults. To overcome this limitation, scholars have introduced adaptive reclosing strategies. Once the system-side protection is disconnected, the initial step involves assessing the fault’s nature. If the fault is deemed transient and has cleared, the reclosing process is accelerated; otherwise, it is locked out in the case of a permanent fault. The authors of [25] present an adaptive reclosing scheme utilizing parameter identification, while Reference [26] introduces a method that distinguishes between permanent and transient faults using various current waveform indices. In another study, Reference [27] proposes an adaptive reclosing approach for transmission lines based on deep learning. However, these methods primarily focus on differentiating fault properties to determine the necessity of reclosing, neglecting the coordination between AIP and automatic reclosing.
The existing reclosing methods in active distribution networks considering the coordination between AIP and automatic reclosing are primarily categorized into three groups: delay coordination, non-voltage checking reclosing, and communication-based reclosing. The delay coordination automatic reclosing method takes into account the low voltage ride through (LVRT) requirements of DERs. The reclosing parameters are set based on the principle of aligning with the longest off-grid time of DERs, which results in longer reclosing waiting times and subsequently impacts power supply reliability. The non-voltage checking reclosing method necessitates the installation of a line-side voltage transformer (LSVT); however, in practice, many substations lack space for an LSVT, rendering this method infeasible. The implementation of the communication-based reclosing method requires high-performance communication networks for distribution lines. Often, this requirement cannot be met in practice, and any failure in transmitting reclosing-related commands or receiving incorrect information about the reclosing action prevents the reclosing from functioning correctly.
To address the above problems, this paper proposes an adaptive automatic reclosing method for distribution lines that coordinates with the AIP of IIDERs. In this method, the operation time of AIP is predicted based on the busbar voltage prior to outlet protection tripping. The automatic reclosing operation time of distribution lines can then be automatically adjusted to achieve cooperation between automatic reclosing and the AIP of IIDERs. This method does not require the installation of LSVTs and is independent of the communication network. The automatic reclosing operation can be completed as soon as possible while avoiding reclosing onto faults. As a result, IIDERs can provide reliable voltage support during power system disturbances and enable rapid automatic reclosing when the distribution line is faulty. This, in turn, supports the stability of the modern power system and improves the reliability of power supply.
For better readability, a list of acronyms used in this paper is provided in Table 1.

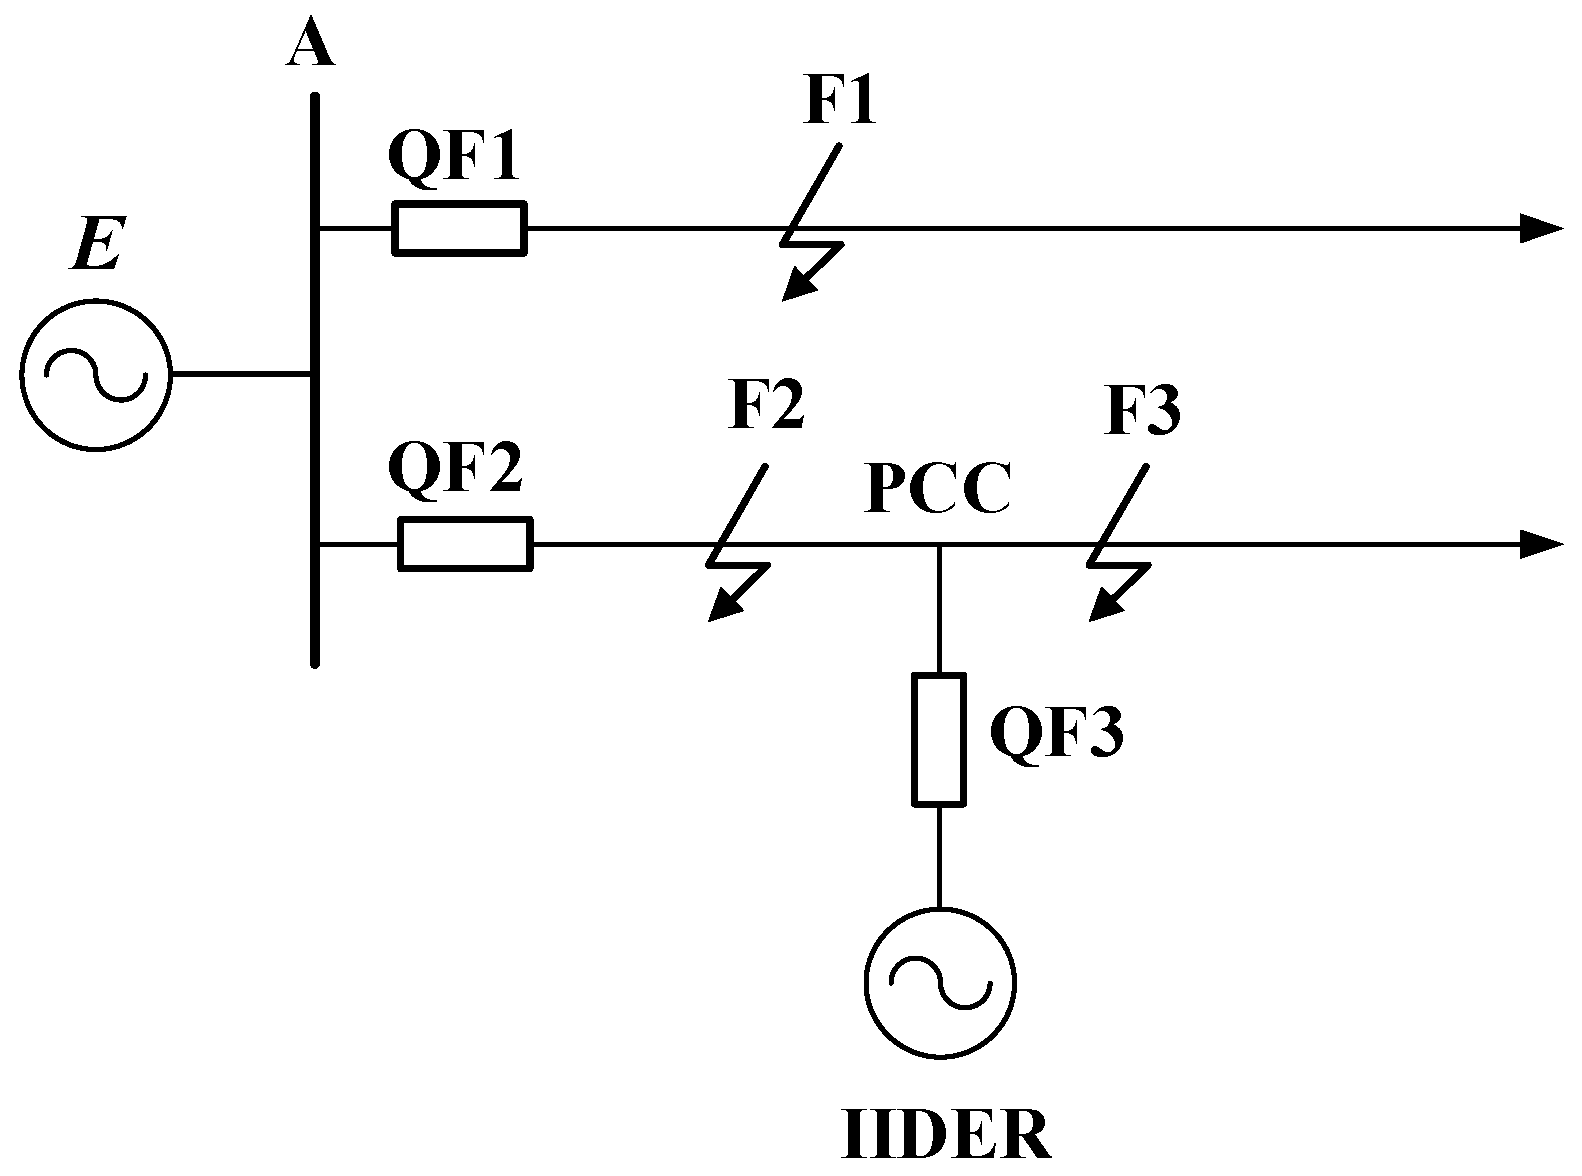
2. Influence of IIDERs on the Automatic Reclosing of Distribution Lines

2.1. Effect on Automatic Reclosing

As depicted in Figure 1, an IIDER is connected to the distribution lines. QF1 and QF2 serve as outlet circuit breakers, both of which are equipped with stage-type current relay protection and automatic reclosing functionality.
When a fault occurs at point F2, which is upstream of the IIDER connection point on the line, the bus voltage (bus-V) drops, and the IIDER enters the LVRT state. QF2 trips to clear the fault. After QF2 is switched off, the bus-V will recover. However, if the IIDER is still in the LVRT state, it remains connected to the fault point, while the outlet circuit breaker QF2 will automatically reclose according to the pre-set time after tripping. Since the IIDER is not disconnected from the grid, the distribution line faces two potential threats: non-synchronous reclosing and arc reignition at the fault point.
When a fault occurs at point F3, which is downstream of the IIDER connection point on the line, the situation is similar to that at point F2.
When a fault occurs at point F1, where IIDER is connected to its adjacent lines, the outlet circuit breaker QF1 trips to clear the fault. In this situation, IIDER is isolated from the fault point, so the fault current disappears and the arc is extinguished. Since IIDER remains connected to the main grid, the phase angle stays synchronized with the system. The circuit breaker QF1 recloses according to the pre-set time. If it is a transient fault, the adjacent lines will restore power supply, and non-synchronous reclosing will not occur. If the fault is permanent, the reclosing will fail, and the adjacent line will trip again.

2.2. Coordination Between AIP and Automatic Reclosing

AIP refers to the measures taken to disconnect DERs when an unplanned island occurs in the DN. Its function is to prevent equipment damage due to abnormal voltage/frequency and to stop the distribution line from remaining energized, thereby avoiding threats to the personal safety of maintenance personnel. In the DN, photovoltaic power generation and energy storage devices are connected to the grid via inverters; these IIDERs have limited output short-circuit current (SC-cur.) in the event of a DN failure and cannot be cleared in a timely manner using current protection. Therefore, AIP also plays a crucial role in disconnecting the IIDERs in the case of a DN fault. This is done to avoid reclosing failures caused by the inability to extinguish the arc at the fault point and to prevent the inrush current generated by non-simultaneous reclosing [28]. Consequently, the coordination between AIP and automatic reclosing should be carefully considered.

3. Principle of the Time-Limited Adaptive Reclosing Method

AIP for DERs includes low-voltage protection. In the event of a line fault, low-voltage protection is typically utilized to trigger a trip. The setting value for this low-voltage protection action is determined in accordance with regulations. In practice, if a line-side voltage transformer (LSVT) is available, it can be utilized to determine whether the IIDER is disconnected from the grid through non-voltage detection, thus enabling non-voltage detection reclosing. However, a significant challenge emerges: many substations do not have LSVTs, which makes non-voltage checking reclosing schemes infeasible. Hence, this paper proposes a TLAR method. This method calculates the reclosing action time for distribution lines by monitoring the busbar side voltage prior to tripping and taking into account the pre-set action time of the DER’s AIP, which includes LVRT capability. The action time for AIP is estimated based on the busbar voltage at the moment of failure, and the reclosing time is coordinated with this estimated time. Since the busbar voltage is higher than the voltage at the PCC after a fault occurs, the time deduced from the busbar voltage will consistently be greater than the actual low-voltage protection operation time of the DER on the distribution line. This ensures that the coordination requirements are met, thereby achieving adaptive reclosing.
As depicted in Figure 1 of the distribution line, when F2 fails, the voltage at QF2 of the circuit breaker drops, the voltage at the PCC decreases, and the bus-V detected at QF2 is higher than the voltage at the PCC. The duration of the IIDER’s LVRT is determined based on the bus-side voltage detected prior to the tripping of QF2 at the circuit breaker. On this basis, 0.3 s is added to establish the reclosing operation time of QF2. The operation time of AIP is correlated with the voltage; specifically, the lower the voltage at the PCCs, the faster the operation time of the AIP.
To demonstrate the feasibility of the TLAR method proposed in this paper, it is necessary to elucidate the variation patterns of both the bus-side voltage at the reclosing point and the voltage at the PCC before and after the system-side protection (SSP) action. The prerequisites for the feasibility of this scheme are that the bus-side voltage must be higher than the voltage at the PCC prior to tripping, and that the PCC voltage should not increase after the SSP action. To ensure generality, a distribution line with multiple IIDERs, as illustrated in Figure 2, is selected for analysis and demonstration.

3.1. Analysis of the Scenario Where the Arc at the Fault Point Does Not Extinguish

After a fault occurs in the distribution line and the SSP action trips, if the IIDERs remains connected to the fault point and the fault current exceeds 15A [7], the arc at the fault point will not be extinguished. This subsection analyzes the change in voltage when the arc persists after the fault occurs.

3.1.1. Fault in Feeder 2

The voltage offset resulting from IIDER access is proportional to both the IIDER capacity and the system impedance observed from the point of access. Consequently, as the distance between the access point (AP) and the bus increases, the permissible IIDER capacity for access decreases. This implies that the capacity of the downstream-connected IIDER at any given point in the actual distribution line is constrained by the voltage offset index. In the event of a fault at this point, the SC-cur. supplied by the downstream IIDER is also restricted, and within a specific voltage offset limit, the downstream SC-cur. at the fault point will not surpass the SC-cur. provided by the upstream system. According to IEEE 1547-2018, the voltage offset caused by IIDER grid-connection must not exceed 3%. Based on voltage quality requirements, the maximum IIDER capacity that can be accessed at each point along the distribution line is determined as follows:
S = 3 U N Δ U Z L
where Δ U is the voltage offset at the PCC, Z L is the system equivalent impedance seen from the DER AP, and U N is the rated voltage of the system.
As depicted in Figure 2, the distribution line connects to IIDER1 and IIDER2 at feeder 2, with IIDER1 located 2 km away from the bus and IIDER2 5 km away. Using three-phase short-circuit (3PSC) faults as an example, we analyze the voltage at the bus side of the reclosing point and the voltage at the PCCs both before and after the SSP action, in cases where faults occur at points F1 to F3 on the distribution line. The fault at point F1 is referred to as the line head fault, with the fault point situated upstream of all IIDERs. The fault at point F2 is called a mid-line fault, where both the upstream and downstream sections of the fault point are connected to IIDERs. Lastly, the fault at point F3 is termed the line end fault, with the fault point located downstream of all IIDERs. For the sake of simplicity, it is assumed that the faults are metallic phase to phase short circuit faults.
(1)
The Line Head Fault
When a 3PSC fault occurs at point F1, located at the beginning of the line, the simplified equivalent circuit of the DN is presented in Figure 3 [29].
ZS is the equivalent internal resistance of the system, Z1 is the equivalent impedance from bus A to point F1, Z2 is the equivalent impedance from point F1 to PCC1, and Z3 is the equivalent impedance from PCC1 to PCC2.
When a 3PSC fault occurs at point F1, the impedance of the non-faulted line is much larger than that of the faulted line. Therefore, ignoring the effect of the non-faulted line, the voltage UA at bus A can be expressed as
U A = Z 1 Z S + Z 1 E
The system side is decoupled from the IIDER1 and IIDER2 side circuits, so the voltages at PCC1 and PCC2, both before and after the protection action, are basically unaffected by the system side. According to IEEE 1547-2018, the voltage offset caused by DER grid-connection should not exceed 3%, which can be determined as follows:
U P C C < E · 3 %
To quantitatively compare the relationship between the bus-side voltage at the reclosing AP and the voltage at the PCC, let us take a 10 kV distribution line as an example. Assuming that the system impedance is 0.25 Ω, the unit line impedance is 0.17 + j0.33 Ω/km, and the line length is 8 km, we have
U A = E · 3 %
Substitute Equation (2) into Equation (4), and use the distance from the fault point to the bus along with the unit line impedance to express the line impedance. By doing so, the left side of the equation involving the unit line impedance can be simplified, and Equation (4) becomes
L 1 0.68 + L 1 = 0.03
It can be solved as L 1 0.02   km ; when the fault point is very close to the bus, at a distance of less than 0.02 km, there may be an extreme scenario where the voltage at the PCC is higher than the bus-side voltage. In this case, the bus-V is less than 0.2 p.u. Due to the current-limiting characteristics of the IIDER, which provides a SC-cur. much less than the system’s main power supply, the voltage offset caused by IIDER grid connection does not exceed 3%. At this time, the voltage at the PCC is also lower than 0.2 p.u., and the IIDER off-grid time is less than 2 s. This situation needs to be considered in the reclosing timing, and according to the adjustment method used in this paper, the time-limited reclosing waiting time is set to 2 s. See step (4) in Section 4 for more details.
(2)
The Mid-line Fault
When a 3PSC fault occurs at point F2 in the middle section of the line accessed by the IIDERs, the simplified equivalent circuit of the DN before and after the SSP action is depicted in Figure 4. ZS is the equivalent internal resistance of the system, Z1 is the equivalent impedance from bus A to PCC1, Z2 is the equivalent impedance from PCC1 to point F2, and Z3 is the equivalent impedance from point F2 to PCC2.
When a 3PSC fault occurs at point F2, the system side is decoupled from the IIDER2 side circuits, and the bus-V UA is
U A = Z 1 + Z 2 Z S + Z 1 + Z 2 E + Z 2 · Z S Z S + Z 1 + Z 2 · I I I D E R 1
The voltage at PCC1, prior to the SSP action, can be expressed as
U P C C 1 = Z 2 Z S + Z 1 + Z 2 [ E + ( Z S + Z 1 ) I I I D E R 1 ]
When the line outlet protection QF2 detects that a fault has occurred, the protection trips, causing the bus A voltage to return. As a result, IIDER1 is disconnected from the main system power supply, and the voltage U P C C 1 is
U P C C 1 = Z 2 · I I I D E R 1
Equation (9) is derived by dividing Equation (6) by Equation (7).
U A U P C C 1 = ( Z 1 + Z 2 ) E + Z S Z 2 I I I D E R 1 Z 2 E + Z 2 ( Z S + Z 1 ) I I I D E R 1
Let a 1 = Z 2 E + Z S Z 2 I I I D E R and a 1 = Z 2 · I I I D E R , then
U A U P C C 1 = Z 1 E + a 1 Z 1 a 1 + a 1
Equation (11) is derived by dividing Equation (7) by Equation (8).
U P C C 1 U P C C 1 = E + ( Z S + Z 1 ) I I I D E R 1 ( Z S + Z 1 + Z 2 ) I I I D E R 1
Let a 2 = ( Z S + Z 1 ) I I I D E R and a 2 = Z 2 I I I D E R , then
U P C C 1 U P C C 1 = E + a 2 a 2 + a 2
The extreme case is selected for analysis. When comparing the different terms of (12), the line parameters remain the same as in the previous section. The access to IIDER1 is at its maximum capacity of 4 MW. In the event of a fault at point F2, the maximum current output from IIDER1 is approximately 277 A. Consequently, the voltage at PCC1 before the SSP action is higher than the voltage at PCC1 after the protection action. Since the system side is decoupled from the IIDER2 side circuit, the voltage at PCC2 before and after the protection action remains basically unaffected.
From the above analysis, it is evident that when a fault occurs in the middle section of the distribution line, the bus-side voltage is higher than the voltage at each PCC prior to the tripping of the SSP. Moreover, the voltages at the PCCs after the SSP is actioned will not exceed the voltages at the PCCs before the protection was actioned.
(3)
The Line End Fault
Depicted in Figure 5 is when a metallic 3PSC fault occurs at point F3 at the end of the line accessed by IIDERs and the simplified equivalent circuits of the DN before and after the system-side protective action. ZS is the equivalent internal resistance of the system, Z1 is the equivalent impedance from bus A to PCC1, Z2 is the equivalent impedance from PCC1 to PCC2, and Z3 is the equivalent impedance from PCC2 to PCC3.
When a 3PSC fault occurs at point F3, the bus-V UA is
U A = ( Z 1 + Z 2 + Z 3 ) E + Z S ( Z 2 + Z 3 ) I I I D E R 1 + Z S Z 3 I I I D E R 2 Z S + Z 1 + Z 2 + Z 3
The voltages at PCC1 and PCC2 prior to the action of the SSP are expressed as
U P C C 1 = ( Z 2 + Z 3 ) E + ( Z S + Z 1 ) ( Z 2 + Z 3 ) I I I D E R 1 Z S + Z 1 + Z 2 + Z 3 + ( Z S + Z 1 ) Z 3 I I I D E R 2 Z S + Z 1 + Z 2 + Z 3
U P C C 2 = Z 3 E + ( Z S + Z 1 ) Z 3 I I I D E R 1 + ( Z S + Z 1 + Z 2 ) Z 3 I I I D E R 2 Z S + Z 1 + Z 2 + Z 3
The voltages at PCC1 and PCC2 after the SSP action are expressed as
U P C C 1 = ( Z 2 + Z 3 ) I I I D E R 1 + Z 3 I I I D E R 2
U P C C 2 = Z 3 ( I I I D E R 1 + I I I D E R 2 )
Let
b 1 = ( Z 2 + Z 3 ) E + Z S [ ( Z 2 + Z 3 ) I I I D E R 1 + Z 3 I I I D E R 2 ]
b 1 = ( Z 2 + Z 3 ) I I I D E R 1 + Z 3 I I I D E R 2
The following equation could be obtained:
U A U P C C 1 = Z 1 E + b 1 Z 1 b 1 + b 1
The extreme case is selected for analysis. IIDER1 and IIDER2 are operating at the maximum capacity, and the line parameters are the same as in the previous section when a fault occurs at point F3 because b 1 max = 1.1 kV < E , so U A / U P C C 1 > 1 ; the same can be proved: U A / U P C C 2 > 1 . From the above analysis, it can be seen that, when a fault occurs at the end of the line, the bus-V is higher than the voltage at each PCC.
Let
b 2 = ( Z S + Z 1 ) [ ( Z 2 + Z 3 ) I I I D E R 1 + Z 3 I I I D E R 2 ]
b 2 = ( Z 2 + Z 3 ) I I I D E R 1 + Z 3 I I I D E R 2
The following equation could be obtained:
U P C C 1 U P C C 1 = ( Z 2 + Z 3 + Z 4 ) E + b 2 ( Z 2 + Z 3 + Z 4 ) b 2 + b 2
The extreme case is selected for analysis. The line parameters are the same as in the previous section, and both IIDER1 and IIDER2 are of maximum capacity, and when a fault occurs at point F3 because b 2 max = 1.1 kV < E , so U P C C 1 / U P C C 1 > 1 ; the voltage at PCC1 before the protection action on the system side is higher than the voltage at PCC1 after the protection action.
Let
b 3 = ( Z S + Z 1 ) Z 3 I I I D E R 1 + ( Z S + Z 1 + Z 2 ) Z 3 I I I D E R 2
b 3 = ( Z 2 + Z 3 ) I I I D E R 1 + Z 3 I I I D E R 2
b 4 = ( Z S + Z 1 ) I I I D E R 1 + ( Z S + Z 1 + Z 2 ) I I I D E R 2
b 4 = ( Z 2 + Z 3 ) I I I D E R 1 + Z 3 I I I D E R 2
The following equation could be obtained:
U P C C 2 U P C C 2 = ( Z 3 + Z 4 ) E + b 3 ( Z 3 + Z 4 ) b 3 + b 3
The same reasoning can be verified, that U P C C 2 / U P C C 2 > 1 . The aforementioned analysis demonstrates that, in the event of a fault occurring at the end of the distribution line, the bus-V is higher than the voltage at each PCC to the action of the SSP. Furthermore, following the SSP action, the voltage at each PCC will not surpass the voltage at each PCC before the protection was actioned.
When a 2PSC fault occurs in the system, the analysis process is similar to that of a 3PSC fault, and the voltage at each PCC after the SSP action will not exceed the voltage at each PCC before the SSP action [30], which will not be repeated here.

3.1.2. Fault in Feeder 1

As shown in Figure 2, when the fault occurs at the adjacent line F1 point, the voltage drops at bus A and PCCs. QF1 at the protection of the line outlet detects that the current is greater than the setting value and acts in trip, and the voltage of bus A resume. IIDERs remain connected to the power supply side of the main system, and the voltage at the PCCs resume.
In summary, it can be observed that in the case of a fault on the distribution line, according to the requirements for limiting the voltage offset caused by IIDER access, the following conclusions can be drawn: as the distance of the IIDER access from the busbar increases, the permissible capacity of the IIDER access decreases. The fault current output by the IIDER is limited, and the line impedance is small; the voltage on the system side is greater than the product of the fault current output by the IIDER and the line impedance. Consequently, when the arc at the fault point is not extinguished, under various scenarios (where the fault point location is more than 0.02 km from the bus and for countermeasures for distances less than 0.02 km; described in step (4) of Section 4), the voltage at the bus side of the reclosing AP is higher than the voltage at the PCC. Furthermore, the voltage at the PCC after the protection action on the system side will not exceed the voltage at the PCC before the SSP action. Therefore, the TLAR method proposed in this paper is feasible.

3.2. Fault Point Arc Extinction

The premise of the analysis and demonstration in the previous section is that the arc at the fault point is not extinguished. Existing studies have shown that the self-quenching current limit for a 10 kV system is 15A [7]. From this, it can be deduced that the minimum access capacity of IIDER, which meets the condition for self-clearing of transient faults, is 0.217 MW after the system’s side protection trip and under the condition of a 3PSC. Otherwise, when the access capacity of IIDER is less than 0.217 MW, the current at the fault point is less than 15 A, the arc at the fault point is extinguished, and IIDER and the local load form an unplanned island. In this scenario, there is a significant deviation between the output power of IIDER and the load power, and the load power factor is not 1. Consequently, the voltage and frequency will exhibit significant deviations. As a result, the AIP disconnected IIDER. The maximum action time for AIP is no more than 2 s, which is taken into consideration when setting the time-limited reclosing. Therefore, set the time-limited reclosing waiting time to 2 s to meet the matching requirements.

4. Implementation of Time-Limit Adaptive Reclosing
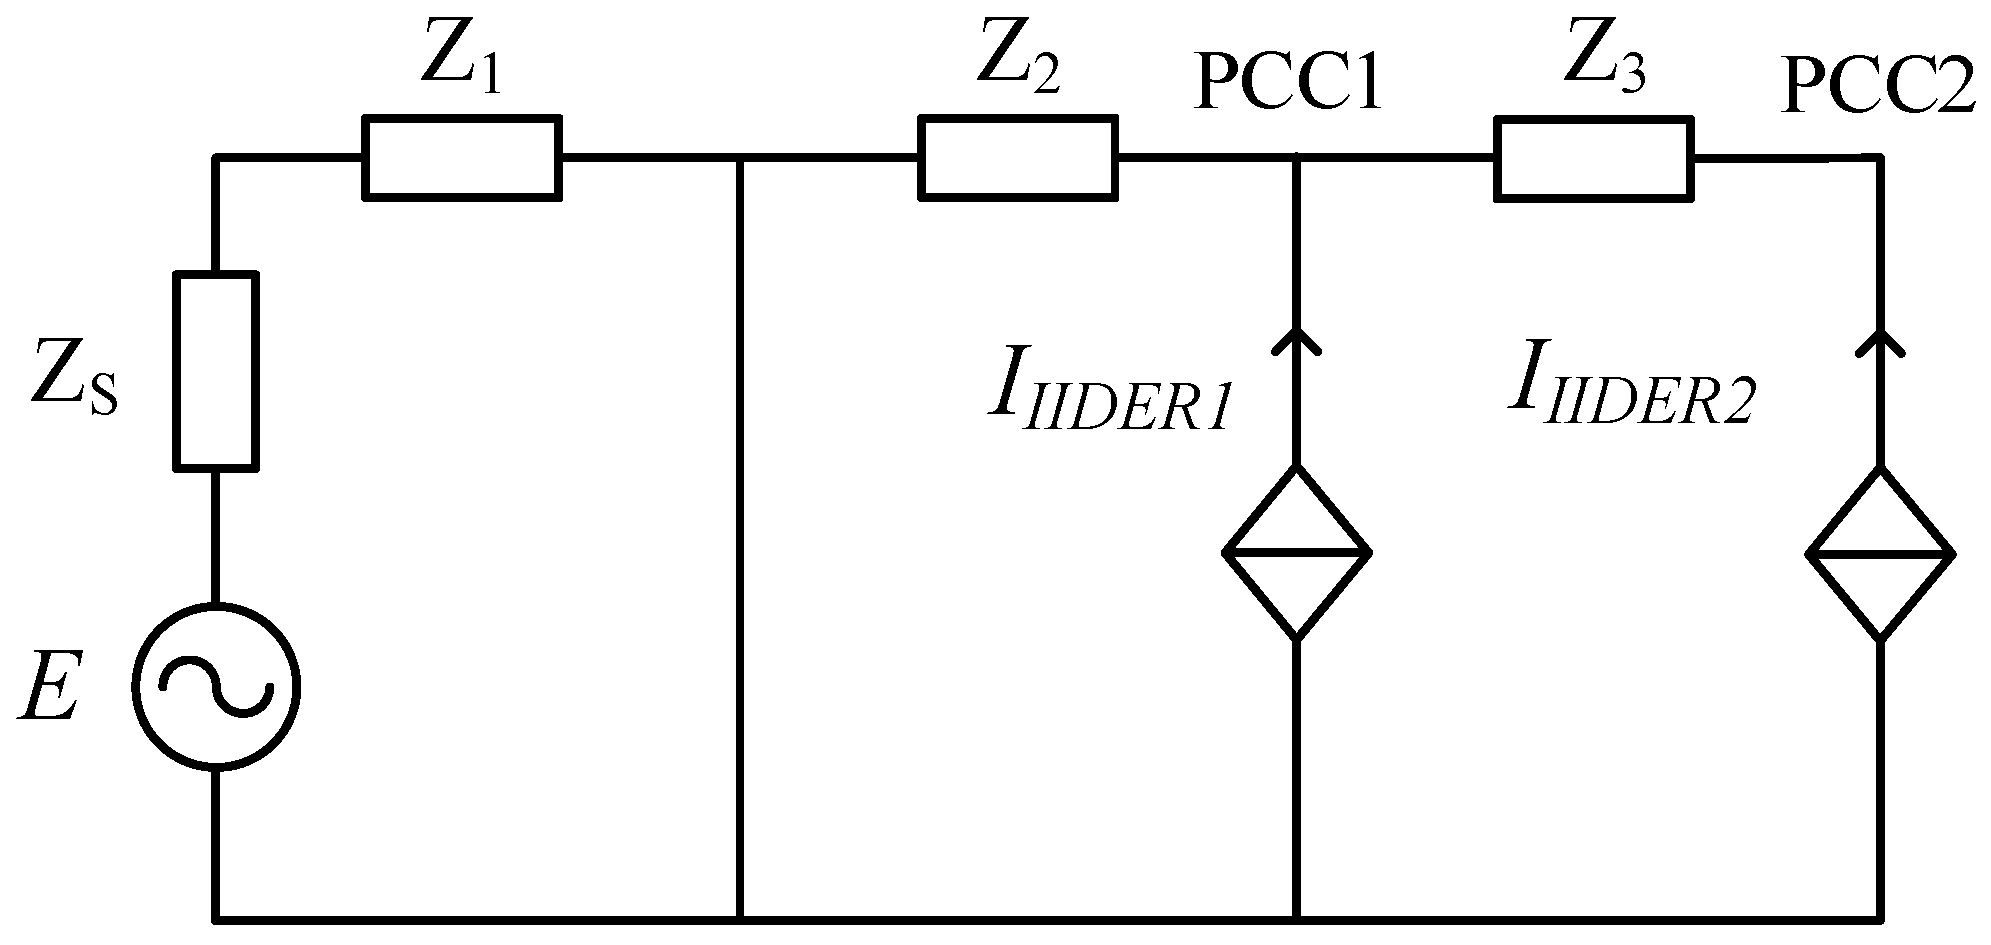
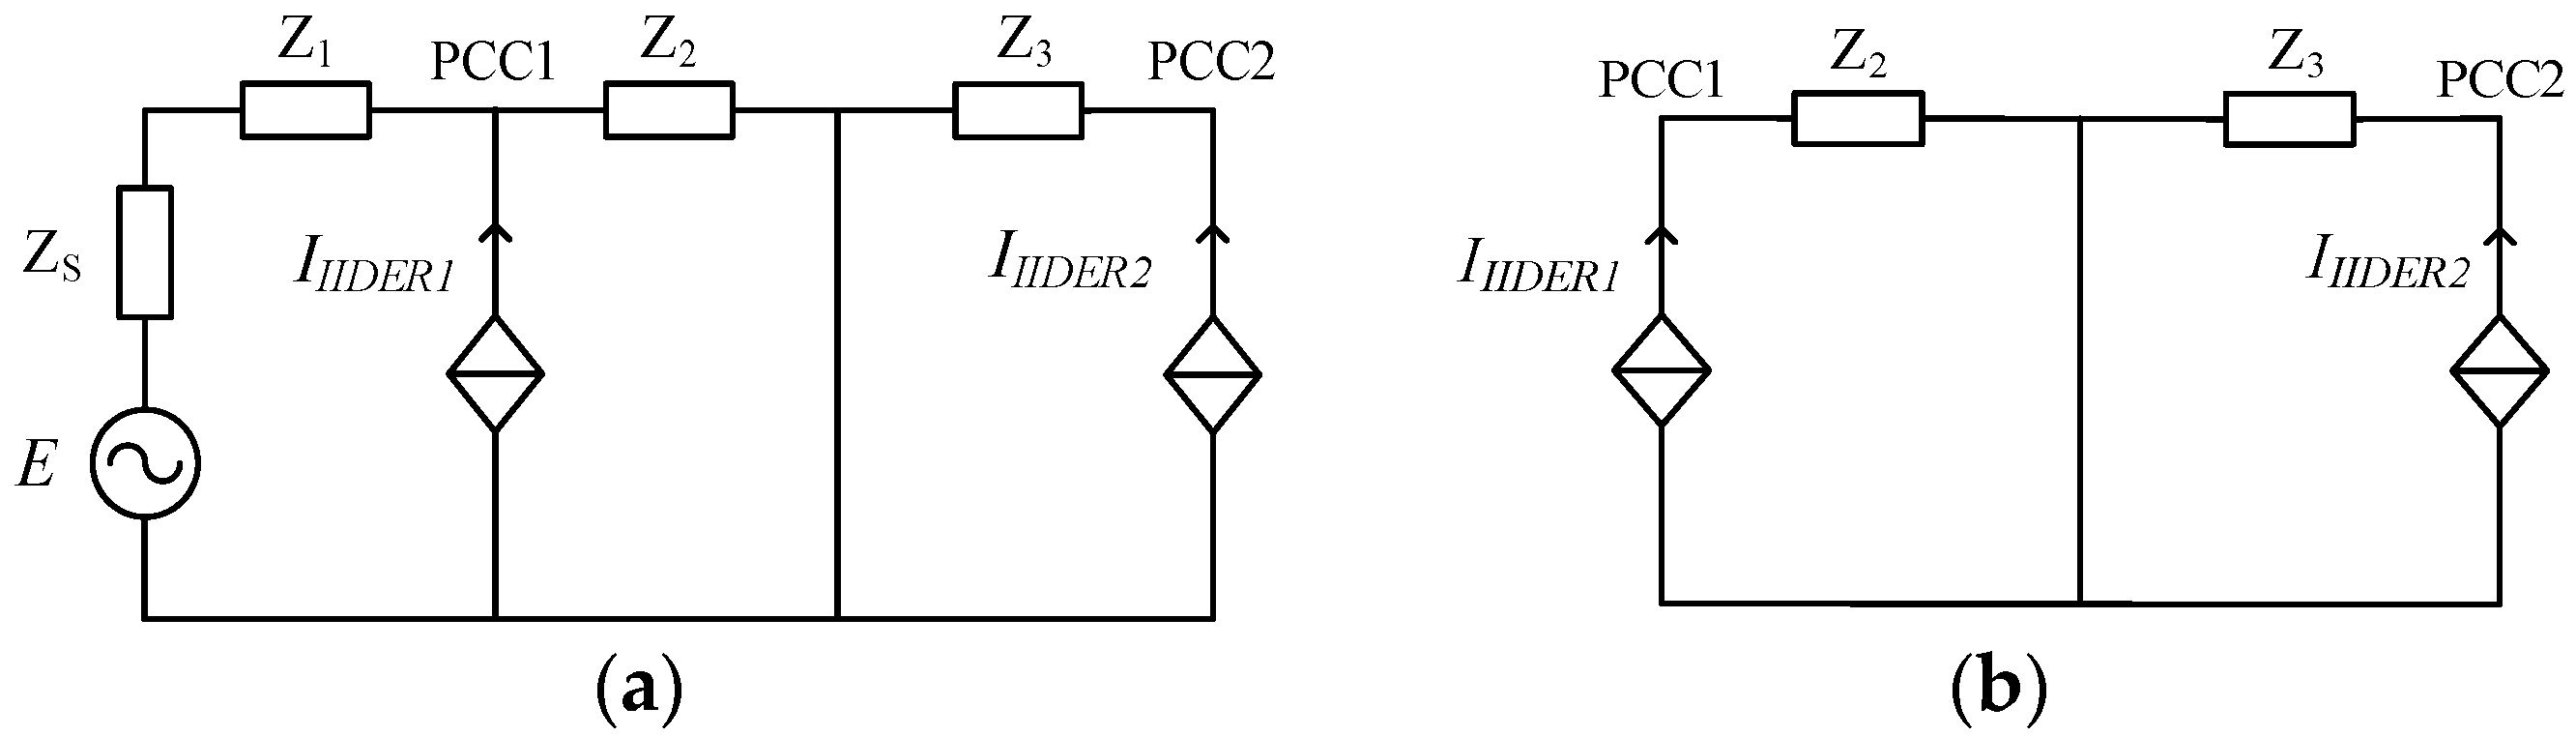
The implementation of the TLAR method can refer to the international standard IEEE 1547-2018, where IIDERs are pre-categorized based on their capacity and requirements for system stability support, etc. The scheduling agency then establishes low-voltage action time ratings for AIP for different categories of DERs. According to IEEE 1547-2018, IIDERs can be classified into three types based on their response to abnormal conditions in the regional distribution system. The specific response requirements of different types of IIDERs to low voltage at their grid connection points are detailed in Table 2, Table 3 and Table 4 [11].
When the voltage drops below 0.45 p.u., a fault ride through time of 0.16 s can be selected according to the regional power system dispatch requirements.
When the permeability of IIDER is high, it is assumed that there are three types of IIDERs connected to the distribution line. The specific implementation steps are as follows:
(1)
When the distribution line fails, both the main network side and the IIDERs simultaneously inject current into the fault point.
(2)
When the line outlet protection detects a fault, the protection action is to trip, and the IIDER connected to the distribution line carries out LVRT in accordance with the requirements for LVRT.
(3)
After the protection trip, automatic reclosing starts. The reclosing controller obtains the bus-V before the protection trip. The LVRT requirement of the IIDERs connected to the line has already been configured in the reclosing controller.
If the capacity of IIDER meets the self-extinguishing condition, take the action time of anti-island protection as t w = 2 s and skip to step (6); otherwise, go to step (4).
(4)
Set the reclosing waiting time based on the busbar voltage and the IIDER’s LVRT requirements.
Case a: If the bus-V meets 0.50 p . u . U 1 < 0.88 p . u . , according to IEEE 1547-2018, Class I IIDER will be taken off the grid after a maximum of 2 s of LVRT, Class II IIDER after a maximum of 10 s, and Class III IIDER after a maximum of 21 s. In this scenario, Class III IIDER requires the longest period of LVRT support and has the latest off-grid time. To ensure that all IIDERs are off-grid during reclosing, the waiting time for reclosing is set to match the longest off-grid time of Class III IIDER, which is 21 s.
Case b: If the bus-V meets 0.45 p . u . U 1 < 0.50 p . u . , according to IEEE 1547-2018, Class I IIDER will be taken off the grid after a maximum of 2 s of LVRT, Class II IIDER after a maximum of 10 s, and Class III IIDER also after a maximum of 10 s. In this case, both Class II and Class III IIDERs require the longest time of LVRT support and have the latest off-grid times. To ensure that all IIDERs are off-grid during reclosing, the reclosing waiting time is set to match the longest off-grid time of Class II and Class III IIDERs, which is 10 s.
Case 3: If the bus-V meets U 1 < 0.45 p . u . , according to IEEE 1547-2018, Class I IIDER will be taken off the grid after a maximum of 0.16 s of LVRT, Class II IIDER also after a maximum of 0.16 s, and Class III IIDER after a maximum of 2 s. In this case, Class III IIDER requires the longest time of LVRT support and has the latest off-grid time. To ensure that all IIDERs are off-grid during reclosing, the reclosing waiting time is set to match the longest off-grid time of Class III IIDERs, which is 2 s. Additionally, extreme scenarios where the fault location is less than 0.02 km from the busbar and the voltage at the PCC may be higher than the busbar voltage also meet the requirements.
(5)
Based on the results of Step (4), allocate the LVRT time for IIDER according to the bus-V, and ensure that all IIDERs are disconnected from the network when the designated time is reached.
(6)
To ensure reliability, the reclosing time is extended by 0.3 s based on the reclosing waiting time, accounting for the time consumed by circuit breaker resumption and arc quenching. Then, the required action waiting time for the final reclosing is
t r = t w + t s
where t r is the reclosing operation time and t s is the extended time, taking 0.3 s.
(7)
Preset delay time is up, reclosing action, control circuit breaker coincidence.
The workflow for adaptive reclosing is depicted in Figure 6.

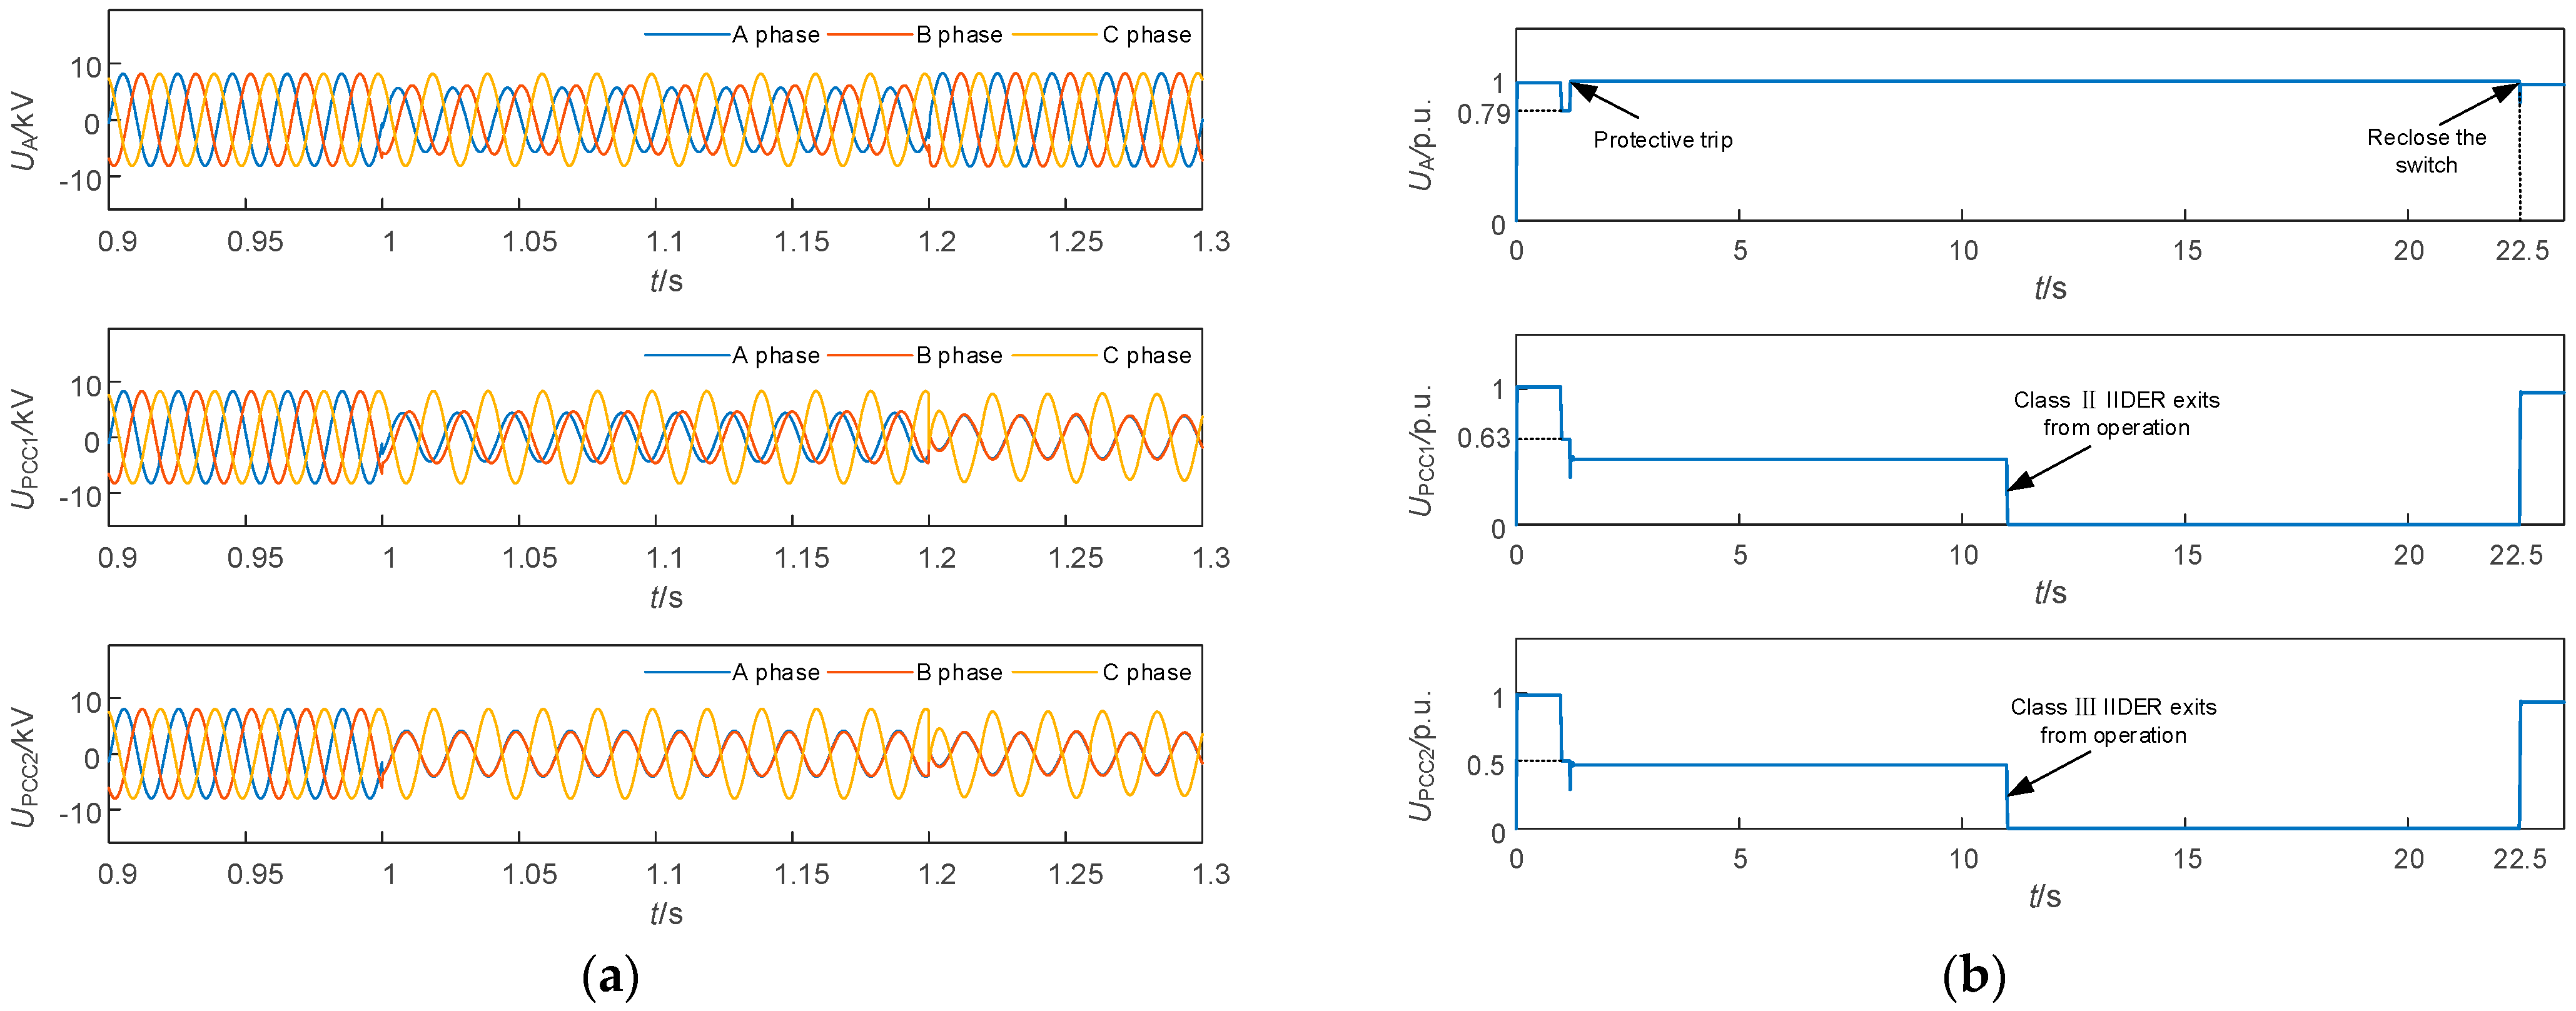
5. Simulation Verification

To verify the feasibility of the proposed TLAR method, a simulation model of the distribution line depicted in Figure 7 was constructed using PSCAD. The voltage level of the DN was set at 10 kV, with a transformer capacity of 40 MVA on the power supply side. The positive sequence impedance per unit length of the line was (0.13 + j0.35) Ω/km. Feeder 1 had a length of 3 km; the load LD1 at the end of this feeder had a capacity of 2 MW and a load power factor of 0.9. Feeder 2 was 8 km long, and its line exit circuit breaker QF2 was configured according to the method described in this paper. Loads LD2, LD3, and LD4 all had rated capacities of 2 MW and a load power factor of 0.9. The PCC1 was located 2 km from the line exit, while PCC2 was 5 km away. IIDER1 and IIDER2 had capacities of 4 MW and 1.6 MW, respectively. To better reflect the LVRT characteristics of IIDERs, IIDER1 and IIDER2 were chosen as Class III and Class II IIDERs, respectively.
Fault point F1 is set 0.3 km away from bus A, while fault point F2 is set 3 km away from bus A. AB two-phase and three-phase transient short-circuit faults are initiated at 1 s, respectively. Following the occurrence of a fault, the system-side circuit breaker trips at 0.2 s.
Taking the more common two-phase short circuit (2PSC) in DN phase-to-phase faults as an example, when such a fault occurs at F1 on the line equipped with IIDERs, the change curves of both the voltage at Bus A and the voltage at the PCCs are depicted in Figure 8. Specifically, Figure 8a depicts the variation curves of the phase voltages: UA at the bus side, UPCC1, and UPCC2. Figure 8b shows the variation curves of the per-unit values of the positive sequence voltages for UA, UPCC1, and UPCC2. These values are obtained by using the rated phase voltage as the reference and converting the measured positive sequence voltages accordingly. The results are consistent with those obtained using the measured line voltage and rated line voltage as references.
As can be seen from Figure 8, when a 2PSC fault occurs at point F1 at 1 s, the voltage at Bus A drops to 0.607 p.u., the voltage at PCC1 drops to 0.518 p.u., and the voltage at PCC2 drops to 0.515 p.u. The line protection QF2 trips at 1.2 s. According to the analysis in Section 4, this results in a reclosing waiting time of 21.3 s. Since the voltages at the PCCs are lower than that of the bus, in reality, approximately 10 s after the fault occurs, the AIPs of IIDER1 and IIDER2 are activated. Both IIDER1 and IIDER2 are disconnected from the grid, no longer supplying fault current to the fault point. Consequently, the arc is quickly extinguished, the insulation strength is restored, and the instantaneous fault disappears. The reclosing device waits for the predetermined time, then the control circuit breaker QF2 is reclosed, restoring power supply to the distribution line.
The variation curves of the voltage at Bus A and the voltage at the PCCs when a 2PSC fault occurs at F2 on the line with IIDERs are shown in Figure 9. Specifically, Figure 9a depicts the variation curves of the phase voltages: UA at the bus side, UPCC1, and UPCC2. Figure 9b shows the variation curves of the per-unit values of the positive sequence voltages for UA, UPCC1, and UPCC2. These values are obtained by using the rated phase voltage as the reference and converting the measured positive sequence voltages accordingly. The results are consistent with those obtained using the measured line voltage and rated line voltage as references. As can be seen from Figure 9, when a 2PSC fault occurs at point F2 at 1 s, the voltage at Bus A drops to 0.79 p.u., the voltage at PCC1 drops to 0.63 p.u., and the voltage at PCC2 drops to 0.5 p.u. The line protection QF2 trips at 1.2 s. According to the analysis in Section 4, this results in a reclosing waiting time of 21.3 s. Due to the voltage at the PCCs being lower than that of the bus, in reality, approximately 10 s after the fault occurs, the AIPs of IIDER1 and IIDER2 are activated.
Table 5 displays reclosing time under different failure conditions, and Table 6 displays Bus-V and PCC voltages.
The aforementioned simulation results indicate that in the event of a 2PSC fault in the line, the voltage drop is relatively minor. Furthermore, as the fault point moves farther away from the bus, the bus-V drop diminishes, resulting in a longer IIDER LVRT time and a correspondingly longer reclosing time. Conversely, in the case of a 3PSC fault, the voltage drop is more significant, leading to a shorter IIDER LVRT time and a relatively shorter reclosing time. According to IEEE 1547-2018, the reclosing action time ranges from a minimum of 2.3 s to a maximum of 21.3 s across various scenarios. While the voltage protection action time limit specified in IEEE 1547-2018 can extend up to 1000 s, the method proposed in this paper can significantly reduce the reclosing waiting time. In practical engineering applications, the reclosing waiting time can be adjusted based on the actual configuration of the DER’s AIP.

6. Conclusions

This paper examines the impact of IIDER access with LVRT capability on DN reclosing. It proposes a TLAR method that achieves adaptability through timed coordination between reclosing and IIDER AIP. This method, which does not require the addition of LSVTs, is independent of communication networks, straightforward to implement, cost-effective, and ensures that DERs can both disconnect from the grid in the event of distribution line failures and reduce reclosing waiting times. If the AIP setting value is determined according to IEEE 1547-2018, simulation results indicate that, in some cases, the proposed time-limited adaptive reclosing method can reduce the reclosing waiting time by 19 s compared to the delay coordination automatic reclosing method. Furthermore, it provides frequency and voltage support during power system disturbances, thereby ensuring the safe and stable operation of the new distribution system that incorporates large-scale DERs.
The proposed method has undergone simulation validation but has not yet been tested in real-world scenarios. It is specifically applicable to situations where IIDERs utilize low voltage protection to achieve anti-islanding protection (AIP). In these cases, IIDERs set the low voltage ride through (LVRT) time based on the voltage drop severity, as stipulated by regulations. Future practical applications of this method could lead to further improvements.

Author Contributions

Conceptualization, F.Y., B.X. and K.F.; methodology, Y.C. (Yu Chen) and H.C.; software, K.F.; validation, K.F.; writing—original draft preparation, K.F.; writing—review and editing, K.F. and H.C.; project administration, H.C.; funding acquisition, F.Y., Y.C. (Yong Cai) and Z.Y. All authors have read and agreed to the published version of the manuscript.

Funding

This research was funded by the State Grid Hubei Electric Power Co., Ltd. (52153222001F).

Data Availability Statement

The data presented in this study are available on request from the corresponding author.

Conflicts of Interest

Authors Fan Yang, Hechong Chen, Yong Cai and Zhichun Yang were employed by the company State Grid Hubei Electric Power Research Institute. The remaining authors declare that the research was conducted in the absence of any commercial or financial relationships that could be construed as a potential conflict of interest.

References

  1. Yousaf, M.; Jalilian, A.; Muttaqi, K.M.; Sutanto, D. An Adaptive Overcurrent Protection Scheme for Dual-Setting Directional Recloser and Fuse Coordination in Unbalanced Distribution Networks With Distributed Generation. IEEE Trans. Ind. Appl. 2022, 58, 1831–1842. [Google Scholar] [CrossRef]
  2. Wheeler, K.A.; Elsamahy, M.; Faried, S.O. A Novel Reclosing Scheme for Mitigation of Distributed Generation Effects on Overcurrent Protection. IEEE Trans. Power Deliv. 2018, 33, 981–991. [Google Scholar] [CrossRef]
  3. Abbaspour, E.; Fani, B.; Sadeghkhani, I.; Alhelou, H.H. Multi-Agent System-Based Hierarchical Protection Scheme for Distribution Networks With High Penetration of Electronically-Coupled DGs. IEEE Access 2021, 9, 102998–103018. [Google Scholar] [CrossRef]
  4. Sahebkar Farkhani, J.; Najafi, A.; Zareein, M.; Godina, R.; Rodrigues, E.M.G. Impact of Recloser on Protecting Blind Areas of Distribution Network in the Presence of Distributed Generation. Appl. Sci. 2019, 9, 5092. [Google Scholar] [CrossRef]
  5. Xu, B.; Li, T.; Xue, Y. Relaying Protection and Automation of Distribution Networks; Electric Power Press: Beijing, China, 2017. [Google Scholar]
  6. Yuehua, W.U.; Houlei, G.; Bin, X.U.; Gengqiang, K.; Zhigang, W.; Ning, W. Distributed fault self-healing scheme and its implementation for active distribution network. Autom. Electr. Power Syst. 2019, 43, 140–146. [Google Scholar]
  7. Xianglian, Y.; Weijiang, C.; Ziming, H. Experimental research on self-extinction behavior of arc caused by single-phase earth fault in 10kV distribution network. Power Syst. Technol. 2008, 32, 25–28+34. [Google Scholar]
  8. Yousaf, M.; Muttaqi, K.M.; Sutanto, D. Improvement of Transient Stability of the Power Networks by an Intelligent Autoreclosing Scheme in the Presence of Synchronous-Based DGs. IEEE Trans. Ind. Appl. 2022, 58, 1783–1796. [Google Scholar] [CrossRef]
  9. Han, B.; Li, H.; Wang, G.; Zeng, D.; Liang, Y. A Virtual Multi-Terminal Current Differential Protection Scheme for Distribution Networks With Inverter-Interfaced Distributed Generators. IEEE Trans. Smart Grid 2018, 9, 5418–5431. [Google Scholar] [CrossRef]
  10. Jian, L.; Tao, L.; Long, L.; Bingbing, S.; Xiangqian, T.; Zhihua, Z. Adaptability of distribution automation systems to photovoltaic installation. Power Syst. Prot. Control 2014, 42, 7–12. [Google Scholar]
  11. IEEE Std 1547TM-2018; IEEE Standard for Interconnection and Interoperability of Distributed Energy Resources with Associated Electric Power Systems Interfaces Standard. IEEE: Piscataway, NJ, USA, 2018.
  12. Zhang, T.; Cao, W.; Zhao, J. A new islanding cutting off strategy based on complex priority index. In Proceedings of the 43rd Annual Conference the IEEE Industrial Electronics, Madrid, Spain, 14–17 October 2017; pp. 2350–2355. [Google Scholar]
  13. Martínez-Lucas, G.; Sarasúa, J.I.; Sánchez-Fernández, J.Á.; Wilhelmi, J.R. Frequency control support of a wind-solar isolated system by a hydropower plant with long tail-race tunnel. Renew. Energy 2016, 90, 362–376. [Google Scholar]
  14. Lin, D.; Wang, H.; Lin, D.; He, B. An adaptive reclosure scheme for parallel transmission lines with shunt reactors. IEEE Trans. Power Deliv. 2015, 30, 2581–2589. [Google Scholar] [CrossRef]
  15. Xie, C.; Li, F. Adaptive comprehensive auto-reclosing scheme for shunt reactor-compensated transmission lines. IEEE Trans. Power Deliv. 2020, 35, 2149–2158. [Google Scholar] [CrossRef]
  16. Xu, K.; Zhang, Z.; Lai, Q.; Yin, X.; Liu, H.; Liu, W. Study on Three-Phase Reclosing Strategy Applicable to Tie Line of Photovoltaic Power Station. IEEE Access 2020, 8, 36997–37013. [Google Scholar] [CrossRef]
  17. Choi, J.-H.; Nam, S.-R.; Nam, H.-K.; Kim, J.-C. Adaptive protection schemes of Distributed Generation at distribution network for automatic reclosing and voltage sags. In Proceedings of the IEEE International Conference on Sustainable Energy Technologies, Singapore, 24–27 November 2008; pp. 810–815. [Google Scholar]
  18. Seo, H.-C.; Ko, Y.-T.; Rhee, S.-B.; Kim, C.-H.; Aggarwal, R.K. A novel reclosing algorithm considering the recovery time of a superconducting fault current limiter in a distribution system with distributed generation. In Proceedings of the 10th IET International Conference on Developments in Power System Protection, Manchester, UK, 29 March–1 April 2010; pp. 1–5. [Google Scholar]
  19. Ishchenko, D.; Oudalov, A.; Stoupis, J.; Mohagheghi, S. Adaptive auto-reclosing based on DER connectivity data with IEC 61850. In Proceedings of the IEEE Power & Energy Society General Meeting, National Harbor, MD, USA, 27–31 July 2014; pp. 1–5. [Google Scholar]
  20. International Standard IEC 61850-7-4; Communication Networks and Systems in Substations–Part 7-4: Basic Communication Structure for Substation and Feeder Equipment–Compatible Logical Node Classes and Data Classes, Second Edition. IEC: Geneva, Switzerland, 2010.
  21. Yuqiang, L.; Zhiwen, W.; Weiqing, W.; Qin, C. Influence of PV with LVRT capability access to distribution network on automatic reclosing and its countermeasures. Power Syst. Prot. Control 2016, 44, 61–67. [Google Scholar]
  22. Seo, H.C.; Kim, C.H. An Adaptive Reclosing algorithm considering distributed generation. Int. J. Control Autom. Syst. 2008, 6, 131–140. [Google Scholar]
  23. Xiaojing, D.; Zhao, X.; Rixin, Y. Influence of 10 kV DG Integration on Relay Protection in Distribution Network. Smart Power 2019, 47, 117–122. [Google Scholar]
  24. Zheng, X.; Chao, C.; Weng, Y.; Ye, H.; Liu, Z.; Gao, P.; Tai, N. High-Frequency Fault Analysis-Based Pilot Protection Scheme for a Distribution Network With High Photovoltaic Penetration. IEEE Trans. Smart Grid 2023, 14, 302–314. [Google Scholar] [CrossRef]
  25. Li, Y.; Song, G.; Wang, W.; Cao, Q. Permanent fault identification method based on parameter identification for photovoltaic access to distribution network. Power Syst. Prot. Control 2017, 45, 1–7. [Google Scholar]
  26. Yuan, B.; Zhang, B.; Hao, Z.; Zhang, J.; Wang, X.; Bo, Z. A study on auto-reclosing strategy for large-scale wind farm transmission line. In Proceedings of the 2014 International Conference on Power System Technology, Chengdu, China, 20–22 October 2014; pp. 2827–2832. [Google Scholar]
  27. Aloghareh, F.H.; Shams, M.; Jannati, M. An efficient deep learning based scheme for adaptive auto-reclosing in power transmission lines. Alex. Eng. J. 2024, 102, 327–338. [Google Scholar] [CrossRef]
  28. Coffele, F.; Booth, C.; Dyśko, A. An Adaptive Overcurrent Protection Scheme for Distribution Networks. IEEE Trans. Power Deliv. 2015, 30, 561–568. [Google Scholar] [CrossRef]
  29. Zhang, H.; Li, Y. Short-circuit current analysis and current protection setting scheme in distribution network with photovoltaic power. Power Syst. Technol. 2015, 39, 2327–2332. [Google Scholar]
  30. Wang, C.; Xu, H.; Yang, F.; Yang, Z.; Chen, H.; Chen, Y.; Xu, B. Anti-islanding protection technology and development of distribution systems. Distrib. Util. 2023, 11, 2–8+22. [Google Scholar]
Figure 1. Schematic diagram of a DN integrating an IIDER.
Processes 12 02781 g001
Figure 2. Structural diagram of an active distribution line with multiple IIDERs.
Processes 12 02781 g002
Figure 3. Equivalent circuit diagram of a three-phase metallic short-circuit fault at point F1.
Processes 12 02781 g003
Figure 4. Equivalent circuit diagram in the case of failure at point F2. (a) before SSP action; (b) after SSP action.
Processes 12 02781 g004
Figure 5. Equivalent circuit diagram in the case of failure at point F3 (a) before SSP action and (b) after SSP action.
Processes 12 02781 g005
Figure 6. Flowchart of adaptive reclosing for distribution lines with three types of IIDERs.
Processes 12 02781 g006
Figure 7. Structure diagram of active distribution lines with multiple IIDERs access.
Processes 12 02781 g007
Figure 8. Voltage change curves at the bus and PCCs when a 2PSC fault occurs at F1: (a) phase voltage variation graph; (b) positive sequence voltage variation graph.
Processes 12 02781 g008
Figure 9. Voltage change curves of the bus and PCCs when a 2PSC fault occurs at F2: (a) phase voltage variation graph; (b) positive sequence voltage variation graph.
Processes 12 02781 g009
Table 1. Acronyms.
Table 1. Acronyms.
AcronymFull NameAcronymFull Name
DERdistributed energy resourceAIPanti-islanding protection
IIDERinverter-interfaced distributed energy resourceLVRTlow voltage ride through
TLARtime-limited adaptive reclosingDNdistribution network
PCCpoint of common couplingSC-cur.short-circuit current
3PSCthree-phase short-circuitAPaccess point
SSPsystem-side protectionbus-Vbus voltage
LSVTline-side voltage transformer2PSCtwo-phase short circuit
Table 2. DER response (shall trip) to abnormal voltages for DER of abnormal operating performance Category I.
Class I IIDER Trip Time
Shall Trip
Function
Default SettingRanges of Allowable Settings
Voltage (p.u.)Clearing Time (s)Voltage (p.u.)Clearing Time (s)
UV10.702.00.0–0.882.0–21.0
UV20.450.160.0–0.500.16–2.0
Table 3. DER response (shall trip) to abnormal voltages for DER of abnormal operating performance Category II.
Class II IIDER Trip Time
Shall Trip
Function
Default SettingRanges of Allowable Settings
Voltage (p.u.)Clearing Time (s)Voltage (p.u.)Clearing Time (s)
UV10.7010.00.0–0.882.0–21.0
UV20.450.160.0–0.500.16–2.0
Table 4. DER response (shall trip) to abnormal voltages for DER of abnormal operating performance Category III.
Class III IIDER Trip Time
Shall Trip
Function
Default SettingRanges of Allowable Settings
Voltage (p.u.)Clearing Time (s)Voltage (p.u.)Clearing Time (s)
UV10.8821.00.0–0.8821.0–50.0
UV20.502.00.0–0.502.0–21.0
Table 5. Reclosing time under different failure conditions.
Fault TypeIIDER Offline Time/sReclosing Time/s
IIDER1IIDER2
F1 2PSC101021.3
F1 3PSC0.160.162.3
F2 2PSC101021.3
F2 2PSC0.160.1621.3
Table 6. Bus-V and PCC voltage.
Fault TypeBus-V Before SSP/p.u.Voltage of PCCs Before the SSP Action/p.u.Voltage of PCCs After the SSP Action/p.u.
IIDER1IIDER2IIDER1IIDER2
F1 2PSC0.6070.5180.5150.4510.452
F1 3PSC0.1920.0420.0610.0420.061
F2 2PSC0.7900.6310.5030.4820.469
F2 3PSC0.6400.2460.0150.0190.015
Disclaimer/Publisher’s Note: The statements, opinions and data contained in all publications are solely those of the individual author(s) and contributor(s) and not of MDPI and/or the editor(s). MDPI and/or the editor(s) disclaim responsibility for any injury to people or property resulting from any ideas, methods, instructions or products referred to in the content.

