Article

Experimental and Numerical Simulation of Flow Modes in Flow Focusing/Blurring Nozzle

1
School of Engineering, Zunyi Normal University, Zunyi 563006, China
2
School of Mechanical, Electronic and Control Engineering, Beijing Jiaotong University, Beijing 100044, China
*
Author to whom correspondence should be addressed.
Processes 2024, 12(12), 2751; https://doi.org/10.3390/pr12122751
Submission received: 8 November 2024 / Revised: 28 November 2024 / Accepted: 2 December 2024 / Published: 4 December 2024
(This article belongs to the Section Process Control and Monitoring)

Abstract

:
The flow mode of the flow focusing/blurring nozzle was studied through experimental and numerical simulation methods. The experimental results indicate that the flow mode of the nozzle can be classified into flow focusing, transition, and flow blurring based on the location of the liquid jet breakup. Numerical simulation studies have found that the transformation of flow mode is mainly related to viscous shear force, gas pressure on the jet surface, and liquid inertia force. The increase in the gas flow rate changes the flow mode by affecting the viscous shear force. The increase in the liquid flow rate changes the flow mode by affecting the liquid inertial force. When the liquid flow rate is high, the increase in the liquid flow rate affects the flow mode by affecting the gas pressure on the jet surface. The study also found that excessive gas flow rates can hinder the flow of liquid inside the nozzle, while excessive liquid flow rates can hinder the breakup of liquid inside the nozzle. Therefore, the normal operation of the flow focusing/blurring nozzle requires ensuring that the gas and liquid flow rates are within the normal range.

1. Introduction

The flow focusing/blurring nozzle proposed by Gañán-Calvo [1,2] has a simple structure, but can work in different flow modes. Therefore, it has broad application prospects in the field of micro droplet preparation and liquid atomization. The flow focusing/blurring nozzle is usually composed of concentric circular tubes, with a two-phase mixing zone inside the nozzle. Gas and liquid fluids interact in the mixing zone inside the nozzle and are ejected together from the nozzle. When a conical liquid jet can be observed in the mixing zone of the nozzle, the outside of the nozzle usually exhibits droplet flow, that is, flow focusing mode, which is mainly used for the preparation of micro droplets. When the liquid jet in the mixing zone of the nozzle experiences breakup, the liquid fluid outside the nozzle usually shows obvious atomization, that is, flow blurring mode, which is mainly used for liquid atomization. It has important application prospects in the fields of small aviation engines, diesel engine energy conservation, and emission reduction [3,4,5].
Many researchers have studied the working characteristics of the flow focusing/blurring nozzle. For the flow focusing mode, the research of Raven and Seo [6,7] show that the liquid flow rate mainly affects the frequency of droplets generated by the nozzle, while the gas flow rate mainly affects the size and shape of droplets generated by the nozzle. Jensen [8,9] gives the empirical relationship between the flow parameters, structural parameters, and droplet size through the numerical simulation method. Mu’s numerical analysis research [10,11] shows that the characteristics of droplets generated by the nozzle can be controlled by the external disturbance added at the orifice outlet. The disturbance frequency and amplitude can accurately control the droplet size. For the flow blurring mode, the experimental research of Simmons and other researchers [12,13,14,15] shows that when glycerol or vegetable oil is used as the working fluid, the combustion and emission characteristics of the nozzle are similar to diesel, that is, this nozzle has a good atomization effect on high viscosity liquid. The experimental studies of Modestolópez and Qavi [16,17] show that the increase in the gas flow rate will promote the secondary breakup of droplets outside the nozzle, so as to reduce the average particle size of atomized droplets. The experimental study of De Azevedo and Sadasivuni [18,19] shows that the structural parameters also have an important influence on the spray characteristics of the flow focusing/blurring nozzle. The conical orifice is most conducive to the atomization of the liquid, and the atomization effect is better when the tube hole distance is small. Band’s experimental research [20] shows that, when compared with other nozzles, the flow focusing/blurring nozzle can maintain a better atomization effect on non-Newtonian fluids in a larger range of gas and liquid flow rates. Nayer Nasim’s numerical simulation research [21] shows that the decrease in tube hole distance will lead to an increase in air momentum inside the nozzle, enhance gas–liquid interaction, and promote liquid atomization.
Although there is currently some understanding of the working characteristics of the flow focusing/blurring nozzle under different flow modes through research, it is more important to effectively control their operation under the desired flow mode in practical nozzle applications. Therefore, many researchers have studied the flow modes of flow focusing/blurring nozzle. Most researchers believe that the nozzle will work in flow focusing or flow blurring mode, but some researchers [22,23] have found that there are other flow modes in the nozzle, such as turbulent flow focusing mode. Herrada’s numerical simulation research [24] shows that the flow blurring mode occurs when the ratio of tube hole distance to orifice diameter (H/D) is below 0.25, and the instability of the liquid recirculation cell inside the nozzle is the reason for the occurrence of the flow blurring mode. Montanero’s numerical simulation study [25] shows that for low viscosity liquids, the instability of the internal recirculation cell of the nozzle is the reason for the occurrence of the flow blurring mode, but not for high viscosity liquids. Murugan’s experimental and numerical simulation studies [26,27,28] have shown that the radial flow of gas in the mixing zone results in a reverse flow towards the inner tube when it meets the liquid jet, enhancing gas–liquid interaction and leading to flow blurring. The study also found that by controlling the flow parameters, the flow blurring mode can also be realized when H/D is 0.6. These research results indicate that the classification of flow modes and the criteria and mechanisms for flow mode transitions in the flow focusing/blurring nozzle are still not fully understood, which hinders the practical application of this nozzle.
In this paper, the flow mode and its transformation mechanism of the flow focusing/blurring nozzle will be studied through experimental and numerical simulation methods. Section 2 and Section 3, respectively, introduced the experimental platform and simulation methods, while Section 4 discussed the experimental and simulation results. In Section 4.1, a more reasonable flow mode classification method that comprehensively considers the flow morphology inside and outside the nozzle was proposed based on experimental results, and the relationship between flow parameters, structural parameters, and flow modes was qualitatively studied using a flow mode map. In Section 4.2, the gas–liquid interaction force inside the nozzle was analyzed using numerical simulation methods, and the mechanism of the flow mode transition was studied based on the gas–liquid interaction force. In Section 4.3, we further investigate the gas and liquid flow conditions for the normal operation of the flow focusing/blurring nozzle through numerical simulation methods. A summary of the research results is provided in Section 5. This study will further deepen our understanding of the flow modes and their transformations in the flow focusing/blurring nozzle and provide preliminary design criteria for their practical applications.

2. Experimental Facility

2.1. Experimental Nozzle

The structure of the flow focusing/blurring nozzle is relatively simple, as shown in Figure 1a. The liquid working fluid enters the nozzle from the inner tube located in the center of the nozzle, and the gas auxiliary fluid enters the nozzle from the periphery of the inner tube. The gas and liquid fluid interact at the inner tube outlet. The flow mode provides a clear indication of the gas–liquid interaction. Therefore, to further study the gas–liquid flow inside the flow focusing/blurring nozzle, we expanded the mixing zone and the orifice to some extent and designed a modular flow focusing/blurring nozzle for the experiment. Figure 1b illustrates the structure of the designed nozzle.
The nozzle consists of three modules: a liquid-phase delivery inner tube (I), a nozzle support body (II), and a two-phase mixing part (III). The main body of the nozzle is made of aluminum alloy, and the three modules are connected by pipe threads, which not only ensure the nozzle’s sealing properties, but also allow for the adjustment of the tube hole distance according to specific needs. The two-phase mixing part is made of plexiglass, enabling the visualization of gas–liquid flow in the mixing zone and orifice.
The liquid-phase and gas-phase fluid used in the experiment were water and air, respectively. The inner tube diameter (D) of the designed experimental nozzle is fixed at 5 mm, while the tube hole distance, orifice diameter, and orifice length are variable. According to the needs of this study, different two-phase mixing parts were designed with orifice diameters (Dh) of 3 mm, 5 mm, and 7 mm and orifice lengths (lh) of 5 mm, 10 mm, and 15 mm, respectively. By adjusting the pipe thread between the nozzle support body and two-phase mixing part, the tube hole distance can be changed within the range of 1 mm to 5 mm.

2.2. Experimental Equipment

The schematic diagram of the experimental equipment is presented in Figure 2. The liquid was injected into the nozzle from a tank through a rotameter (accuracy is ±1.5%) and check valve. The gas path followed a similar setup to the liquid path, but the power source was an air compressor. The rotameter controlled the gas and liquid flow rates. The gas flow rate ranged from 10 to 100 L/min, while the liquid flow rate ranged from 100 to 1000 mL/min. The check valve prevented the backflow of gas and liquid fluids during the experiment.
A high-speed camera (FASTCAM Mini UX100, PHOTRON LIMITED, Tokyo, Japan) was used to capture the gas–liquid flow images inside the nozzle. The light source was positioned relative to the high-speed camera to enhance the clarity of the captured images, and a computer was employed to control the camera and process the experimental images. A white, parallel, soft light source was utilized to avoid reflection from the plexiglass material, which might otherwise affect the experimental observation.
For each set of experiments, the gas injection and liquid supply flow rates were adjusted to create different two-phase flow conditions. The water pump and air compressor were activated to mix the two fluid. The pipelines were inspected to ensure there were no leaks. Subsequently, the gas and liquid flow rates were gradually and smoothly adjusted to the experimentally specified values. Once the experimental conditions reached a steady state for approximately 1 min, the experimental data, including the gas/liquid injection flow rates, two-phase flow images, and other relevant parameters, were recorded using the facilities and instruments described earlier.

3. Numerical Simulation Model

Many researchers have conducted numerical simulation studies on the flow focusing/blurring nozzle, and the methods used and important findings obtained are shown in Table 1. Referring to the choices of most researchers and the experience of our research group, commercial software Fluent v.6.3 was chosen for the numerical simulation work of this study.
The numerical simulation method was primarily employed to calculate the gas and liquid flow parameters inside the nozzle, aiming to analyze the gas–liquid interaction under different conditions. Accordingly, the mixing zone and orifice region of the flow focusing/blurring nozzle were selected as the calculation domain and were subsequently meshed. The calculation domain and grid division are shown in Figure 3. Due to the small size of the calculation domain, the same size grid is used to divide the calculation domain, and the grid size is 0.01 mm × 0.01 mm.
Considering the requirements of calculation accuracy and referring to the methods adopted by existing researchers in Table 1, the large eddy simulation method is used to solve the governing equations. Large-scale vortices in the flow field were directly resolved using the governing equation, while small-scale vortices were modeled using the subgrid stress model. The continuity equation, momentum equation, and subgrid stress equation of the large eddy simulation are provided in Equations (1)–(3).
x i ρ ¯ u ¯ i = 0
t ρ ¯ u ¯ i + x j ρ ¯ u ¯ i u ¯ j = x j σ i j p ¯ x i τ i j x j + ρ ¯ g + F
τ i j = 1 3 τ k k δ i j 2 μ t s ¯ i j
where ρ represents the fluid density, p denotes pressure, g is gravitational acceleration, τij refers to the stress tensor, and F represents the surface tension, which is calculated based on the CSF model.
As shown in Table 1, in order to ensure accurate capture of the gas–liquid interface, the VOF method was employed to track the gas–liquid interface. In this method, the coupling of gas and liquid phases is described using the phase volume function α. The phase volume function α satisfies the relationship expressed in Equation (4).
α t + α u = 0
Therefore, the fluid density and viscosity were calculated by Equations (5) and (6).
ρ = α ρ l + ( 1 α ) ρ g
μ = α μ l + ( 1 α ) μ g
In the numerical simulation, the two-phase inlet boundary condition was set as a velocity inlet boundary condition, while the outlet boundary condition was set as a pressure outlet boundary condition. The wall of the orifice was modeled using a non-slip boundary condition. The pressure solution was obtained using the PISO method, and the momentum equation was discretized by the second-order upwind scheme. These settings refer to the choices of existing researchers in Table 1 and are determined based on the experience and preliminary calculations of our research group.
Figure 4 illustrates the comparison between the experimental result and numerical simulation result for the jet diameter under the flow focusing (Dh = 5 mm, H = 5 mm, Ql = 100 mL/min, lh = 10 mm) mode and the breakup length under the transition mode (Dh = 5 mm, H = 1 mm, Ql = 1000 mL/min, lh = 10 mm).
As shown in Figure 4, the jet diameter under the flow focusing mode and the breakup length under the transition mode obtained by the numerical simulation method are in close agreement with the experimental result. This demonstrates that the numerical simulation model established in this study is both reliable and feasible for investigating the gas–liquid flow and interaction inside the nozzle.

4. Results and Discussions

4.1. Experimental Study on Flow Modes Inside the Nozzle

Flow and structural parameters play a critical role in influencing the gas–liquid flow morphology and flow modes inside the flow focusing/blurring nozzle. Figure 5 presents the flow mode inside the nozzle, obtained by the experimental method under various flow and structural parameters. The orifice length is 10 mm and the orifice diameter is 5 mm, both of which remain unchanged.
As shown in Figure 5, the flow modes inside the nozzle exhibit significant differences under varying conditions. From the perspective of liquid jet breakup, the flow modes can be roughly classified into three types: flow focusing, transition, and flow blurring. When the gas–liquid interaction is weak, the liquid jet inside the nozzle remains intact, and the flow mode assumes a flow focusing mode (Figure 5a,b). In this mode, the difference in flow morphology inside the nozzle is primarily reflected in the diameter and stability of the jet. As the gas–liquid interaction strengthens, the liquid jet in the orifice begins to break up, and the flow mode become a transition mode (Figure 5c,d). In the transition mode, the primary difference in flow morphology is characterized by the position of the jet breakup point. When the gas–liquid interaction becomes sufficiently intense, the gas and liquid fluids are fully mixed inside the nozzle, resulting in the flow blurring mode (Figure 5e,f).
Gañán-Calvo [2] classified the flow mode of the flow focusing/blurring nozzle into two types, flow focusing and flow blurring, based on whether the gas and liquid fluid inside the nozzle is mixed. However, Rosell-Llompart [22] found that this classification cannot fully describe the relationship between the internal and external flow of the nozzle. He classified the flow modes into flow focusing, turbulent flow focusing, and flow blurring based on the external liquid morphology of the nozzle. But this classification does not take into account the gas–liquid flow inside the nozzle. As mentioned earlier, this study divides the flow modes into three types based on the liquid jet breakup. When liquid jet breakup occurs outside the nozzle, it is flow focusing mode; when it occurs inside the orifice, it is transition mode; and when it occurs in the mixing zone of the nozzle, it is flow blurring mode. This classification comprehensively considers the gas–liquid flow inside and outside the nozzle, which is more reasonable.
Comparing Figure 5b,d, it can be seen that as the gas flow rate increases, the gas–liquid interaction inside the nozzle strengthens, causing the liquid jet inside the orifice to begin to break and the flow mode to shift from flow focusing to transition mode. Comparing Figure 5d,f, it can be seen that as the tube hole distance decreases, the gas–liquid interaction inside the nozzle strengthens, causing the liquid jet inside the mixing zone to begin to break and the flow mode to shift from transition to flow blurring mode. Determining the relationship between flow modes and structural or flow parameters is crucial for the effective application of flow focusing/blurring nozzles. To address this, we employ the flow mode diagram to study and analyze the relationship between the flow parameters, structural parameters, and flow modes.
Figure 6, Figure 7 and Figure 8 present the flow mode diagrams of the flow focusing/blurring nozzle based on flow parameters under different structural parameters, as obtained by experimental methods.
As shown in Figure 6, Figure 7 and Figure 8, the flow focusing mode primarily occurs at a low gas flow rate, whereas the flow blurring mode is more common at high gas flow rates. When the liquid flow rate is low, the flow mode is mainly determined by the gas flow rate. In contrast, when the liquid flow rate is high, the flow mode is predominantly expressed as the transition mode.
As can be seen from Figure 6, with the increase in tube hole distance, the gas–liquid flow rate range of the flow focusing mode increases and the gas–liquid flow rate range of the flow blurring mode decreases. From Figure 6a, it can be seen that when the tube hole distance is small (H/Dh = 0.2), flow focusing still exists as long as the gas flow rate is small. From Figure 6b, it can be seen that when the tube hole distance is large (H/Dh = 0.4), flow blurring still exists as long as the gas flow rate is large. This indicates that the flow mode criterion proposed by Gañán-Calvo, in which flow blurring only appears when H/Dh < 0.25, is not accurate enough. And Murugan’s research [26] also found similar conclusions to this study; that is, by controlling the gas flow rate, flow focusing can also be achieved at smaller H/Dh values and flow blurring can also be achieved at larger H/Dh values.
The existing research results on the influence of the structural parameters of the orifice on flow modes have not been reported. It can be seen from Figure 7 and Figure 8 that the influence of orifice diameter on the gas–liquid flow rate range of the flow focusing and flow blurring modes is the same as that of tube hole distance, but the influence of the orifice length is the opposite. This shows that the increase in tube hole distance and orifice diameter is conducive to the transformation of the flow mode into the flow focusing mode, while the increase in orifice length is conducive to the transformation of the flow mode into the flow blurring mode.
It can also be observed from Figure 6, Figure 7 and Figure 8 that, in certain cases, the flow inside the nozzle rarely transitions to the flow blurring mode, such as when the liquid flow rate is high or the tube hole distance is large. For the flow focusing/blurring nozzle, changes in the structural parameters affect the flow areas of the gas and liquid fluids inside the nozzle, which in turn influence the flow parameters. From this perspective, the gas and liquid flow rates—and, by extension, the interaction between the gas and liquid fluid—determine the flow modes inside the nozzle.
To further investigate this phenomenon, we will use numerical simulation methods to analyze the causes of different flow modes inside the nozzle and explore why certain flow modes fail to appear under specific conditions, all from the perspective of gas–liquid interaction.

4.2. Numerical Simulation of Flow Modes and Their Transformation

The experimental results indicate that changes in flow modes are closely related to the movement of the jet breakup point from outside of the nozzle to the mixing zone. Thus, studying the force between two-phase fluids inside the nozzle during this movement can provide insights into the flow modes and their transformation in the flow focusing/blurring nozzle.
The forces between the gas and liquid phases inside the nozzle primarily include the viscous shear force, inertial force of the liquid jet, gas pressure on the jet surface, and surface tension at the two-phase fluid interface. Among these forces, increases in the viscous shear force and inertial force of the liquid jet promote jet breakup, transitioning the flow mode to the flow blurring mode, and increases in the gas pressure on the jet surface and surface tension enhance the stability of jet, transitioning the flow mode to the flow focusing mode.
The surface tension is mainly related to the surface tension coefficient between the gas and liquid phases. In this study, since the two-phase fluids (water and air) are constant, the surface tension coefficient remains unchanged under different conditions. Therefore, the effect of surface tension is neglected in this analysis. The viscous shear force is mainly determined by the velocity difference in the gas and liquid phases; the inertia force of the liquid jet depends on the liquid velocity and mass flow rate; and the gas pressure on the liquid jet surface is mainly related to the average gas pressure near the jet.
To analyze these factors, we use the numerical simulation method to calculate the velocity difference between the gas and liquid phases, the liquid jet’s velocity and mass flow, and the average gas pressure near the jet. This allows us to study the variations in these forces as the jet breakup point moves from outside the nozzle to the mixing zone.
Figure 9 illustrates the changes in the three forces between the gas and liquid phases, as obtained from the numerical simulation, during the movement of the jet breakup point from outside the nozzle to the mixing zone with increasing gas flow rates.
As shown in Figure 9, with increasing gas flow rates, the viscous shear force, liquid inertia force, and surface pressure all increase. Among these forces, the viscous shear force exhibits the most significant growth trend. This indicates that the increase in viscous shear force exerted by the gas on the jet is the primary driver of changes in the flow morphology and flow modes inside the flow focusing/blurring nozzle.
Moreover, based on the trend of the three forces as the gas flow rate increases, the viscous shear force consistently plays a dominant role in the gas–liquid interaction force. This observation explains why, under some conditions (e.g., when the liquid flow rate or tube hole distance is large), the flow blurring mode was not observed during the experiment. This phenomenon may be attributed to an insufficient increase in the gas flow rate under these specific conditions. Murugan and other researchers [22,26] also observed the flow blurring inside the nozzle at large tube hole distances, which partially supports this conclusion.
Figure 10 illustrates the changes in the three forces between the gas and liquid phases, as obtained through the numerical simulations method, during the movement of the jet breakup point from outside the nozzle to the mixing zone with increasing liquid flow rates.
As shown in Figure 10, the interaction force between the gas and liquid becomes more complex as the liquid flow rate increases. With increasing liquid flow rates, the three forces between the gas and liquid phases also increase, but the dominant force varies depending on the liquid flow rates. At low liquid flow rates, the liquid inertia force is dominant, which enhances the instability of the gas–liquid flow inside the nozzle. As a result, under low liquid flow rates, an increase in the liquid flow rate causes the flow mode to move to the transition mode from the flow focusing mode. At high liquid flow rates, the surface pressure of the jet becomes the leading factor in the gas–liquid interaction, which enhances the stability of the gas–liquid flow. Consequently, at high liquid flow rates, an increase in the liquid flow rate causes the flow mode in the nozzle to remain in the transition mode and prevents it from moving to the flow blurring mode.
From the above analysis, it can be concluded that the difference in flow mode transitions with changes in gas or liquid flow rates is primarily related to the distinct trends in surface pressure. To further investigate the causes of this phenomenon, the flow morphology under various gas and liquid flow rates is provided in Figure 11. Because the VOF method is used to track the gas–liquid interface, the distribution of the phase volume function α reflects the flow morphology. α = 1 represents the liquid phase, indicated in blue in the figure. And α = 0 represents the gas phase, indicated in red in the figure. The colors between red and blue (like green or yellow) in the figure represent the liquid phase volume fraction in the region ranging from 0 to 1, which occurs at the gas–liquid interface.
As shown in Figure 11, when the gas or liquid flow rate increase, the jet breakup point moves toward the mixing zone. However, there are notable differences in the resulting changes to the flow morphology. When the gas flow rate increases, the jet diameter decreases to a certain extent before jet breakup occurs, and the gas flow area inside the nozzle expands. This expansion is not conducive to an increase in gas pressure on the jet surface. In contrast, when the liquid flow rate increases, the diameter of the unbroken jet increases significantly, leading to a marked reduction in the gas flow area. This reduction promotes an increase in gas pressure on the jet surface. This phenomenon is one of the key factors behind the differing trends in flow modes when the gas or liquid flow rate changes. A possible explanation is that the compressibility of gas is greater than that of liquid.
By comparing Figure 11a,b, it can also be observed that as the gas flow rate increases, the degree of jet breakup inside the nozzle increases both comprehensively and significantly, with both the center and peripheral areas of the jet showing enhanced breakup. However, when the liquid flow rate increases, only the peripheral areas of the jet experience increased breakup, while the liquid in the jet center remains largely intact. Moreover, the unbroken area increases with higher liquid flow rates. This indicates that, unlike the gas flow rate, an increase in the liquid flow rate is insufficient to fully break the jet, preventing the flow mode from transitioning to the flow blurring mode.
The above research indicates that the increase in the gas flow rate leads to the enhancement of the viscous shear force of the gas on the jet, which is the main reason affecting the flow mode of the flow focusing/blurring nozzle. Therefore, in practical applications, the nozzle should mainly control the gas flow rate to regulate the flow mode. For the field of liquid atomization that requires nozzles to operate in a flow blurring mode, designing a larger gas flow rate to enhance the viscous shear force of the gas on the jet is a good choice based on the required liquid flow rate. At the same time, when the gas flow rate cannot be very large, reducing the diameter of the orifice, increasing the length of the orifice, or selecting a smaller diameter orifice but increasing the number of orifices can enhance the degree of viscous shear force inside the nozzle, ensuring that the nozzle achieves the flow blurring mode. For application scenarios that require nozzles to operate in a flow focusing mode, the opposite approach can be adopted.

4.3. Numerical Simulation of Flow Morphology Inside the Nozzle Under Special Conditions

Using the numerical simulation method, the changes in flow modes inside the nozzle have been investigated from the perspective of gas–liquid interaction. The findings provide meaningful insight into the application of flow focusing/blurring nozzles. However, due to the relatively small range of gas and liquid flow rates selected in the experiment, further investigation is required to study flow mode changes under a broader range of conditions. To address this, the flow morphology was calculated using the numerical simulation method over a wider range of gas and liquid flow rates.
Figure 12 shows the change in the flow morphology inside the nozzle with the gas or liquid flow rate increasing under large gas or liquid flow rate ranges obtained by the numerical simulation method.
The numerical simulation shown in Figure 12a was conducted with H = 2 mm, Dh = 5 mm, Lh = 10 mm, and Ql = 1000 mL/min. Within the gas flow rate range used in the experiment (5 L/min~100 L/min), the flow mode does not transition from the transition mode to the flow blurring mode as the gas flow rate increases. However, as shown in Figure 12a, when the gas flow rate increases from 100 L/min to 160 L/min, the flow mode inside the nozzle transitions from the transition mode to the flow blurring mode. This result is consistent with the gas–liquid interaction analysis, which indicates that the absence of flow blurring observed under certain experimental conditions is primarily due to insufficient gas flow rates.
It can also be observed from Figure 12a that when the gas flow rate significantly exceeds 160 L/min, the flow morphology inside the nozzle undergoes a notable change. The amount of liquid fluid flowing into the orifice from the mixing zone decreases significantly, and the degree of jet breakup also diminishes. This suggests that at high gas flow rates, the gas flow hinders the movement of liquid fluid inside the nozzle, rendering the nozzle unable to function properly.
The numerical simulation in Figure 12b was conducted with H = 2 mm, Dh = 5 mm, Lh = 10 mm, and Qg = 20 L/min. Within the experimental liquid flow rate range (0.1 L/min~1 L/min), the internal flow mode of the nozzle remains in the transition mode as the liquid flow rate increases. However, as shown in Figure 12b, with further increases in the liquid flow rate, the jet breakup point shifts closer to the wall of the orifice, the overall degree of jet breakup gradually decreases, and the flow mode deviates significantly from both the transition and the flow blurring mode. Under these conditions, the nozzle’s atomization capability diminishes, as most of the liquid fluid flows out of the nozzle without breaking up, resulting in an abnormal operation state.
The analysis of Figure 12 demonstrates that the operational range of gas and liquid flow rates for the flow focusing/blurring nozzle under normal conditions is limited to a certain extent. Depending on specific application requirements, the flow focusing/blurring nozzle typically operates in different flow modes. When the nozzle is used to generate monodisperse droplets, it usually operates in the flow focusing mode. In this mode, the required gas and liquid flow rates are low, and variations in these rates have minimal impact on the nozzle’s normal operation. Conversely, when the nozzle is used for liquid atomization, it typically operates in the flow blurring mode. While selecting a sufficiently high gas flow rate under various working conditions can induce the flow blurring mode, this approach not only increases energy consumption but also risks disrupting the nozzle’s normal operation. Additionally, a high liquid flow rate is also detrimental to the nozzle’s stability and performance.
Therefore, compared with other two-phase flow nozzles, in the field of liquid atomization, the advantage of the flow focusing/blurring nozzle is that it can produce a better atomization effect on liquid fluid under small liquid flow rates. When the nozzle is used under the flow blurring mode, choosing a smaller tube hole distance and a relatively large gas flow rate is more conducive to the atomization of liquid and the energy consumption is less. In addition, choosing a nozzle inner tube diameter slightly larger than the orifice diameter can also enhance the viscous shear effect to a certain extent, thereby improving the atomization effect on the liquid. If the flow focusing/blurring nozzle needs to be applied to scenarios that operate in the flow focusing mode, the opposite design approach should be taken.

5. Conclusions

In this paper, the flow modes in the flow focusing/blurring nozzle are studied by experimental and numerical simulation methods. The research results are as follows:
(1)
According to the experimental results, the flow modes of the flow focusing/blurring nozzle are classified into three types from the perspective of liquid jet breakup: flow focusing, transition, and flow blurring. This classification takes into account both the flow inside and outside the nozzle, which is more reasonable.
(2)
The flow mode and its transformation are mainly related to viscous shear force, gas pressure on jet surface, and liquid inertia force. The enhancement of viscous shear force caused by the increase in the gas flow rate is an effective method to achieve the transition from flow focusing to flow blurring.
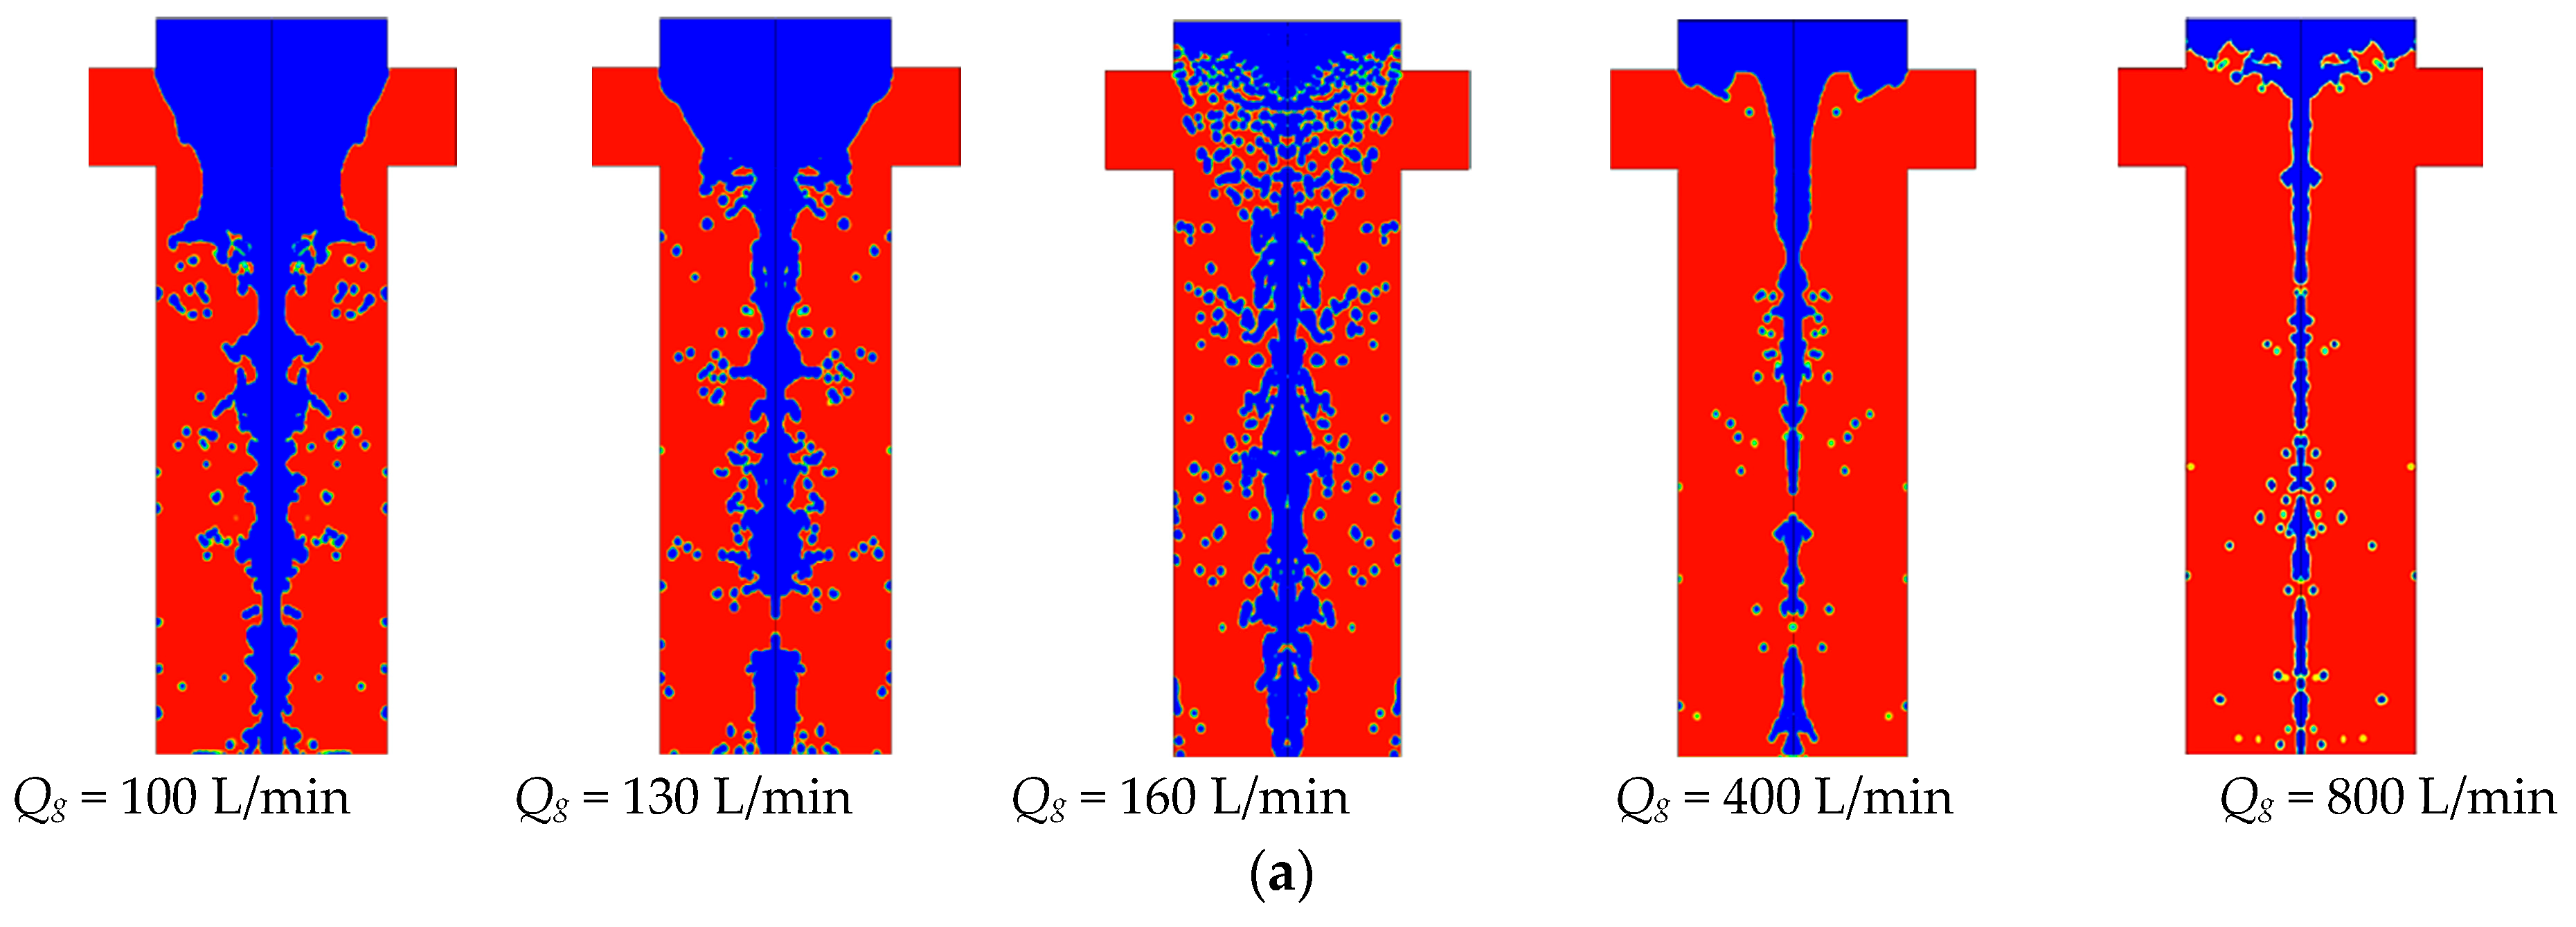
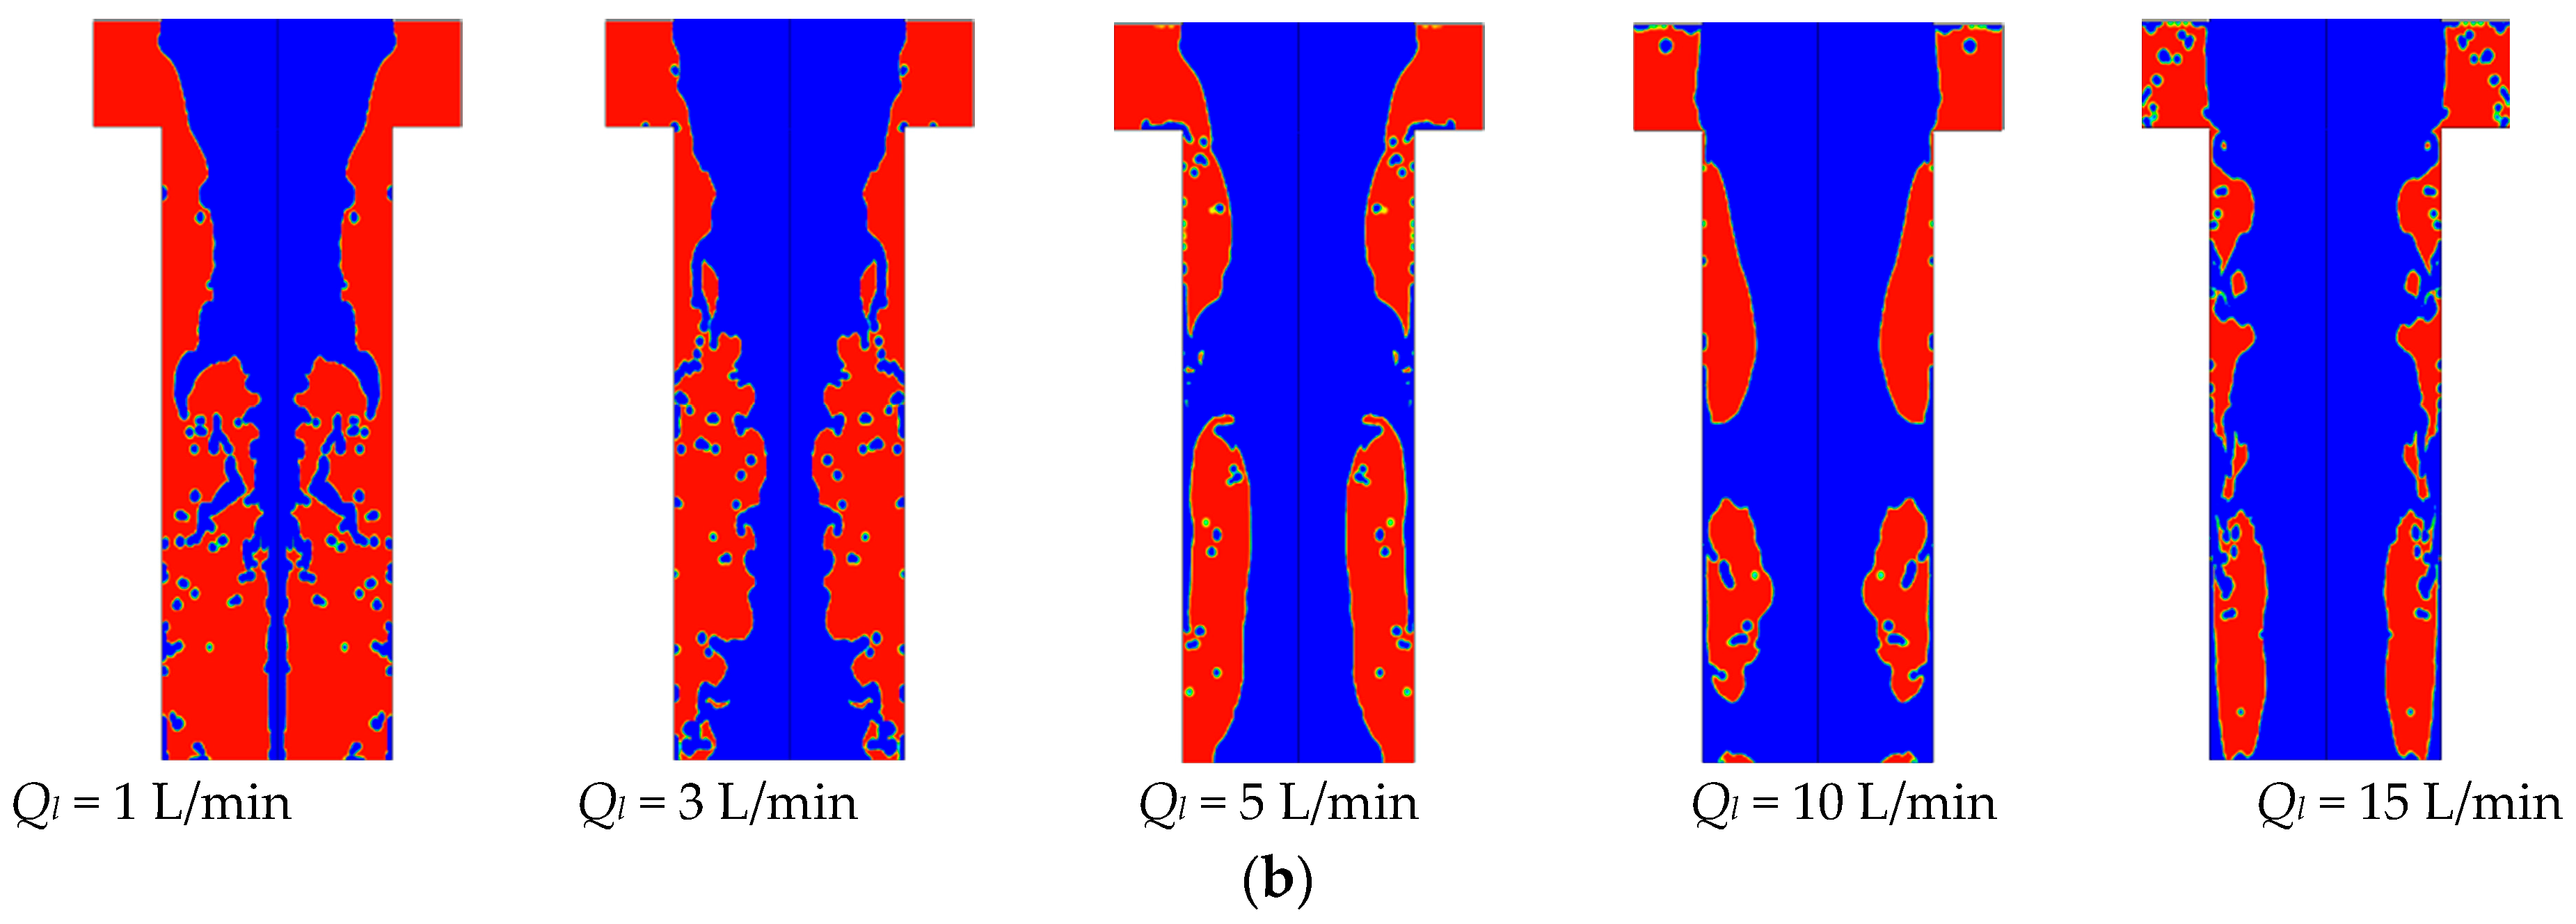
(3)
Excessive gas or liquid flow rates can cause the liquid jet inside the nozzle to be difficult to break up or cause them to even be unable to flow; that is, the flow focusing/blurring nozzle cannot function properly when the gas or liquid flow rate is too high.
(4)
Based on this study, the design principles for the practical application of the flow focusing/blurring nozzle have been determined. Firstly, for a specific application scenario, selecting the appropriate gas flow rate is the most effective method for designing a suitable nozzle. When the gas flow rate cannot meet the requirements, consider changing the structure (tube hole distance, orifice scheme, etc.) to control the internal gas–liquid interaction and design a nozzle that meets the requirements.

Author Contributions

J.F.: methodology, data curation, conceptualization, writing—original draft. Z.Y.: supervision, writing—review and editing. J.Z.: conceptualization, writing—review and editing. All authors have read and agreed to the published version of the manuscript.

Funding

This study was funded by the Guizhou Province Science and Technology Achievement Transformation and Industrialization Project (Qian ke he zhong yin di [2024]018).

Data Availability Statement

The data that support the findings of this study are available upon reasonable request.

Conflicts of Interest

The authors declare no conflict of interest.

References

  1. Ganan-Calvo, A.M. Generation of Steady Liquid Microthreads and Micron-Sized Monodisperse Sprays in Gas Streams. Phys. Rev. Lett. 1998, 80, 285–288. [Google Scholar] [CrossRef]
  2. Ganan-Calvo, A.M. Enhanced liquid atomization: From flow-focusing to flow-blurring. Appl. Phys. Lett. 2005, 86, 4601. [Google Scholar] [CrossRef]
  3. Song, Y.; Zhou, Y.; Zhao, S.; Du, F.-R.; Li, X.-Y.; Zhu, K.; Yan, H.-S.; Xu, Z.; Ding, S.-T. Cyclic coupling and working characteristics analysis of a novel combined cycle engine concept for aviation applications. Energy 2024, 301, 131747. [Google Scholar] [CrossRef]
  4. Mei, Q.; Liu, L.; Yang, W.; Tang, Y. Combustion model development of future DI engines for carbon emission reduction. Energy Convers. Manag. 2024, 311, 118528. [Google Scholar] [CrossRef]
  5. Tianyi, H.; Shouwen, Z.; Chenhui, Z. Unlocking the secrets behind liquid superlubricity: A state-of-the-art review on phenomena and mechanisms. Friction 2022, 10, 1137–1165. [Google Scholar]
  6. Raven, J.P.; Marmottant, P.; Graner, F. Dry microfoams: Formation and flow in a confined channel. Eur. Phys. J. B Condens. Matter Complex Syst. 2006, 51, 137–143. [Google Scholar] [CrossRef]
  7. Seo, M.; Paquet, C.; Nie, Z.; Xu, S.; Kumacheva, E. Microfluidic consecutive flow-focusing droplet generators. Soft Matter 2007, 3, 986–992. [Google Scholar] [CrossRef]
  8. Jensen, M.J.; Stone, H.A.; Bruus, H. A numerical study of two-phase stokes flow in an axisymmetric flow-focusing device. Phys. Fluids 2006, 18, 164501. [Google Scholar] [CrossRef]
  9. Jensen, M.J. Numerical Simulations of Interface Dynamics in Microfluidics. Ph.D. Thesis, Technical University of Denmark, Copenhagen, Denmark, 2005. [Google Scholar]
  10. Mu, K.; Si, T.; Li, E.; Xu, R.X.; Ding, H. Numerical study on droplet generation in axisymmetric flow focusing upon actuation. Phys. Fluids 2018, 30, 012111. [Google Scholar] [CrossRef]
  11. Mu, K.; Ding, H.; Si, T. Instability analysis of the cone–jet flow in liquid-driven flow focusing. Microfluid. Nanofluid. 2018, 22, 138. [Google Scholar] [CrossRef]
  12. Simmons, B.M.; Agrawal, A.K. Flow blurring atomization for low-emission combustion of liquid biofuels. Combust. Sci. Technol. 2012, 184, 660–675. [Google Scholar] [CrossRef]
  13. Simmons, B.M.; Panchasara, H.V.; Agrawal, A.K. A comparison of air-blast and flow-blurring injectors using phase doppler particle analyzer technique. In Proceedings of the ASME Turbo Expo 2009: Power for Land, Sea, and Air, Orlando, FL, USA, 8–12 June 2009; pp. 981–992. [Google Scholar]
  14. Simmons, B.M.; Agrawal, A.K. Spray characteristics of a flow-blurring atomizer. At. Sprays 2010, 20, 821–835. [Google Scholar] [CrossRef]
  15. Simmons, B.M.; Kolhe, P.S.; Taylor, R.P.; Agrawal, A.K. Glycerol combustion using flow-blurring atomization. In Proceedings of the 2010 Technical Meeting of the Central States Section of the Combustion Institute, Champaign, IL, USA, 21–23 March 2010. [Google Scholar]
  16. Modestolópez, L.B.; Gañáncalvo, A.M. Visualization and size-measurement of droplets generated by Flow Blurring in a high-pressure environment. Aerosol Sci. Technol. 2017, 52, 198. [Google Scholar] [CrossRef]
  17. Qavi, I.; Jiang, L.; Akinyemi, O.S. Near-field spray characterization of a high-viscosity alternative jet fuel blend C-3 using a flow blurring injector. Fuel 2021, 293, 120350. [Google Scholar] [CrossRef]
  18. De Azevedo, C.G.; De Andrade, J.C.; Costa, F.D.S. Effects of injector tip design on the spray characteristics of soy methyl ester biodiesel in a blurry injector. Renew. Energy 2016, 85, 287–294. [Google Scholar] [CrossRef]
  19. Sadasivuni, V.; Agrawal, A.K. A novel meso-scale combustion system for operation with liquid fuels. Proc. Combust. Inst. 2009, 32, 3155–3162. [Google Scholar] [CrossRef]
  20. Band, C.; Merin, A.P.; Srinivasan, V. Spray characteristics of shear-thinning viscoelastic liquids downstream of a counterflow atomizer. Int. J. Heat Fluid Flow 2024, 109, 109496. [Google Scholar] [CrossRef]
  21. Nayer Nasim, M.; Qavi, I.; Lulin, J. Effect of varying internal geometry on the near-field spray characteristics of a swirl burst injector. Flow Turbul. Combust. 2023, 111, 641–674. [Google Scholar] [CrossRef]
  22. Rosell-Llompart, J.; Gañán-Calvo, A.M. Turbulence in pneumatic flow focusing and flow blurring regimes. Phys. Rev. E Stat. Nonlinear Soft Matter Phys. 2008, 77, 036321. [Google Scholar] [CrossRef]
  23. Almagro, B.; Gañán-Calvo, A.M.; Hidalgo, M.; Canals, A. Behaviour of a flow focusing pneumatic nebulizer with high total dissolved solids solution on radially- and axially-viewed inductively coupled plasma atomic emission spectrometry. J. Anal. At. Spectrom. 2006, 21, 1072–1075. [Google Scholar] [CrossRef]
  24. Herrada, M.A.; Gañán-Calvo, A.M.; Ojeda-Monge, A.; Bluth, B.; Riesco-Chueca, P. Liquid flow focused by a gas: Jetting, dripping, and recirculation. Phys. Rev. E 2008, 78, 036323. [Google Scholar] [CrossRef]
  25. Montanero, J.M.; Rebollo-Muñoz, N.; Herrada, M.A.; Gañán-Calvo, A.M. Global stability of the focusing effect of fluid jet flows. Phys. Rev. E 2011, 83, 036309. [Google Scholar] [CrossRef] [PubMed]
  26. Murugan, R.; Kolhe, P.S.; Sahu, K.C. A combined experimental and computational study of flow-blurring atomization in a twin-fluid atomizer. Eur. J. Mech.—B/Fluids 2020, 84, 528–541. [Google Scholar] [CrossRef]
  27. Murugan, R.; Balusamy, S.; Kolhe, P. Experimental study of liquid spray mode of twin fluid atomizer using optical diagnostic tool. Flow Turbul. Combust. 2021, 106, 261–289. [Google Scholar] [CrossRef]
  28. Murugan, R.; Kolhe, P.S. Experimental investigation into flow blurring atomization. Exp. Therm. Fluid Sci. 2020, 120, 110240. [Google Scholar] [CrossRef]
Figure 1. The structural schematic diagram and actual design diagram of the flow focusing/blurring nozzle. (a) The structural schematic diagram of flow focusing/blurring nozzle. (b) The actual design diagram of the experimental flow focusing/blurring nozzle in this study.
Processes 12 02751 g001
Figure 2. Schematic diagram of experimental platform.
Processes 12 02751 g002
Figure 3. Computational domain extraction and grid partition of numerical model. (a) Computational domain extraction; (b) grid partition.
Processes 12 02751 g003
Figure 4. The comparison between the experimental and numerical simulation result.
Processes 12 02751 g004
Figure 5. The flow morphology under different conditions. (a) Qg = 10 L/min, Ql = 0.2 L/min, H = 4 mm; (b) Qg = 10 L/min, Ql = 0.1 L/min, H = 3 mm; (c) Qg = 40 L/min, Ql = 0.1 L/min, H = 3 mm; (d) Qg = 60 L/min, Ql = 0.1 L/min, H = 3 mm; (e) Qg = 20 L/min, Ql = 0.1 L/min, H = 1 mm; (f) Qg = 60 L/min, Ql = 0.1 L/min, H = 1 mm.
Processes 12 02751 g005
Figure 6. The flow mode map under different tube hole distance (Dh = 5 mm, Lh = 10 mm). (a) H = 1 mm; (b) H = 2 mm; (c) H = 3 mm.
Processes 12 02751 g006
Figure 7. The flow mode map under different orifice diameter (H = 2 mm, Lh = 10 mm). (a) Dh = 3 mm; (b) Dh = 5 mm; (c) Dh = 7 mm.
Processes 12 02751 g007
Figure 8. The flow mode map under different orifice length (H = 2 mm, Dh = 5 mm). (a) Lh = 5 mm; (b) Lh = 10 mm; (c) Lh = 15 mm.
Processes 12 02751 g008
Figure 9. The change in the interaction forces with gas flow rate.
Processes 12 02751 g009
Figure 10. The change in the interaction forces with the liquid flow rate.
Processes 12 02751 g010
Figure 11. The flow morphology under different gas or liquid flow rate. (a) The change in flow morphology with gas flow rate (Ql = 600 mL/min, H = 3 mm, Qh = 5 mm, Lh = 10 mm); (b) The change in flow morphology with liquid flow rate (Qg = 60 L/min, H = 3 mm, Qh = 5 mm, Lh = 10 mm).
Processes 12 02751 g011
Figure 12. The flow morphology under different gas or liquid flow rates when large gas or liquid flow rate ranges are used. (a) The change in flow morphology with gas flow rates under large gas flow rate ranges; (b) the change in flow morphology with liquid flow rates under large liquid flow rate ranges.
Processes 12 02751 g012aProcesses 12 02751 g012b
Table 1. Methods and findings of existing numerical simulation studies.
ResearcherMethodsSoftwareConclusion
Jensen [8]Second-order Runge–Kutta time integration algorithm; free-surface schemeMATLAB v.7.0 R14 coupled FEMLABThe relationship between the flow parameters, structural parameters, and the droplets size
Nayer Nasim [21]Standard k-epsilon viscous model; Eulerian method; second-order upwind scheme; SIMPLE methodFluent v.6.3The decrease in tube hole distance leads to an increase in internal pressure of the nozzle, and the increase in air momentum causes a change in flow mode
Herrada [24]Laminar model; VOF method; third-order modified MUSCL scheme; PISO methodFluent v.6.3The flow blurring mode is related to the stability of the liquid recirculation cell inside the nozzle
Montanero [25]Laminar model; VOF method; third-order modified MUSCL scheme; PISO methodFluent v.6.3The viscosity of a liquid has a significant impact on the transition of flow modes
Murugan [26]LES; VOF method; second order central differencing implicit scheme; PISO methodFluent v.6.3The radial flow of gas in the mixing zone results in a reverse flow towards the inner tube when it meets the liquid jet, enhancing gas–liquid interaction and leading to flow blurring
Disclaimer/Publisher’s Note: The statements, opinions and data contained in all publications are solely those of the individual author(s) and contributor(s) and not of MDPI and/or the editor(s). MDPI and/or the editor(s) disclaim responsibility for any injury to people or property resulting from any ideas, methods, instructions or products referred to in the content.

