Article

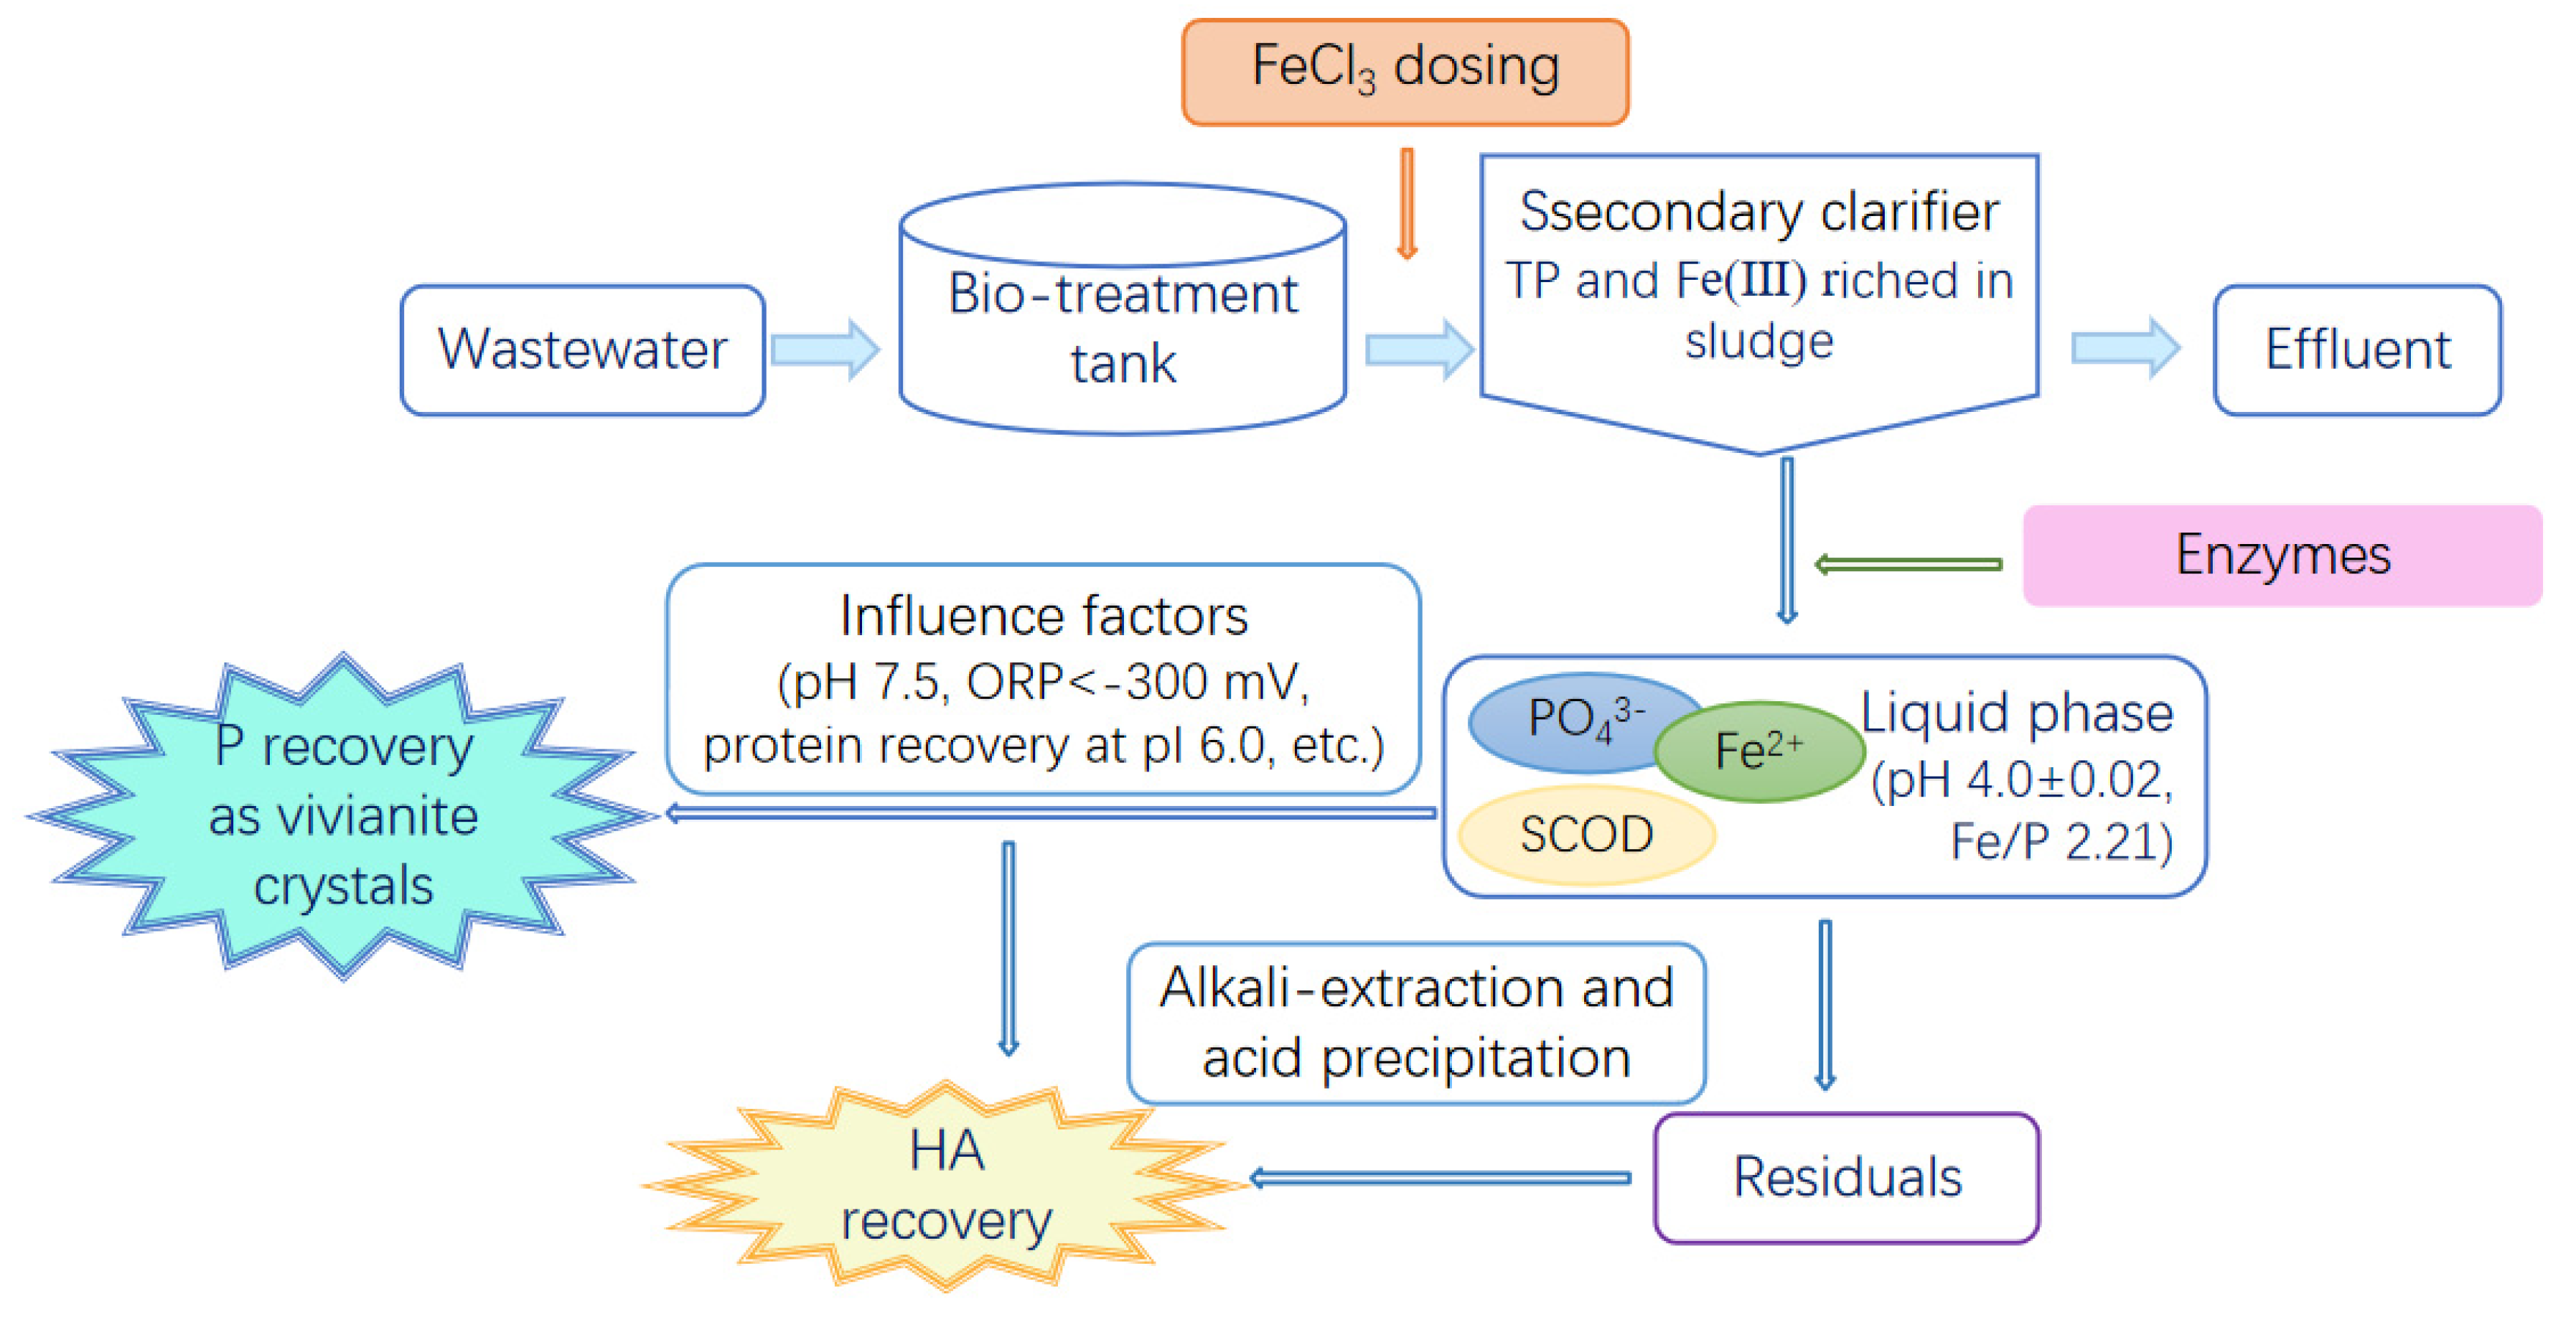
Simultaneous Recovery of Vivianite and Humic Acids from Waste Activated Sludge via Ferric Trichloride Flocculation and Enzymatic Hydrolysis Co-Treatment

School of Environmental and Municipal Engineering, North China University of Water Resources and Electric Power, Zhengzhou 450046, China
*
Author to whom correspondence should be addressed.
Processes 2024, 12(12), 2737; https://doi.org/10.3390/pr12122737
Submission received: 7 September 2024 / Revised: 20 November 2024 / Accepted: 25 November 2024 / Published: 3 December 2024
(This article belongs to the Section Environmental and Green Processes)

Abstract

Synchronously recovering phosphorus as vivianite and humic acids (HAs) from waste activated sludge (WAS) is of great significance for the carbon neutralization of wastewater. In this study, flocculation, enzyme degradation (lysozyme/protease/amylase/cellulase in a 1:1:1:1 ratio), and pH adjustment were used to reclaim vivianite and HAs. After FeCl3 coagulation–precipitation and enzymatic hydrolysis of the sludge for 11 h, the supernatant was enriched with Fe2+ and PO43−, with the molar ratio of Fe2+:PO43− of 2.21. To improve the purity of the vivianite, the crude protein was separated at pI 6.0. The purity of the crystals reached a peak of 97.44 ± 0.04% at pH 7.5. HAs extracted from the residuals had a high affinity for metal adsorption, and the adsorption process was both endothermic and efficient. Overall, this study demonstrates the feasibility and effectiveness of the joint reclaiming of vivianite and HAs, providing new insights into multiple resource recovery from WAS.

1. Introduction

Waste activated sludge (WAS) is the main by-product of biological sewage treatment plants (STPs) and contains abundant nutrients and organic matter (OM). In recent years, WAS has been recognized as a promising raw material for phosphorus (P) and humic acid (HA) recovery [1,2,3], both of which are crucial for the carbon neutralization of wastewater treatment [4,5,6].
The hydrolysis and degradation of OM with complex structures have been the major bottlenecks in sludge treatment and resource recovery. Physical, chemical, and biological methods and combined treatments have been adopted to effectively promote the release of phosphorus and a large amount of organic matter such as proteins, polysaccharides, and HAs [7,8]. Due to their cost-effectiveness and easy scalability, biological approaches like enzymes and microbes for sludge hydrolysis and degradation are receiving increasing attention [9,10]. Hydrolases, such as amylase, protease, cellulase, etc., can hydrolyze polysaccharides, protein, and cellulose in the sludge, thereby destructing the sludge structure [8]. The combination of amylase and protease can significantly degrade the extracellular organic matter of the sludge into small molecules, leading to the destabilization and breakdown of the sludge floc [11]. As a cytoplasmic enzyme with high activity, lysozyme can dissolve the insoluble polysaccharides in the cell wall and has a better lytic effect on residual sludge than protease, amylase, or cellulase [10]. During the process of enzymatic hydrolysis, P accumulated in WAS is released to the supernatant, and the insoluble organic particles in sludge are synergistically hydrolyzed to form HAs. The structures of the HAs are quickly stabilized into supramolecular forms [4,12].
Crystallization is commonly applied for P recovery from WAS. The main mineral forms of phosphorus recovered are struvite (MgNH4PO4·6H2O) and vivianite (Fe3(PO4)2·8H2O) [13,14]. Struvite recovery is particularly favored in biological phosphorus removal systems; however, its recovery rate is low, only 10–30% of the phosphorus in the influent. This crystal is also inhibited by iron compounds present in the influent water and the iron salt adopted as a coagulant to remove phosphorus, which is preferable for vivianite recovery [5,14]. Ergo, in recent years, vivianite crystals have been considered as a sink for phosphorus, a more sustainable, scarce, and nonrenewable resource, and the interest in mineral vivianite has grown significantly owing to its simple and efficient recovery from wastewater [15,16,17].
Vivianite is spontaneously formed in wastewater treatment plants, aquatic sediments, drained agricultural areas, and waterlogged soils [17,18]. Vivianite crystallization is a stable phosphorus–iron compound (Ksp = 10−36) with low solubility under non-sulfidic and reducing conditions at circumneutral pH [16,18]. Vivianite crystallization offers an innovative route for P recovery from P-enriched Fe sludge or P-rich water, with foreseeable economic value, including being used as slow-release ideal P and Fe fertilizers, raw material for lithium battery synthesis, materials for photocatalytic CO2 reduction, etc. [15,19].
Biovivianite (microbially synthesized vivianite) can be produced through microbial reduction of P-containing ferrihydrite, P-enriched Fe sludge, P-rich water, etc. [17,20]. In laboratory batch systems, Fe(III)-reducing bacteria can use higher concentrations of P (e.g., P/Fe = 1) to form biovivianite under an initial pH range of 6 to 7 [20]. The Desulfosporosinus strain, which acts as both a sulfate and an iron reducer, can facilitate the formation of larger biovivianite particles [21].
Vivianite crystallization is essentially a chemical process influenced by several factors, including pH, OM, the molar ratio of Fe:P, etc. [22,23,24]. The mineral vivianite is ideally formed under neutral to alkaline pH conditions, which is appropriate for conventional sewage or sludge treatment [14]. The oxidation–reduction potential (ORP) is vital for vivianite crystals, with an ORP of less than −300 mV necessary to maintain Fe2+ [14,21,25]. The vivianite formation potential increases as the molar Fe:P ratio increases, the anaerobic sludge retention time increases, and the sulfate concentration decreases [18,19]. About 70–90% of total P of the digested sludge samples can accumulate in vivianite crystals when the molar ratio of Fe:P equals 2.5 [26,27]. However, the separation of the small size of vivianite particles (typically only 10 to 200 µm) in sludge is also a challenge. Due to vivianite’s paramagnetic characteristics, devices like a high-gradient magnetic separator (HGMS) can be used to extract vivianite even when the sludge has higher dry matter and higher viscosity [5]. Therefore, vivianite crystals have garnered significant attention with their natural ubiquity, easy accessibility, and high recovery efficiency [13,14,24]. However, it is severely necessary to focus on how to enhance the production and purity of the crystals recovered from WAS, as well as the optimal operating conditions to improve the separation efficiency.
HAs are complex compounds that contain multiple functional groups, including carboxyl, hydroxyl, carbonyl, phenolic, aliphatic, and aromatic structures [28,29]. The substantial variations in how the functional groups are arranged on the aromatic backbones of HAs influence their molecular features and further determine how they interact and react with other pollutants [29]. Due to the large specific surface area with high activity and a large number of hydrophobic and hydrophilic moieties on the outer surface, HAs are known to reciprocally interact in complex ways with poly(lactic acid) (PLA) microplastics and heavy metals in aqueous solutions [12,30,31]. Functional groups with negative charges are more favored to bind metal cations (such as Cu, Pb, Co, Cd, Hg, etc.), due to increased electrostatic attractions, than groups for which competition of metal ions with protons takes place [32,33].
However, the literature is mainly on recovering the P or C resource. The present research aims to explore an applicable and promising alternative to synchronously reclaim vivianite and HAs. The main objectives of this research are (1) introducing FeCl3 as a coagulant to enhance P accumulation in WAS; (2) promoting procedures of enzymatic hydrolysis of the WAS to release P into the supernatant and to form HAs; (3) exploring the influencing factors of vivianite crystallization with high purity and optimizing the operating factors precisely; and (4) consolidating with HAs reclamation and assessing the affinity of HAs as an adsorbent of metals. This research makes a unique contribution to P and C recovery, providing novel insights into the key relationships that improve our understanding and potential optimization of vivianite and HAs recoveries from the wastewater.

2. Materials and Methods

2.1. Reagents and Waste Activated Sludge Properties

WAS was collected from the terminal part of the aeration tank in the local STP, and its main characteristics are shown in Table 1. Commodity enzymes of lysozyme, protease, amylase, and cellulase were bought from Sunson Industry Group Co., Ltd., Beijing, China (http://www.sunsonenzymes.com/, accessed on 22 January 2023), and their activities were 2,000,000 U·g−1, 50,000 U·g−1, 3000 U·mL−1, and 5000 U·mL−1, respectively. Based on our previous research [8], the enzymes used were a mixture with the ratio of lysozyme/protease/amylase/cellulase of 1:1:1:1. In addition, 0.1 mol/L NaOH and 6 mol/L HCl were used to adjust pH, 100 mg/L FeCl3 as coagulant, and 1 mol/L vitamin C was used to maintain a reductive ORP of <−150 mv. Most chemical reagents were of analytical reagents, except for FeCl3, which was chemically pure.

2.2. Experimental Design and Conditions

This pilot study aimed to recover vivianite crystals and HAs, and metal adsorption affinity of HAs was also investigated. The procedure was divided into the following four stages:
(1) Accumulation of P and Fe in the sludge: raw WAS and FeCl3 were added into a beaker and mixed with a magnetic stirrer following the usual procedures: 200 rpm for 2 min, then 60 rpm for 15 min, and stilling for 30 min. The sediment, rich in Fe and P, was labeled as P-Fe sludge. The raw sludge without FeCl3 flocculation was marked as the control.
(2) Enrichment of P and Fe in the supernatant (marked as P-Fe supernatant): P-Fe sludge and 2% (w/v) of enzymes were blended in a sealed container at 45 °C, 150 r/min, and then stilled for 2–3 h. P-Fe supernatant was decanted for P recovery. Supernatant samples were sampled at 3, 5, 7, 9, 11, 13, and 15 h, respectively. Meanwhile, the raw WAS was anaerobically hydrolyzed as the control.
(3) Protein removal and vivianite crystallization: to increase the purity of vivianite, proteins were precipitated at pI 6.0 and removed with centrifugation. Then, pH values of P-Fe supernatant were adjusted to 6.0, 6.5, 7.0, 7.5, 8.0, 8.5, and 9.0, respectively. The mixtures were sealed tightly with silicone stoppers and allowed to settle for 2 h to separate vivianite.
(4) HAs recovery and metal adsorption affinity: an alkali extraction and acid precipitation method with 0.1 mol/L NaOH and 6 mol/L HCl was adopted to recover HAs (International Humic Substance Society, IHSS) [35]. Kinetics and isothermal adsorption tests for Pb2+, Cr2+, and Zn2+ were conducted to assess the affinity of HAs as an adsorbent of metals. A constant metal concentration pf 100 mg/L was preliminary set to establish adsorption kinetics curves, and three temperatures of 15, 25, and 35 °C and eight metal concentrations of 10, 20, 50, 100, 150, 200, 250, and 300 mg/L were set for isothermal adsorption tests of HAs, respectively. The Langmuir (L-type) and Freundlich (F-type) isotherm models were used to fit the isothermal adsorption curves of metals on HAs and the pseudo-first-order kinetic model, pseudo-second-order model, and the intraparticle diffusion model to fit the kinetic curves [36].
The simplified scheme of this pilot research was as the following (Figure 1):

2.3. Analysis and Statistical Methods

The surface morphologies, functional groups, and structure of vivianite and HAs were measured with scanning electron microscopy (SEM) (Sigma 300, manufactured by Carl Zeiss AG in Germany) and Fourier transform infrared spectroscopy (FTIR) (VEcToR 22, manufactured by Bruker Corporation in Germany). The scan scale of FTIR was 400–4000 cm−1. The crystal structure and phase of vivianite were also analyzed with X-ray diffractometer (XRD) (Bruker, manufactured by Bruker Corporation in Germany). Total residual metals in the supernatant were measured with inductively coupled plasma–mass spectrometry (ICP-MS 7800, manufactured by Agilent Technologies in USA).
The ammonium molybdate spectrophotometric method (GB 11893-89) [37] was adopted to determine the contents of TP and PO43−, Nessler’s reagent spectrophotometry method (HJ 535-2009) [38] for NH4+, phenanthroline spectrophotometry method (HJ/T 345-2007) [39] for total Fe and Fe2+, and fast digestion–spectrophotometric method (HJ/T 399-2007) [40] for the soluble chemical oxygen demand (SCOD). ORP and pH were measured with Leisi PHS-2F, manufactured by Shanghai Inesa Scientific Instrument Co., Ltd., Shanghai, China.
All experiments were carried out in triplicate to ensure the accuracy, repeatability, and reproducibility, and the mean and standard deviation (Mean ± SD) were reported. SPSS 26 was used to calculate ANOVA, and t-test was used to evaluate the different significance of the results.

3. Results and Discussion

3.1. Effects of Coagulation

The characteristics of the supernatant before and after FeCl3 flocculation are summarized in Table 1. After coagulation and flocculation with FeCl3, approximately 70.86% and 92.81% of TN and TP were removed into the sediment (P-Fe sludge), while the PO43− contents in the raw supernatant decreased by 92.42%. The concentrations of TP in supernatant could meet the discharge standard of pollutants for a municipal wastewater treatment plant (GB 18918-2002) [34]. The sediments enriched in P and Fe (P-Fe sludge) were stored at 4 °C for the following experiments. This process is beneficial to P recovery from wastewater to form vivianite crystals and also solves the challenge of separation of vivianite from sludge [19].

3.2. Effects of the Enzymatic Hydrolysis of P-Fe Sludge

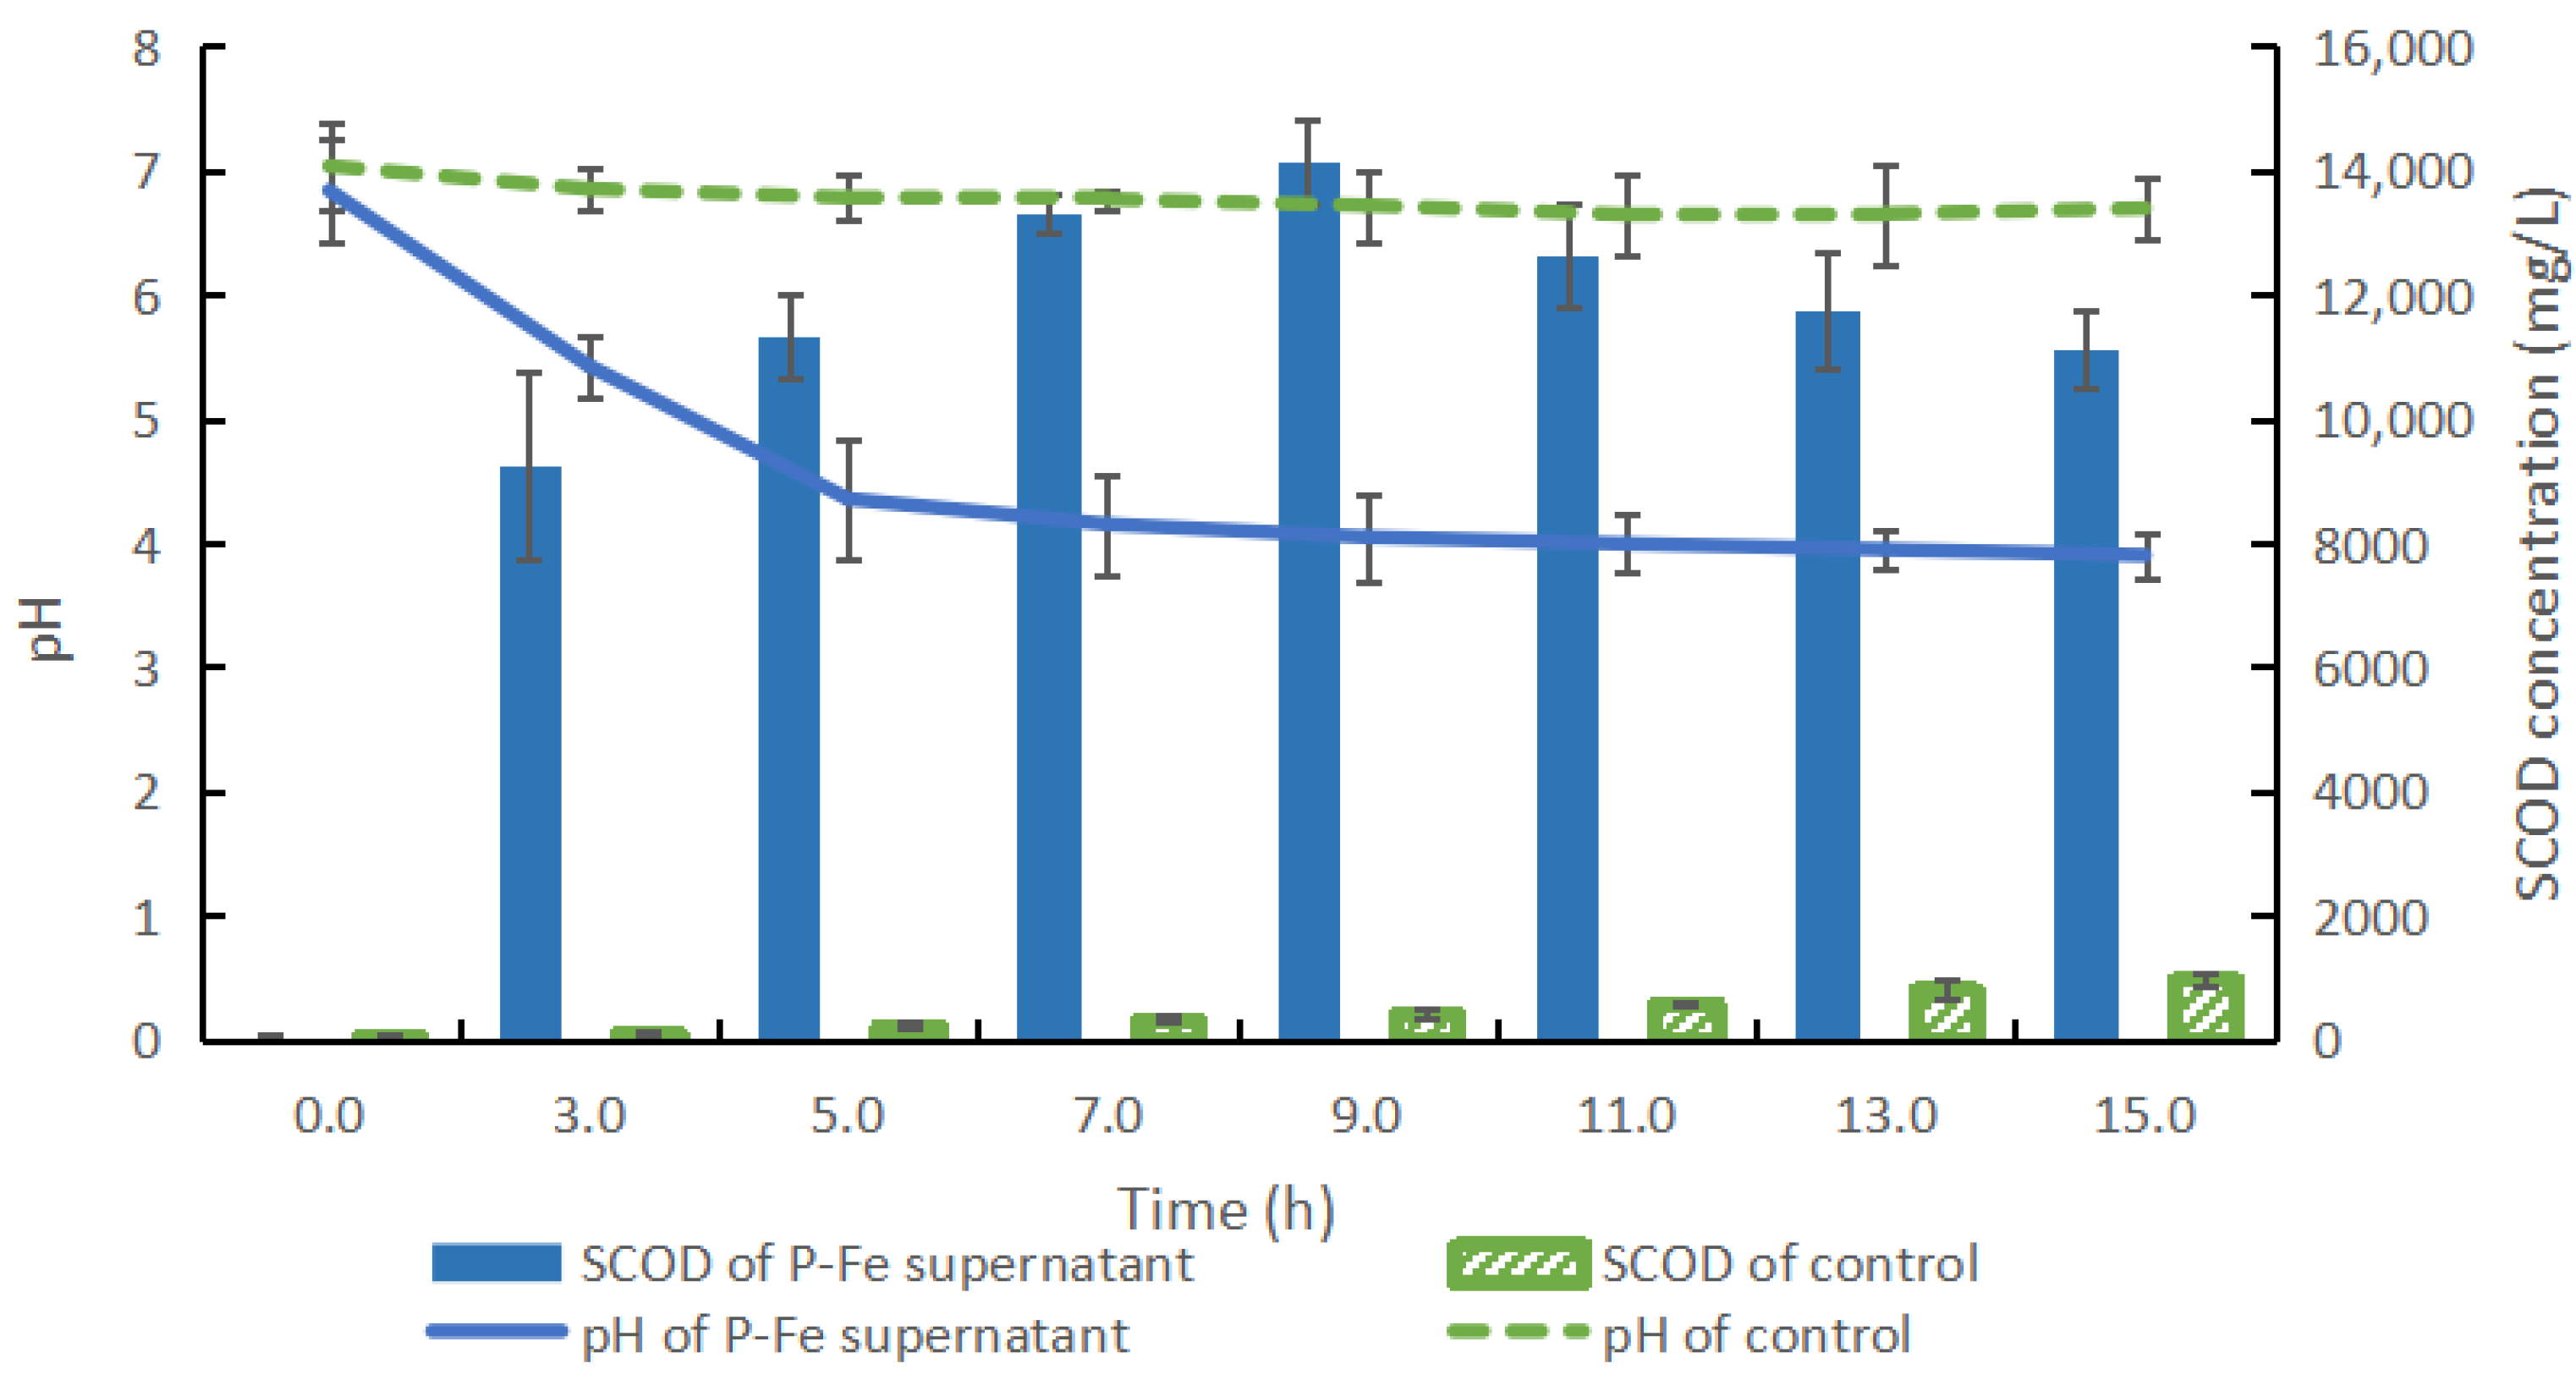
3.2.1. PH and the Soluble Chemical Oxygen Demand Variations During the Hydrolysis Processes

Figure 2 presents the variations in pH and SCOD of P-Fe supernatant and the control during the hydrolysis processes. SCOD values of P-Fe supernatant increase sharply, reaching 13.23 ± 0.83 g/L at 3 h, while the control under aerobic conditions shows a slow increase, peaking at 1.09 ± 0.09 g/L at 15 h. The pH values of P-Fe supernatant range from 3.91 to 4.08 between 11 and 15 h, while those of the control change slightly, about 6.79 ± 0.11 during the whole process (Figure 2). At the end of the hydrolysis treatment, the differences of SCOD and pH values between P-Fe supernatant and the control are significant (p < 0.01), which indicates that the enzymatic hydrolysis is beneficial for the sludge crack, the intracellular substances dissolution, and the solution acidification [7,8].

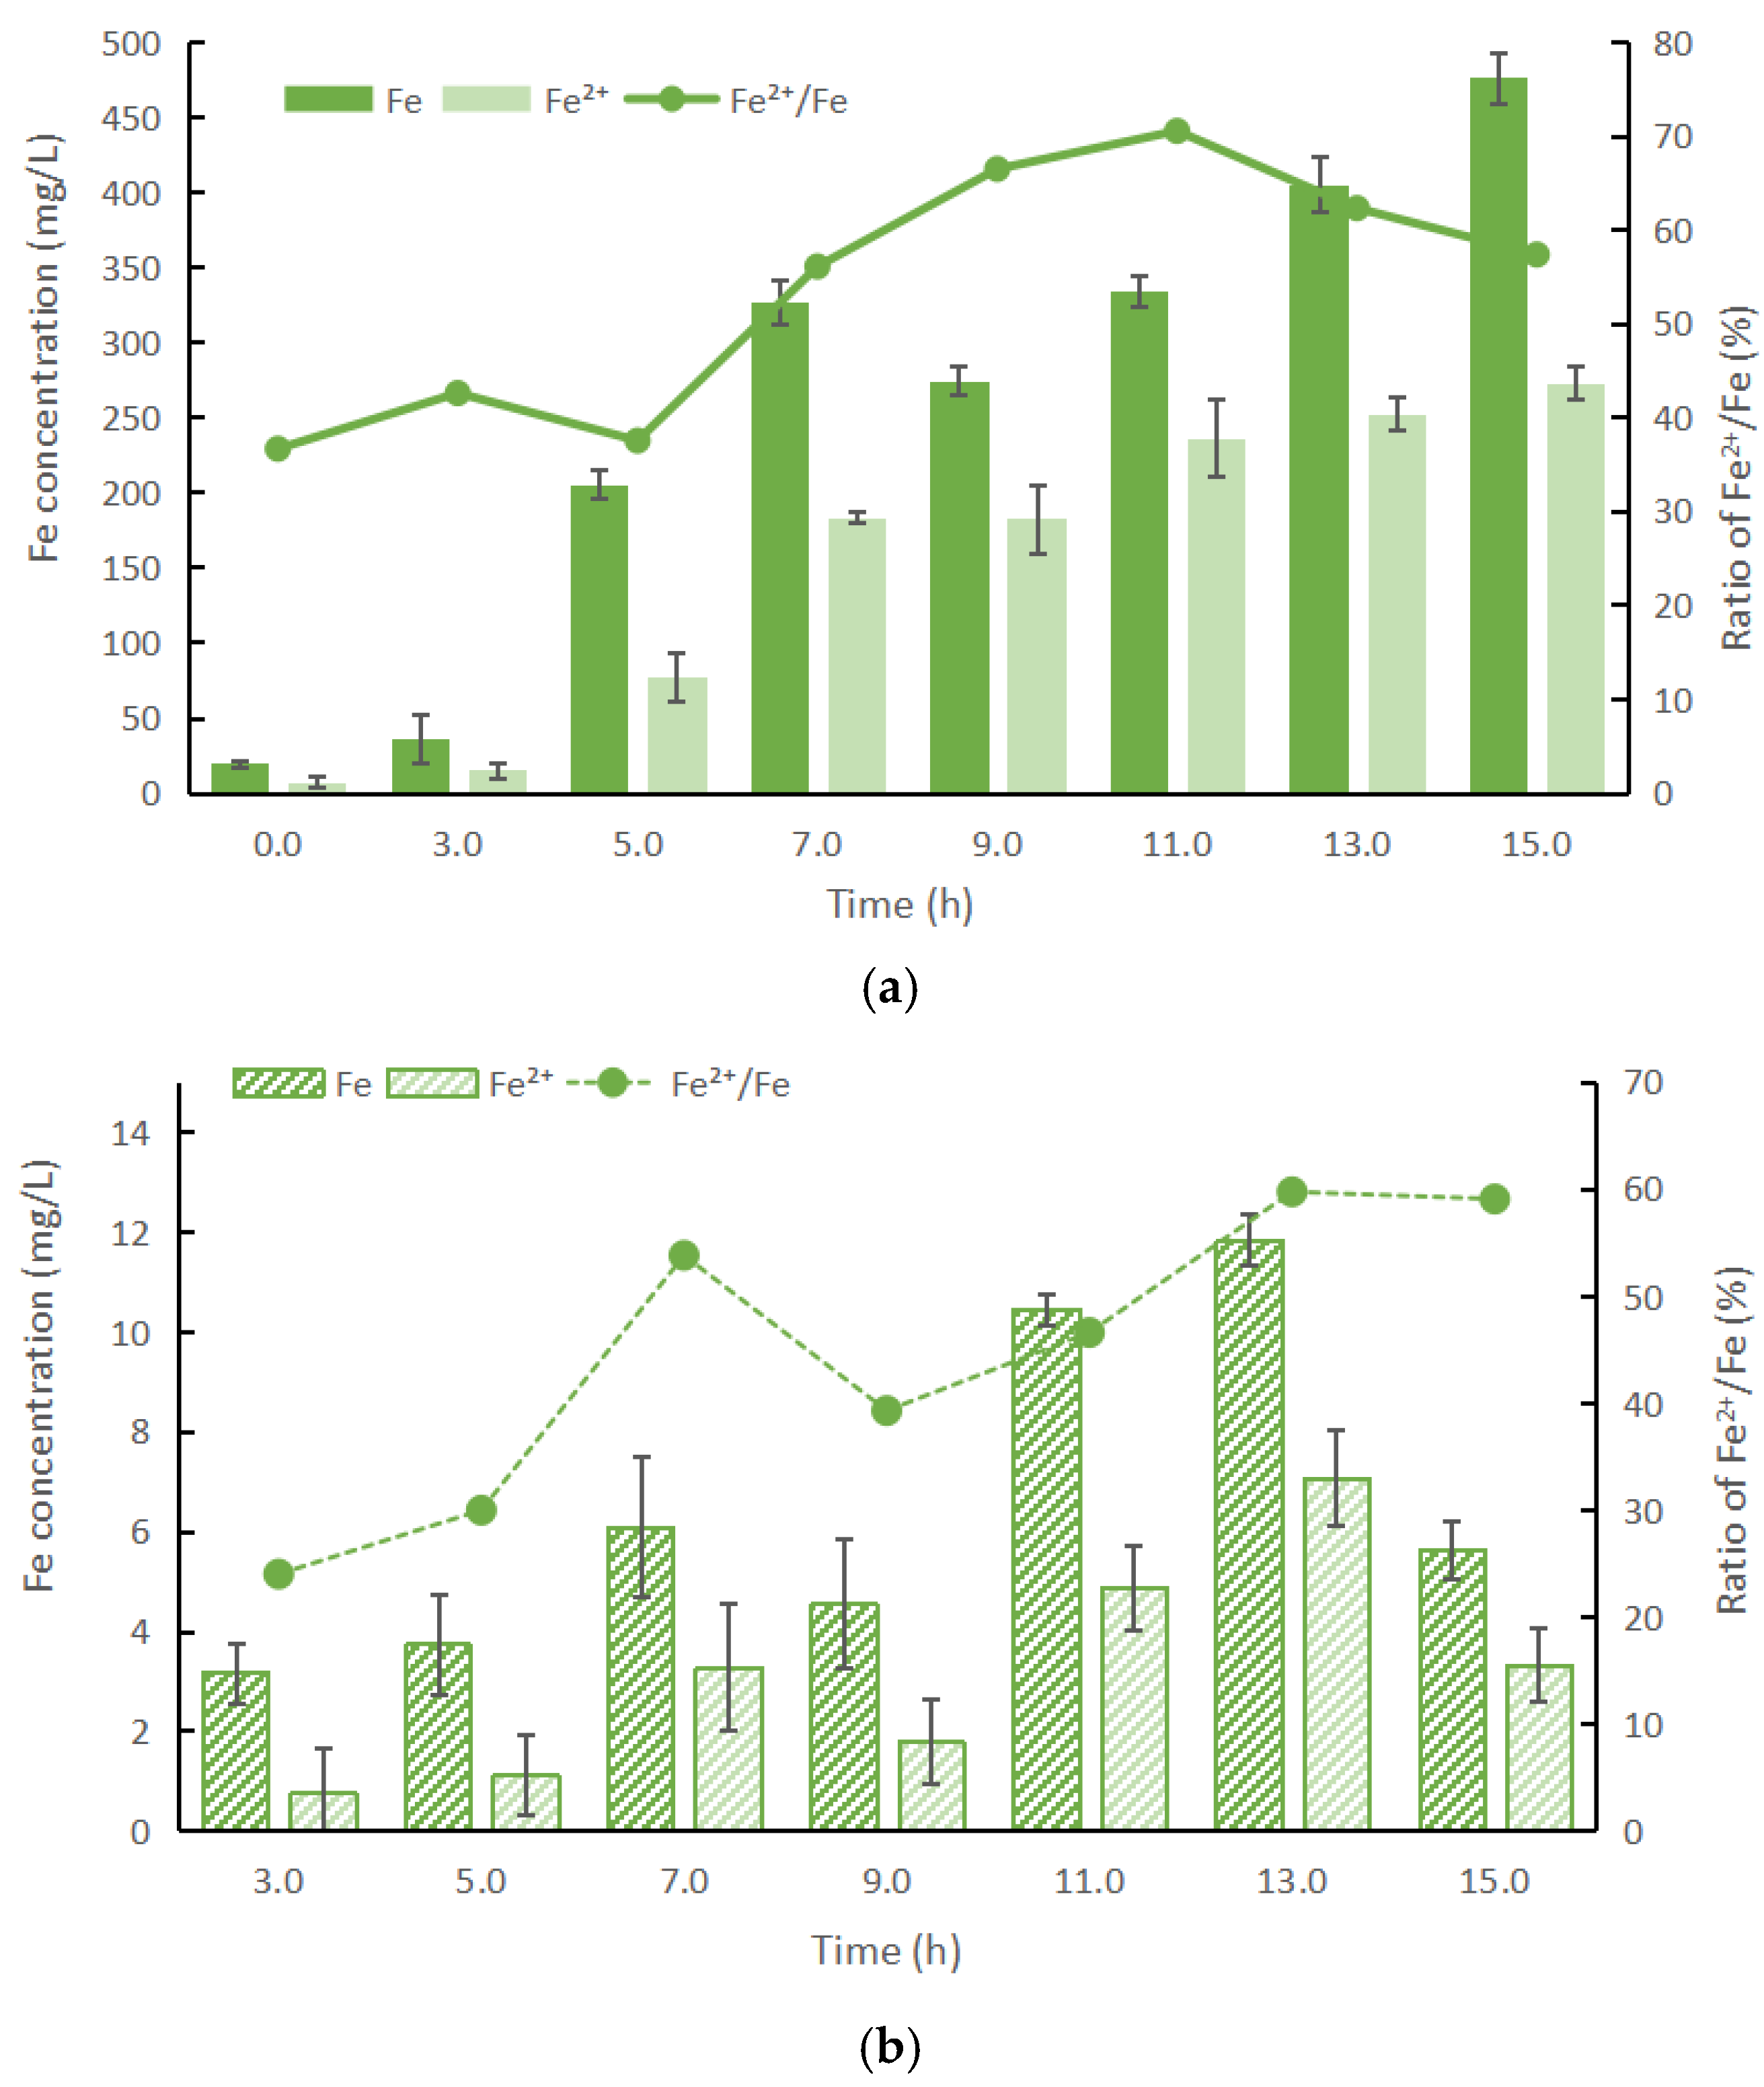
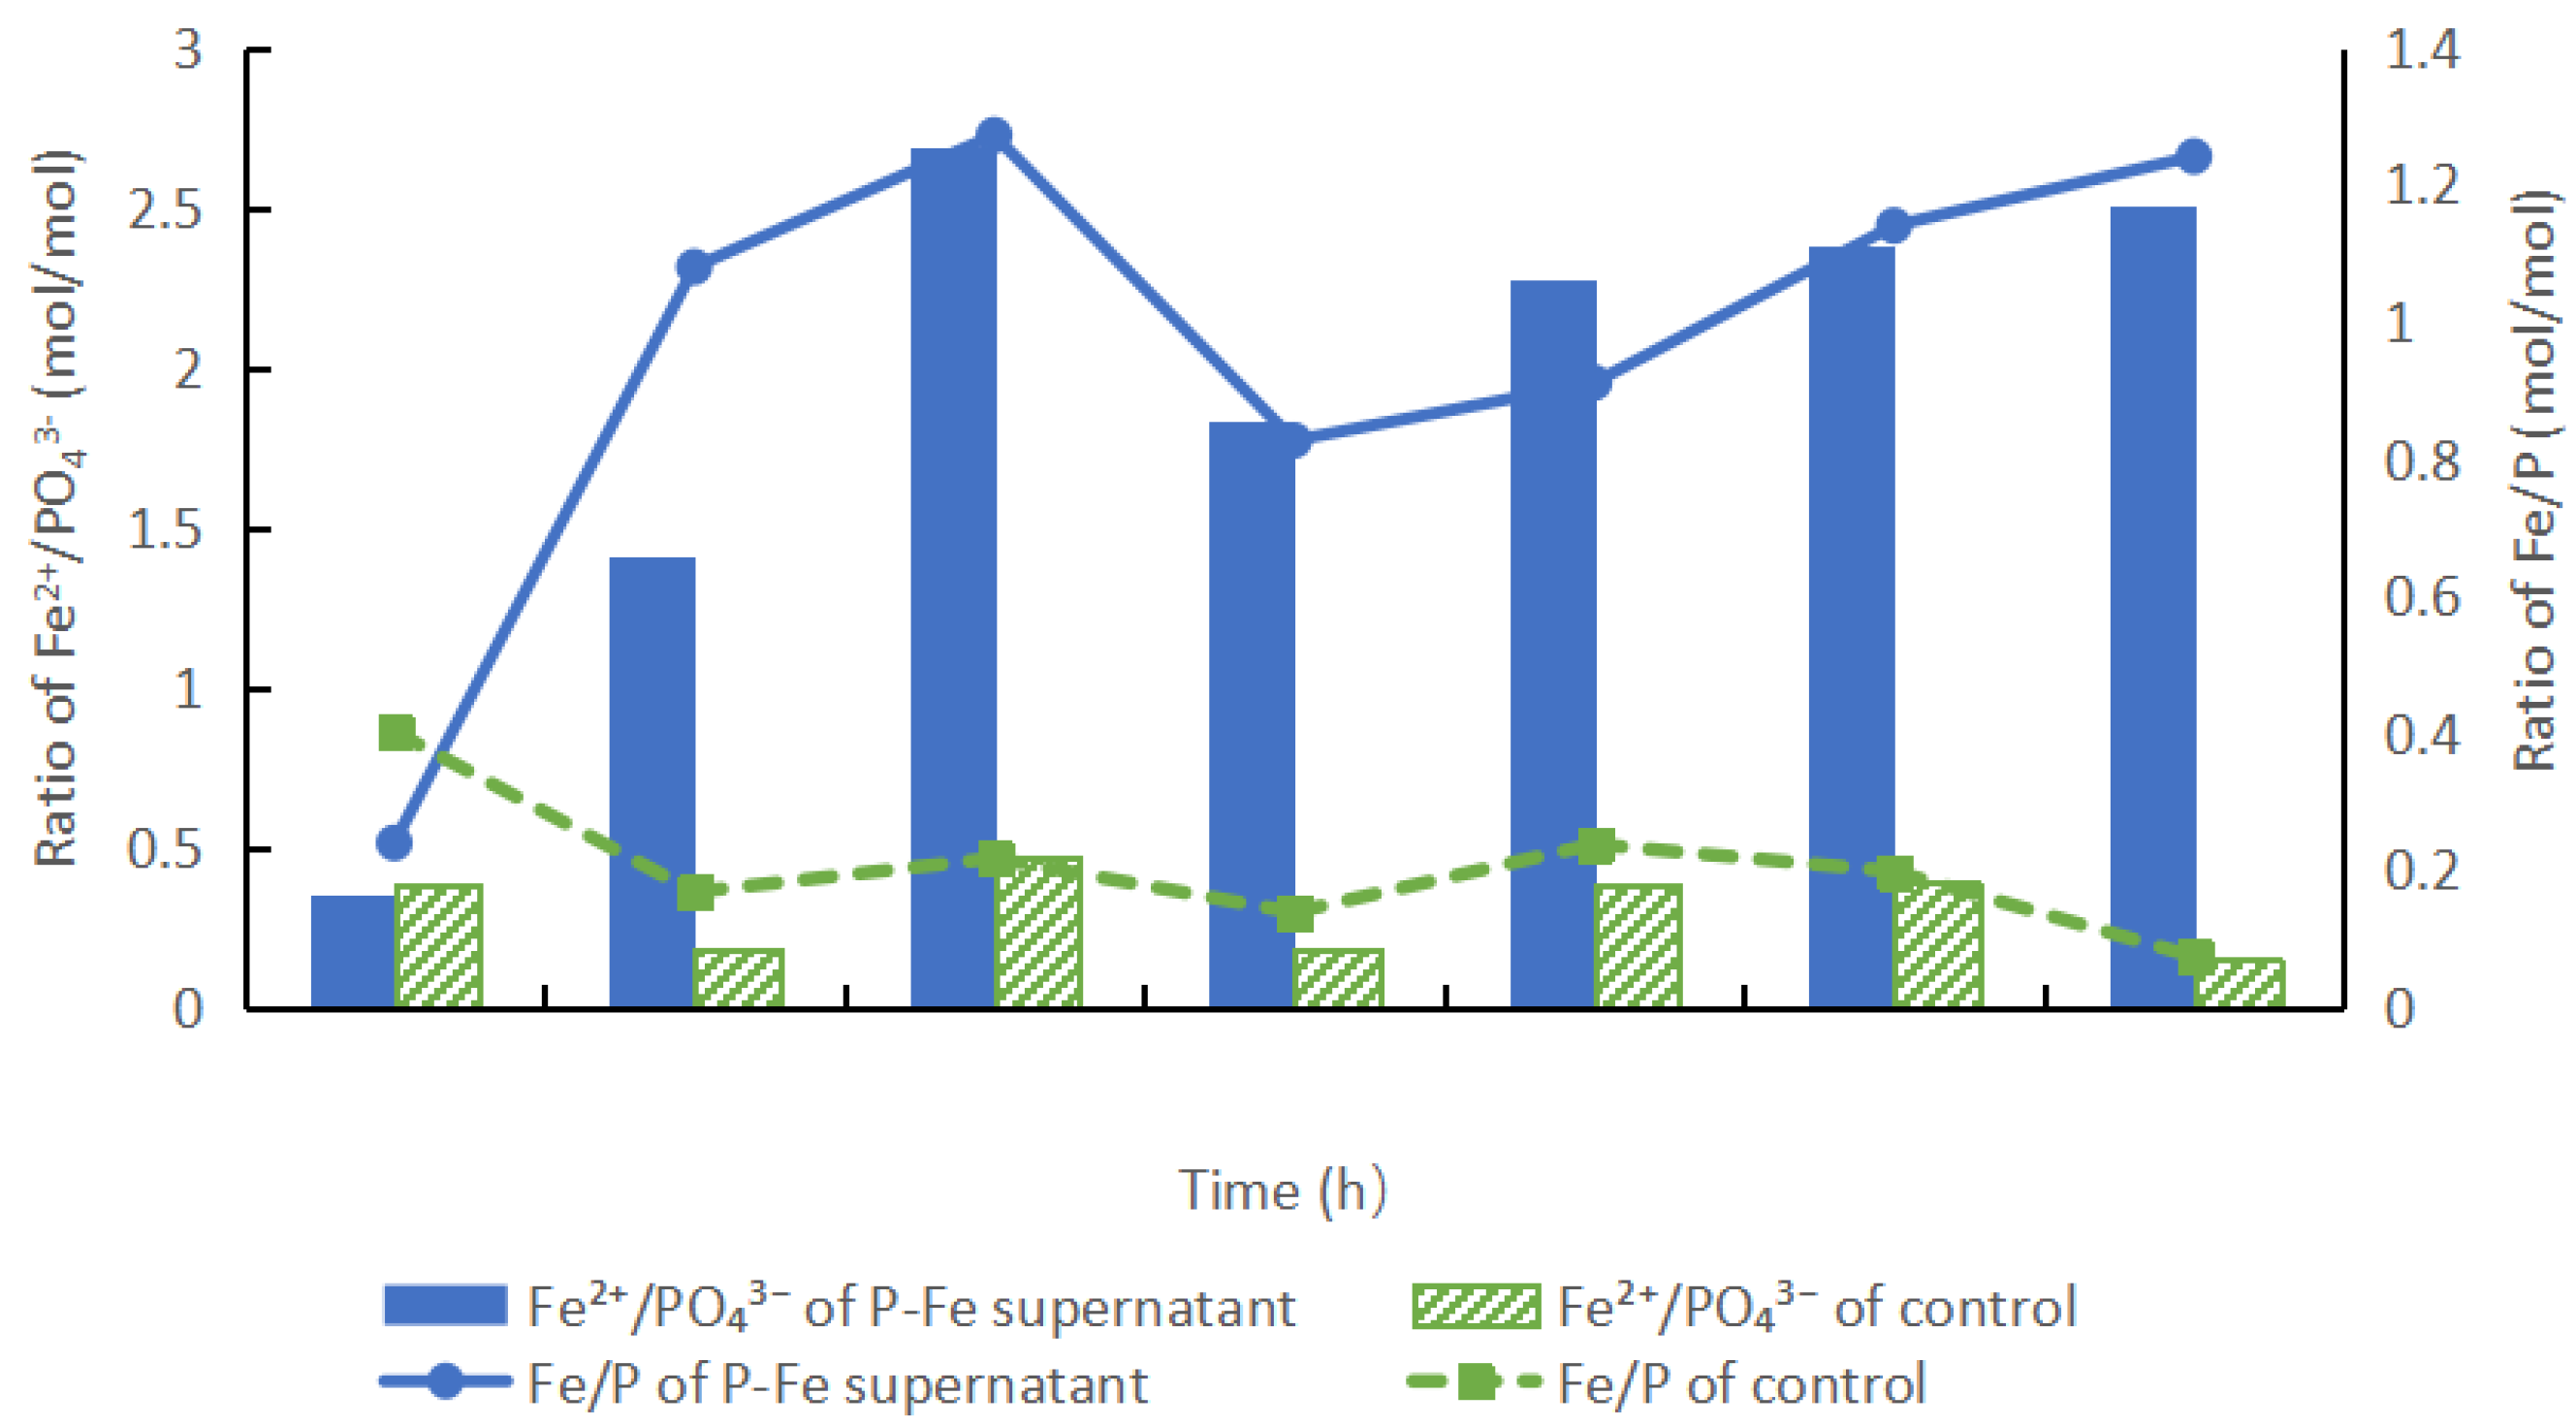
3.2.2. P and Fe Concentration Changes During the Hydrolysis Processes

Figure 3 and Figure 4 show that enzymatic hydrolysis enhances the release of P and Fe from the P-Fe sludge into P-Fe supernatant. The TP and PO43− contents of the P-Fe supernatant peak at 202.51 ± 3.65 and 183.25 ± 10.47 mg/L, respectively, at 11 h (Figure 3a), while those of the control raise slowly and reach the maximums of 42.22 ± 2.01 and 39.31 ± 1.94 mg/L (Figure 3b), which are only 20.00 and 20.62% of P-Fe sludge (p < 0.01), respectively. However, the ratios of PO43−: TP (w/w) of P-Fe sludge and the control pilots vary slightly between 85.92% and 90.59% and 79.24 and 90.10% (p > 0.05), respectively (Figure 3). At the termination of the processes, the dissolved Fe and Fe2+ contents of the P-Fe supernatant reach the summits of 476.68 ± 10.51 and 273.34 ± 25.00 mg/L, respectively, and the ratios of Fe2+:Fe (w/w) remain almost steady between 57.71 and 71.58% after 7 h (p > 0.05) (Figure 4).
The acidification (pH 3.91–4.08) and the biologically or chemically induced reductive conditions during the enzymatic digestion could enhance the dissolvement of TP, PO43−, and Fe to P-Fe supernatant [17]. P and Fe release in this pilot is both sufficient and efficient. On the other hand, the Fe:P molar ratio is a determining factor for the following P precipitation and removal, and the ratio being more than 1.5 is beneficial for vivianite crystallization [7,22]. During the enzymatic hydrolysis process of P-Fe sludge, Fe:P molar ratio raises nearly linearly and the value is more than 1.5 after 7 h (Figure 5). After 11 h of hydrolysis, the liquid is enriched with PO43− and Fe2+, about 183.25 ± 10.47 and 236.08 ± 34.90 mg/L, respectively, and pH is 3.94 ± 0.02 (Figure 2 and Figure 5). The molar ratio of Fe2+/PO43− is 2.21, which could meet the requirements for vivianite crystallization.

3.3. Vivianite Crystallization

Vivianite (Fe3(PO4)2·8H2O) is a stable phosphorus–iron compound. Under anaerobic conditions, Fe2+ can react with PO43− to form vivianite and crystals can sediment immediately and separate from the solution directly [13,22]. Various factors, such as organic matter, pH, and ORP, influence the recovery rate and purity of vivianite [7,27]. The strong interaction between Fe and proteins can lower the supersaturation level of the solution, thereby reducing the efficiency and altering the growth mode of vivianite crystals [41]. A reductive environment and low pH are beneficial for the transformation of Fe2+ [2,24]. Akageneite shows a high long-term reduction rate and also is screened as a superior iron source for P recovery in sewage [6]. Nano-magnetite addition structures an enormous and compact electron transfer network and builds coherent conductive pathways to promote vivianite recovery [42]. Vitamin C of 1 mol/L is commonly used to keep ORP < −150 mv, and 1 mol/L NaOH to adjust pH in the scale of 6–9 to meet the need of vivianite crystallization [25,43].

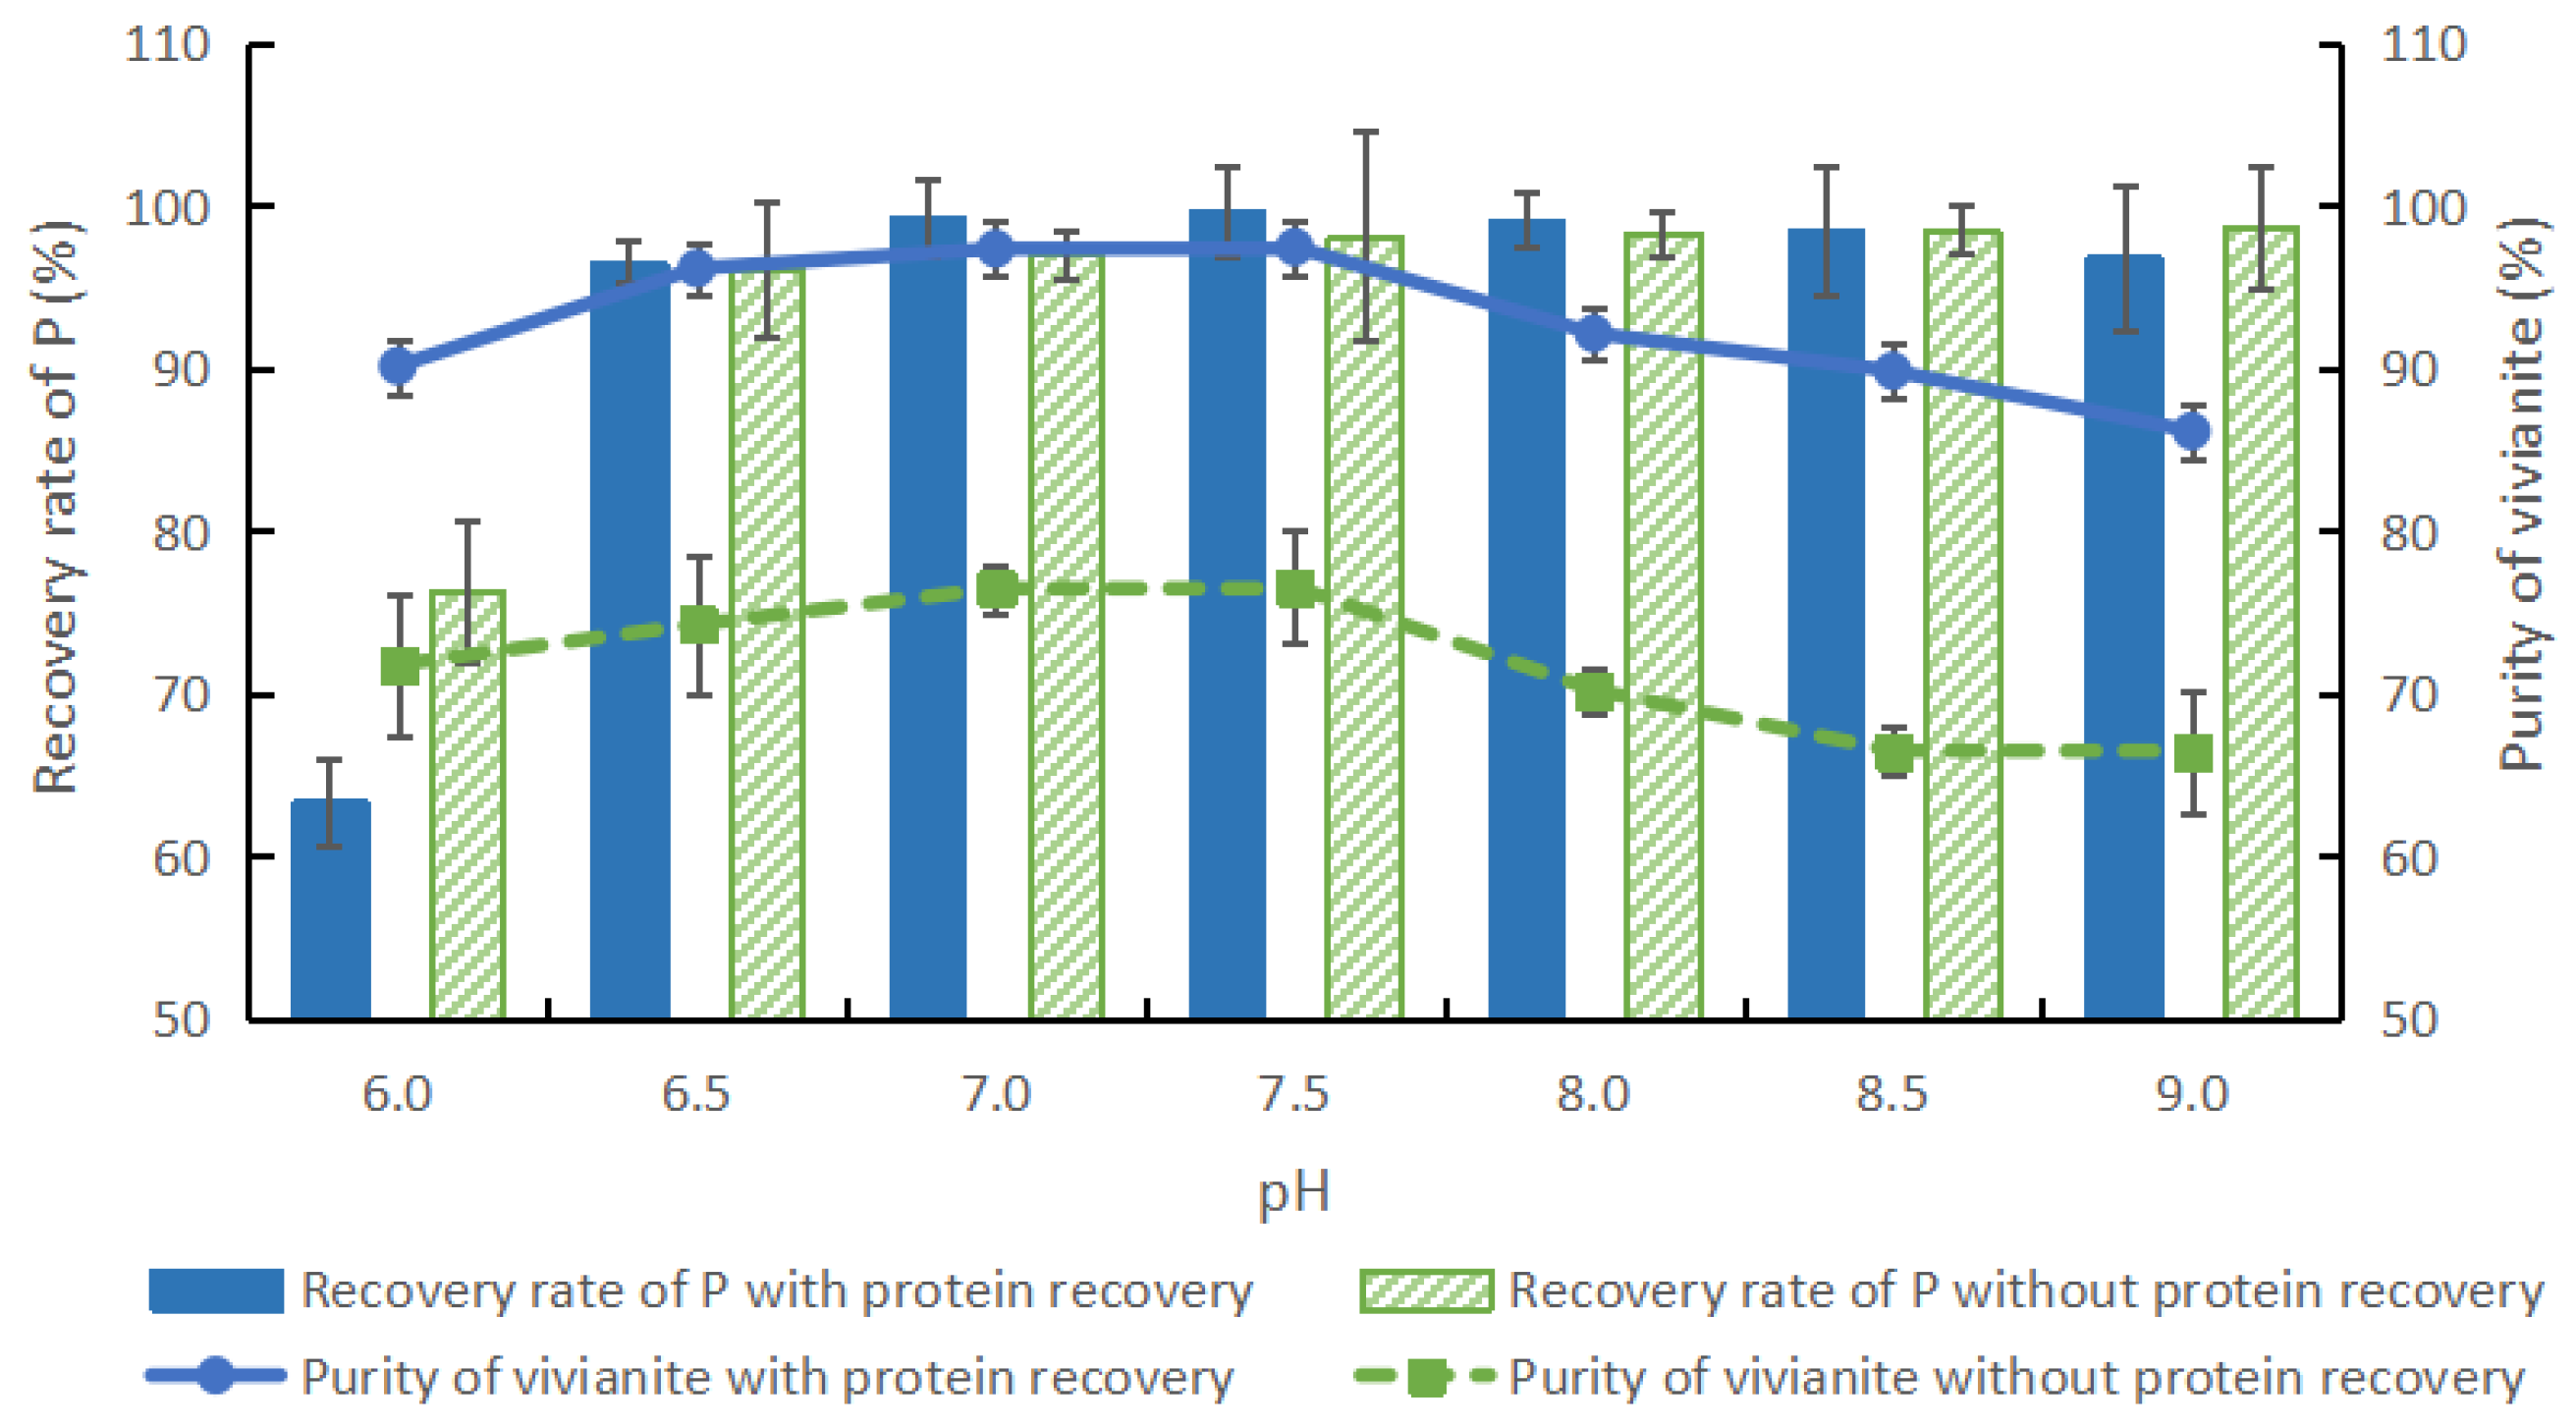
3.3.1. Effect of pH Adjustment and Protein Recovery

Soluble microbial products and components are released out during the enzymatic degradation processes and can affect crystal growth and forms [3]. Protein, one of the important organic matters of the microbe component, may adversely affect the crystallization process of vivianite [2,41]. It could be denatured and precipitated at pI 6.0, and the crude protein recovered could be used for cement foaming agent, etc. [44]. Therefore, the pilots of P recovery are planed under the conditions with and without protein recovery, respectively.
Between pH 6.5 and 9.0, the P recovery rate varies minutely with and without protein recovery and reaches 98.68 ± 10.04% and 99.56 ± 9.09%, respectively (Figure 6). However, crude protein recovery could obviously improve the purity of the vivianite crystals, which increases from 71.72 ± 0.04% to 97.44 ± 0.04% at pH 7.0–7.5, respectively (p < 0.01) (Figure 6). Considering the economy and feasibility of the operation, the optimal pH 7.5 with protein recovery is adopted to form vivianite crystals.

3.3.2. Effect of Reaction Temperatures and Time

P crystallization is a chemical process and the nucleus formation of vivianite crystals could be completed quickly in a short time. This pilot is mainly focused on the nucleus formation of the crystals. Table 2 presents that, under a reaction temperature of 15–40 °C, the purity of the crystallization is in the scale of 88.65 ± 0.66%–91.63 ± 0.54% and P recovery rates are in the scale of 95.16 ± 0.54%–96.85 ± 0.33% (p > 0.05). Certainly, in this pilot, reaction time (0–8 h) also has little impact on the purity of the crystallization (p > 0.05). However, reaction time and temperature could affect the growth rate, particle sizes, and the solubility and oversaturation of the crystals [17,45]. Therefore, further study should focus on optimizing parameters to increase vivianite crystal size and, also, a certain degree of Fe2+ excess to decrease the organics’ resulting inhibition [1,3].

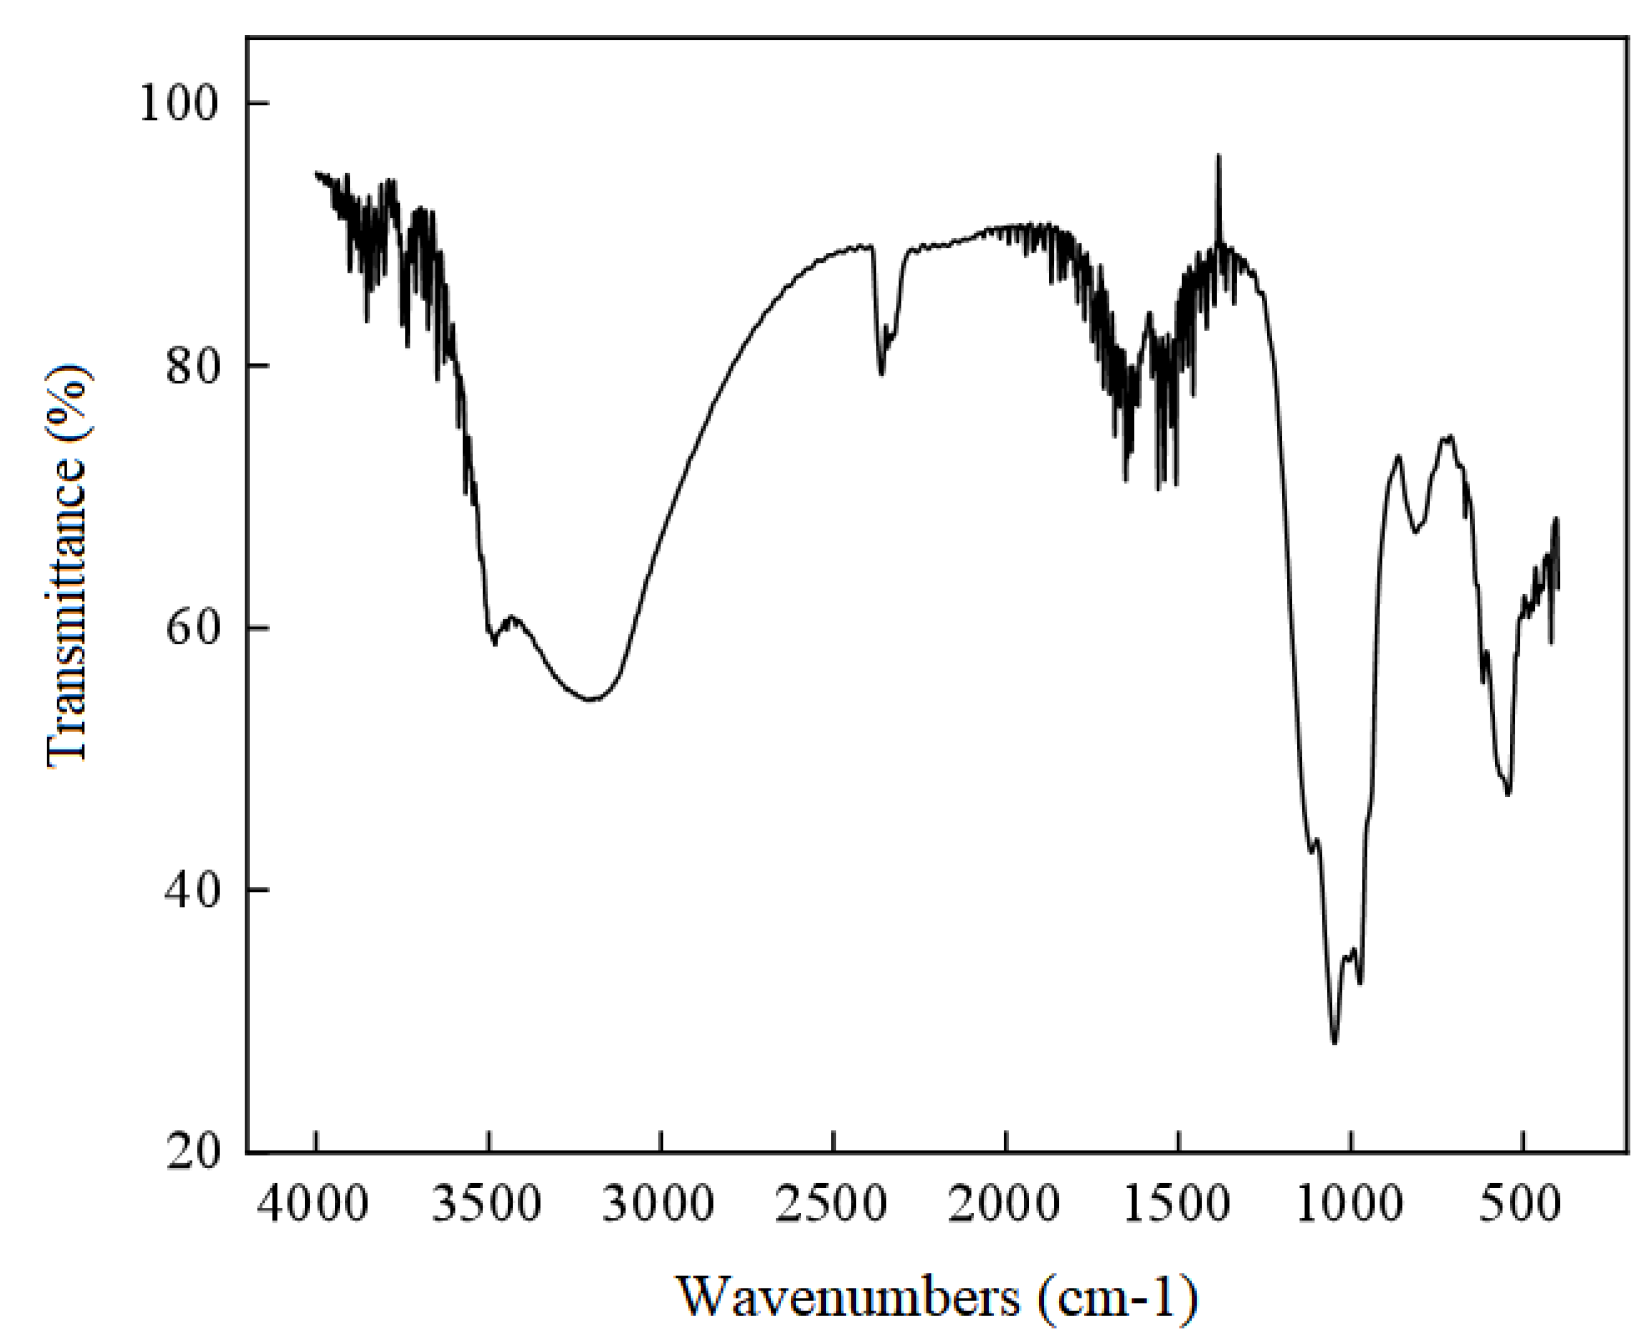
3.3.3. Spectroscopic Characterization of Vivianite

Vivianite recovered under the optimal factors is freeze-dried and then characterized with SEM (Figure 7), XRD (Figure 8), and FTIR (Figure 9). SEM images show that most of the crystals recovered from WAS are plate-like and lamellar aggregates (Figure 7). XRD analysis indicates that the 2θ has strong and sharp peaks at 11.16, 13.18, and 18.18°, which are similar to the standard diffraction pattern (PDF # 01-080-9696) of Inorganic Crystal Structure Database (ICSD) [46]. The peak at these 2θ appears high and narrow at the same position, and the diffraction peak intensity is 83–92% (Figure 8). According to the results of FTIR, it is concluded that antisymmetric expansion vibrations and symmetrical expansion vibrations of PO43− group occurs between 1010 and 1110 cm−1 and 950 and 980 cm−1, and asymmetric variable angle vibrations and symmetrical variable angle vibrations of PO43− group are between 550 and 620 cm−1 and 400 and 460 cm−1, respectively (Figure 9).

3.4. Humic Acids Characterization and Metal Sorption Affinity

3.4.1. Kinetic Characteristics of Ion Adsorption on Humic Acids

Zhang and Wang (2020) [47] reported that cations with larger atomic mass generate more kinetic energy during the movement, which increases their chances of collision with the adsorbent surface, thus enhancing the adsorption process [47]. Figure 10 illustrates that the adsorption of Pb2+, Cr2+, and Zn2+ on HAs reaches equilibrium after 1440 min, following the trend Pb2+ (6.98 mg/g) > Cr2+ (4.97 mg/g) > Zn2+ (4.85 mg/g).
The adsorption processes of Pb2+, Cr2+, and Zn2+ are divided into two stages: a rapid adsorption phase between 0 and 60 min (the ratios of the adsorption quantities to the equilibriums are 92.40%, 83.51%, and 79.79%, respectively) and slow adsorption and dynamic equilibrium during 60–360 min (98.72%, 98.21%, and 96.54%, respectively). The data are well fitted to the pseudo-second-order models, and the theoretical equilibrium adsorption capacities Qe calculated from the fitting models nearly approach the actual equilibriums (Table 3).
The intraparticle diffusion model plots show that the process is divided into two stages: the first stage involving outer surface adsorption and liquid film diffusion and the second stage involving intrasurface sorption. The rate of the first stage is faster than the second [32,48]. Three R2 values of model plots for adsorption of metals follow R12 > R22 > R2. Furthermore, C2 > C1 > 0 and kd1 > kd2, meaning that the rate of the first stage is faster than the second (Table 3). Once the outer surface adsorption is saturated, the rate of intrasurface sorption is also decreased for the resistance of ion diffusion [33,36]. These results are consistent with the pseudo-second-order models.

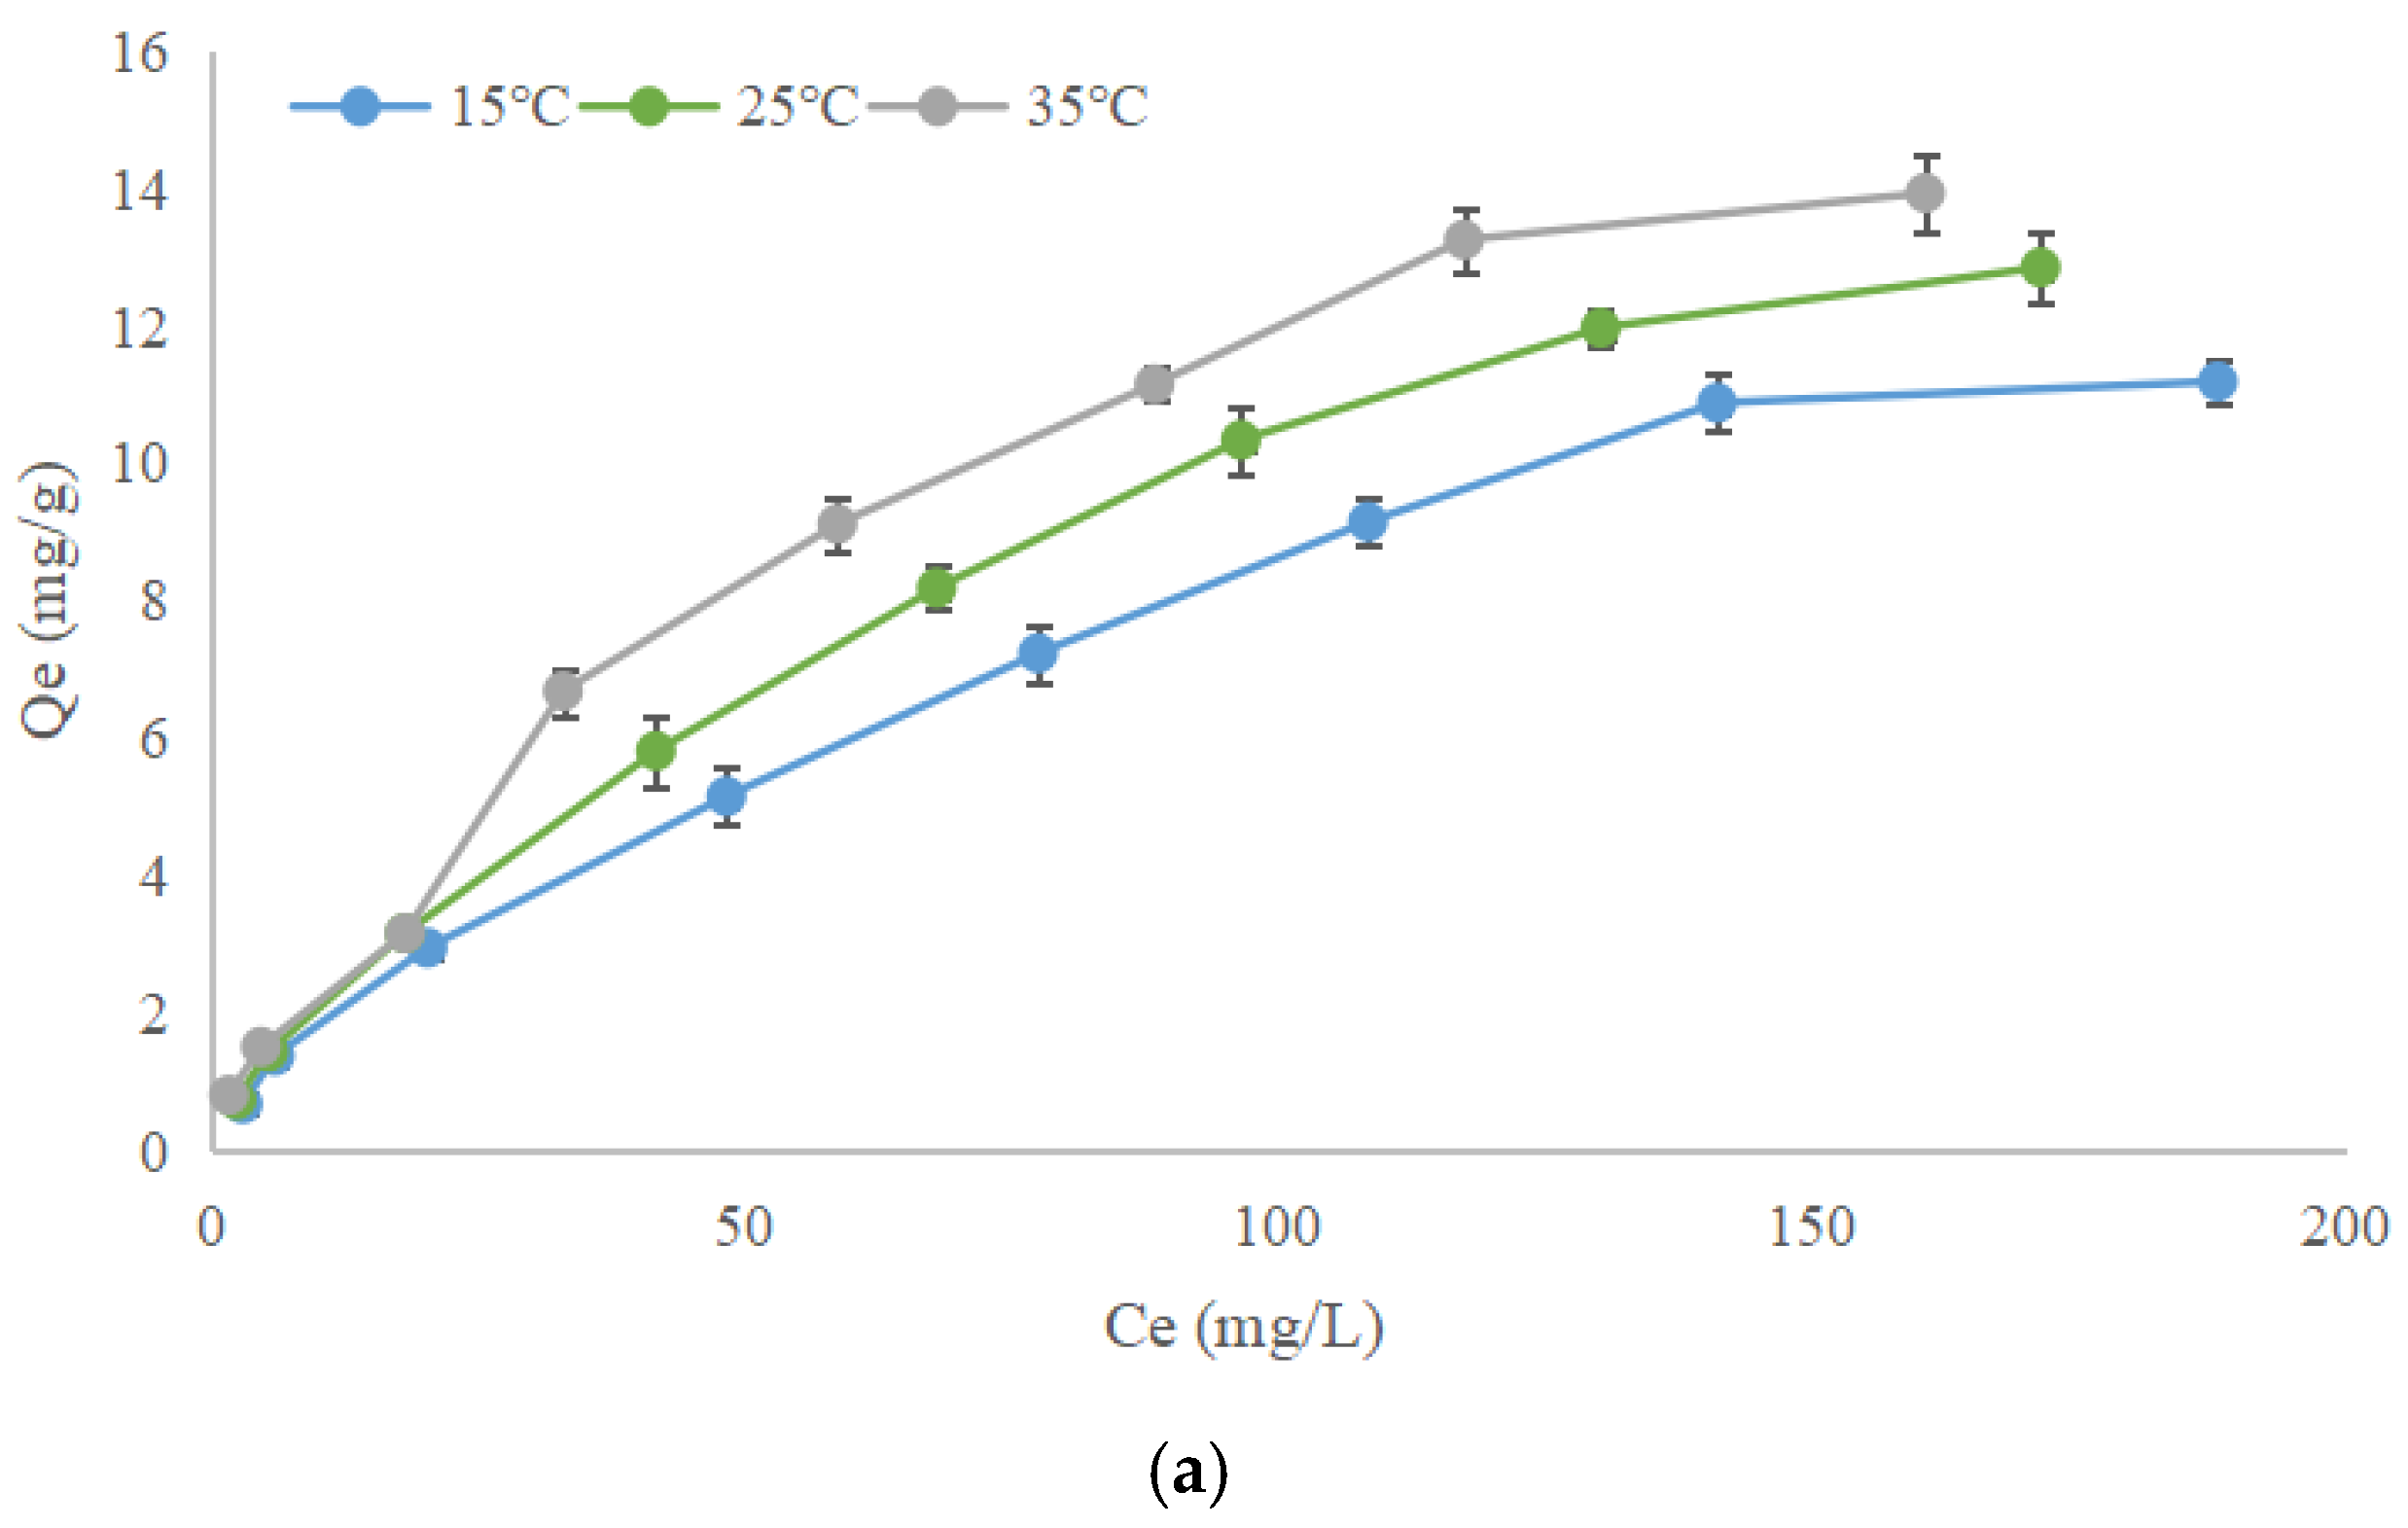
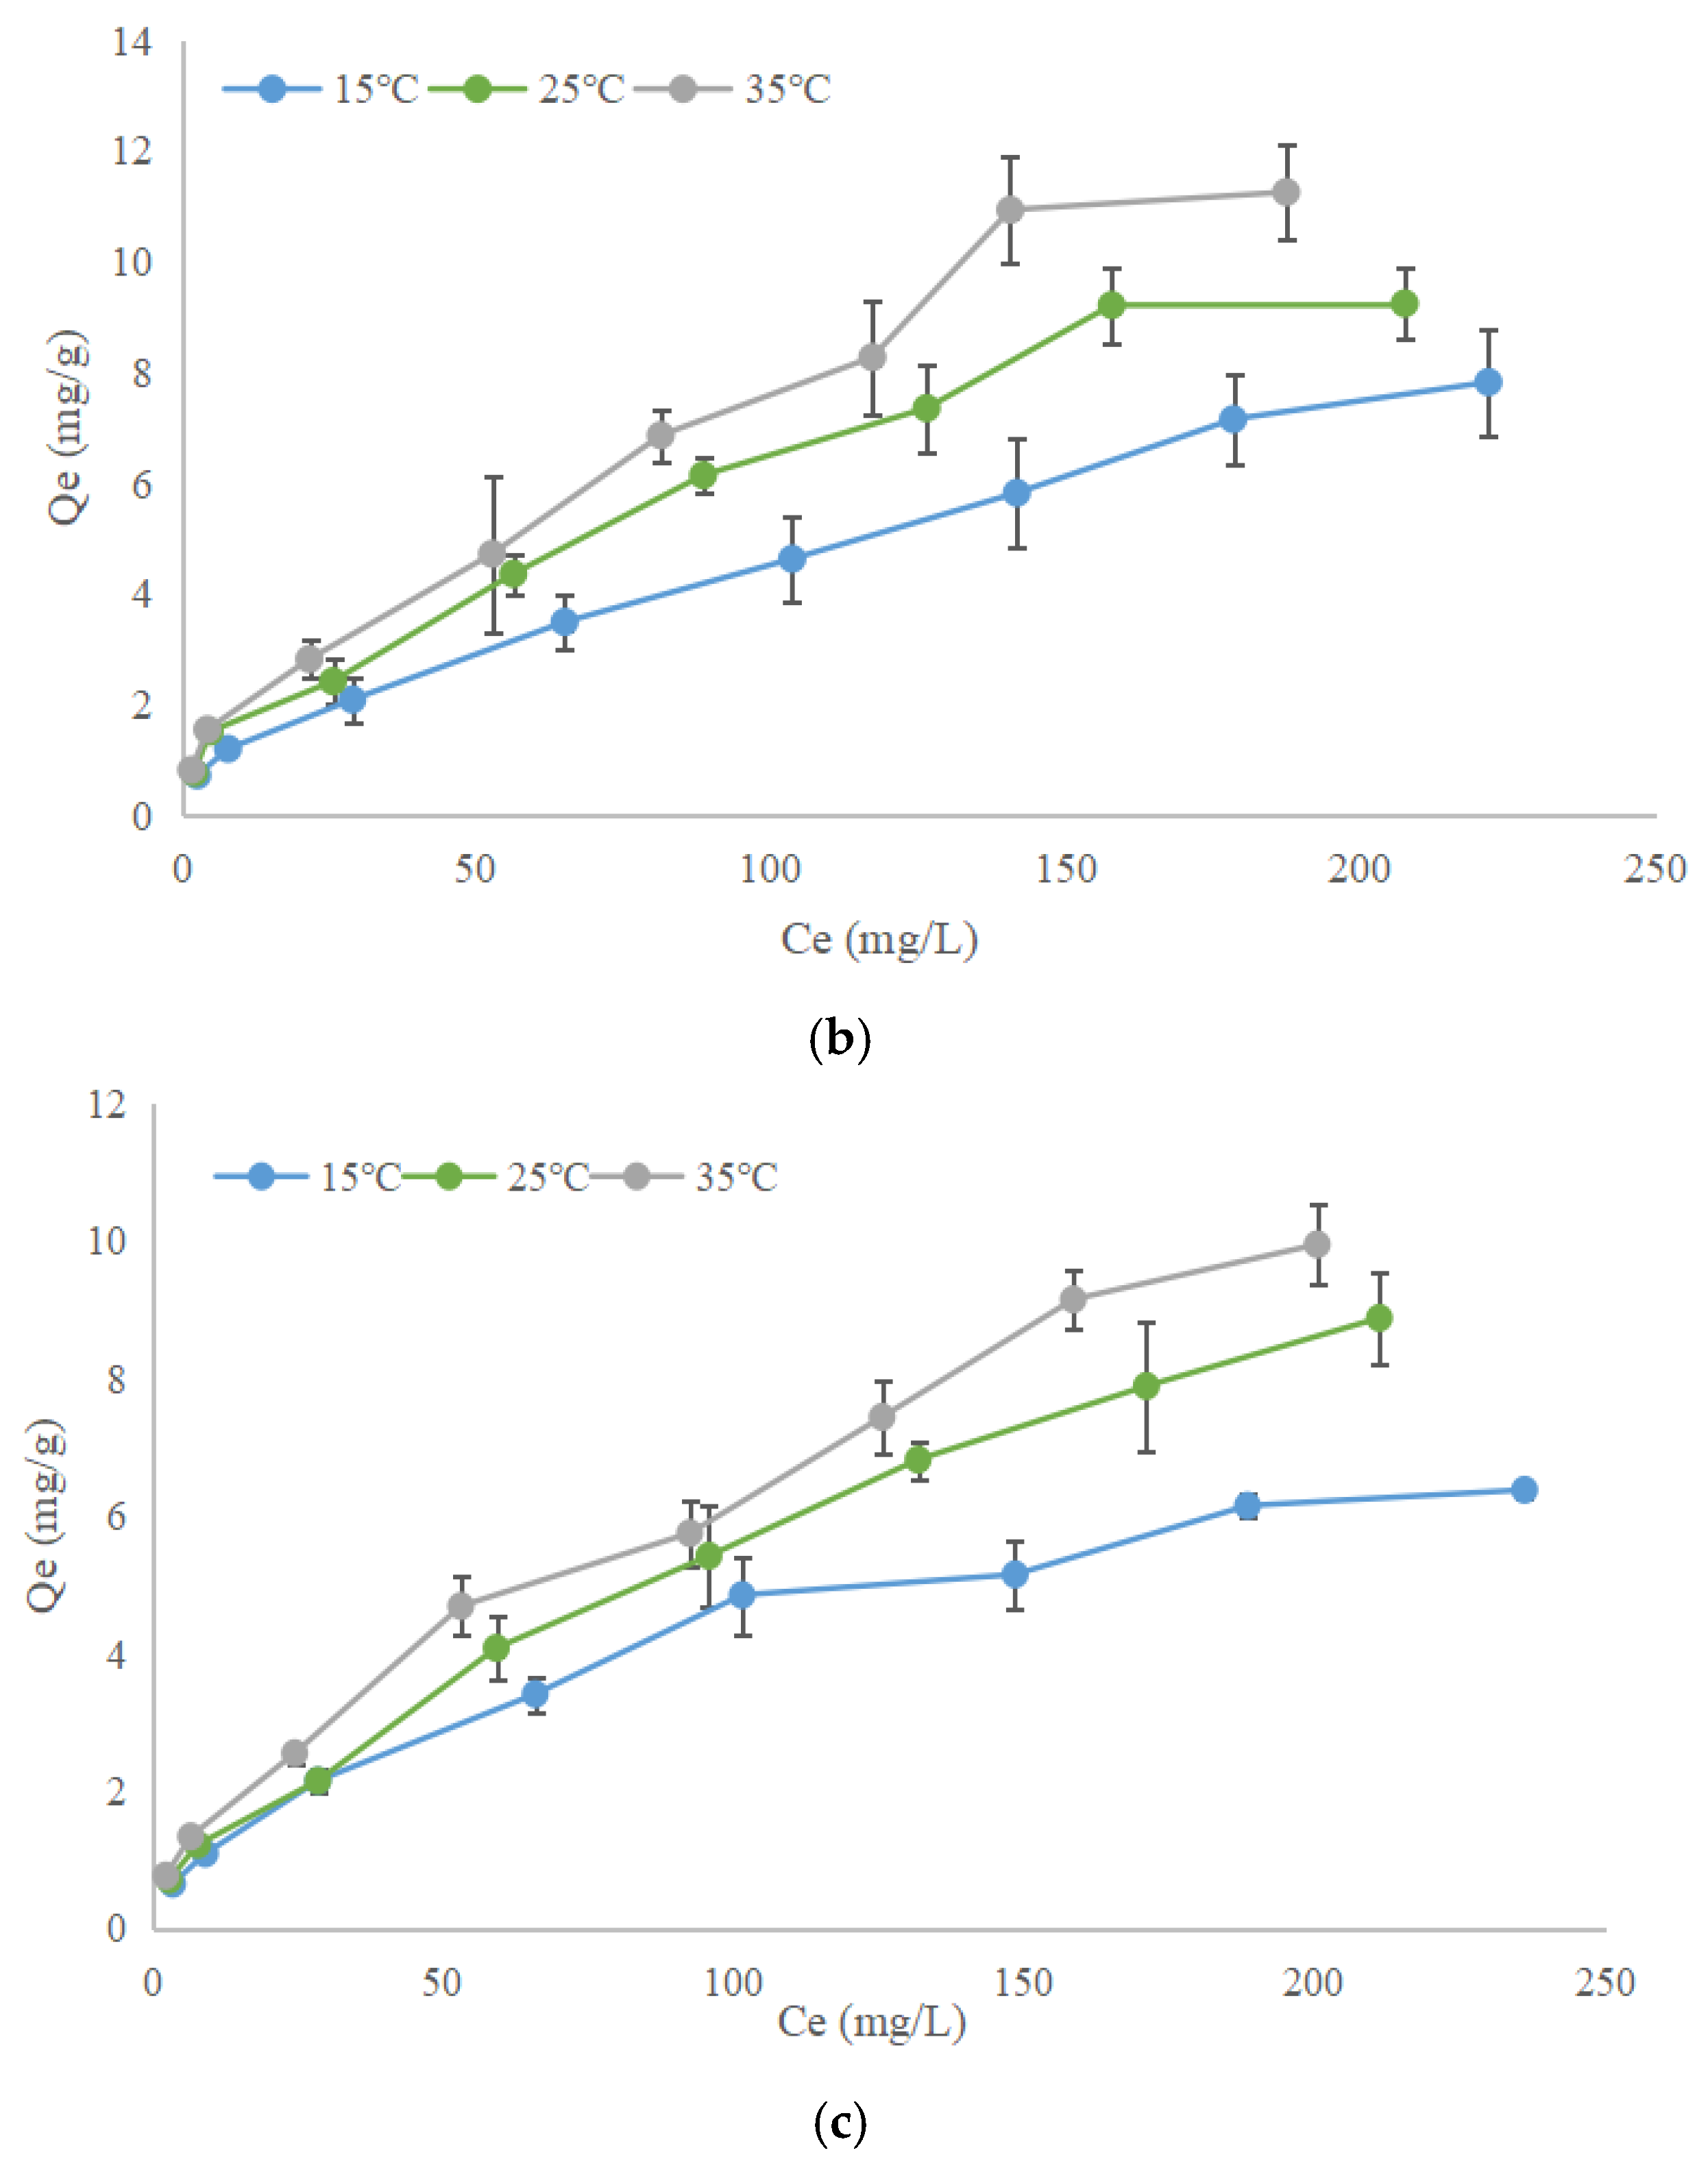
3.4.2. Adsorption Isotherm of Ions on Humic Acids

Experimental adsorption isotherms for Pb2+, Cr2+, and Zn2+ are presented in Figure 11. Qe values of Pb2+, Cr2+, and Zn2+ at different temperature follow the trend of 35 °C > 25 °C > 15 °C, and the extent of sorption increases with the increasing metal concentration (Figure 11). Higher temperatures could facilitate adsorption by increasing random Brownian motion and the frequency of collisions, indicating that the adsorption process is endothermic and more effective at elevated temperatures [36,47].
Both F-type and L-type are considered to appropriately describe the adsorption data when R2 > 0.89 [49]. The parameters of curves are shown in Table 4. Adsorption isotherms for the selected metals mostly follow the F-type, with R2 values between 0.980 and 0.996. The F-type isotherm is characterized by the high affinity of the adsorbent at low concentrations, and the parameter n is a measure of the deviation from adsorption linearity [49,50]. In Table 4, 1/n values of F-type isotherm of Pb2+, Cr2+, and Zn2+ are between 0 and 1, and the trend is Pb2+ > Zn2+ > Cr2+, which indicates the adsorption affinity of metals on HAs surface has weakened. HAs has a high sorption capacity, and the reaction on HAs surface is a favorable physical and chemical process [47].

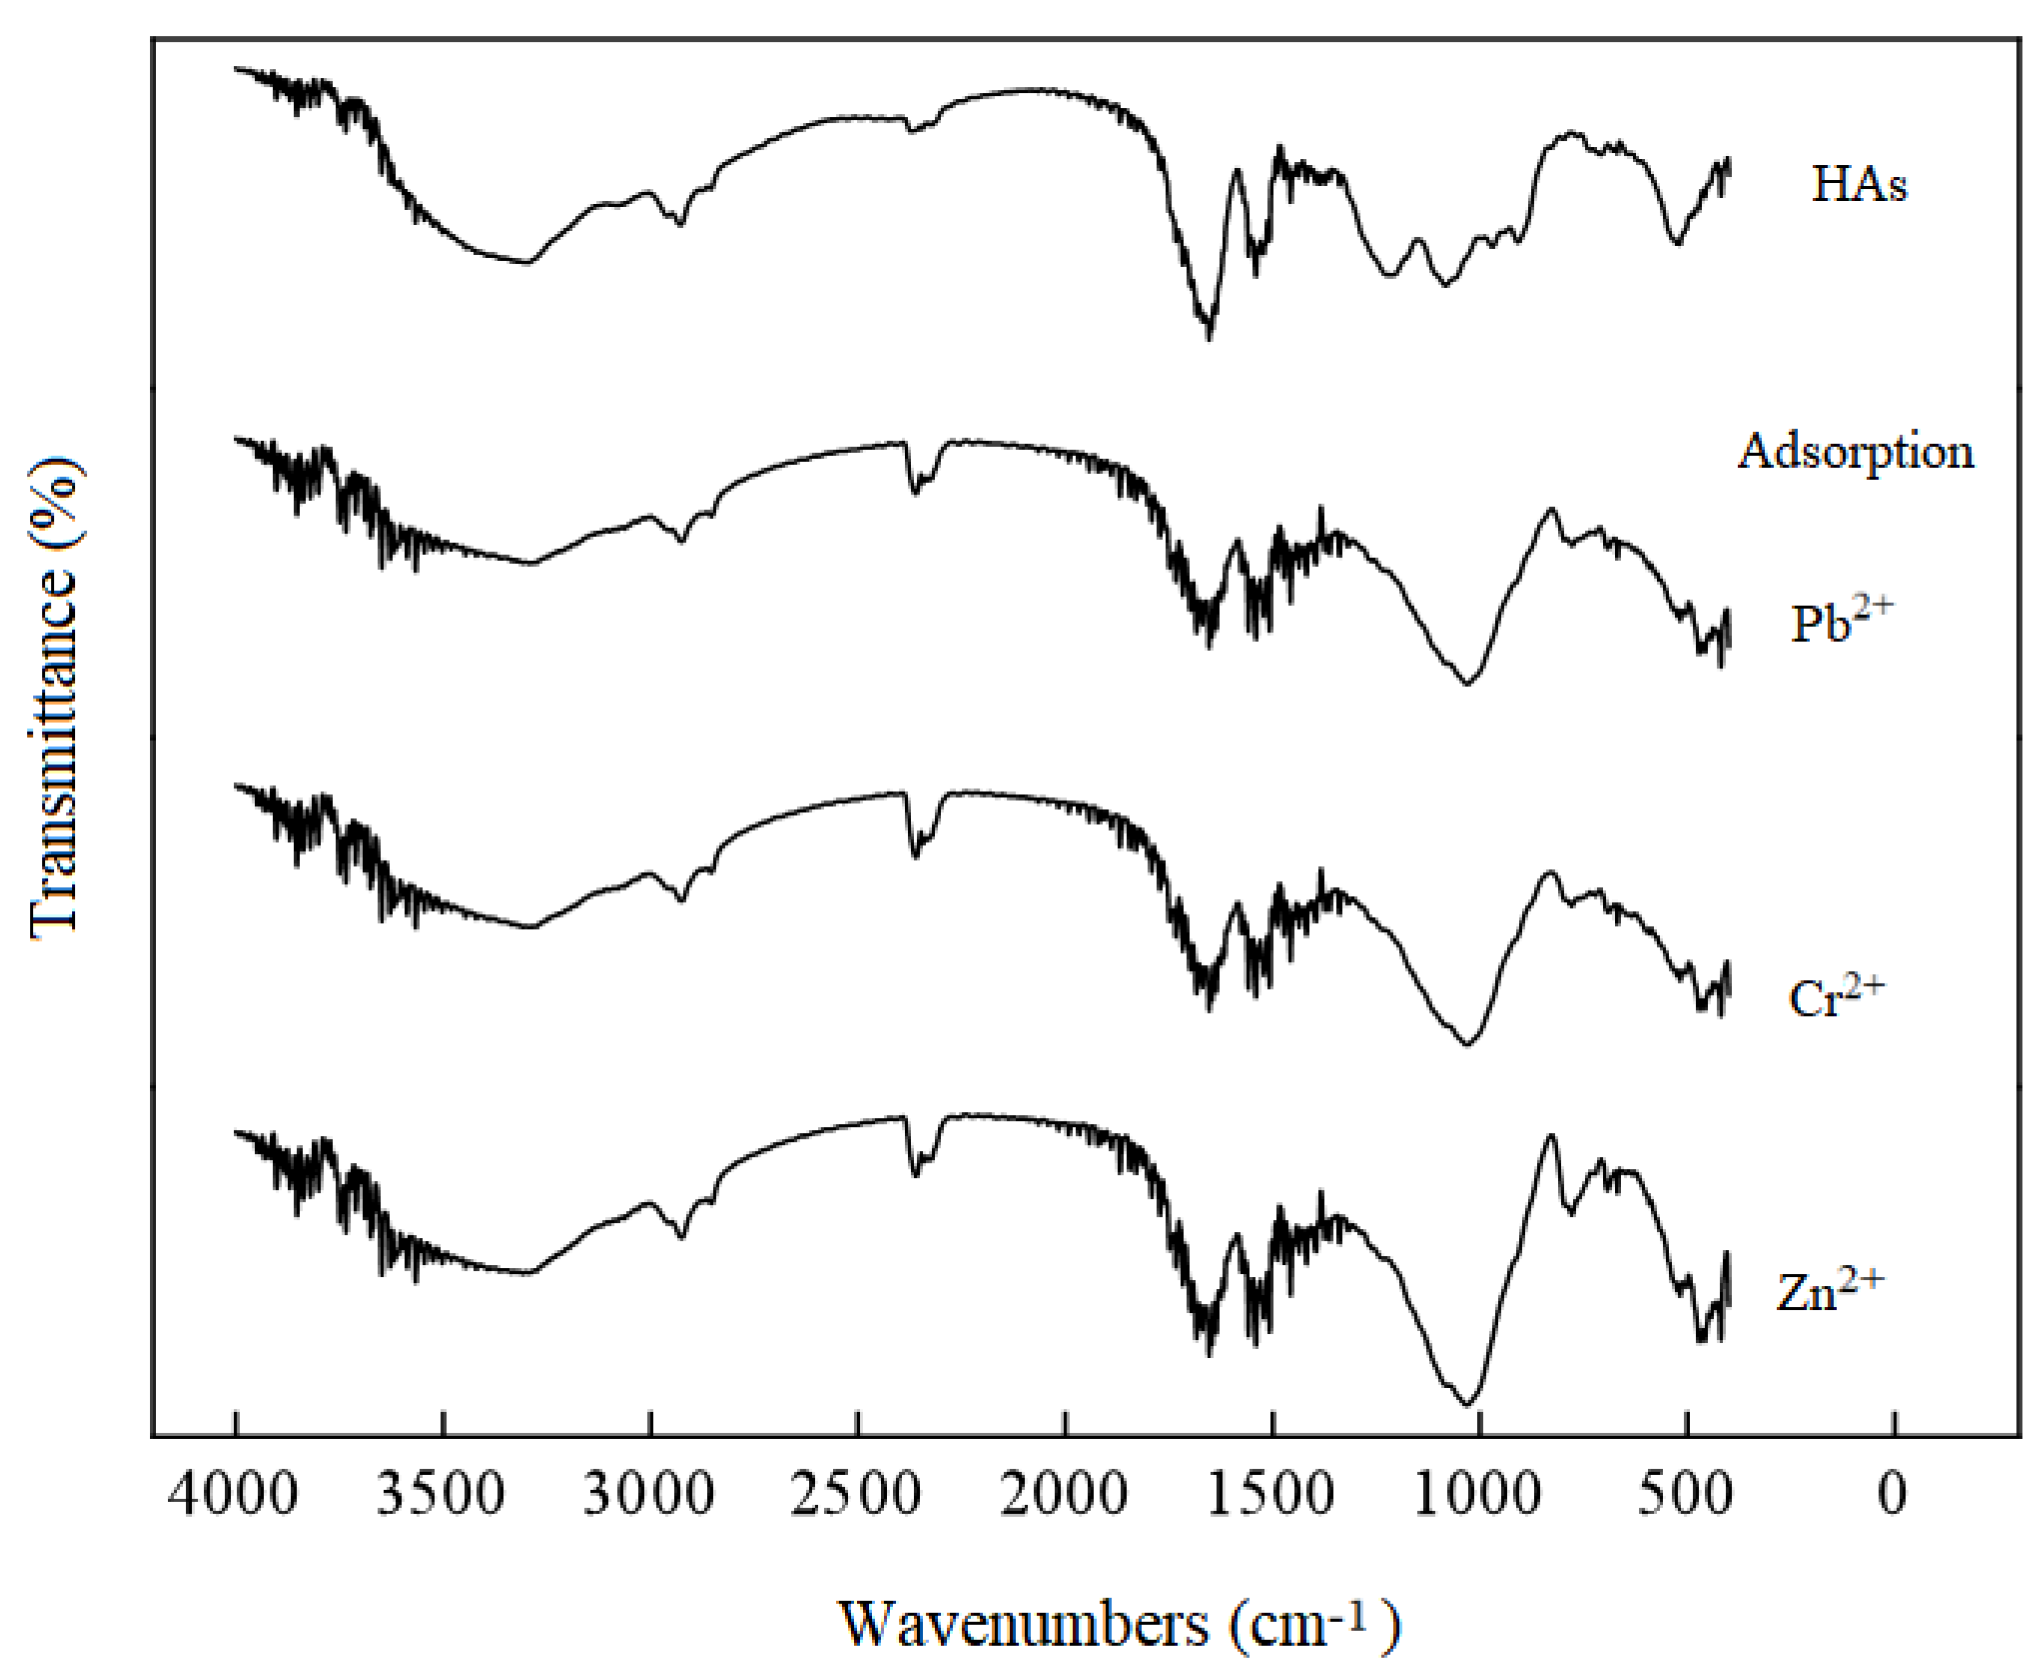
3.4.3. Characterization of Humic Acids Before and After Sorption

FTIR analysis is employed to observe changes in the functional groups on the surface of HAs before and after adsorption (Figure 12). The FTIR plots are similar and there is no obvious peak change during the adsorption process. The metal ions’ affinity for HAs is mainly based on the sorption ability of free functional groups, such as COOH and OH, and the accessibility of these cation-binding sites [48]. The strong bands from 3693 to 3621 cm−1 are ascribed to -OH groups and 3400 and 3200 cm−1 to COOH stretch on H bridges, respectively. The weak bands from 900 to 1300 cm−1 correspond to the C=C, C-O, or C=N stretching vibration absorptions and 1700 to 1600 cm−1 to NH2 bonds in amines. The bands from 800 to 1300 cm−1 are due to the -C-O, C-C, or C-N stretching vibration peak [4].
These results support that the interactions between metal and HAs occur on heterogeneous surfaces. High surface heterogeneity and steric effects in the molecule may lead to adsorption unsaturation of functional groups [51,52]. The factors that could influence the ability and velocity of adsorption included the number of free negative groups and their mutual repulsion and the concentration and kinematic velocity of metal ions, etc. Free negative groups on HAs surfaces and their mutual repulsion could expand HAs spatial structure and enhance the accessibility of cation [33,52]. When the adsorption saturated, occupied functional negative groups could weaken the ability of adjacent free active sites to form associations with free metals and the adsorption plateau is reached [30].

4. Conclusions

A promising and effective alternative for synchronously reclaiming vivianite and HAs from WAS was proposed. Two steps of pretreatment of FeCl3 flocculation and enzymatic hydrolysis of sludge were used to enrich and release P and Fe to the supernatant. Then, pH adjustment was adopted to reclaim vivianite crystals and HAs. After the pretreatment, the supernatant accumulates PO43− and Fe2+ and the molar ratio of Fe2+/PO43− is 2.21. Using pH adjustment of the supernatant, protein is recovered at pI 6.0, which could significantly improve the purity of vivianite crystallized at pH 7.5. HAs extracted from the residuals have high metal adsorption affinity and the adsorption process is endothermic and easy to carry out. However, future research should focus on how to enlarge the size of vivianite and how to enhance the adsorption affinity of HAs. This technology demonstrates high feasibility and effectiveness to synchronously reclaim vivianite and HAs, contributing to multiple resource recoveries from WAS and alleviating environmental issues associated with sludge disposal.

Author Contributions

Conceptualization and project administration, Q.C.; formal analysis and investigation, Q.C. and B.N.; supervision, Q.C. and Y.L.; writing original draft, Q.C. and B.N.; writing—review and editing, Q.C. and Y.L. All authors have read and agreed to the published version of the manuscript.

Funding

This work was supported by Henan scientific and technological project (grant number 242102320093).

Data Availability Statement

The data supporting the conclusions of this study can be obtained from the corresponding author.

Acknowledgments

We appreciate Michael E Willmore and Xindi Li for their help to improve the manuscript and referees for their suggestions.

Conflicts of Interest

The authors declare no conflicts of interest.

References

  1. Wang, Y.; Li, H.; Zhao, Y.; Qi, M.; Wang, L.; Feng, J. Phosphate recovery from wastewater via vivianite crystallization using separable ferrous modified biochar beads. Chem. Eng. J. 2024, 498, 155453. [Google Scholar] [CrossRef]
  2. Cao, J.; Wang, S.; Xu, R.; Luo, J.; Ni, B.; Fang, F. Phosphorus recovery from synthetic anaerobic fermentation supernatant via vivianite crystallization: Coupling effects of various physicochemical process parameters. Sci. Total Environ. 2023, 897, 165416. [Google Scholar] [CrossRef] [PubMed]
  3. Cui, H.; Yang, X.; Gao, X.; Sun, D.; Cheng, X. Compatibility of vivianite-crystallization pathway of phosphorus recovery with anaerobic digestion systems of thermally hydrolyzed sludge. Environ. Res. 2024, 260, 119640. [Google Scholar] [CrossRef] [PubMed]
  4. Michalska, J.; Turek-Szytow, J.; Dudło, A.; Kowalska, K.; Surmacz-Górska, J. Evaluation of the applicability of selected analytical techniques for determining the characteristics of humic substances sourced from by-products of the wastewater treatment process. Sci. Total Environ. 2023, 888, 164237. [Google Scholar] [CrossRef] [PubMed]
  5. Nguyen, H.; Prot, T.; Wijdeveld, W.; Korving, L.; Dugulan, A.I.; Brück, E.; Haarala, A.; Van Loosdrecht, M.C.M. Robust magnetic vivianite recovery from digested sewage sludge: Evaluating resilience to sludge dry matter and particle size variations. Water Res. 2024, 266, 122407. [Google Scholar] [CrossRef]
  6. Liang, D.; Chang, J.; Wu, Y.; Wang, S.; Wang, X.; Ren, N.; Li, N. The screening of iron oxides for long-term transformation into vivianite to recover phosphorus from sewage. Water Res. 2024, 265, 122250. [Google Scholar] [CrossRef]
  7. Becarelli, S.; Chicca, I.; Siracusa, G.; China, S.L.; Gentini, A.; Lorenzi, R.; Munz, G.; Petroni, G.; Levin, D.B.; Gregorio, S.D. Hydrocarbonoclastic Ascomycetes to enhance co-composting of total petroleum hydrocarbon (TPH) contaminated dredged sediments and lignocellulosic matrices. New Biotechnol. 2019, 50, 27–36. [Google Scholar] [CrossRef]
  8. Cheng, Q.; Wang, D.; Niu, B.; Zhang, L.; Wang, X.; Zhang, S. Optimization Effects of Enzymatic Hydrolysis Pretreatment Combined with Bioaugmentation on the Aerobic Compost of Sewage Sludge. Ecol. Environ. 2021, 30, 2395–2401. (In Chinese) [Google Scholar]
  9. Xin, X.; He, J.; Li, L.; Qiu, W. Enzymes catalyzing pre-hydrolysis facilitated the anaerobic fermentation of waste activated sludge with acidogenic and microbiological perspectives. Bioresour. Technol. 2018, 250, 69–78. [Google Scholar] [CrossRef]
  10. He, J.G.; Xin, X.D.; Qiu, W.; Zhang, J.; Wen, Z.; Tang, J. Performance of the lysozyme for promoting the waste activated sludge biodegradability. Bioresour. Technol. 2014, 170, 108–114. [Google Scholar] [CrossRef]
  11. Luo, K.; Yang, Q.; Li, X.; Tang, Y.; Luo, Z.; Liu, J. Enhanced Hydrolysis of Excess Sludge by External Enzymes. Environ. Sci. 2010, 31, 763–767. (In Chinese) [Google Scholar] [CrossRef]
  12. Zhu, X.; Liu, J.; Li, L.; Zhen, G.; Lu, X.; Zhang, J.; Liu, H.; Zhou, Z.; Wu, Z.; Zhang, X. Prospects for humic acids treatment and recovery in wastewater: A review. Chemosphere 2023, 312, 137193. [Google Scholar] [CrossRef] [PubMed]
  13. Wen, Q.; Liu, B.; Chen, Z. Simultaneous recovery of vivianite and produce short-chain fatty acids from waste activated sludge using potassium ferrate as pre-oxidation treatment. Environ. Res. 2022, 208, 112661. [Google Scholar] [CrossRef] [PubMed]
  14. Amin, L.; Al-Juboori, R.A.; Lindroos, F.; Bounouba, M.; Blomberg, K.; Viveros, M.L.; Graan, M.; Azimi, S.; Lindén, J.; Mikola, A.; et al. Tracking the formation potential of vivianite within the treatment train of full-scale wastewater treatment plants. Sci. Total Environ. 2024, 912, 169520. [Google Scholar] [CrossRef] [PubMed]
  15. Eshun, L.E.; García-López, A.M.; Recena, R.; Coker, V.; Shaw, S.; Lloyd, J.; Delgado, A. Assessing microbially mediated vivianite as a novel phosphorus and iron fertilizer. Chem. Biol. Technol. Agric. 2024, 11, 47. [Google Scholar] [CrossRef]
  16. Metz, P.; Kumar, N.; Schenkeveld, W.D.C.; Obst, M.; Voegelin, A.; Mangold, S.; Kraemer, S.M. Effect of oxidation on vivianite dissolution rates and mechanism. Environ. Sci. Technol. 2024, 58, 15321–15332. [Google Scholar] [CrossRef]
  17. Wu, Y.; Luo, J.; Zhang, Q.; Aleem, M.; Fang, F.; Xue, Z.; Cao, J. Potentials and challenges of phosphorus recovery as vivianite from wastewater: A review. Chemosphere 2019, 226, 246–258. [Google Scholar] [CrossRef]
  18. Saoudi, M.A.; Dabert, P.; Ponthieux, A.; Vedrenne, F.; Daumer, M. Correlation between phosphorus removal technologies and phosphorus speciation in sewage sludge: Focus on iron-based P removal technologies. Environ. Technol. 2022, 44, 2091–2103. [Google Scholar] [CrossRef]
  19. Wilfert, P.; Kumar, P.S.; Korving, L.; Witkamp, J.; Loosdrecht, M.C.M. The Relevance of Phosphorus and Iron Chemistry to the Recovery of Phosphorus from Wastewater: A Review. Environ. Sci. Technol. 2015, 49, 9400–9414. [Google Scholar] [CrossRef]
  20. Eshun, L.E.; Coker, V.S.; Shaw, S.; Lloyd, J.R. Strategies for optimizing biovivianite production using dissimilatory Fe(III)-reducing bacteria. Environ. Res. 2024, 242, 117667. [Google Scholar] [CrossRef]
  21. Knyazev, Y.V.; Mikhail, S.M.S.; Ikkert, O.P.; Semenov, S.V.; Bayukov, O.Q.; Nikolenko, A.D.; Nazmov, V.P.; Volochaev, M.N.; Dubrovskiy, A.A.; Molokeev, M.S.; et al. Microbially mediated synthesis of vivianite by Desulfosporosinus on the way to phosphorus recovery. Environ. Sci. Adv. 2024, 3, 897–911. [Google Scholar] [CrossRef]
  22. Wu, M.; Liu, J.; Gao, B.; Sillanpää, M. Phosphate substances transformation and vivianite formation in P-Fe containing sludge during the transition process of aerobic and anaerobic conditions. Bioresour. Technol. 2021, 319, 124259. [Google Scholar] [CrossRef] [PubMed]
  23. Li, C. Phosphorus Recovery from Sewage or Sludge by Vivianite Crystallization; Yantai Institute of Coastal Zone Research, Chinese Academy of Sciences: Yantai, China, 2021. (In Chinese) [Google Scholar]
  24. Wu, Y.; Cao, J.; Zhang, T.; Zhao, T.; Xu, R.; Zhang, Q.; Fang, F.; Luo, J. A novel approach of synchronously recovering phosphorus as vivianite and volatile fatty acids during waste activated sludge and food waste co-fermentation: Performance and mechanisms. Bioresour. Technol. 2020, 305, 123078. [Google Scholar] [CrossRef] [PubMed]
  25. Hao, X.; Zhou, J.; Wang, C.; Loosdrect, M. New product of phosphorus recovery-Vivianite. Acta Sci. Circumstantiae 2018, 38, 4223–4234. (In Chinese) [Google Scholar] [CrossRef]
  26. Cao, J.; Wu, Y.; Zhao, J.; Jin, S.; Aleem, M.; Zhang, Q.; Fang, F.; Xue, Z.; Luo, J. Phosphorus recovery as vivianite from waste activated sludge via optimizing iron source and pH value during anaerobic fermentation. Bioresour. Technol. 2019, 293, 122088. [Google Scholar] [CrossRef]
  27. Wilfert, P.; Dugulan, A.I.; Goubitz, K.; Korving, L.; Witkamp, G.J.; Van Loosdrecht, M.C.M. Vivianite as the main phosphate mineral in digested sewage sludge and its role for phosphate recovery. Water Res. 2018, 144, 312–321. [Google Scholar] [CrossRef]
  28. Beckett, R.; Jue, Z.; Giddings, J.C. Determination of molecular weight distributions of fulvic and humic acids using flow field-flow fractionation. Environ. Sci. Technol. 1987, 21, 289–295. [Google Scholar] [CrossRef]
  29. Liu, Y.; Han, Y.; Zhang, J.; Hou, Y.; Song, Y.; Lu, C.; Li, H.; Guo, J. Deciphering effects of humic acid in landfill leachate on the simultaneous nitrification, anammox and denitrification (SNAD) system from performance, electron transfer and microbial community. Sci. Total Environ. 2022, 809, 151178. [Google Scholar] [CrossRef]
  30. Niu, H.; Yang, H.; Tong, L. Adsorption behaviors of Au(Ⅲ) onto humic acid extracted from gold ore: Adsorptive kinetics, isotherm and mechanism. Colloids Surf. A Physicochem. Eng. Asp. 2021, 630, 127442. [Google Scholar] [CrossRef]
  31. Pedroza, R.H.P.; David, C.; Lodeiro, P.; Rey-Castro, C. Interactions of humic acid with pristine poly (lactic acid) microplastics in aqueous solution. Sci. Total Environ. 2024, 908, 168366. [Google Scholar] [CrossRef]
  32. Wang, H.; Wang, X.; Ma, J.; Xia, P.; Zhao, J. Removal of cadmium (II) from aqueous solution: A comparative study of raw attapulgite clay and a reusable waste-struvite/attapulgite obtained from nutrient-rich wastewater. J. Hazard. Mater. 2017, 329, 66–76. [Google Scholar] [CrossRef]
  33. Li, A.; Pi, S.; Wei, W.; Chen, T.; Yang, J.; Ma, F. Adsorption behavior of tetracycline by extracellular polymeric substrates extracted from Klebsiella sp. J. Environ. Sci. Pollut. Res. Int. 2016, 23, 25084–25092. [Google Scholar] [CrossRef] [PubMed]
  34. GB 18918-2002; Discharge Standard of Pollutants for Municipal Wastewater Treatment Plant. State Environmental Protection Administration: Beijing, China, 2003.
  35. Swift, R.S. Humic Substances in Soil, Sediment, and Water; Aiken, G.R., McKnight, D.M., Wershaw, R.L., MacCarthy, P., Eds.; John Wiley: New York, NY, USA, 1985; pp. 387–408. [Google Scholar]
  36. Azizian, S.; Eris, S. Chapter 6—Adsorption isotherms and kinetics. In Interface Science and Technology; Ghaedi, M., Ed.; Elsevier B.V.: Amsterdam, The Netherlands, 2021; Volume 33, pp. 445–509. [Google Scholar] [CrossRef]
  37. GB 11893-89; Water Quality-Determination of Total Phosphorus-Ammonium Molybdate Spectrophotometric Method. State Environmental Protection Administration: Beijing, China, 1990.
  38. HJ 535-2009; Water Quality-Determination of Ammonia Nitrogen-Nessler’s Reagent Spectrophotometry. Ministry of Ecology and Environment: Beijing, China, 2010.
  39. HJ/T 345-2007; Water Quality-Determination of Iron-Phenanthroline Spectrophotometry. State Environmental Protection Administration: Beijing, China, 2007.
  40. HJ/T 399-2007; Water Quality-Determination of the Chemical Oxygen Demand-Fast Digestion-Spectrophotometric Method. State Environmental Protection Administration: Beijing, China, 2008.
  41. Zhang, Y.; Yang, X.; Zhang, X.; Sun, D.; Liu, X.; Lan, R.; Zheng, M.; Loosdrecht, M.C.M.; Cheng, X. Proteins in hydrothermal carbonization liquor of sewage sludge interfere with vivianite crystallization for phosphorus recovery. Resour. Conserv. Recycl. 2024, 208, 107731. [Google Scholar] [CrossRef]
  42. Chang, J.; Liang, D.; Gao, Y.; Sun, Y.; Wang, X.; Ren, N.; Li, N. Nano-magnetite enhances dissimilated iron reduction to vivianite from sewage by structuring an enormous and compact electron transfer network. Water Res. 2025, 268, 122583. [Google Scholar] [CrossRef] [PubMed]
  43. Feng, X.; Zhou, J.; Pan, Y. Vivianite crystallization method to recover phosphorus in municipal sewage enriched by biofilm method. Environ. Chem. 2022, 41, 1787–1795. (In Chinese) [Google Scholar]
  44. Cao, X.; Zhao, Z. Analysis of influencing factor on the component of extracellular polymeric substance(EPS). Environ. Sci. Technol. 2010, 33, 420–424. [Google Scholar]
  45. Yu, Y.; Lei, Z.; Yuan, T.; Jiang, Y.; Chen, N.; Feng, C.; Shimizu, K.; Zhang, Z. Simultaneous phosphorus and nitrogen recovery from anaerobically digested sludge using a hybrid system coupling hydrothermal pretreatment with MAP precipitation. Bioresour. Technol. 2017, 243, 634–640. [Google Scholar] [CrossRef] [PubMed]
  46. Capitelli, F.; Chita, G.; Rosaria Ghiara, R.; Rossi, M. Crystal-chemical investigation of Fe3(PO4)2·8H2O vivianite minerals. Z. Für Krist.-Cryst. Mater. [CrossRef]
  47. Zhang, M.; Wang, C. Effects of Fe-Mn-modified biochar addition on anaerobic digestion of sewage sludge: Biomethane production, heavy metal speciation and performance stability. Bioresour. Technol. 2020, 313, 123695. [Google Scholar] [CrossRef]
  48. Fazeli, S.M.; Forghani, A.; Boguta, P.; Anoosha, M.; Owens, G. Optimal isotherm model and explanatory characteristics associated with metal ion adsorption on humic acids isolated from forest soils. J. Soils Sediments 2022, 22, 2392–2405. [Google Scholar] [CrossRef]
  49. Khalili, F.; Al-Banna, G. Adsorption of uranium(VI) and thorium(IV) by insolubilized humic acid from Ajloun soil-Jordan. J. Environ. Radioact. 2015, 146, 16–26. [Google Scholar] [CrossRef]
  50. Kumar, K.V.; Gadipelli, S.; Wood, B.; Ramisetty, K.A.; Stewart, A.A.; Howard, C.A.; Brett, D.J.L.; Rodriguez-Reinoso, F. Characterization of adsorption site energies and heterogeneous surfaces of porous materials. J. Mater. Chem. A 2019, 7, 10104–10137. [Google Scholar] [CrossRef]
  51. Boguta, P.; D’Orazio, V.; Sokołowska, Z.; Senesi, N. Effects of selected chemical and physicochemical properties of humic acids from peat soils on their interaction echanisms with copper ions at various pHs. J. Geochem. Explor. 2016, 168, 119–126. [Google Scholar] [CrossRef]
  52. Chianese, S.; Fenti, A.; Iovino, P.; Musmarra, D.; Salvestrini, S. Sorption of Organic Pollutants by Humic Acids: A Review. Molecules 2020, 25, 918. [Google Scholar] [CrossRef]
Figure 1. Simplified scheme of simultaneous recovery of vivianite and humic acids from waste activated sludge (WAS) via ferric trichloride flocculation and enzymatic hydrolysis co-treatment.
Processes 12 02737 g001
Figure 2. Time-course variations of pH and SCOD of P-Fe supernatant and the control during the enzymatic hydrolysis process. (P-Fe supernatant was separated after the enzymatic hydrolysis of P-Fe sludge in a sealed container at 45 °C, 150 r/min, represented as blue color. In the same condition, the control was also separated after the anaerobic culture of the raw sludge, represented as green color).
Processes 12 02737 g002
Figure 3. Variations in P contents of P-Fe supernatant (a) (hydrolyzed with the enzymes, marked as full line and deep blue color) and the control (b) (anaerobically hydrolyzed, marked as dotted line and light blue color).
Processes 12 02737 g003
Figure 4. Variations in Fe contents of P-Fe supernatant (a) (hydrolyzed with the enzymes, marked as full line and deep green color) and the control (b) (anaerobically hydrolyzed, marked as dotted line and light green color).
Processes 12 02737 g004
Figure 5. Variations in ratios of Fe and P (mol/mol) of P-Fe supernatant (hydrolyzed with the enzymes, represented as blue color) and the control (anaerobically hydrolyzed, represented as green color).
Processes 12 02737 g005
Figure 6. Effects of pH on P recovery and crystallization purity with protein recovery (protein is reclaimed at pI 6.0, represented as blue color) and without protein recovery (represented as green color).
Processes 12 02737 g006
Figure 7. Morphological features of vivianite with scale bars of 2 μm (a) (magnification 5.00 K) and 500 nm (b) (magnification 20.00 K) (vivianite was crystallized in this pilot at pH 7.5 with protein recovery, and other parameters of SEM included Extra High Tension (EHT) = 3.00 kV, signal A = SE2, and wide depth of 7.6 mm).
Processes 12 02737 g007
Figure 8. XRD spectrum of vivianite. Vivianite crystallized in this pilot at pH 7.5 with protein recovery, represented as the dark full line. PDF#01-080-9696 represents vivianite and is marked as the blue triangles.
Processes 12 02737 g008
Figure 9. FTIR spectrum of vivianite (crystallized in this pilot at pH 7.5 with protein recovery, represented as the dark full line). Using potassium bromide (KBr) tablet method and, as the blank, deduction instrument background value. Scan scale: 400–4000 cm−1.
Processes 12 02737 g009
Figure 10. Kinetic characteristics of humic acids adsorption of Pb2+, Cr2+, and Zn2+ (100 mg/L of metal concentration is preliminary set in the conditions of 25 °C and 150 r/min. Samples are sampled at 1, 3, 5, 10, 30, 60, 120, 360, 720, and 1440 min).
Processes 12 02737 g010
Figure 11. Isothermal adsorption curves of Pb2+ (a), Cr2+ (b), and Zn2+ (c) on HAs. Eight metal concentrations 10, 20, 50, 100, 150, 200, 250, and 300 mg/L are set for isothermal adsorption tests of HAs, and temperatures are 15, 25, and 35 °C, respectively; 150 r/min for 1440 min.
Processes 12 02737 g011aProcesses 12 02737 g011b
Figure 12. FTIR spectrum of HAs before and after adsorption of heavy metals. Legends from the top to the bottom: HAs before adsorption, then HAs after adsorption of Pb2+, Cr2+, and Zn2+, respectively. Using potassium bromide (KBr) tablet method and, as the blank, deduction instrument background value. Scan scale: 400–4000 cm−1.
Processes 12 02737 g012
Table 1. Characteristics of the supernatant before and after FeCl3 flocculation # (mean ± SD).
Raw SupernatantFlocculated SupernatantRemoval Rate (%)Standards *
pH7.03 ± 0.076.84 ± 0.08-6–9
SCOD (mg/L)95.5 ± 9.4248.5 ± 5.8949.21 ± 0.8450
SS (mg/L)18.56 ± 2.469.53 ± 1.5148.70 ± 0.2510
TN (mg/L)22 ± 1.436.41 ± 1.3170.86 ± 0.1715
TP (mg/L)6.54 ± 0.890.47 ± 0.1992.81 ± 0.040.5
PO43− (mg/L)5.41 ± 1.050.41 ± 0.3292.42 ± 0.02-
NH4+-N (mg/L)4.62 ± 1.921.43 ± 0.2669.01 ± 0.105
Fe (mg/L)-19.24 ± 3.60--
Fe2+ (mg/L)-7.05 ± 1.31--
*: Discharge standard of pollutants for municipal wastewater treatment plant (GB 18918-2002) [34]; #: SD, SCOD, SS, TN, and TP were the abbreviations of the standard deviation, the soluble chemical oxygen demand, total nitrogen, and total phosphorus, respectively.
Table 2. Effects of temperatures and time on phosphorus recovery and crystal purity (mean ± SD).
Temperature (°C)Recovery Rate (%)Crystal Purity (%)Time (h)P Recovery Rate (%)Crystal Purity (%)
1595.16 ± 0.5488.65 ± 0.66095.60 ± 0.4491.92 ± 0.62
2096.16 ± 0.7191.41 ± 0.85195.99 ± 1.0191.60 ± 0.47
2596.85 ± 0.3391.63 ± 0.54296.18 ± 0.9392.85 ± 0.41
3096.60 ± 0.2191.01 ± 0.71396.13 ± 0.8892.44 ± 0.80
3596.10 ± 0.4890.27 ± 0.52495.99 ± 0.4792.54 ± 1.17
4095.20 ± 0.5590.14 ± 0.63896.28 ± 0.8092.22 ± 0.94
Table 3. Kinetic model parameters for HAs adsorption of Pb2+, Cr2+, and Zn2+.
Pb2+Cr2+Zn2+
Pseudo-first orderk1 (h−1)−0.0255 ± 0.00−0.0237 ± 0.00−0.0172 ± 0.01
b11.2759 ± 0.011.3138 ± 0.021.2804 ± 0.01
R20.8698 ± 0.010.9647 ± 0.020.9529 ± 0.03
Pseudo-second orderk2 (h−1)0.1424 ± 0.020.1933 ± 0.030.2161 ± 0.03
b20.7221 ± 0.042.4456 ± 0.602.407 ± 0.55
R20.9996 ± 0.000.9968 ± 0.000.9866 ± 0.01
Qe (mg/g)6.98 ± 0.684.97 ± 0.894.85 ± 0.74
Intraparticle diffusivitykd11.0279 ± 0.070.5519 ± 0.030.4546 ± 0.02
C10.8526 ± 0.350.2276 ± 0.060.4067 ± 0.15
R120.8354 ± 0.040.9148 ± 0.040.934 ± 0.04
kd20.0151 ± 0.000.0089 ± 0.000.0296 ± 0.01
C26.5001 ± 1.014.6817 ± 1.003.9067 ± 1.08
R220.7161 ± 0.040.7491 ± 0.020.7477 ± 0.15
k0.1075 ± 0.010.1085 ± 0.010.1075 ± 0.02
C1.8311 ± 0.082.0123 ± 0.061.8311 ± 0.09
R20.6768 ± 0.050.5787 ± 0.040.6768 ± 0.05
Table 4. Descriptive statistics of isothermal model parameters of HAs adsorption.
Temperature (°C)LangmuirFreundlich
KL (L/mg)Qm (mg/g)R2KF1/nR2n
150.01215.9700.9610.3660.6790.9921.473
Pb2+250.01418.2100.9680.4320.6840.9961.463
350.01619.4200.9370.5480.6650.9881.504
Mean0.01417.8670.9550.4480.6760.9921.480
150.0139.4400.8870.3950.5390.9911.857
Cr2+250.01611.6400.8870.5380.5370.9801.863
350.01614.0400.8460.6140.5500.9861.819
Mean0.01511.7070.8730.5160.5420.9861.846
150.0167.8700.9680.3260.5590.9961.789
Zn2+250.01310.9200.9160.3580.5900.9921.694
350.01511.8800.9160.4580.5720.9951.747
Mean0.01410.2230.9330.3810.5740.9941.743
Disclaimer/Publisher’s Note: The statements, opinions and data contained in all publications are solely those of the individual author(s) and contributor(s) and not of MDPI and/or the editor(s). MDPI and/or the editor(s) disclaim responsibility for any injury to people or property resulting from any ideas, methods, instructions or products referred to in the content.

