Article

The Effect of Chemical Composition on the Morphology of Pb/Zn-Containing Dust

School of Metallurgical Engineering, Xi’an University of Architecture and Technology, Xi’an 710055, China
*
Author to whom correspondence should be addressed.
Processes 2024, 12(12), 2734; https://doi.org/10.3390/pr12122734
Submission received: 31 October 2024 / Revised: 23 November 2024 / Accepted: 30 November 2024 / Published: 3 December 2024

Abstract

:
Dust containing lead and zinc is a harmful contaminant, which causes serious harm to the natural environment and human health. At present, it is believed that the microscopic morphology of lead-zinc dust is intimately related to its biological toxicity. Chemical composition serves as a pivotal factor influencing the structural characteristics of dust. However, research on the impact of chemical composition variations on the microscopic morphology of dust containing lead and zinc remains inadequate. The particle size analysis reveals that as PbO content increases and ZnO content decreases, the particle size of the dust diminishes, but some samples exhibit a larger agglomeration structure. Combined with the results of the box number method, it is evident that at lower magnifications, an increase in PbO content leads to a decrease in image complexity and a loosening of aggregated structures. The similarity in pile shapes amplifies this trend, resulting in a decline in the box-counting dimension (D value) within the PbO/ZnO ratio range of 26.45 to 138, accompanied by an inverse change in the corresponding goodness of fit R-sq value. At the observation multiple of 30,000 times (30 K), smaller particles within the sample become visible, and the presence of relatively larger particles and complex sizes enhances the fractal characteristics of the sample, leading to a higher D value. Within the PbO/ZnO ratio range of 90/10 to 99/1, a coupling relationship exists between the chemical composition of the sample and the morphology of the dust. Specifically, the PbO/ZnO ratio exhibits a positive correlation with the D value. Conversely, the diversity of corresponding fractal features is negatively correlated with the D value. When the PbO content surpasses 99%, this correlation weakens, and the diversity of graphical representations displays an alternating pattern of growth and decrease. Notably, the D value and the goodness of fit (R-sq) of the D value are negatively correlated, indicating that as the complexity of the graph increases, the goodness of fit decreases.

1. Introduction

Lead–zinc dust primarily originates from various sources including the metallurgical industry [1,2,3,4], lead-containing oil [5], electronic products, and domestic waste [6]. The scale of this production is significant, with the global metallurgical industry generating over 10 million tons of lead–zinc dust annually [7,8,9]. According to statistics from the World Bureau of Metal Statistics (WBMS) [10], the quantity of dust containing more than 30% lead exceeds 1500 tons. The presence of such a large amount of dust poses serious threats to both the natural environment and human health [11]. The extent of damage is intricately related to the type, particle size, and shape of the dust particles [12]. Among the various types of dust, lead–zinc dust produced during the lead smelting process stands out as a typical and highly harmful example. Studying the relationship between its morphology and chemical composition will help in analyzing the condensation mechanism and hazard principle of dust, constructing an analysis index of green chemistry, and promoting the analysis, prevention, collection, and reuse of contaminants [13,14].
The dust morphology can not only reflect its chemical composition, mass ratio, and physical form but also reflect its optical effect. Different forms have different effects on the outside world [15,16,17]. Nicholas S et al. [16], Shrey Prasad et al. [17], and Bagaria Pranav et al. [18] reported that spherical, irregular, rod-shaped, flake-shaped, and small-sized metal particles showed an increasing trend in energy conduction and excitation. When dust has a variety of irregular shapes, the surface energy of the particles increases, and the risk of explosion will increase rapidly. In their research, Yang Wu et al. [19] revealed that lead–zinc dust has mainly block, flake, needle, and irregular spherical structures. When this kind of powder is mixed with metal powder, pulverized coal, or combustible gas, the danger will increase, which seriously threatens the safety of the production environment. Jiang Haibo [20], Yongmin Shi et al. [21], and Deji Jing et al. [22] studied dust diffusion in a lithium production workshop, the temperature change in dust inside an electrostatic precipitator after shutdown, and dust control technology in the coal conveyor belt area of a boiler room. The shape and temperature of dust have important influences on the diffusion and collection of dust.
In addition, the special form of dust will also directly damage people’s health [23]. In a study of wood powder particle morphology, Alena Očkajová et al. [24] and Alida Mazzoli et al. [25] reported that small particles of lignocellulose may cause damage to the respiratory system. The study of John M G et al. [26] also showed that long and thin mineral fibers were strongly associated with carcinogenicity. In the process of transmission in nature, mineral fibers also produce changes in morphology and chemical composition. Research by Esther Coz et al. [27] confirmed that these changes will have important impacts on human health and ecosystems. Pan Xiaole et al. [28] further reported that mineral dust particles interact with other man-made contaminants, resulting in morphological changes and ultimately the deterioration of the local living environment. The study of Zongwei Ma and Changsheng Qu et al. [29,30] showed that in areas near pollution sources, respiratory inhalation routes accounted for more than 98% of the total risk of disease, and the non-carcinogenic risk of Pb was second only to As, followed by Zn, Cu, etc. Yang Gao et al. [31] analyzed heavy metals in fine particulate matter in the atmosphere of Beijing City. His research shows that in PM2.5 and PM10, the harm degree of Pb is relatively similar. The bioavailability of Pb in PM10 is higher than that of Cd, Cu, Mn, and other elements. This indicates that although small particles of lead dust are easier to enter the human body, the harm caused by large particles of lead dust after entering the human body is higher than that of small particles. And irregular lead dust can exacerbate biological hazards. Wenhua Wang et al. [12] and Hu Wei et al. [32] showed that dust morphology was closely related to its chemical composition, and the combination of Ca, Si, Fe, Na, Cl, S, and other elements caused different changes in dust morphology. From the results of the current literature, it is inferred that lead–zinc dust should exhibit analogous alterations; however, relevant research remains relatively scant.
At present, the widely used methods for studying particle morphology are particle size, microscopic analysis, and fractal dimension [1,15,33,34]. Laser particle size analyzers are widely used to study particle size distributions. The circle circumscribed through the contours of the particle projection is usually used for irregular particles [18]. Although it can partially solve the statistical problem of irregular particles, the calculation accuracy of flake and filamentous particles is still insufficient. Scanning electron microscopy (SEM) clearly revealed the size and shape of the particles. However, mathematical tools are needed to analyze a large number of SEM images. Fractal theory is one of the most important analytical methods [35]. In fractal theory, a variety of dimensions can be used to analyze time and space sequences, transects, and natural or man-made surfaces, such as the Hausdorff dimension and Minkowski–Bouligand dimension [36]. Some special dimensions, such as the Assouad dimension, can be used to describes the ‘thickest’ part of a set, while the lower Assouad dimension concerns the ‘thinnest’ part [37]. In the calculation of the dimension, the object needs to be datatized in a limited range. Data characteristics enable the same dimension to analyze different features of an object, such as the smoothness or roughness of the plane, the probability of three-dimensional shapes or certain points in space, the density of a shape in a graph, or the complexity of a line. Find hidden information in data from a mathematical point of view.
Such characteristics enable fractal theory to be used in various disciplines. The box-counting dimension is a mature method that can be used to calculate the unevenness, complexity, or convolution of images. Zaliha Omar et al. [38] studied the microscopic morphology and rheological properties of palm oil crystal networks by this method. Richard D. King et al. [36] used the fractal dimension method to study the effect of Alzheimer’s disease on the cerebral cortex and clearly analyzed the brain characteristics of different patients. Wang Yao et al. [39] also applied this method to analyze the morphology of inclusions in molten steel. Studies have shown that cluster inclusions have significant fractal characteristics. This method can be used to analyze the two-dimensional and three-dimensional structures of cluster inclusions and quantitatively describe structural changes. The box number method can also be applied to the analysis of different types of images. For example, the research of D. Risović et al. [40] showed that the fractal dimension method can be used for the characterization of porous and rough surfaces and for obtaining EIS and SEM grayscale images. Tilmann Gneiting et al. [41] compared various estimation methods for fractal dimension and suggested that fractal dimension can also be used as an indicator to measure data roughness (or smoothness).
These studies show that the box number method can describe the characteristics of the image in different degrees; that is, it can describe the complexity of lead and zinc smoke. The more complex the geometric characteristics of the particles, the stronger the damage to the organisms after being inhaled. Moreover, although the box number method has a good adaptability in studying image features, how to provide images that meet the computational requirements is still a difficult problem. SEM will form artifacts and noise in the image—that is, double shadows, halos, and black and gray spots in the image. Even by optimizing the imaging parameters, this interference is still difficult to avoid. Bipin N B J et al. [42] used neural networks to suppress artifact noise to improve image quality. However, the current amount of training is not enough to ensure that the level of treatment is consistent. Therefore, it was still the main means to reduce the system error by optimizing the experimental scheme. Secondly, the adjustment of image brightness, color difference, gray level, and other parameters can ensure consistent image quality and enhance its comparability [43].
The above findings indicate that the microscopic morphology of contaminated smoke is closely related to its chemical composition and that lead and zinc smoke, which are dangerous pollutants, should receive increased attention. However, the current research is not sufficient, and there is no systematic study on the change in micromorphology under different magnifications during the gradual change in Pb/Zn composition. In this work, SEM images of dust containing lead and zinc in the lead-refining process are obtained via the box number method, the influence of different chemical components on dust morphology is analyzed, the accumulation morphologies of lead and zinc dust are compared at different magnifications, and the condensation law of dust from gas to solid is discussed.

2. Experimental Method and Scheme
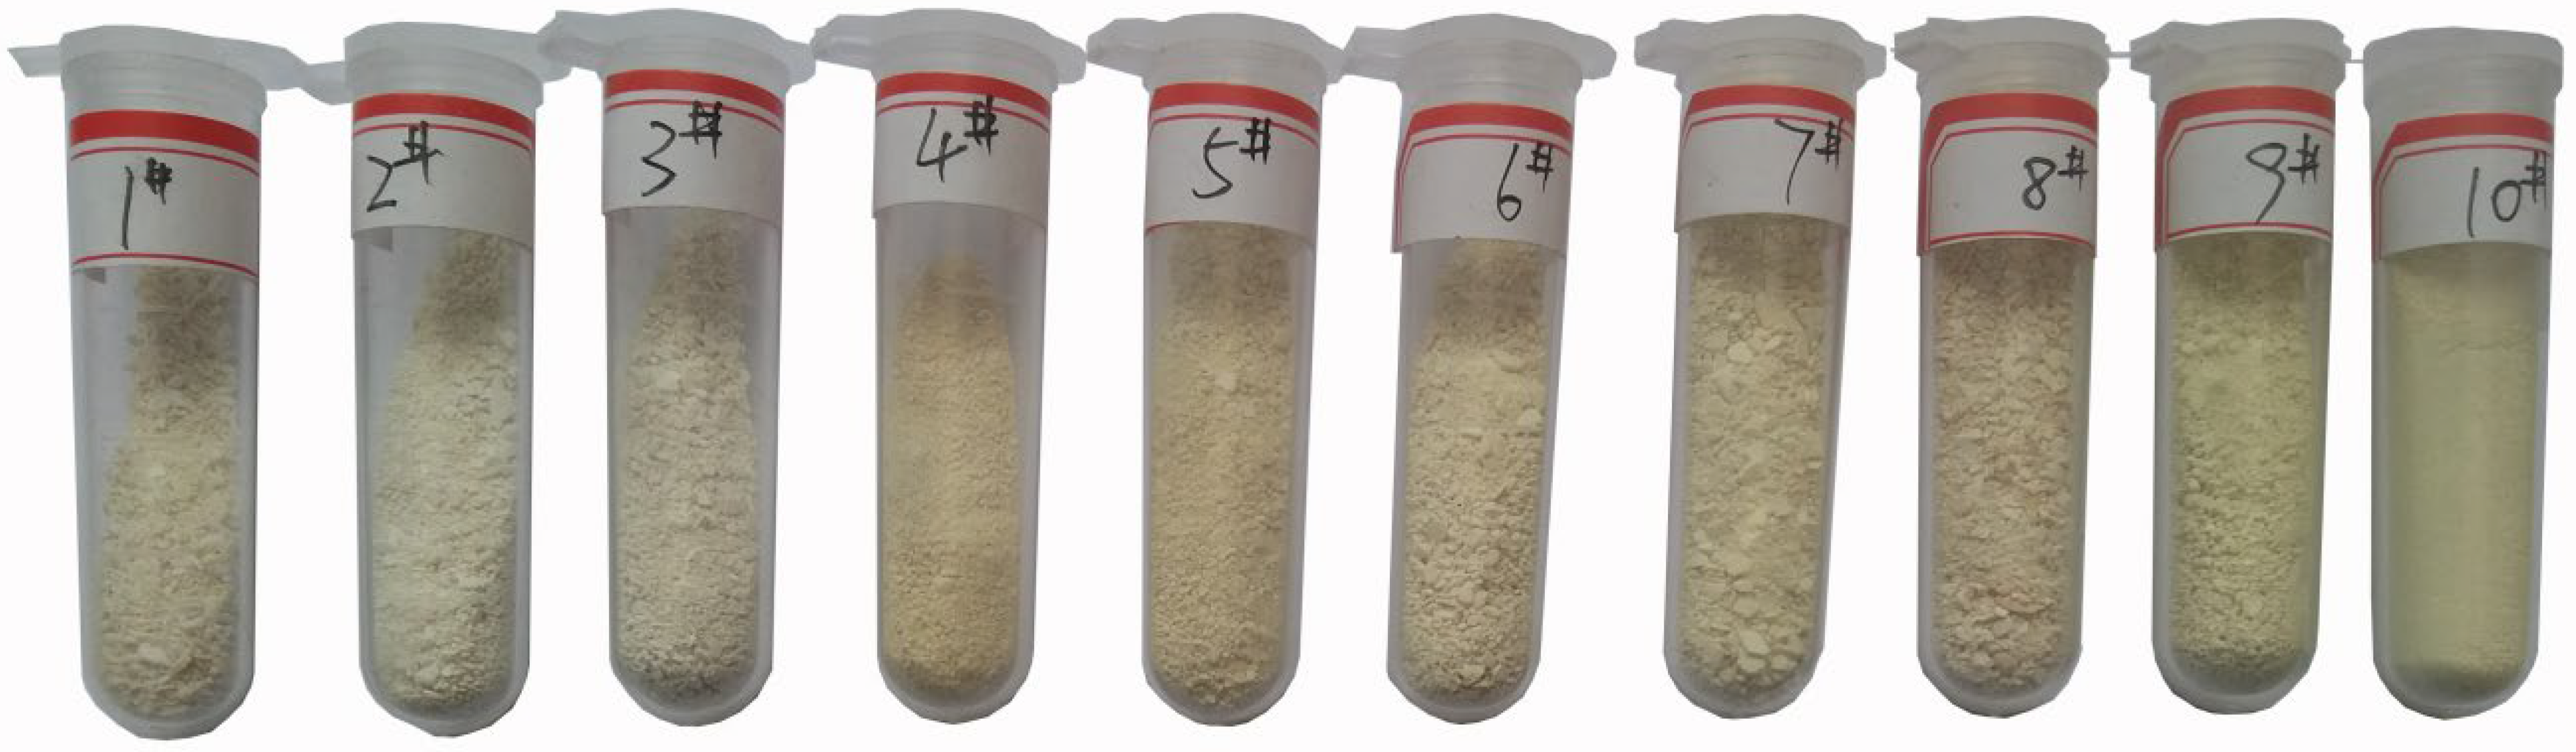
2.1. Materials

The dust produced in the process of lead smelting is mainly composed of PbO and ZnO, accounting for 70–90% of the total. Other substances include CdO, S, As, K, etc. To reduce the interference of other elements and more intuitively analyze the influence of Pb and Zn on the dust morphology, the dust of the corresponding compositions was obtained by the melting volatilization of PbO-ZnO-Fe3O4-SiO2-CaO slag in the laboratory. The lead slag was prepared in a chemically pure configuration (Sinopharm Chemical Reagent Co., Ltd., Shanghai, China), and its composition is shown on the right side of Table 1. Finally, 10 kinds of dust with different components were obtained. The dust compositions are shown on the left side of Table 1. The purity of Fe3O4 was more than 85.75%, that of CaO was more than 98%, as verified by X-ray diffraction (XRD) and X-ray fluorescence (XRF), and the other reagents were more than 99% pure. After the samples were prepared proportionally, the samples were mixed and ground for 1 h in an agate mortar and sealed in a sample bag for later use. Before each use, the samples were dried in a 105 °C air drying oven for 4 h. The equipment used for dust preparation is shown in Figure 1. Figure 1 shows the collected volatile matter.

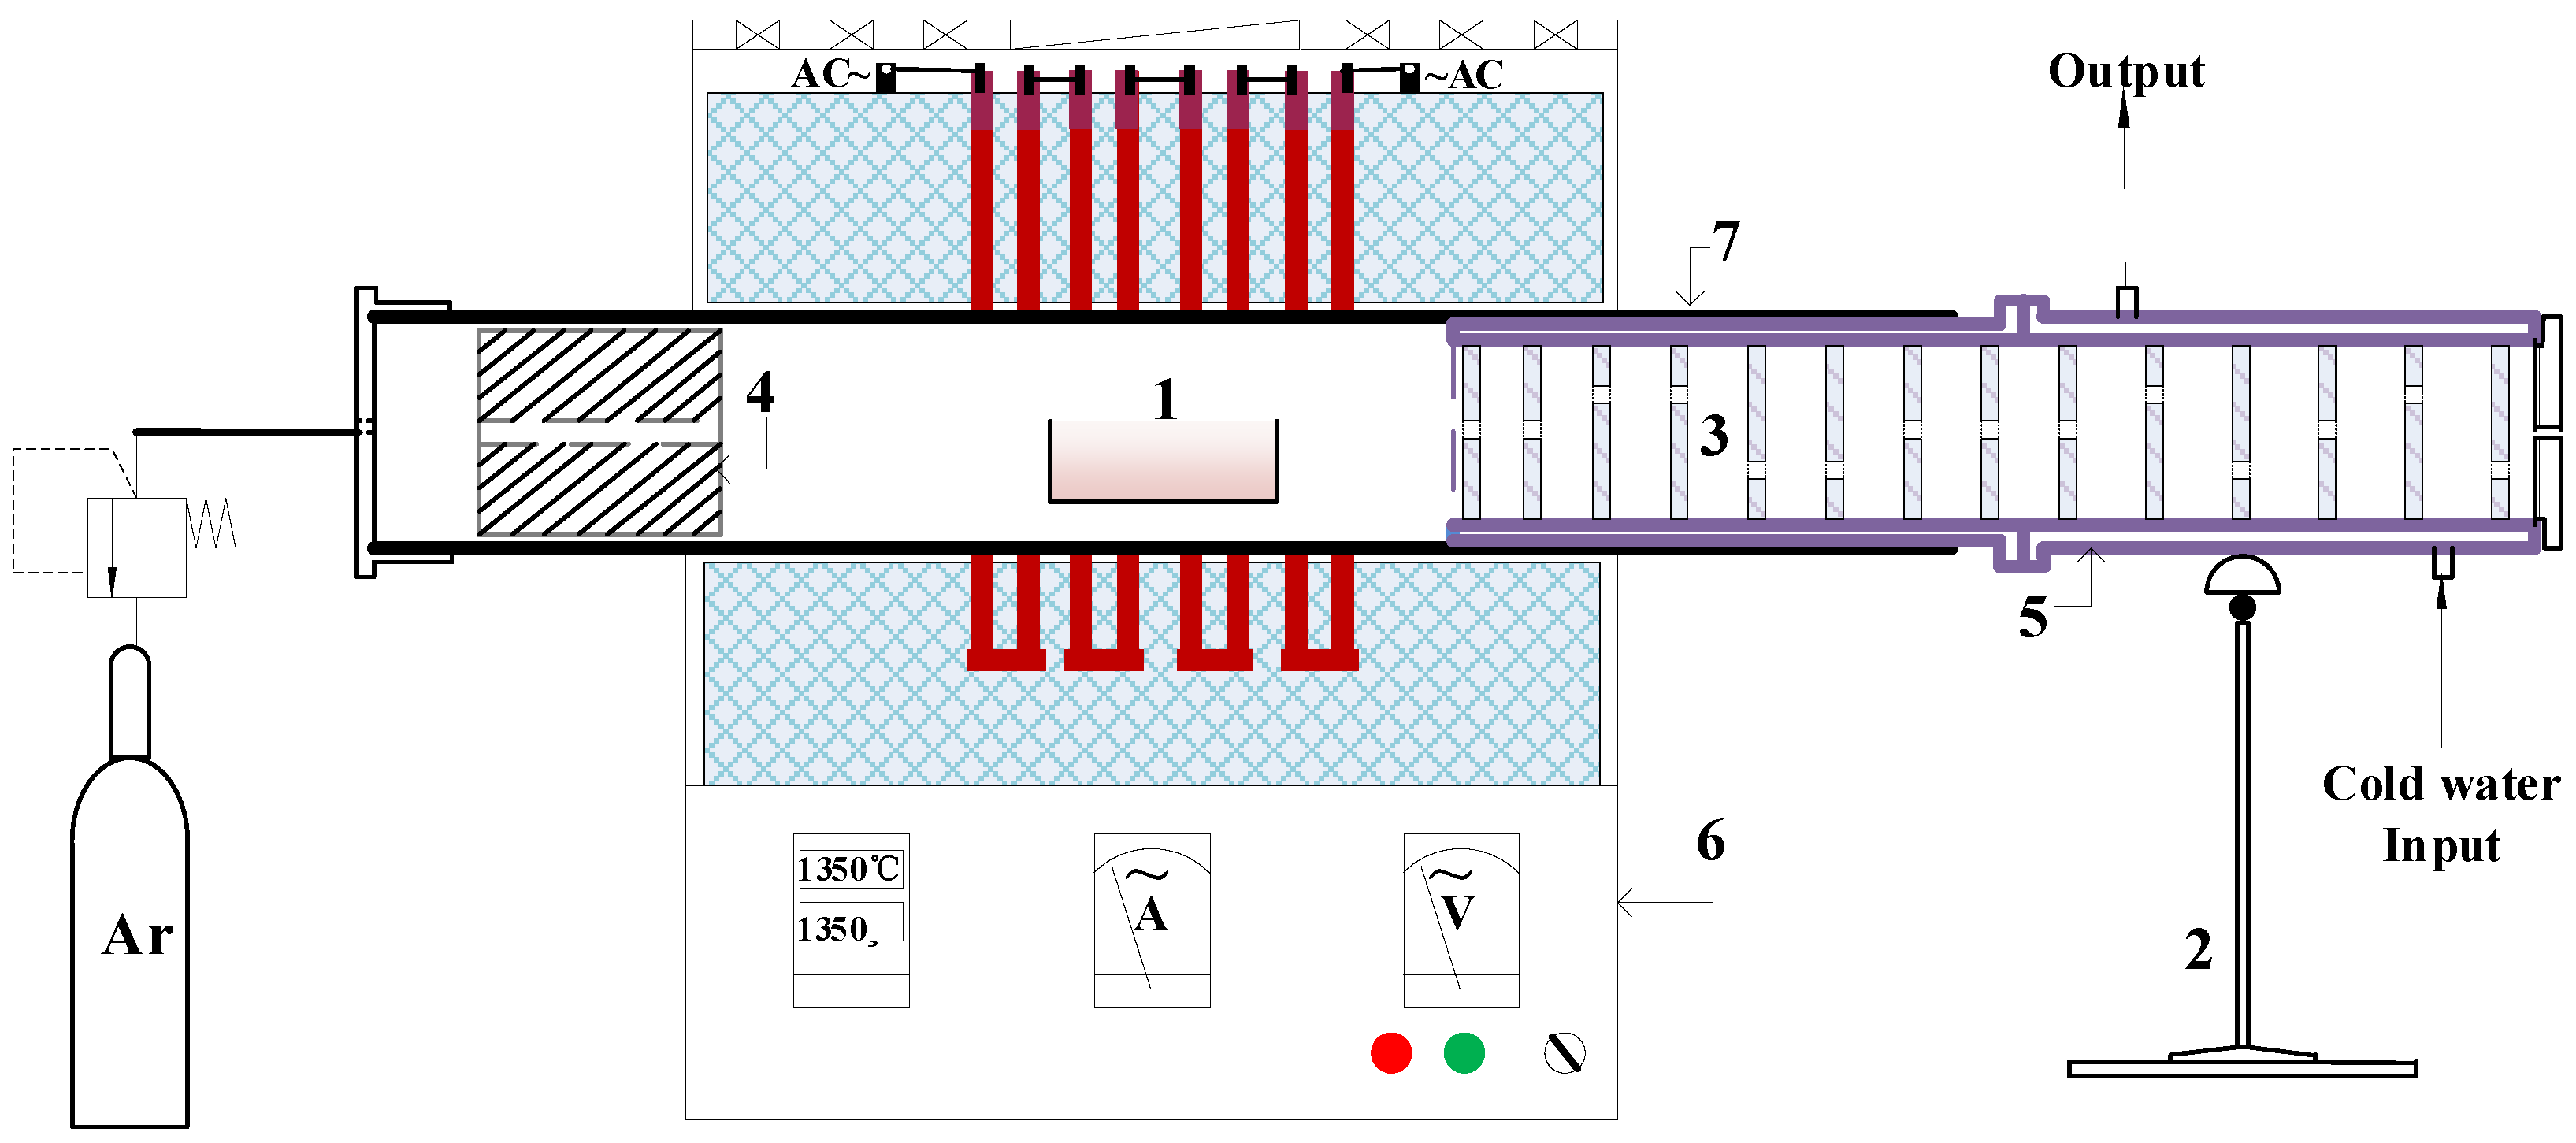
2.2. Experimental Apparatus and Procedure

The dust samples were prepared using the device shown in Figure 2 [44]. The specific operation process of the collecting devices was as follows: The configured slag was placed into a furnace tube, and 1 L/min argon gas was passed through the tube. The furnace temperature was increased to 1380 °C at a heating rate of 10 °C/min, and the samples were kept at this temperature for 2 h. The argon flow rate was increased to 1.5 L/min at 950 °C until the heating was complete. When the furnace temperature drops below 900 °C, the condenser is removed to collect the dust sample. The sample was kept sealed. The temperature process is close to the direct lead smelting process, and dust can be quickly obtained.
The microscopic morphology of the dust was photographed by SEM (Gemini SEM 300). Three to five clear and representative photos were taken at 10 K times and 30 K times, respectively. Representativeness means that these photos can show the morphology of most volatiles. The magnification of 10 K times can see a relatively suitable size of the panorama, and it is suitable for 10 samples. Due to the poor electrical conductivity of the sample, the photo will not be clear when the magnification exceeds 30 K times. The box dimension method of fractal dimension is used to analyze the change in the microscopic morphology of the volatiles, and the calculation formula is shown in Equation (1).
D = lim r 0 L o g N r ( ε ) L o g ( r 1 ) = lim r 0 L o g N r ( ε ) L o g ( r )
D is the box-counting dimension, which coincides with the Minkowski–Bouligand dimension under weak regularity conditions. ε is any non-empty bounded subset of Rd space. For any r > 0, Nr(ε) denotes the smallest number of cubes of width r in Rd, which can cover ε. In the actual calculation, we use some n-dimensional cubes with side length r to calculate the number of boxes covering ε with different r values Nr(ε). Then, the value of D can be obtained by using the least squares method according to Equation (1). The value of D is equal to the negative number of slopes.
In order to reduce the experimental error, the laser particle size data are set as the comparison group (Malvern Mastersizer 2000). Each sample was tested 3 times, and the average was taken. Based on the laser particle size data, the fractal dimension calculation results are discussed.

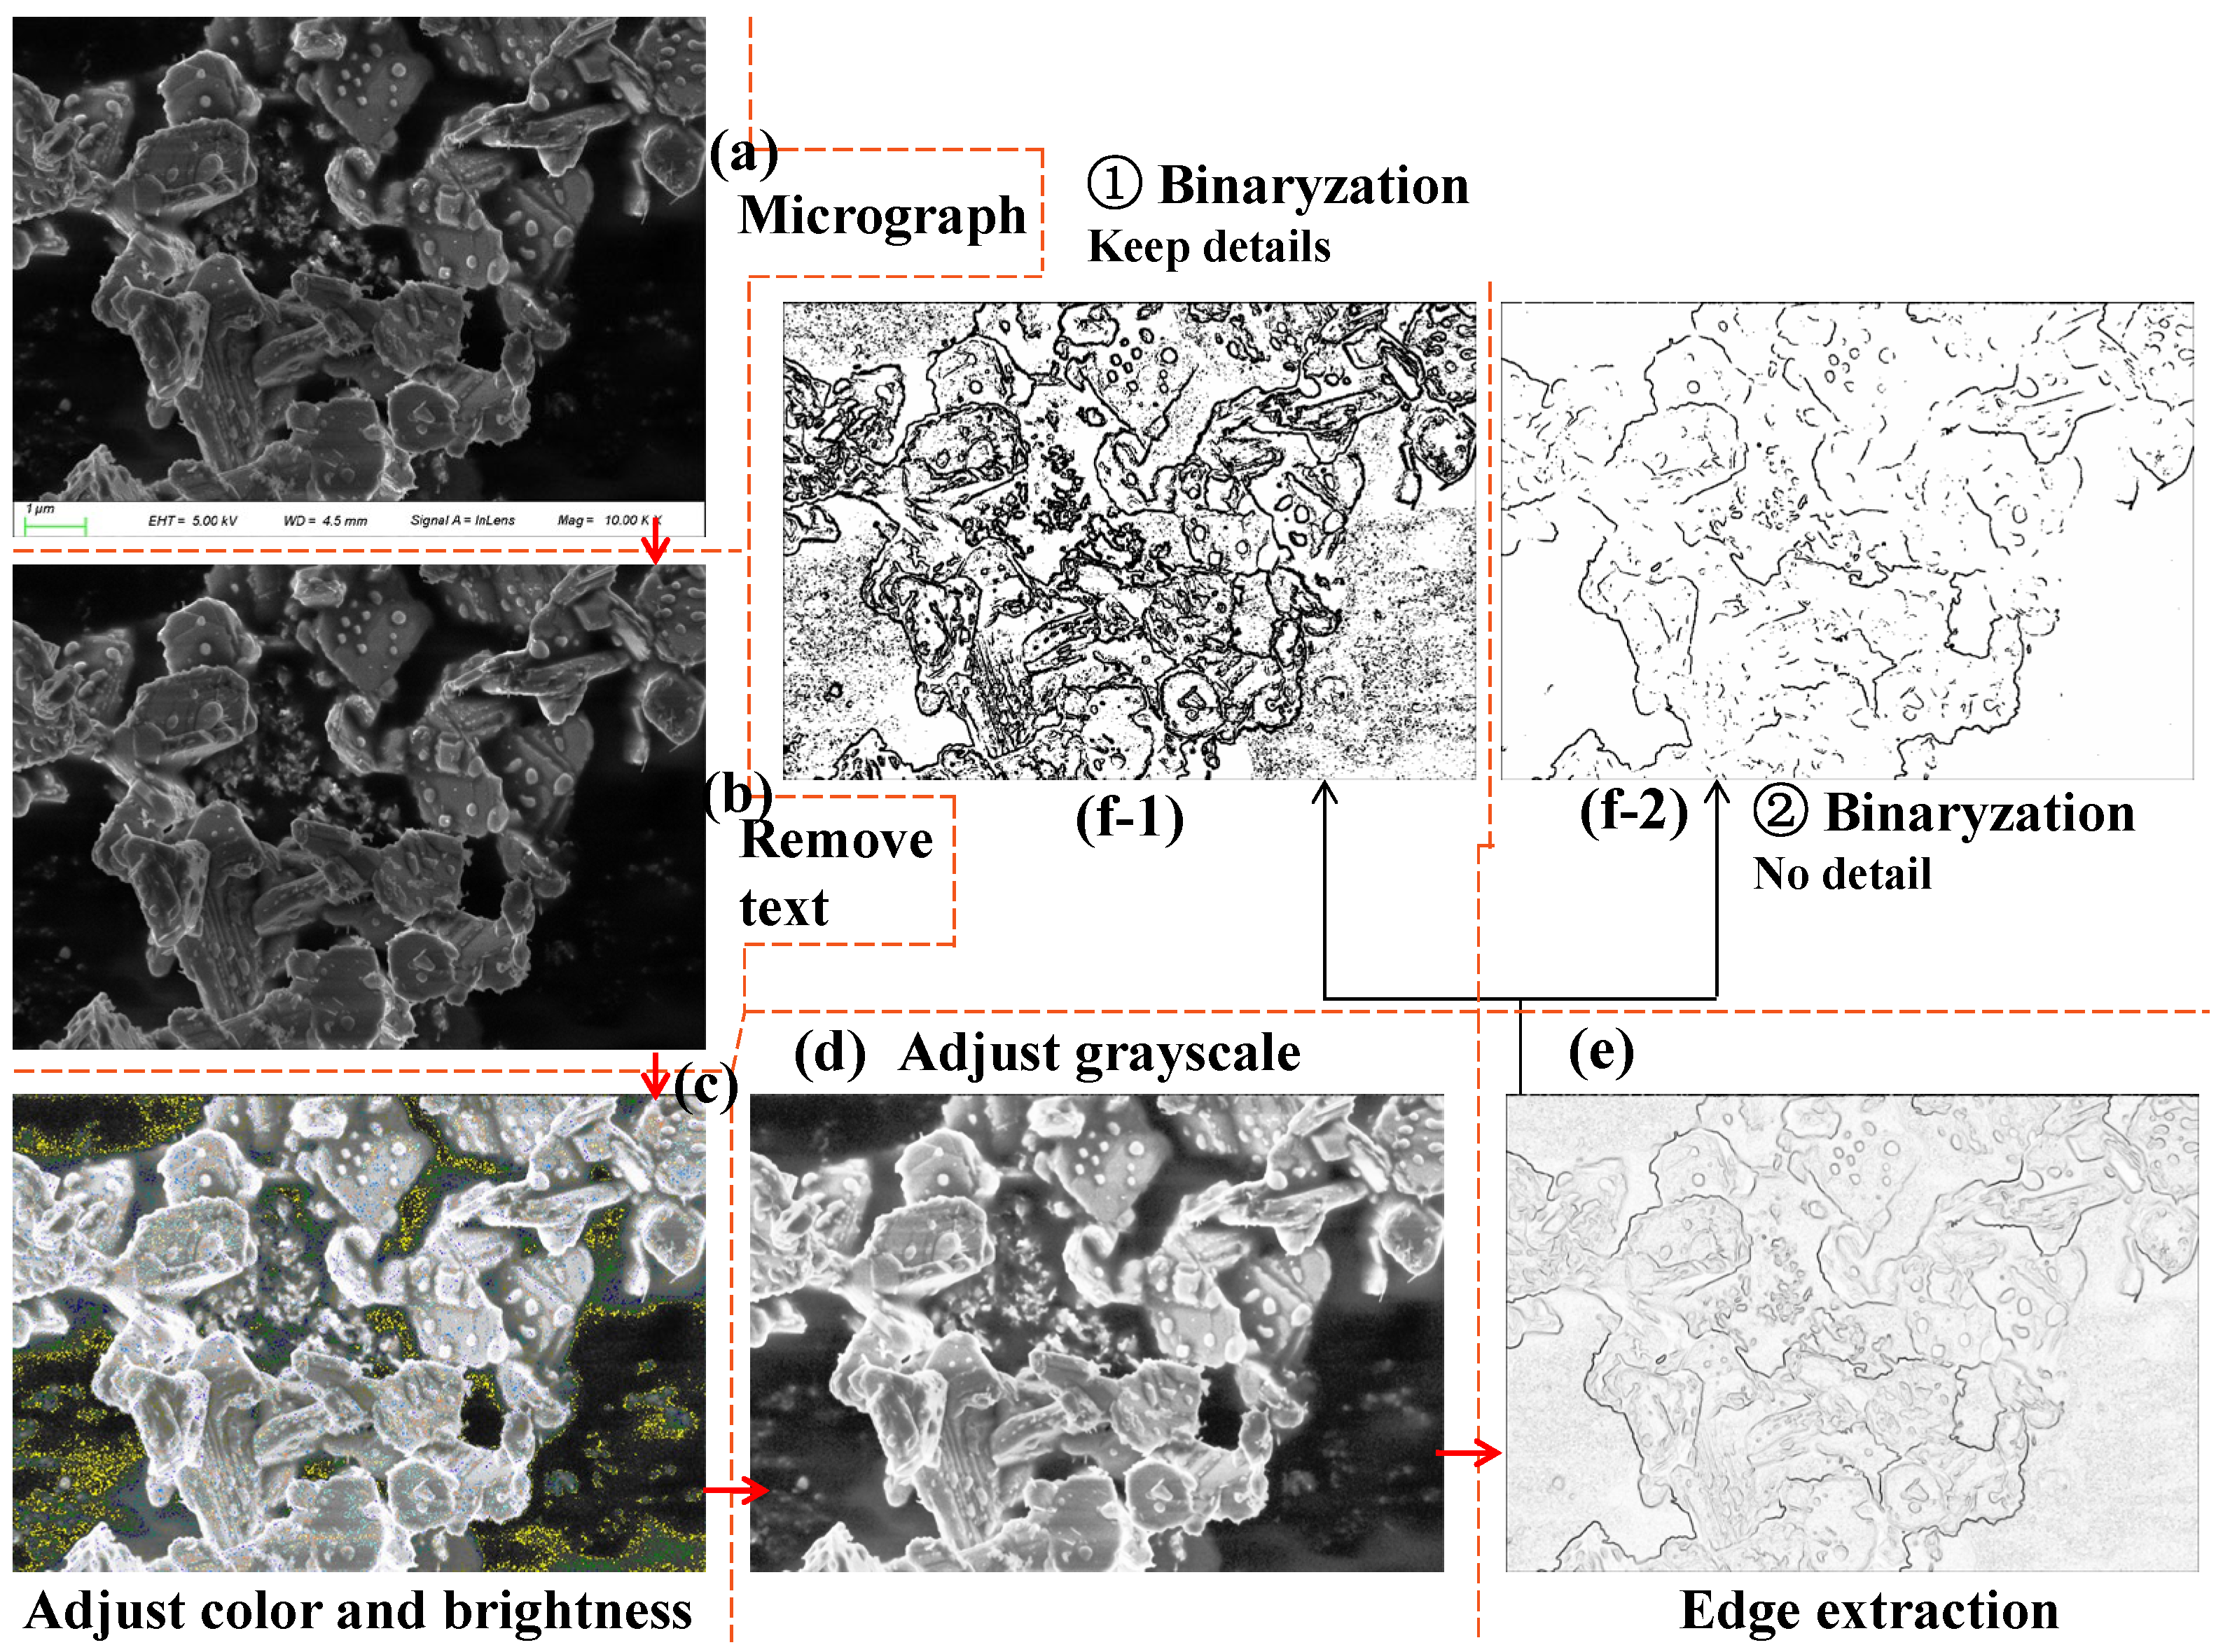
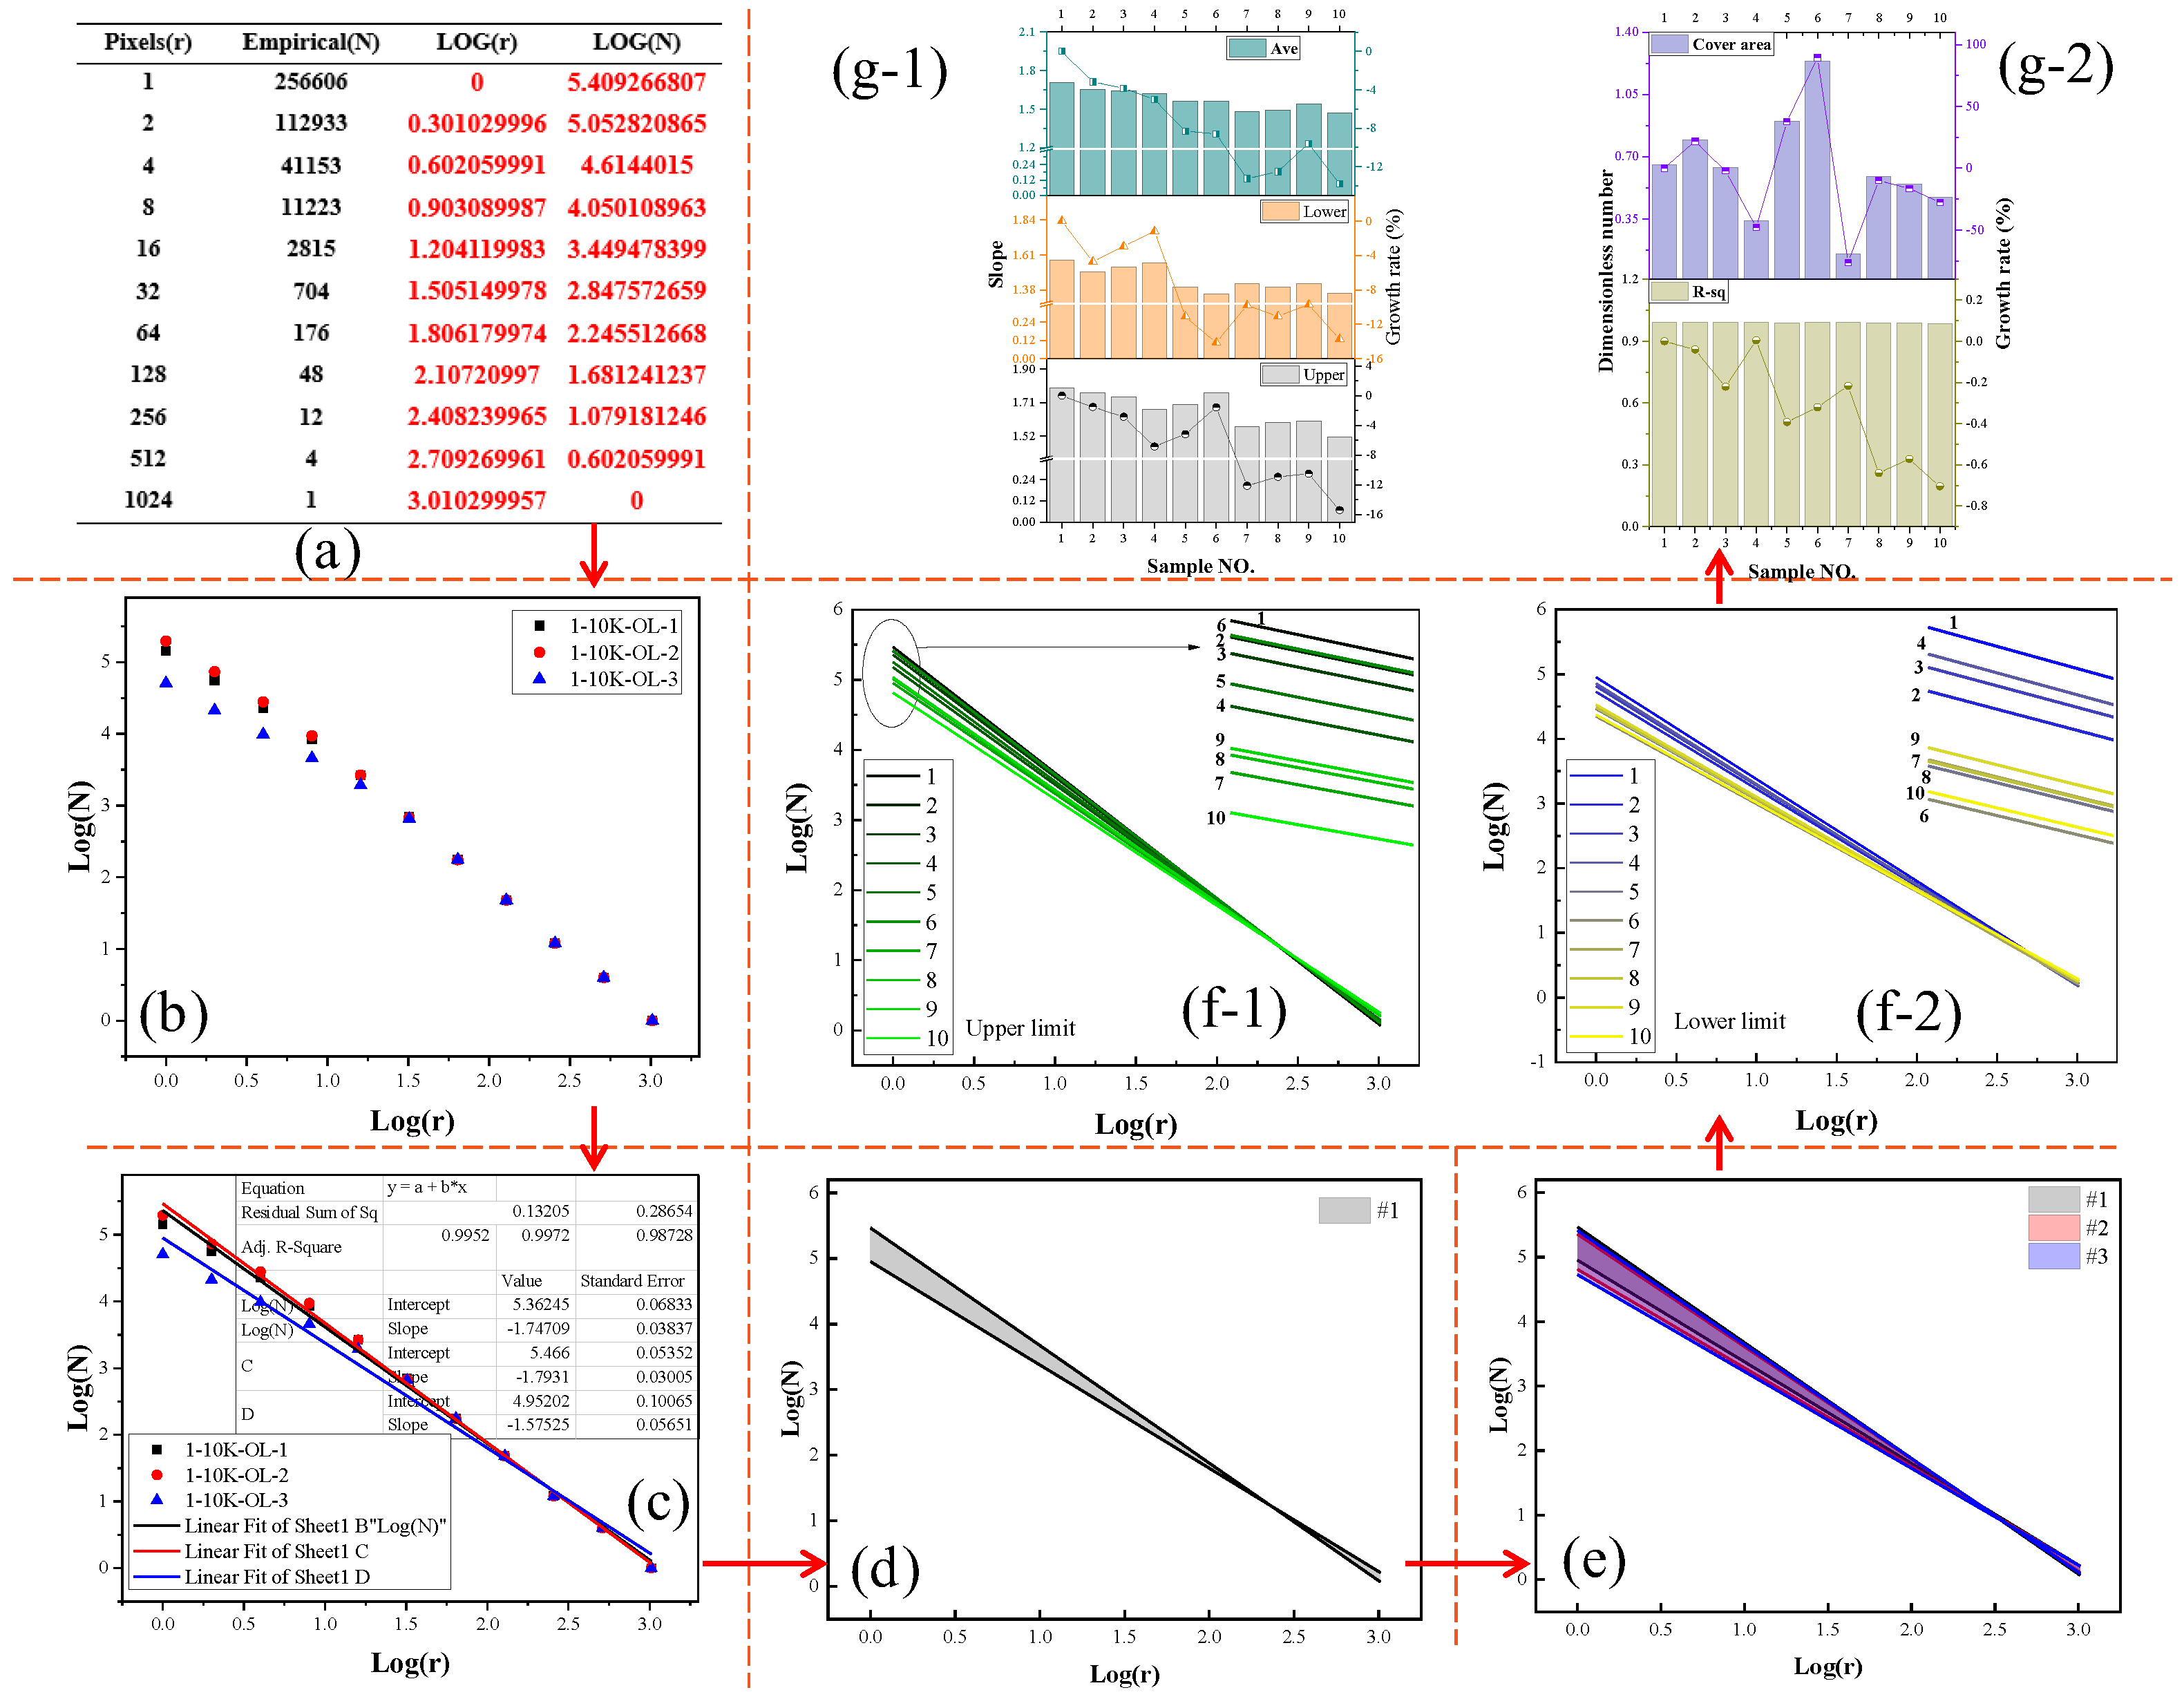
2.3. Data Processing Flow

(1) Image processing
To fully compare the shapes of dust particles of different sizes and the aggregation states of dust particles of different shapes, microscopy images of the dust particles were taken by SEM at multiples of 10 K times and 30 K times, as shown in Figure 3a. In Figure 3a, the dust presented a flaky structure, and the white bar below the figure showed the information of the scale and the picture. The image processing procedure is shown in Figure 3. First, the text on the picture was cleaned, as shown in Figure 3b. Then, the color and brightness of all the images are adjusted to be consistent, as shown in Figure 3c. The grayscale of all images was adjusted to be the same as that in Figure 3d. The above process was used to ensure that the picture was clear. The contour lines of the dust edge and surface are captured by software, as shown in Figure 3e. Finally, the image is binarized, as shown in Figure 3f. Because the pattern of the dust surface may have a certain impact on the calculation, the final form of the picture includes ① “Keep detail” and ② “No detail”. The shooting multiples are 10 K times and 30 K times. The processed images are input into MATLAB for calculation. Figure 3f-1,f-2 are the results of two kinds of values. In Figure 3f-1, the edge outline and some patterns are retained, while in Figure 3f-2, only the edge outline of the figure is left.
Detailed methods of image processing include the following: (1) The processing software adopts Image Laboratory or Photoshop. Select a picture with the best clarity and color difference in the 10 K times and 30 K times groups, respectively, as the reference. Adjust the brightness curve of the picture, so that the brightness of the picture is consistent with the reference picture, and the specific parameter is subject to the effect of the picture. (2) Use the color level function in Photoshop or the color function in Image Laboratory to adjust the color and contrast of the picture. For example, if the color difference of all pictures is not large but a little blue, you can set the same hue (red-0, yellow-0, blue-10). (3) Use the color balance function in Image Laboratory to enhance the brightness of volatiles and weaken the noise and artifacts in the background. (4) The filter function of the software is used to further remove the noise in the graphics and highlight the contrast between the graphics and the background. (5) Extract the edge of the graph, as shown in Figure 3e. (6) Binarize the picture. The threshold values of binarization are, respectively, 20% and 70% of the height of the pixel waveform, corresponding to Figure 3f-1 and Figure 3f-2. Figure 4 shows the value.
(2) The D value is calculated
Taking a picture (no detail) of #1 at a multiple of 10 K times as an example, two columns of data, r and N, were obtained in the calculation of the box number method. The physical meanings of r and N are explained in Equation (1). Then, the LOG operation was performed to obtain two columns of data, Log(r) and Log(N), as shown in Figure 5a. Figure 5a, respectively, shows Pixels(r), Empirical(N), LOG(r), and LOG(N). According to the same steps, the data of the other two pictures under the same conditions were obtained. The three sets of data are used to make a scatter plot, as shown in Figure 5b. As can be seen from Figure 5b, the three sets of data points, red, black, and blue, all have linear characteristics, so linear fitting can be performed. The least squares method was used to calculate the three groups of data, and the fitting curve was obtained, as shown in Figure 5c. In Figure 5c, the absolute values of the slopes of the three fitted curves decrease successively, and the table of the curves contains detailed parameters of linear fitting. The slope of the fitting curve is the Ds value of the group of data. The area covered by the three fitting curves is the fluctuation range of Log(r)Log(N) of sample #1 under 10 K times and no detailed conditions, as shown by the black area in Figure 5d. These data are directly related to the fluctuation range of Ds. The data pairs of the #2 and #3 samples under the same conditions are shown in Figure 5e. As can be seen in Figure 5e, multiple regions overlap, and the upper and lower limits of the covered areas need to be extracted for comparative analysis. A comparison of the upper and lower limits of the Log(r)Log(N) coverage area of the different samples is shown in Figure 5f. However, the expressions of Figure 5f-1,f-2 are not conducive to the comparison of the data. Therefore, the histogram and the corresponding year-on-year increments are drawn in Figure 5g. Figure 5g-1 shows a comparison of the upper limit, lower limit, and average value of the Log(r)Log(N) coverage of 10 samples. Figure 5g-2 shows the coverage area, and the goodness of fit R2. To facilitate mapping, the coverage area is non-dimensionalized. In the subsequent discussion of the results, the image type shown in Figure 5g is used.

3. Results and Discussion

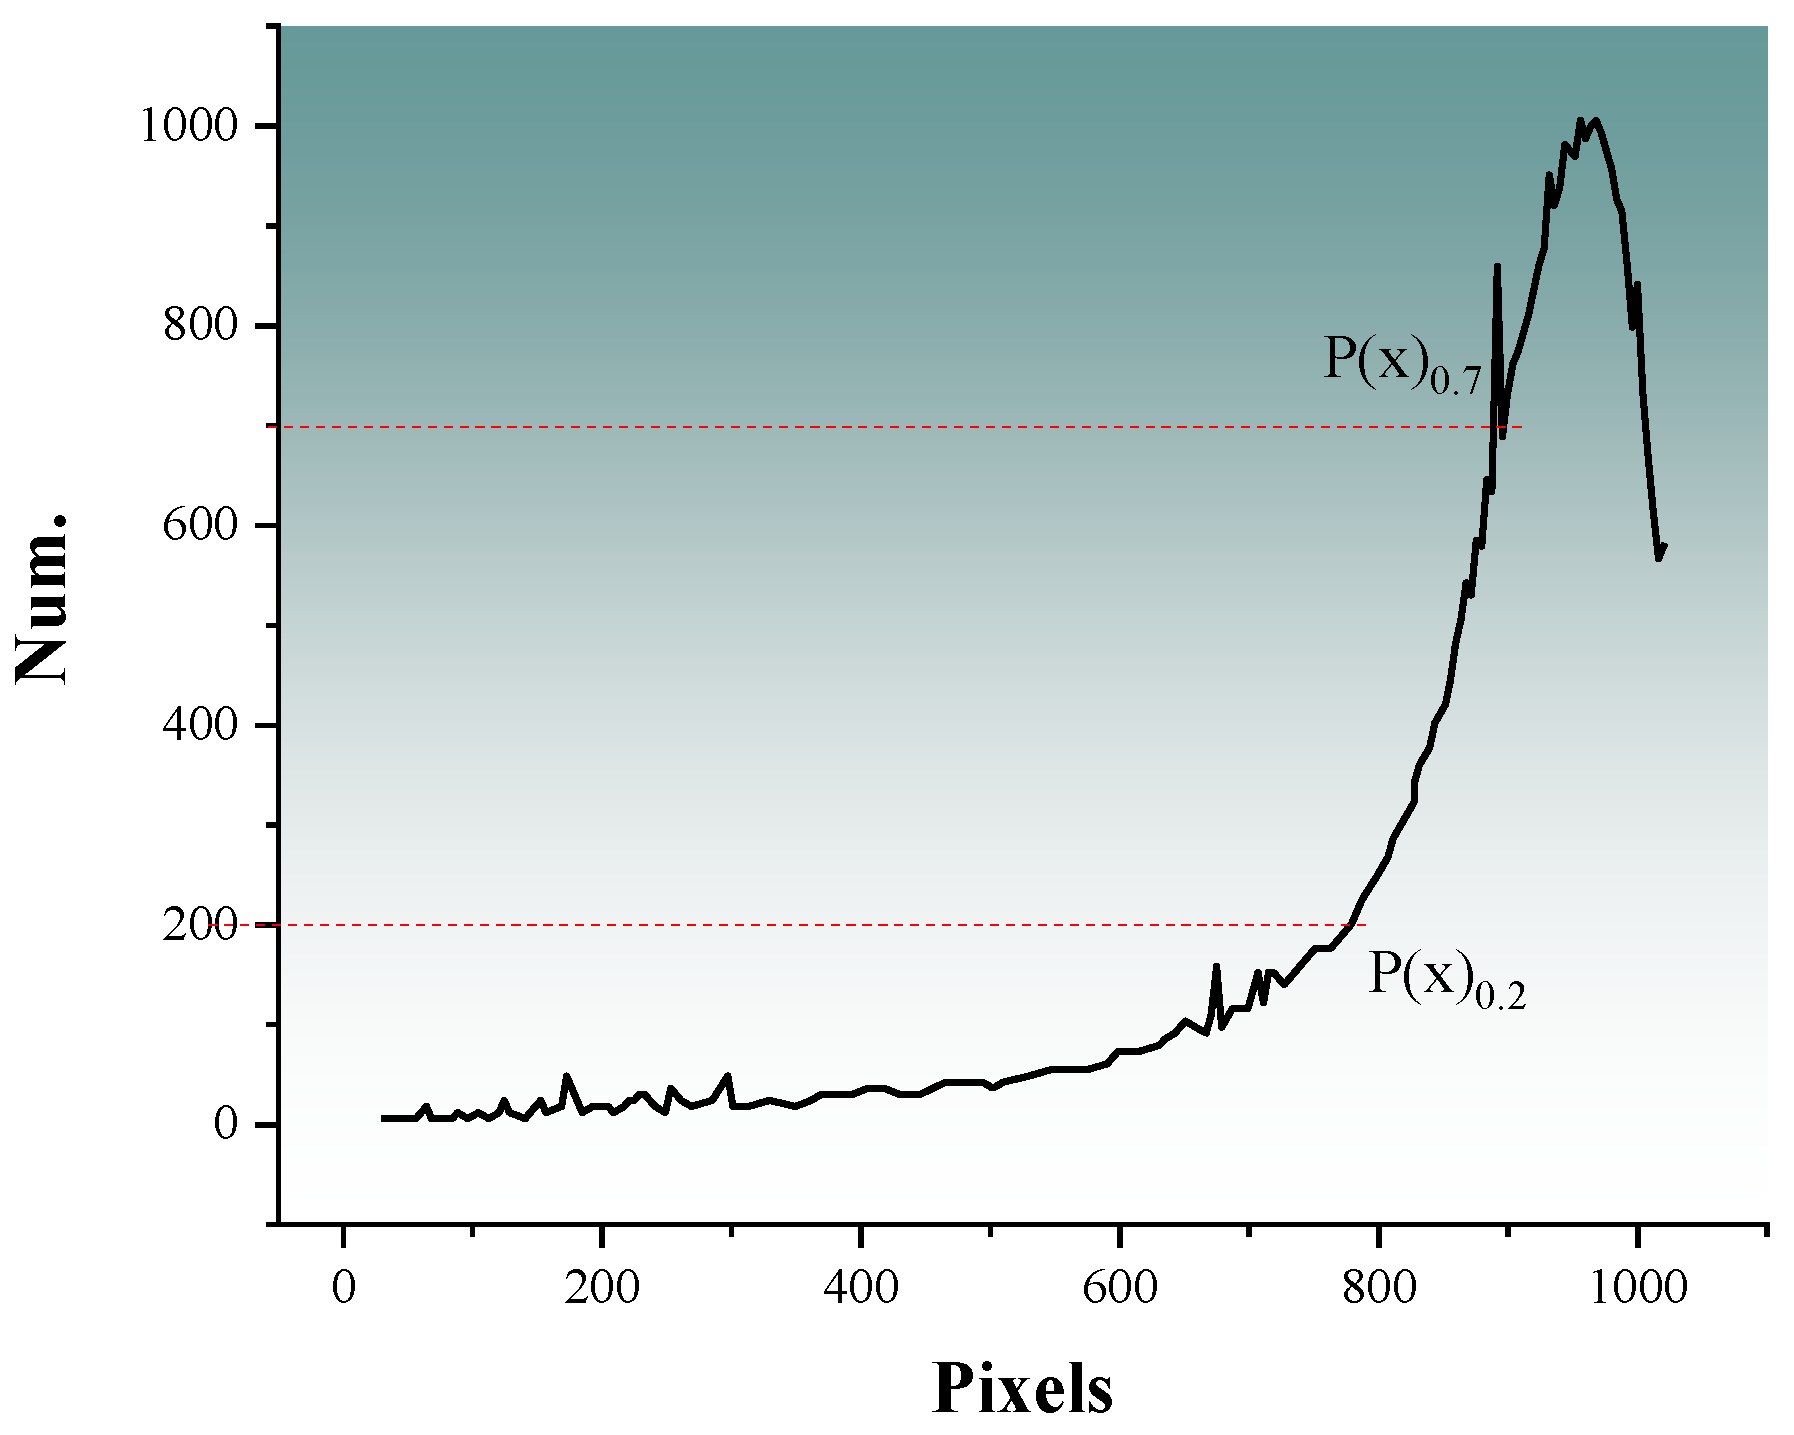
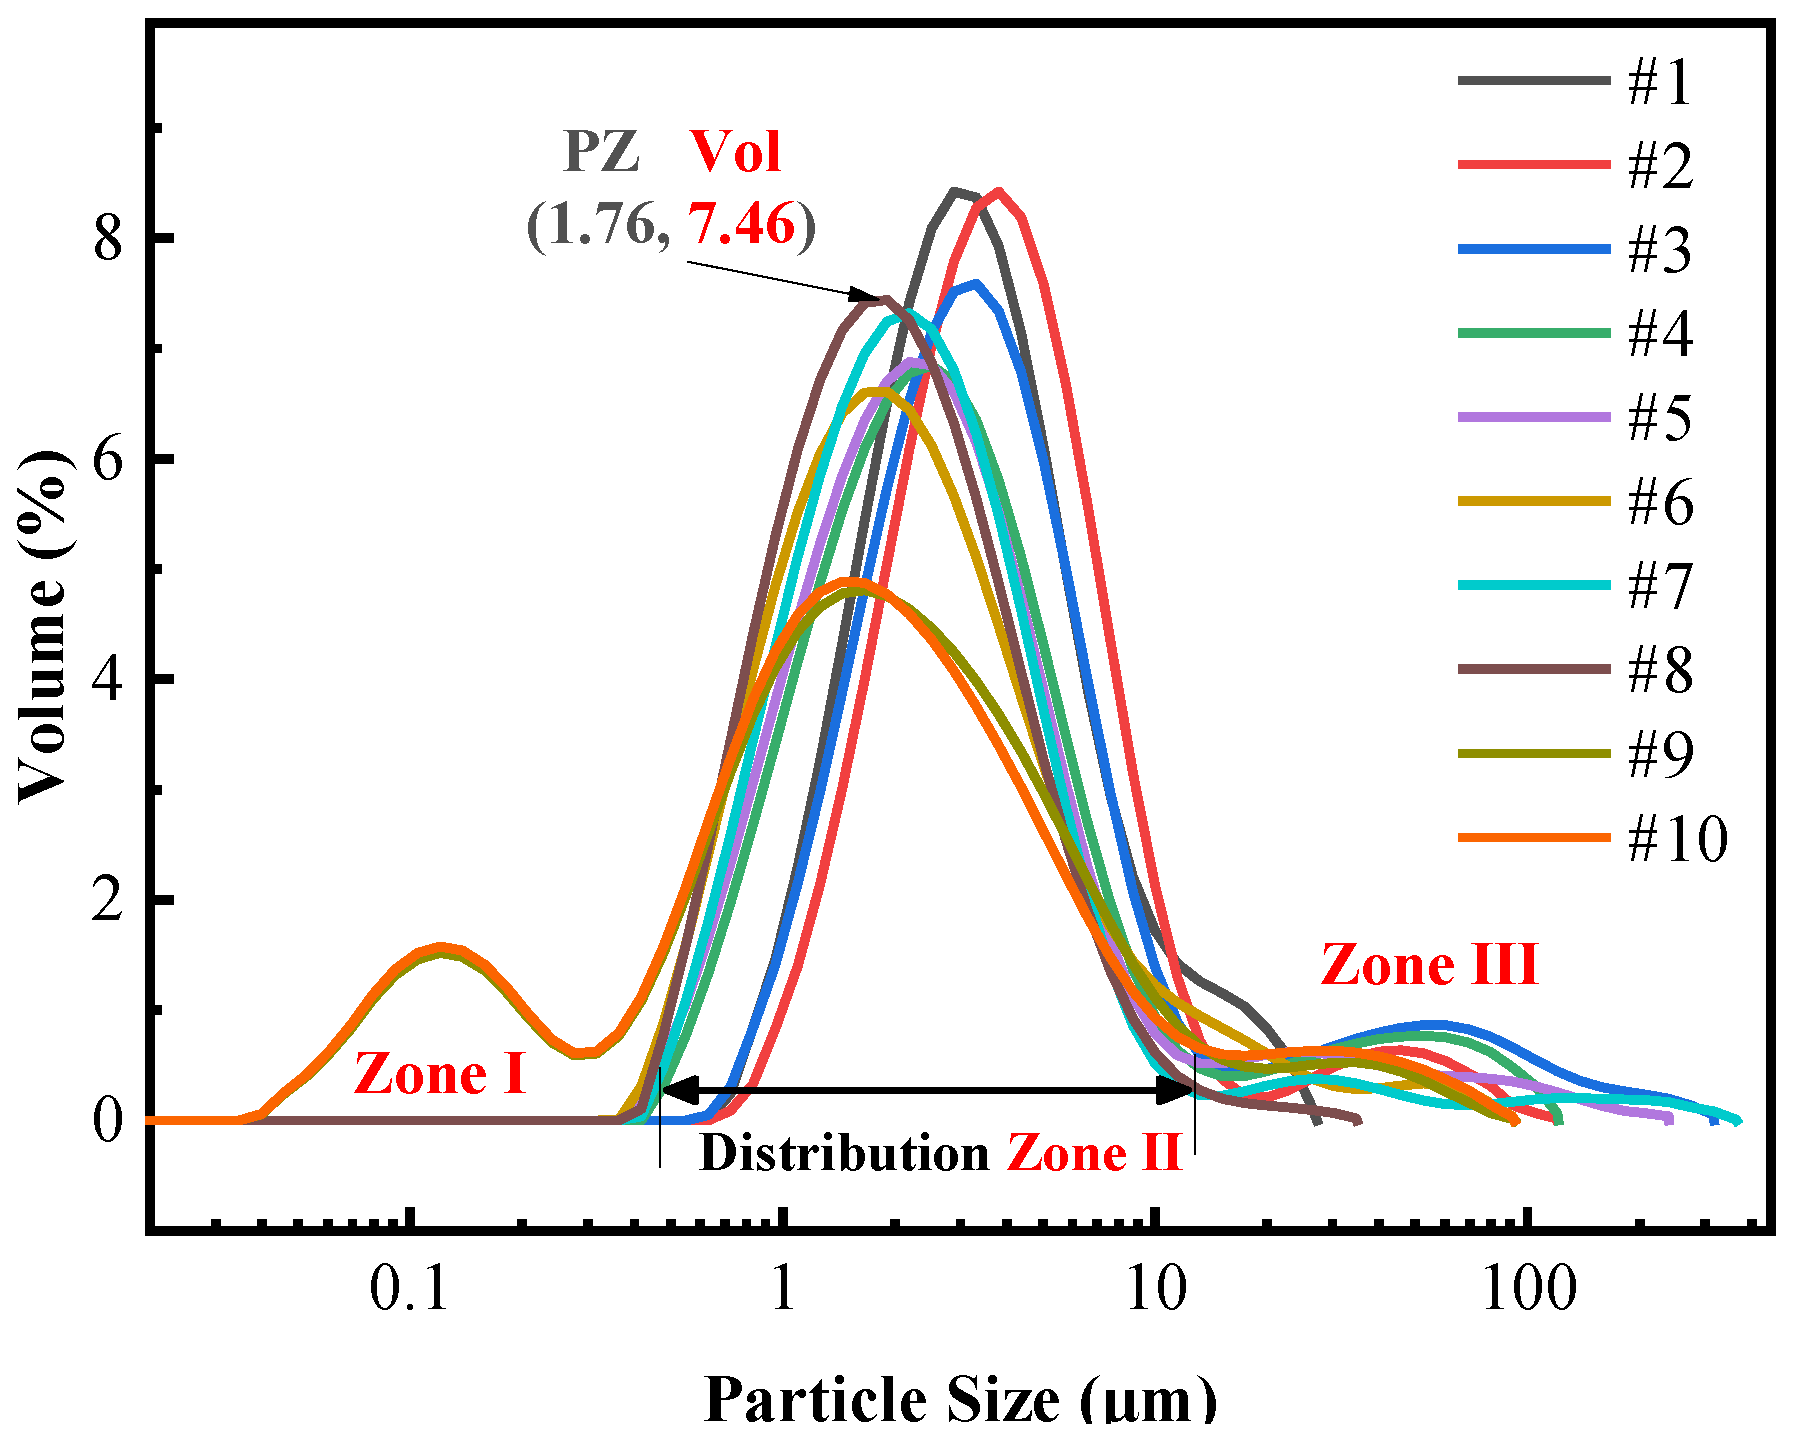
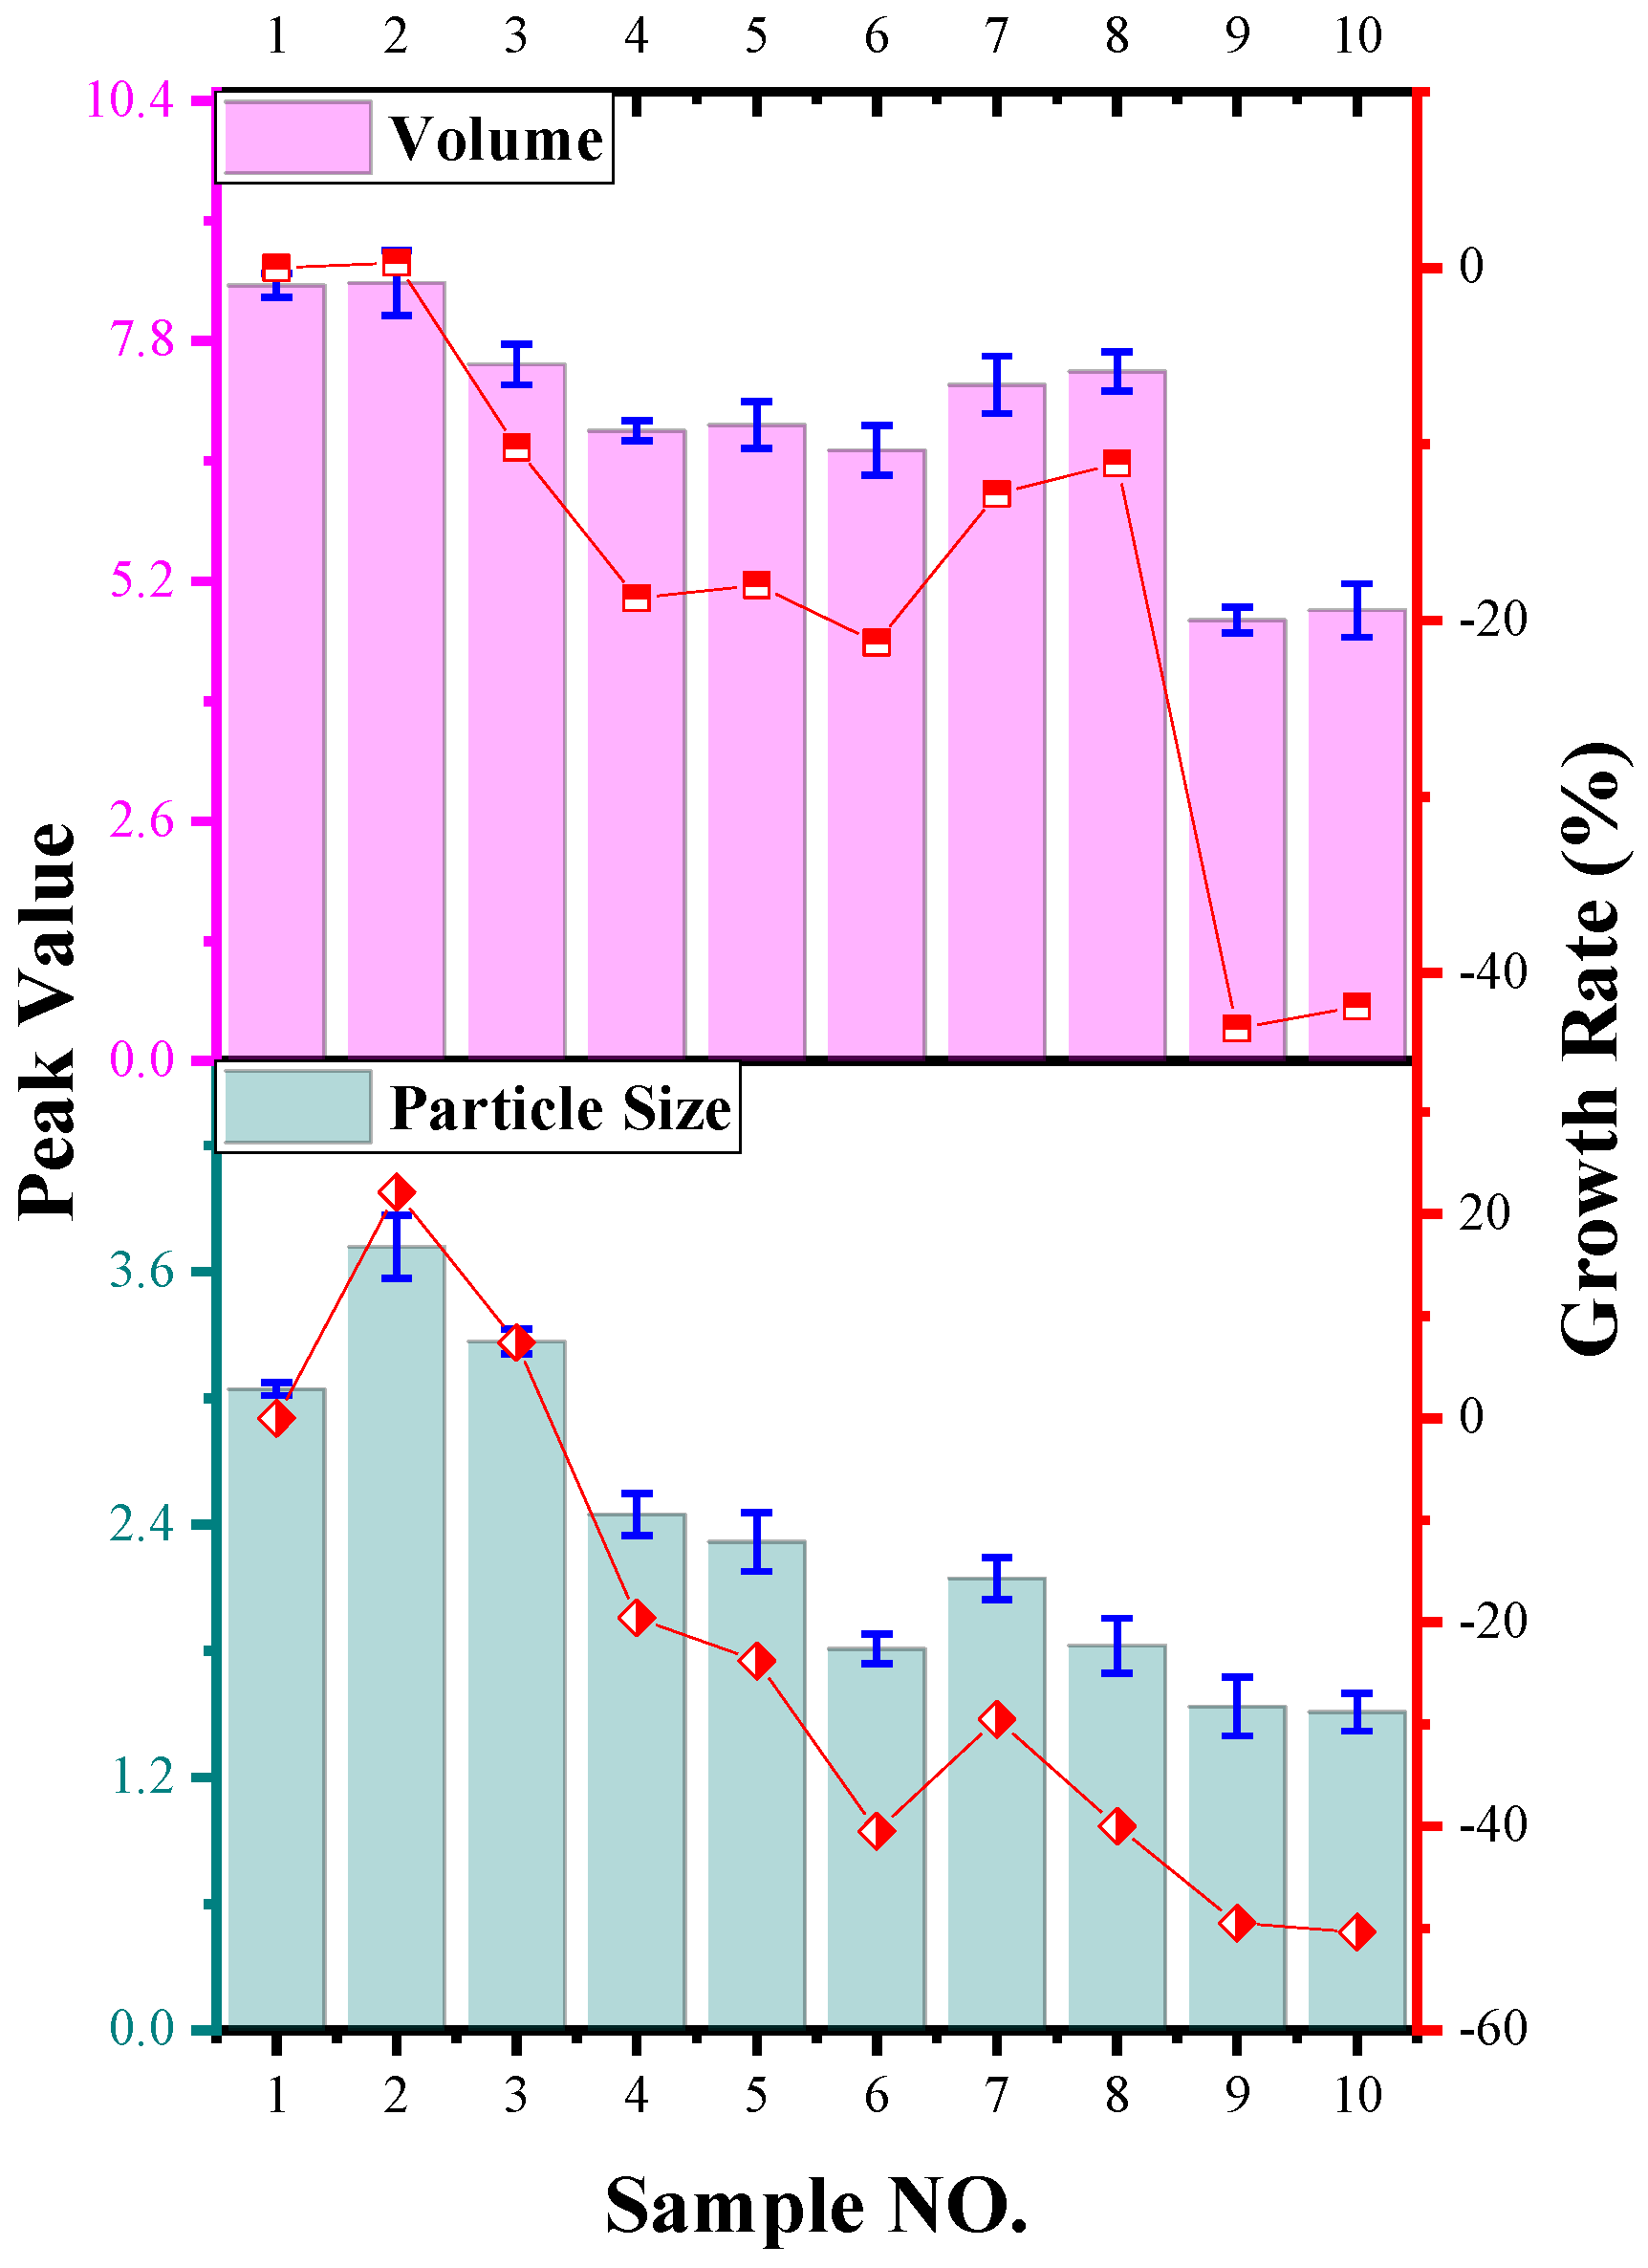
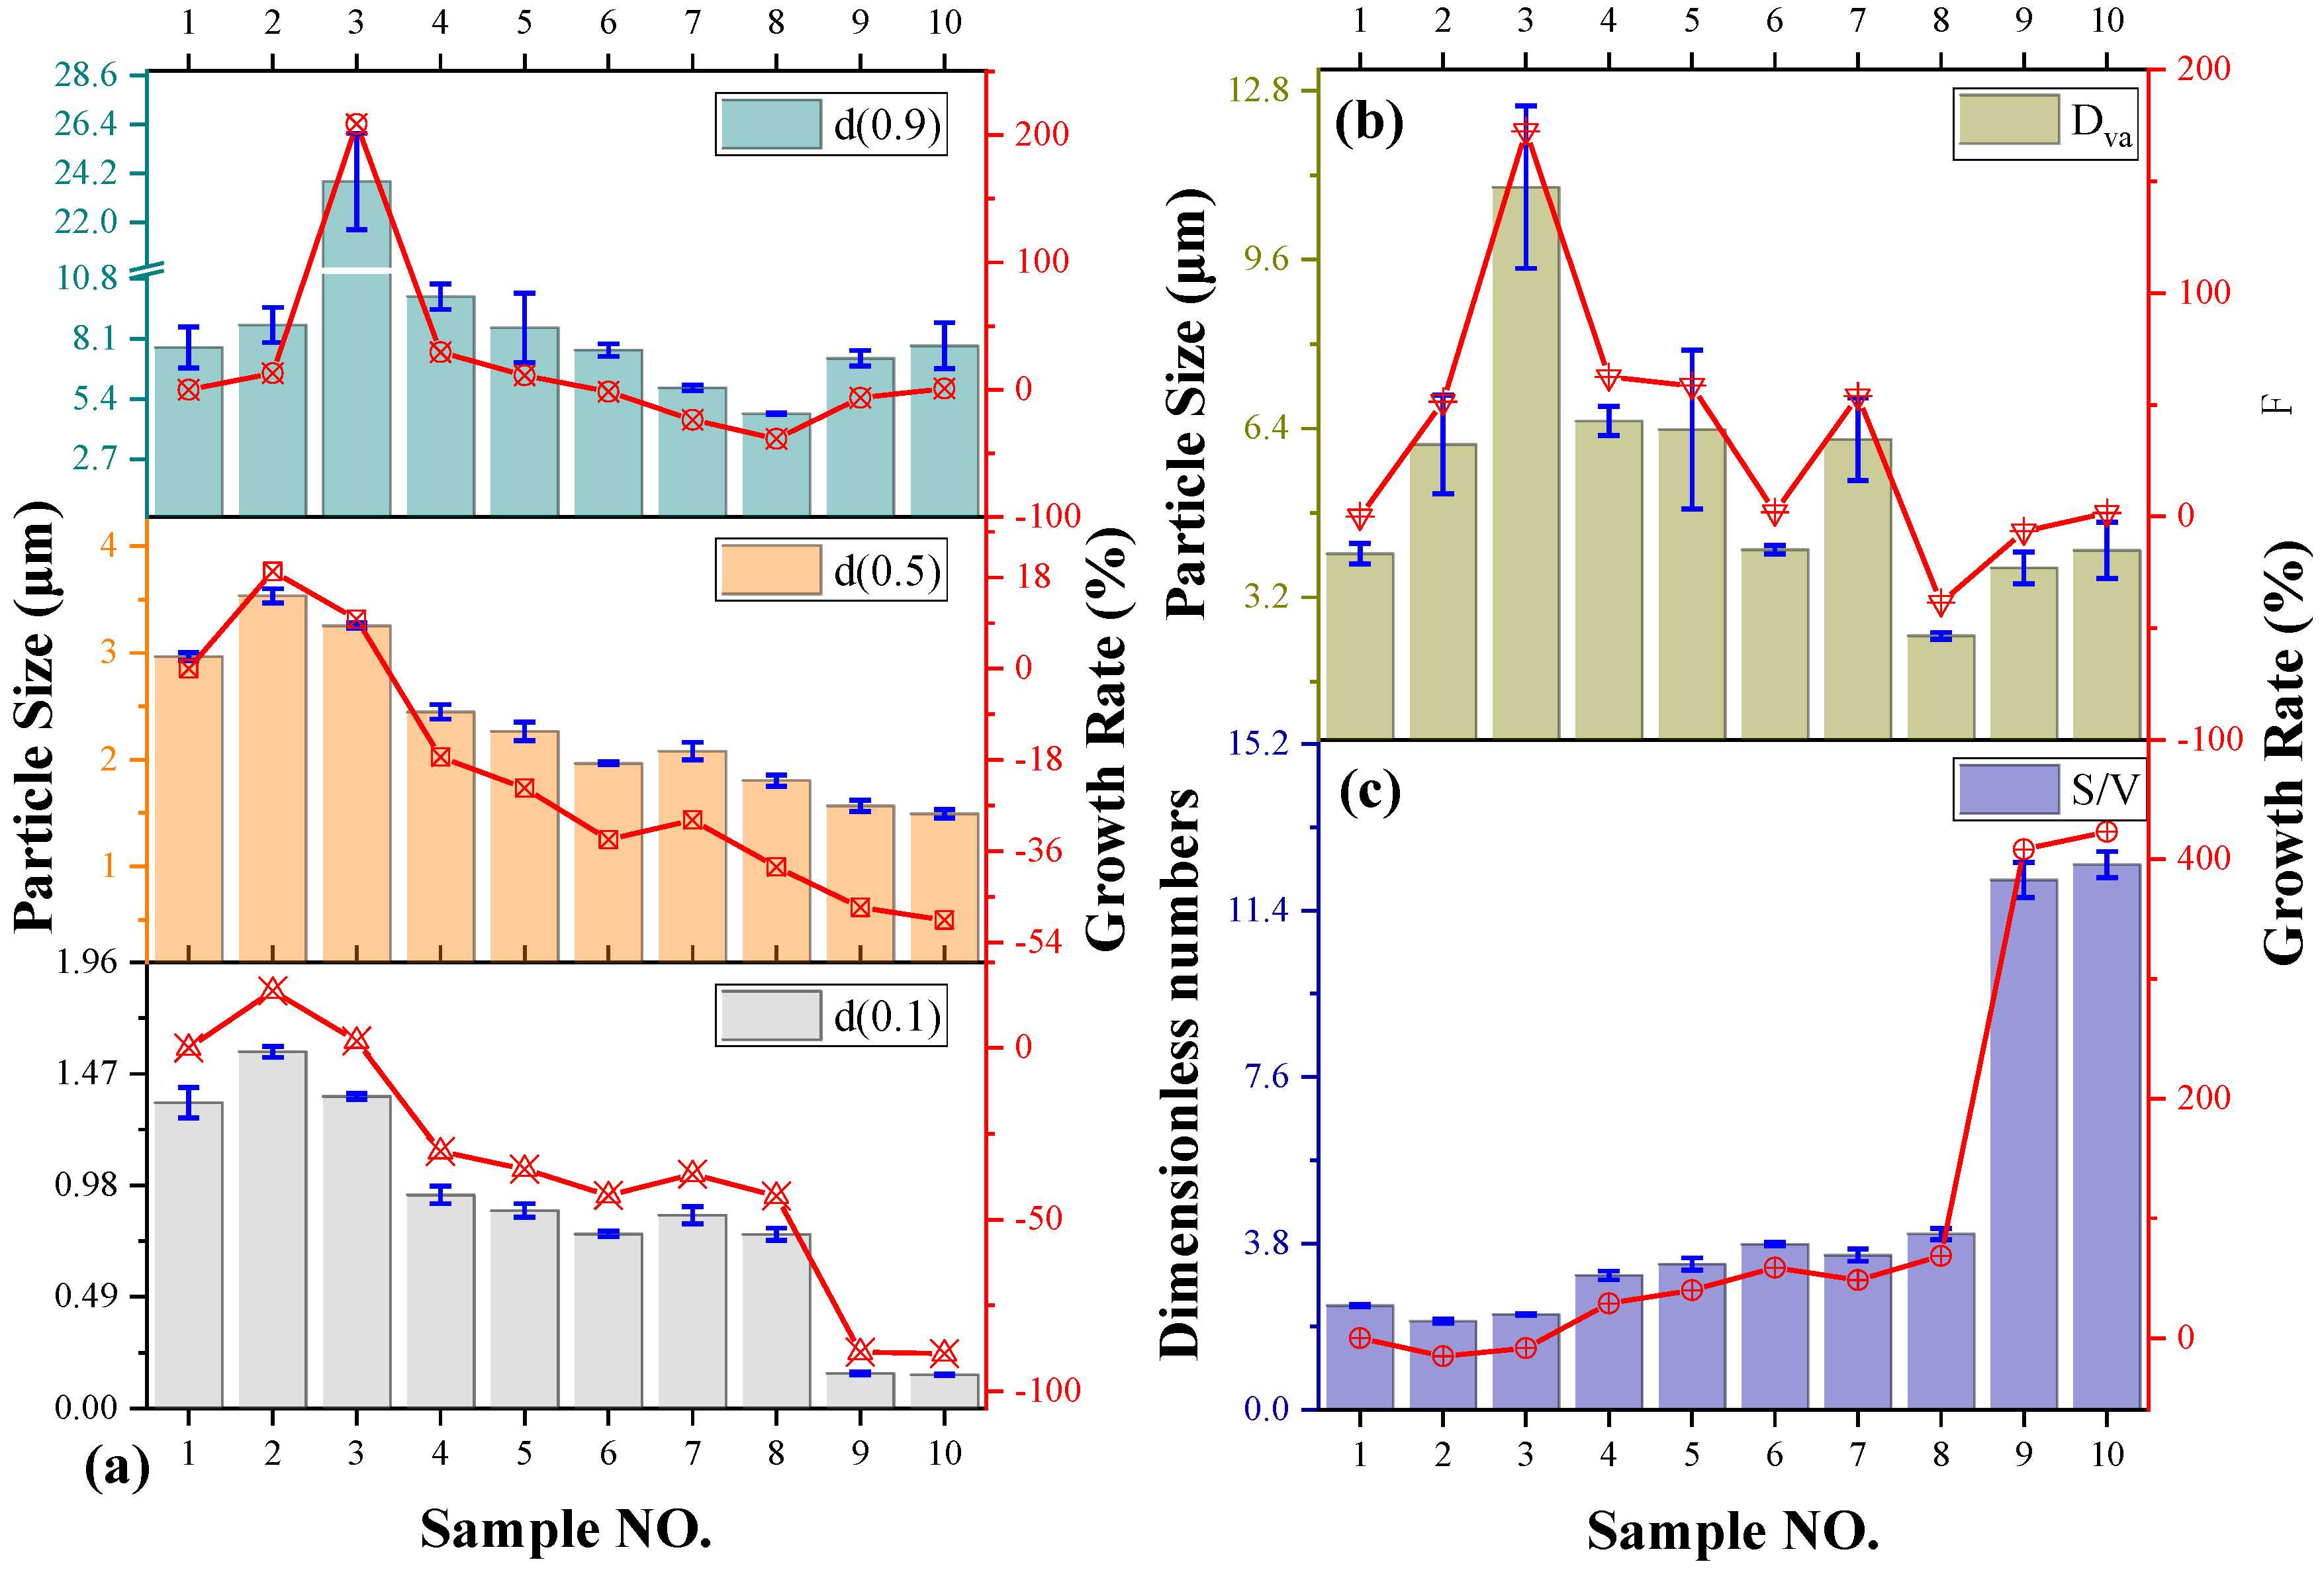
3.1. Particle Size Distribution of Dust

The particle size of the dust is shown in Figure 6. The particle size distributions of the volatiles were 0.04~0.32 μm (Zone I), 0.5~14 μm (Zone II), and 17.5~350 μm (Zone III). With decreasing ZnO content, the main particle size distribution interval in Zone II becomes narrower, and the peak volume decreases. The trend of Zone I is not obvious, and Zone III becomes wider. For better analysis, the abscissa and ordinate of the peak of Zone II are compared, as shown in Figure 7.
Figure 7 is based on the data in Zone II of Figure 6, which consist of volume and particle size. The data of volume are the comparison of peak y in Figure 6. The data of particle size are the comparison of peak x in Figure 6. The growth rate is the relative growth rate of the current data relative to the previous data. It can be seen from the growth rate curve that with the decrease in ZnO content, the overall volume shows a downward trend, with a small increase of about 10% in 7# and 8#, and a total decrease of about 41.9% in 1#–10#. Particle size also shows a downward trend, with small increases of about 22–29% in #2, 3#, and 7#, for a total decrease of about 50.3%. Such changes suggest that there are some anomalies in #2, #3, and #7, which are likely larger structures.
Figure 8 shows the data calculated according to Figure 6. Figure 8a shows the cumulative particle size distribution. d(x) denotes the proportion of particles smaller than the particle size x. The larger d(x) is, the larger the particle size in the sample. From the growth rate of d(0.9), it can be seen that there are more large structures in #2, #3, #9, and #10. However, the growth rate of d(0.1) and d(0.5) shows that the particle sizes of #9 and #10 are smaller, so their number of particles is relatively greater. This can be proven in Figure 8c. The specific surface areas of #9 and #10 are significantly larger than those of the other samples. Therefore, a larger agglomeration structure is eventually formed, resulting in the non-uniform distribution shown in Figure 8b, and the error of Dav becomes larger.

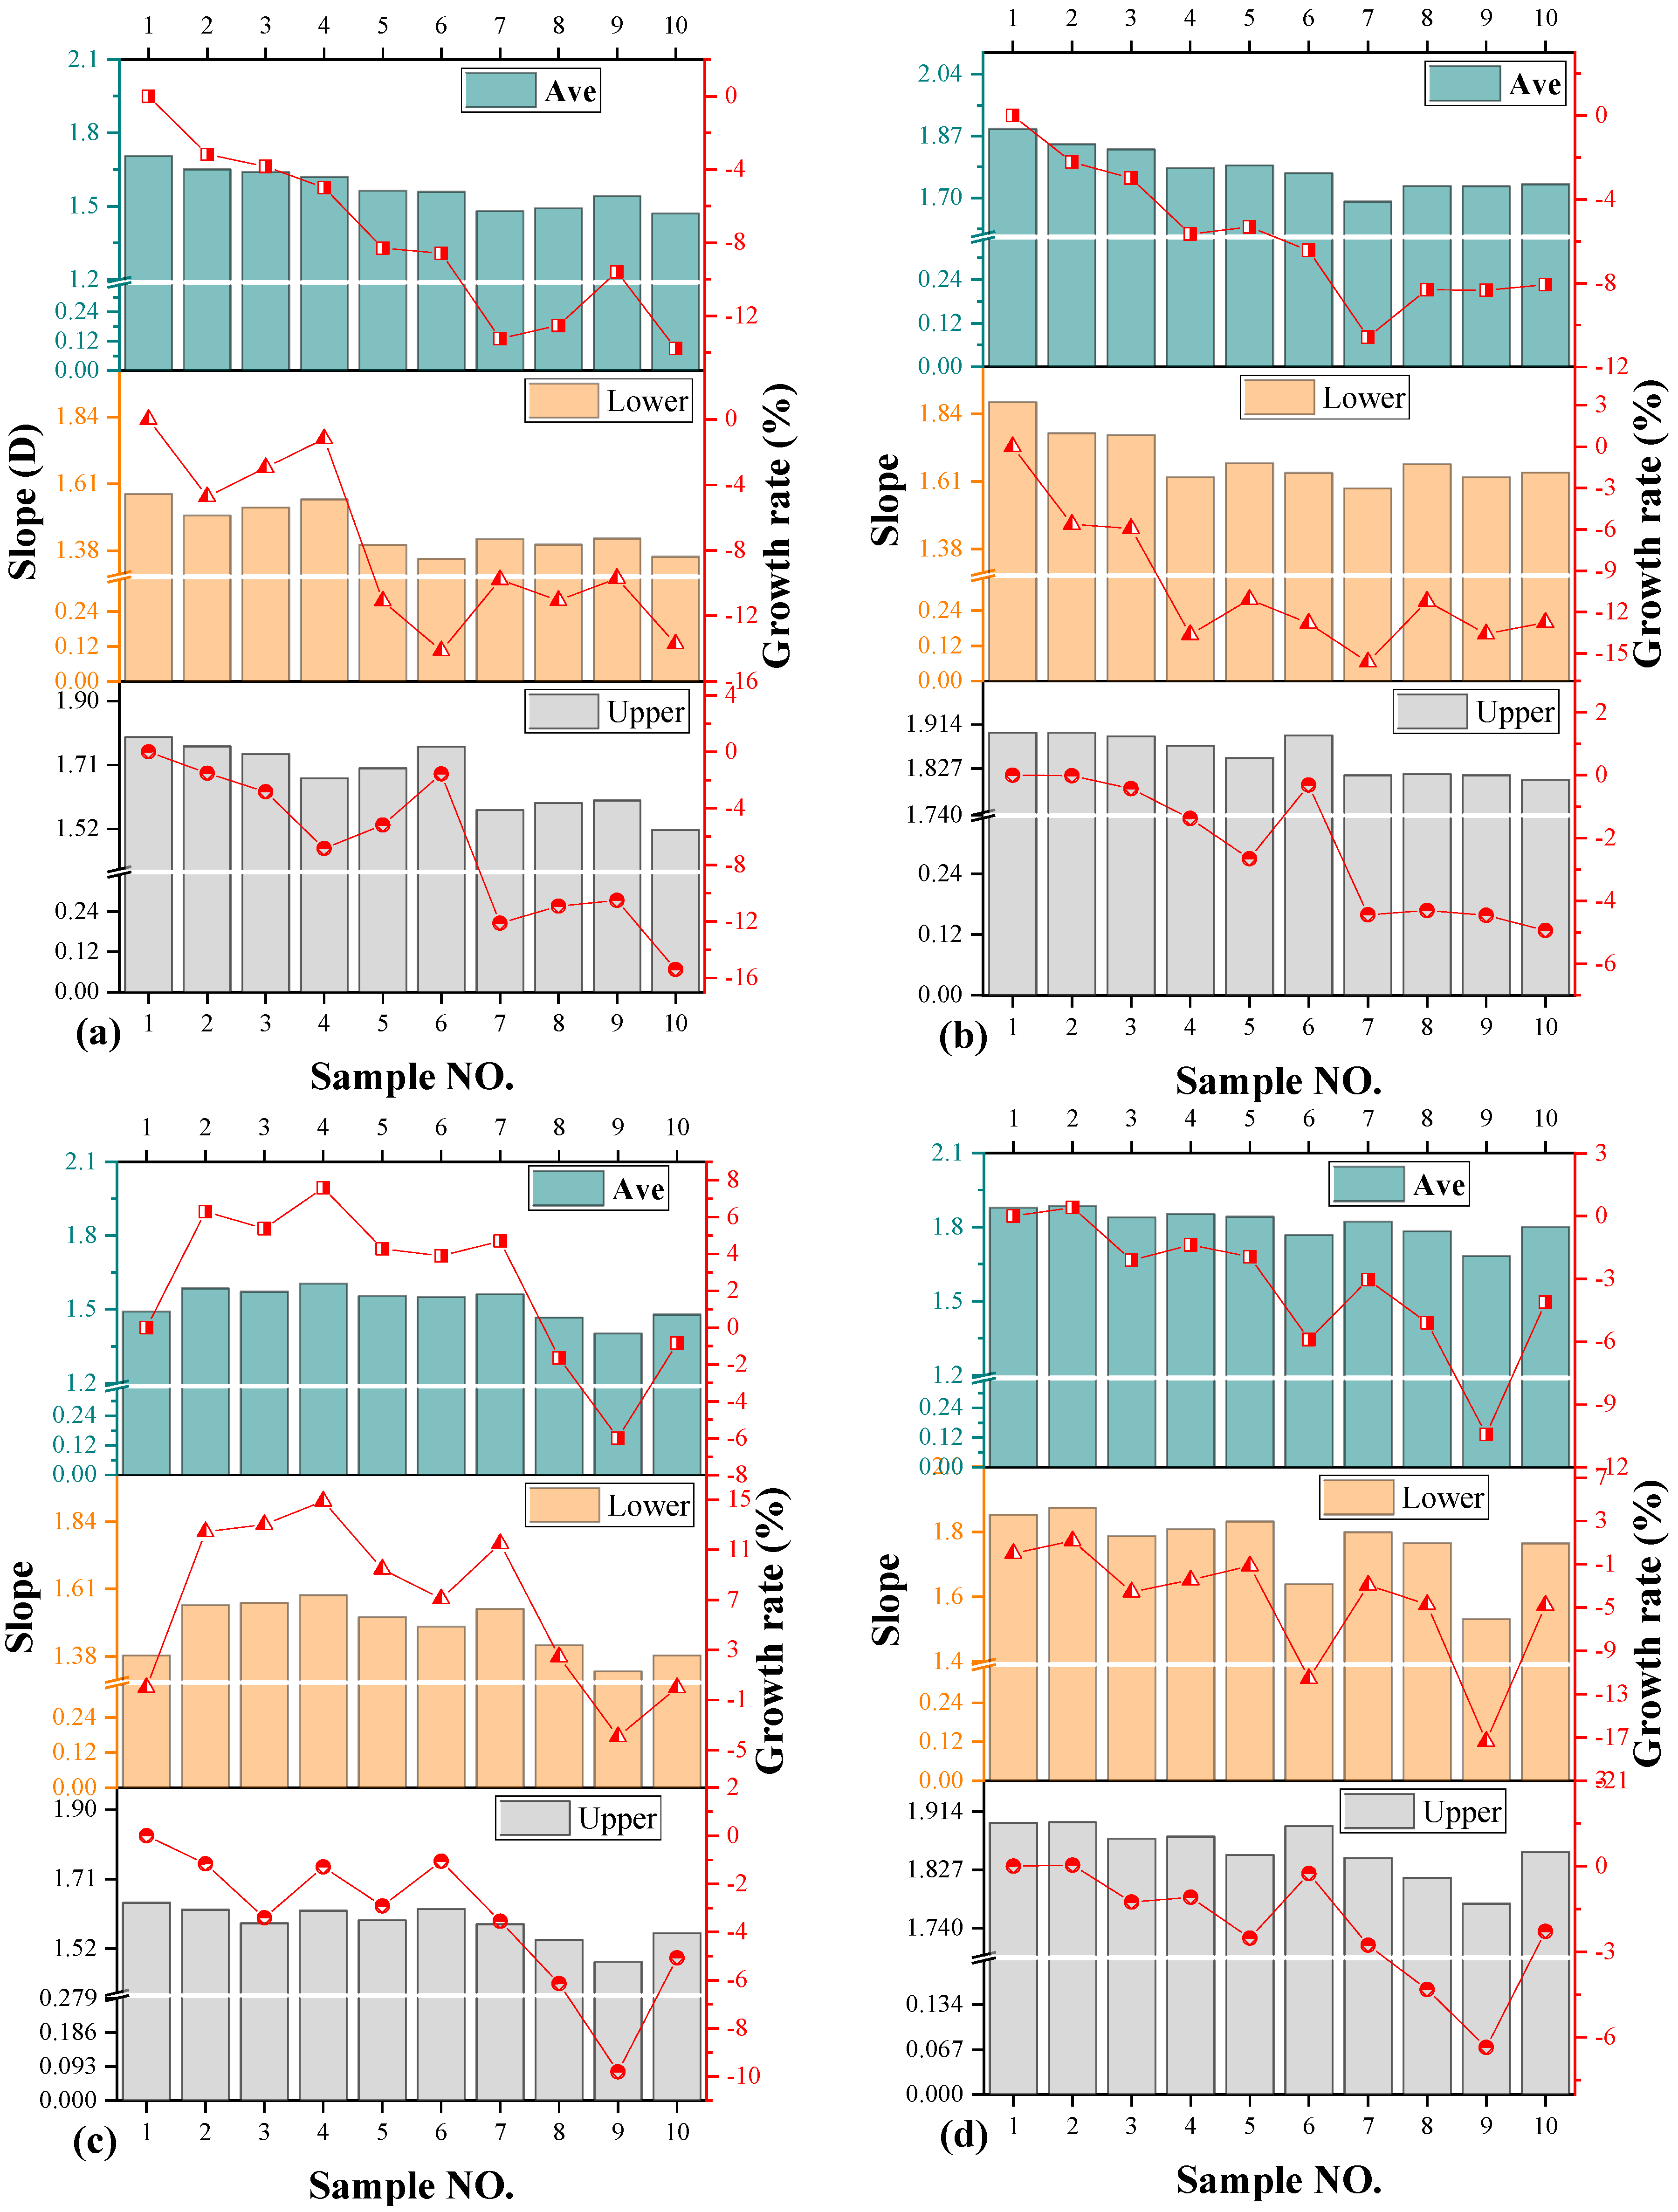
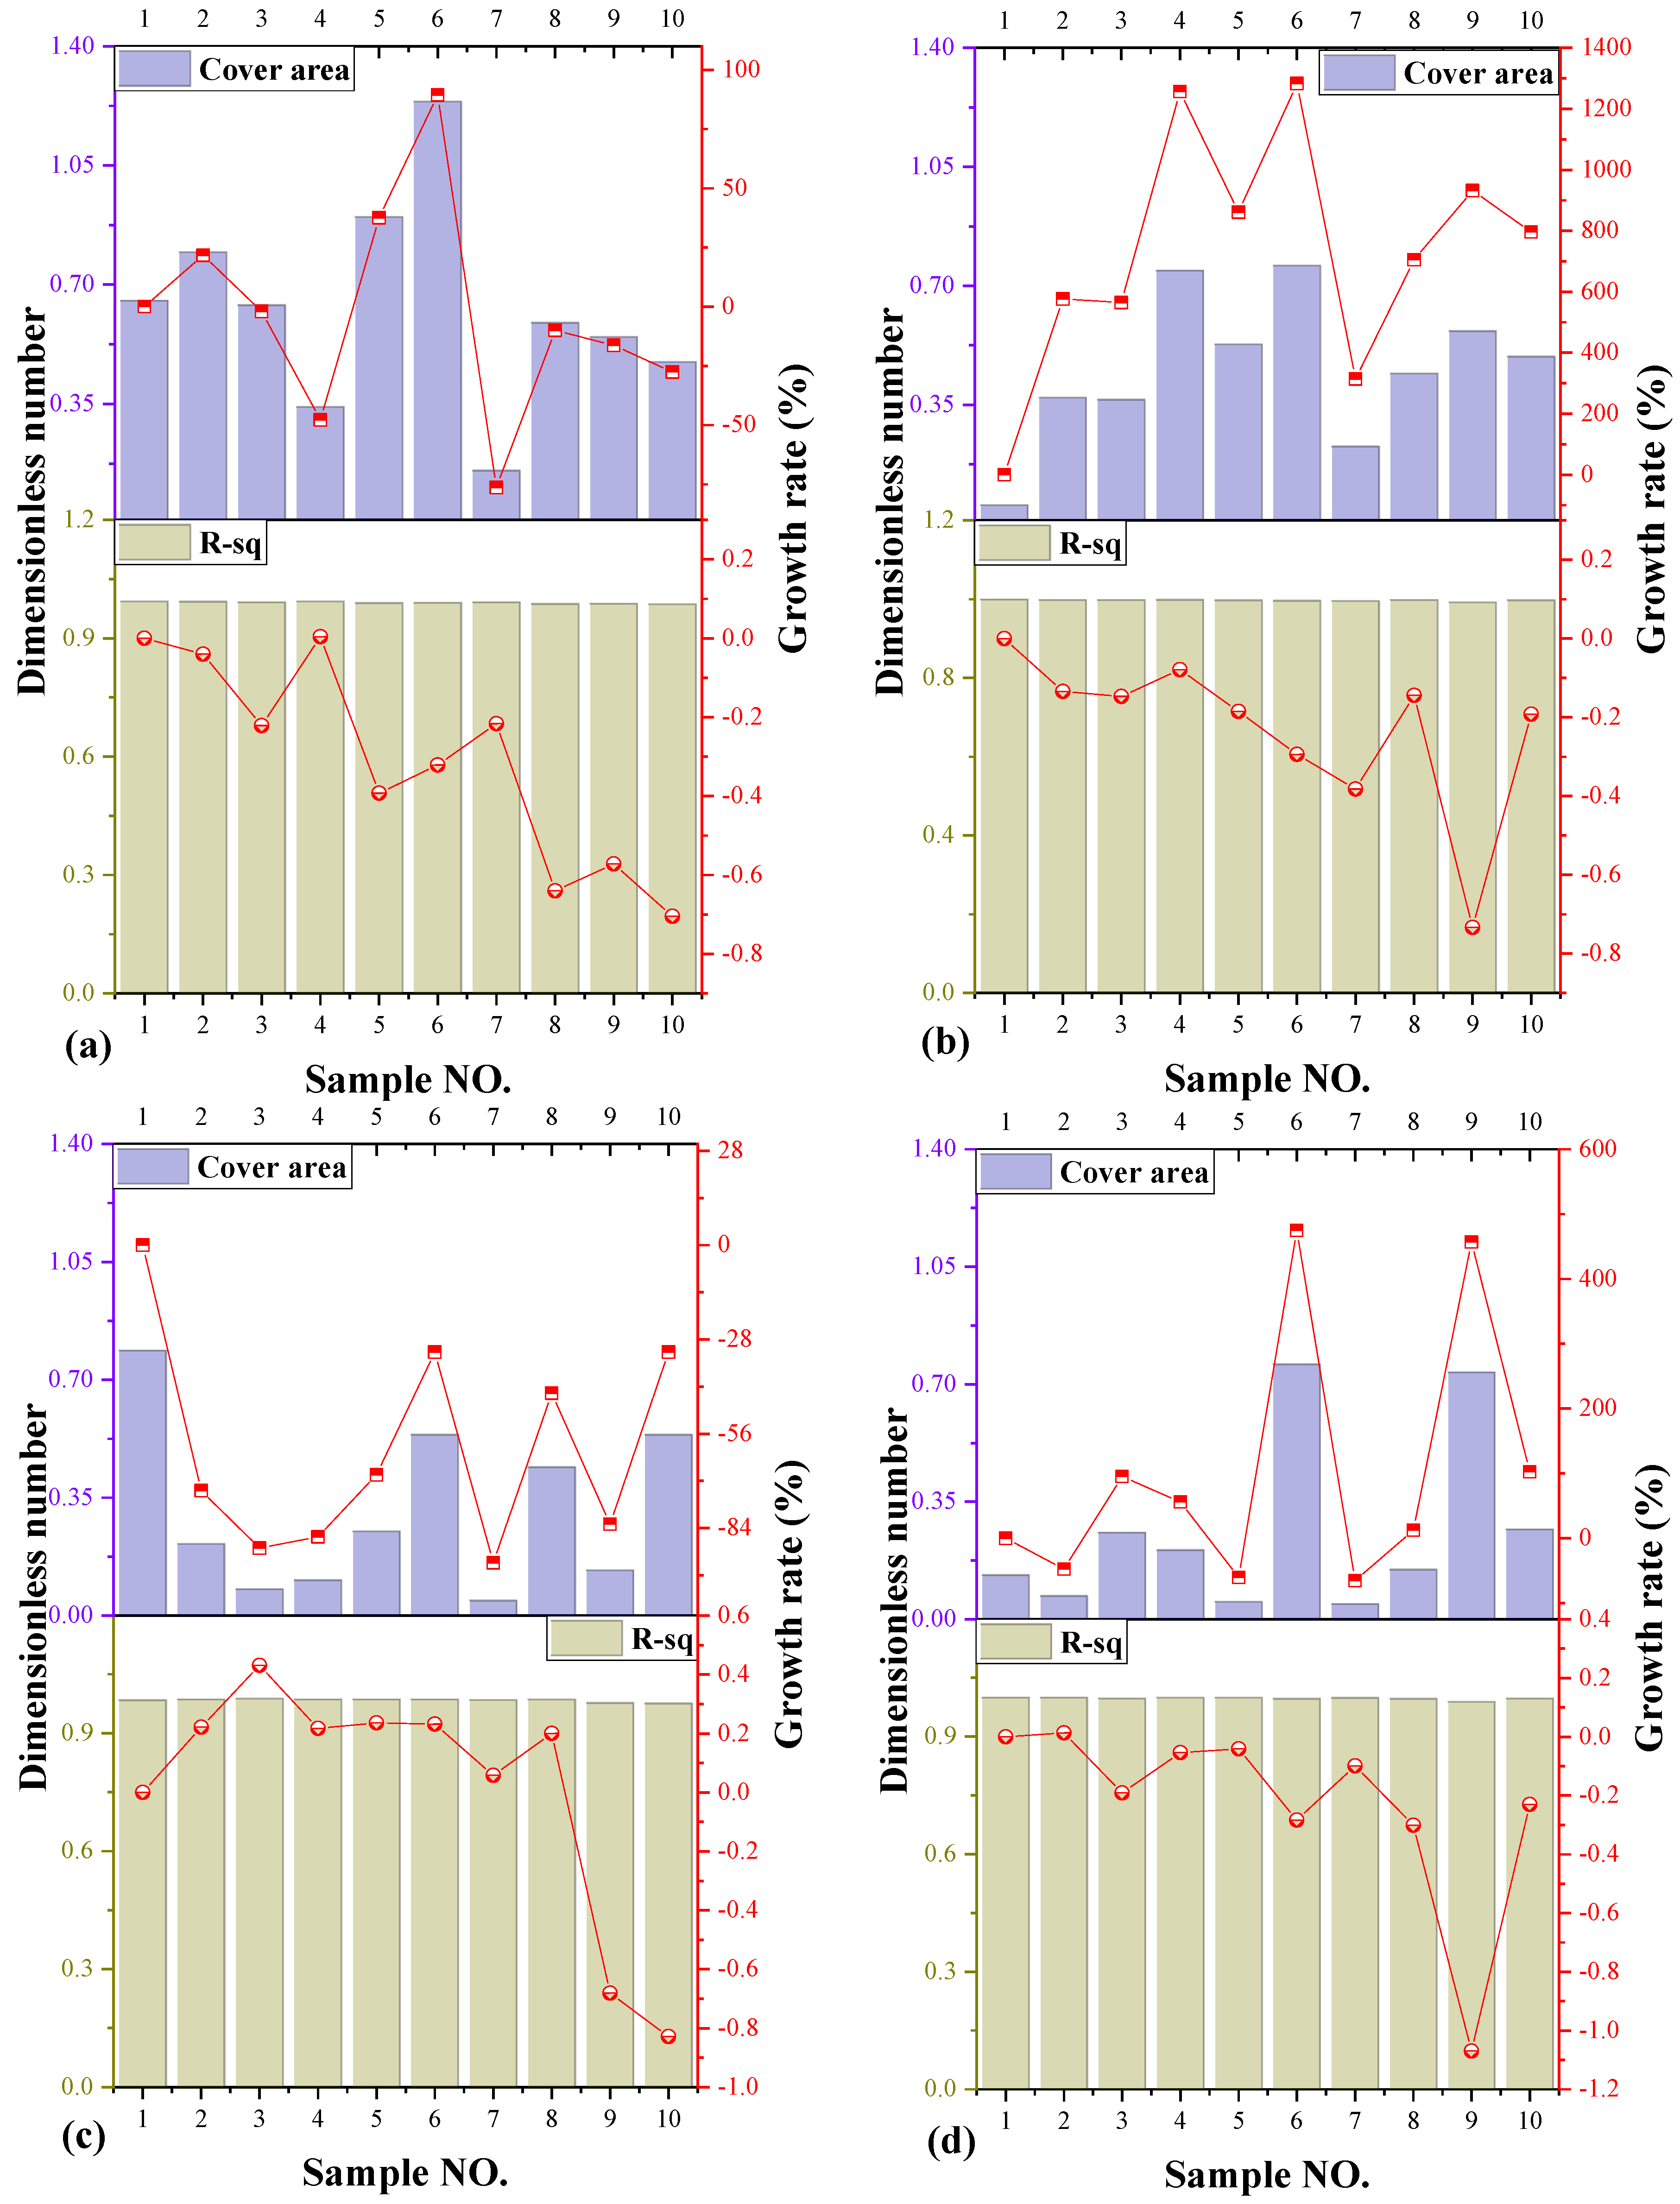
3.2. The Fractal Dimension of Dust

Figure 9 shows the fractal dimension of the micropatterns of the different samples. Figure 9a–d were photographed at 10 K times, retaining only the external contour of the shape; at 10 K times, retaining the details of particle aggregation; at 30 K times, preserving the external contour; and at 30 K times, preserving the details. In the image, Upper represents the upper limit of the distribution of the fractal dimension D (slope), Lower represents the lower limit of the distribution of D, and Ave represents the average of all the data. It can be seen from Figure 9a that the Upper, Lower, and Ave data of #1–10 show a downwards trend. With decreasing ZnO content in the sample, the fractal dimension decreases, the complexity of the image decreases, and the aggregation becomes loose. Ave’s overall decline was 1.875%. The more anomalous samples are #8 and #9, which are close to the situation of Figure 8.
The trend shown in Figure 9b is similar to that in Figure 9a, but the three data points decrease overall, and the growth rate corresponding to points #1–10 increases. In addition, the fluctuation of the lower growth rate curve is weakened. This shows that the fractal dimension is further reduced after considering the details of particle aggregation in the calculation. This does not mean that graphics become simpler. It is a repeated aggregation pattern, so that all images tend to be the result of the same feature.
When the shooting multiple is increased to 30 k, the fractal dimension of different samples changes significantly. The larger shooting multiple magnifies the details of the figure. The dust pattern is larger in 30 K times photos, and there are fewer particles in the same area, which leads to the overall decrease trend of D in Figure 9c, which ranges from 0.6% to 17.5%. In addition, the three data points of #1–#10 showed a trend of first increase and then decrease, and the Ave and Lower of #2, #3, #4, and #7 were larger than those of the other four samples, which was very different from Figure 9a,b. However, the results are close to those obtained in Figure 7 and Figure 8. There are two possibilities. First, the agglomeration structures observed at multiples of 30 K times in #2, #3, #4, and #7 are larger than in the other samples. Second, more complex structures appeared in these four samples. Only under these two conditions will Figure 9c,d show significant fractal differences compared with Figure 9a,b. By comparing the actual microscopic images, it can be found that there are indeed more irregular particles in #2, #3, #4, and #7, as shown in Figure 10.
Figure 10 shows the microscopic images of 1, #2, #3, #4, and #7. Where 1# was the comparison item, the other four samples showed large changes in the D value at 30 K times. Figure 10a,c,e,g,I are the key microscopic images obtained by SEM photographing samples 1, #2, #3, #4, and #7 at a multiple of 10 K times. Figure 10b,d,f,h,j are the microscopic images obtained by SEM photographing samples 1, #2, #3, #4, and #7 at multiples of 30 K times. Figure 10a,b shows that the particles observed at 10 K times are smaller, and those observed at 30 K times are coarser, with irregular particle morphology. The particle sizes of Figure 10c,g,I are similar to those of Figure 10a, while those of Figure 10e are larger, and the morphology of particles is irregular. It can be found that under the condition of 30 K times, particles 2#, #3, #4, and #7 are significantly larger than 1#, and the degree of irregularity of the figure is also higher, as shown in the red dashed lines in Figure 10d,f,h,j. The figure highlighted by the red dashed line exhibits no discernible pattern and appears to rise as the count of the figures increases.That is, the dust structures observed at 30 K times in #2, #3, #4, and #7 are significantly larger and more complex, consistent with the conjecture in the previous paragraph. This indicates that when the PbO/ZnO increases at the initial stage, the accumulation scale of small particles becomes significantly larger and the structure becomes more complex. This trend stopped when the PbO content exceeded 99%, and the packing scale of small particles began to become smaller, and the irregularity of the packing image was weakened. There should be a special coupling mechanism between PbO dust, ZnO dust, and dust morphology.
The features between the upper and lower values in Figure 9 are difficult to compare. By comparing the coverage area of the D value, that is, the area between the upper and lower values, the diversity of graphic features can be clearly analyzed. The complexity of an image mainly refers to the number of details and content changes in the image. The diversity of features is mainly reflected in the combination of different shapes [45]. Diversity is a manifestation of complexity but can be compared separately. In addition, the goodness of fit R-sq of the four fractal dimensions can reflect the goodness of fit of the data.
Figure 11a shows that the Cover area (CA) of #6 is the largest, followed by that of #5, and that of #7 is the smallest. In Figure 8a,b, the Ave values of #5 and #6 are in the middle, and the Ave value of #7 is the smallest. This shows that with decreasing ZnO content in the sample, although the average complexity of the pattern under the 10 K field of view continues to decrease, the diversity of the pattern first increases and then decreases. This conclusion is the same as that obtained by the analysis of Figure 9c,d and Figure 10. After considering the details of particle aggregation in Figure 11b, this trend does not change much. However, the overall CA generally decreased by more than 50%, and only #4 increased. This shows that there are relatively more changes in the stacking pattern of sample #4.
When the shooting scale increases to 30 K, the distribution trend of the CA value in Figure 11c is basically opposite to that in Figure 11a,b. Among them, #1 is the largest, followed by #10, #6, #8, and #7. When considering the aggregation details, Figure 11d shows that #6 and #9 are larger, and the others are generally reduced. The difference between them suggests that the association between fractal dimension and fractal feature diversity is weak. However, under all calculation conditions, the diversity is higher in the range of PbO/ZnO = 75.16–138.1.
The R-sq data are generally greater than 0.98, and the specific trends are as follows: The a. 10 K graphics data show a downwards trend; the NO of the 30 K graph shows a trend of increasing first and then decreasing. The 30 K graphics show an alternating growth–decline trend. The R-sq of b. Detail is approximately 0.6–1.5% greater than that of NO. This trend corresponds to the trend of the Ave value. This shows that the greater the complexity of the graph is, the greater the diversity of the graph, and the lower the goodness of fit.

4. Conclusions

In this study, changes in the composition of dust containing lead and zinc led to a number of conclusions. From the laser particle size data and the 10 K times fractal data, it can be seen that with the decrease in ZnO content and the increase in PbO content in the sample, although there are large structures in #2, #3, and #7, the particle size of the dust overall shows a downward trend, and the complexity of the accumulation pattern decreases, and the agglomeration becomes loose. When the observation multiple reaches 30 K times, a smaller scale condensation structure can be observed. Such structures in #2, #3, #4, and #7 are larger in size and more geometrically complex. It can be found that there is a coupling relationship between the chemical composition of the sample and the morphology of the dust in the range of PbO/ZnO = 90/10~99/1, so that the PbO content is positively correlated with the fractal dimension, and the PbO/ZnO is negatively correlated when the PbO/ZnO > 99/1. This shows that there is an interaction between the condensation of PbO vapor molecules and ZnO vapor molecules, and the structural characteristics of condensed dust show a non-uniform trend. In addition, the correlation between fractal dimension and fractal feature diversity is weak. However, under all calculation conditions, the diversity is higher in the range of PbO/ZnO = 75.16–138.1.
The above morphological changes indicate that if the large-scale lead–zinc dust breaks down and becomes smaller during the propagation process, even if the composition changes, the geometric complexity of the particles will even increase, and the biological inhalation hazard will increase. That is, the biological hazards of lead and zinc dust in PM2.5 and PM10 mentioned in reference [31,32] are similar. Secondly, the advantages of irregular- and small-sized particles in energy conduction mentioned in reference [15,16,17] and the complex condensation shape of dust should also contribute.
The D-value is negatively correlated with the goodness of fit R-sq of the D-value; that is, the higher the complexity of the graph, the lower the goodness of fit. This should be because complex graphics lead to more defects in the image, and to curb this trend requires further improvement in image processing. The study of this paper shows that although the fractal calculation method can highlight the relationship between dust morphology and chemical composition under certain conditions, whether this relationship can become a characteristic point to identify dust hazards needs more data support. In addition, to achieve high-quality, efficient, and systematic operation of fractal computing, it is necessary to upgrade the image processing technology.

Author Contributions

Data curation, S.W.; writing—original draft preparation, Q.L.; writing—review and editing, W.T. and N.H. All authors have read and agreed to the published version of the manuscript.

Funding

This research was funded by the Education Department of Shaanxi Province grant number 18JK0476.

Data Availability Statement

The original contributions presented in this study are included in the article.

Acknowledgments

The authors thank Xin Shao of SINOSTEEL Luoyang Institute of Refractories Research Co., Ltd., for his help with equipment design and production.

Conflicts of Interest

The authors declare no conflicts of interest.

References

  1. Ruan, H.-J.; Su, W.-Y.; Yao, K. Box dimension and fractional integral of linear fractal interpolation functions. J. Approx. Theory 2009, 161, 187–197. [Google Scholar] [CrossRef]
  2. Nowińska, K.; Adamczyk, Z. Zinc and Lead Metallurgical Slags as a Potential Source of Metal Recovery: A Review. Mater 2023, 16, 7295. [Google Scholar] [CrossRef] [PubMed]
  3. Kicińska, A. Physical and chemical characteristics of slag produced during Pb refining and the environmental risk associated with the storage of slag. Environ. Geochem. Health 2021, 43, 2723–2741. [Google Scholar] [CrossRef] [PubMed]
  4. Pan, D.A.; Li, L.; Tian, X.; Wu, Y.; Cheng, N.; Yu, H. A review on lead slag generation, characteristics, and utilization. Conserv. Recycl. 2019, 146, 140–155. [Google Scholar] [CrossRef]
  5. Kurashima, K.; Matsuda, K.; Kumagai, S.; Kameda, T.; Saito, Y.; Yoshioka, T. A combined kinetic and thermodynamic approach for interpreting the complex interactions during chloride volatilization of heavy metals in municipal solid waste fly ash. Waste Manag. 2019, 87, 204–217. [Google Scholar] [CrossRef]
  6. Kageyama, H.; Osada, S.; Nakata, H.; Kubota, M.; Matsuda, H. Effect of coexisting inorganic chlorides on lead volatilization from CaO–SiO2–Al2O3 molten slag under municipal solid waste gasification and melting conditions. Fuel 2013, 103, 94–100. [Google Scholar] [CrossRef]
  7. Simoni, M.; Reiter, W.; Suer, J.; Di Sante, L.; Cirilli, F.; Praolini, F.; Mosconi, M.; Guzzon, M.; Malfa, E.; Algermissen, D.; et al. Towards the Circularity of the EU Steel Industry: Modern Technologies for the Recycling of the Dusts and Recovery of Resources. Metals 2024, 14, 233. [Google Scholar] [CrossRef]
  8. Stewart, D.J.C.; Barron, A.R. Pyrometallurgical removal of zinc from basic oxygen steelmaking dust—A review of best available technology. Conserv. Recycl. 2020, 157, 104746. [Google Scholar] [CrossRef]
  9. Liu, Q.; Wang, C.-Q.; Tan, J.; Yin, Z.-L.; Chen, Q.-Y.; Liao, Z.; Zhang, P.-M.; Liu, Y. Recovery of iron from lead-zinc metallurgical slags by bath smelting. J. Cent. South Univ. 2015, 22, 1256–1263. [Google Scholar] [CrossRef]
  10. Available online: https://www.lseg.com/en/data-analytics/trading-solutions/world-bureau-metal-statistics#contact-sales (accessed on 22 November 2024).
  11. Dehghani, S.; Moore, F.; Keshavarzi, B.; Hale, B.A. Health risk implications of potentially toxic metals in street dust and surface soil of Tehran, Iran. Ecotoxicol. Environ. Saf. 2017, 136, 92–103. [Google Scholar] [CrossRef]
  12. Wang, W.; Wang, M.; Shao, L.; Zhou, X.; Zhao, Z.; Li, N.; Zhou, H.; Li, W. Morphology and elemental composition of individual solid dust particles: From different sources to the atmosphere. Atmos. Environ. 2024, 338, 120842. [Google Scholar] [CrossRef]
  13. Tobiszewski, M.; Marć, M.; Gałuszka, A.; Namieśnik, J. Green Chemistry Metrics with Special Reference to Green Analytical Chemistry. Molecules 2015, 20, 10928–10946. [Google Scholar] [CrossRef]
  14. Armenta, S.; Garrigues, S.; de la Guardia, M. Green Analytical Chemistry. TrAC Trends Anal. Chem. 2012, 27, 497–511. [Google Scholar] [CrossRef]
  15. Reid, J.S.; Jonsson, H.H.; Maring, H.B.; Smirnov, A.; Savoie, D.L.; Cliff, S.S.; Reid, E.A.; Livingston, J.M.; Meier, M.M.; Dubovik, O.; et al. Comparison of size and morphological measurements of coarse mode dust particles from Africa. J. Geophys. Res-Atmos. 2003, 108, NO. D19, 8593. [Google Scholar] [CrossRef]
  16. Reding, N.S.; Farrell, T.M.; Verma, A.; Shiflett, M.B. Effect of particle morphology on metal dust deflagration sensitivity and severity. J. Loss Prev. Process Ind. 2021, 70, 104396. [Google Scholar] [CrossRef]
  17. Prasad, S.; Schweizer, C.; Bagaria, P.; Kulatilaka, W.D.; Mashuga, C.V. Effect of particle morphology on dust cloud dynamics. Powder Technol. 2020, 379, 89–95. [Google Scholar] [CrossRef]
  18. Bagaria, P.; Prasad, S.; Sun, J.; Bellair, R.; Mashuga, C. Effect of particle morphology on dust minimum ignition energy. Powder Technol. 2019, 355, 1–6. [Google Scholar] [CrossRef]
  19. Yang, W.; Song, Z.; Wang, B.; Lin, L.; Sun, L. High temperature corrosion of particulate matter during MSW combustion: Effects of particle size, inorganic minerals and additives on corrosion rates and mechanisms. Fuel 2024, 358, 130235. [Google Scholar] [CrossRef]
  20. Jiang, H. Application of fuzzy analytic evaluation method in occupational disease hazard control effect: Evaluation of a battery enterprise. In Proceedings of the 3rd International Conference on Application of Materials Science and Environmental Materials (AMSEM2016), Phuket Island, Thailand, 1–3 October 2015; pp. 114–132. [Google Scholar] [CrossRef]
  21. Shi, Y.; Li, C.; Fang, M.; Cen, J.; Wang, Q. Numerical investigation of particle re-entrainment mechanism and its suppression strategy in the high-temperature electrostatic precipitator. Powder Technol. 2024, 437, 119538. [Google Scholar] [CrossRef]
  22. Jing, D.; Ma, J.; Dong, Z.; Bai, L.; Kan, Q. Research on factors affecting the spread of dust pollution in conveyor belt workshop and research on wet dust reduction technology. PLoS ONE 2024, 19, e299328. [Google Scholar] [CrossRef]
  23. Aust, A.E.; Cook, P.M.; Dodson, R.F. Morphological and Chemical Mechanisms of Elongated Mineral Particle Toxicities. J. Toxicol. Environ. Health Part B. 2011, 14, 40–75. [Google Scholar] [CrossRef] [PubMed]
  24. Maciej, S.; Jerzy, M.; Luďka, H.; Martin, K.; Richard, K.; Lubos, K.; Marta, P.; Alena, O.; Tomasz, R. Fine dust after sanding untreated and thermally modified spruce, oak, and meranti wood. Eur. J. Wood Wood Prod. 2023, 81, 1455–1464. [Google Scholar] [CrossRef]
  25. Mazzoli, A.; Favoni, O. Particle size, size distribution and morphological evaluation of airborne dust particles of diverse woods by Scanning Electron Microscopy and image processing program. Powder Technol. 2012, 225, 65–71. [Google Scholar] [CrossRef]
  26. Davis, J.M.G.; Addison, J.; McIntosh, C.; Miller, B.G.; Niven, K. Variations in the Carcinogenicity of Tremolite Dust Samples of Differing Morphology. Ann. N. Y. Acad. Sci. 1991, 643, 473–490. [Google Scholar] [CrossRef] [PubMed]
  27. Coz, E.; Moreno, F.J.G.; Casuccio, G.S.; Artíñano, B. Variations on morphology and elemental composition of mineral dust particles from local, regional, and long-range transport meteorological scenarios. J. Geophys. Res. Atmos. 2010, 115. [Google Scholar] [CrossRef]
  28. Pan, X.; Uno, I.; Wang, Z.; Nishizawa, T.; Sugimoto, N.; Yamamoto, S.; Kobayashi, H.; Sun, Y.; Fu, P.; Tang, X.; et al. Real-time observational evidence of changing Asian dust morphology with the mixing of heavy anthropogenic pollution. Sci. Rep. 2017, 7, 335. [Google Scholar] [CrossRef]
  29. Ma, Z.; Li, T.; Qu, C.; Bi, J.; Huang, L. Evaluation and source identification of trace element contamination of soils in the Qixia lead-zinc mining area, Jiangsu, China. J. Soils Sediments 2014, 14, 1703–1712. [Google Scholar] [CrossRef]
  30. Qu, C.; Sun, K.; Surong, W.; Huang, L.; Bi, J. Monte Carlo Simulation-Based Health Risk Assessment of Heavy Metal Soil Pollution: A Case Study in the Qixia Mining Area, China. Hum. Ecol. Risk Assess. 2012, 18, 733–750. [Google Scholar] [CrossRef]
  31. Gao, Y.; Ji, H. Microscopic morphology and seasonal variation of health effect arising from heavy metals in PM2.5 and PM10: One-year measurement in a densely populated area of urban Beijing. Atmos. Res. 2018, 212, 213–226. [Google Scholar] [CrossRef]
  32. Hu, W.; Niu, H.; Zhang, D.; Wu, Z.; Chen, C.; Wu, Y.; Shang, D.; Hu, M. Insights into a dust event transported through Beijing in spring 2012: Morphology, chemical composition and impact on surface aerosols. Sci. Total Environ. 2016, 565, 287–298. [Google Scholar] [CrossRef]
  33. Dashek, W.V.; Olenchock, S.A.; Mayfield, J.E.; Wirtz, G.H.; Wolz, D.E.; Young, C.A. Carbohydrate and protein contents of grain dusts in relation to dust morphology. Environ. Health Perspect. 1986, 66, 135–143. [Google Scholar] [CrossRef]
  34. Eshel, G.; Levy, G.J.; Mingelgrin, U.; Singer, M.J. Critical Evaluation of the Use of Laser Diffraction for Particle-Size Distribution Analysis. Soil Sci. Soc. Am. J. 2004, 68, 736–743. [Google Scholar] [CrossRef]
  35. Mandelbrot, B.B. The Fractal Geometry of Nature; Freeman and Co.: San Francisco, CA, USA, 1982. [Google Scholar]
  36. King, R.D.; Brown, B.; Hwang, M.; Jeon, T.; George, A.T. Fractal dimension analysis of the cortical ribbon in mild Alzheimer’s disease. NeuroImage 2010, 53, 471–479. [Google Scholar] [CrossRef]
  37. Chen, H.; Wu, M.; Chang, Y. Lower Assouad type dimensions of uniformly perfect sets in doubling metric spaces. Fractals 2020, 28, 2050039. [Google Scholar] [CrossRef]
  38. Omar, Z.; Abd, N.; Rashid; Fauzi, S.H.M.; Shahrim, Z.; Marangoni, A.G. Fractal dimension in palm oil crystal networks during storage by image analysis and rheological measurements. Marangoni 2015, 64, 483–489. [Google Scholar] [CrossRef]
  39. Wang, Y.; Li, H.; Guo, L.; Yu, X.; Zhou, B. Direct Numerical Simulation of Inclusion Cluster Floating Behavior in Molten Steel Using Lattice Boltzmann Method. Steel Res. Int. 2015, 86, 732–739. [Google Scholar] [CrossRef]
  40. Risović, D.; Poljaček, S.M.; Furić, K.; Gojo, M. Inferring fractal dimension of rough/porous surfaces—A comparison of SEM image analysis and electrochemical impedance spectroscopy methods. Appl. Surf. Sci. 2008, 255, 3063–3070. [Google Scholar] [CrossRef]
  41. Gneiting, T.; Ševčíková, H.; Percival, D.B. Estimators of Fractal Dimension: Assessing the Roughness of Time Series and Spatial Data. Stat. Sci. 2012, 27, 247–277. [Google Scholar] [CrossRef]
  42. Bipin NB, J.; Rani, N.S. A modified deep semantic binarization network for degradation removal in palm leaf manuscripts. Multimed. Tools Appl. 2024, 83, 62937–62969. [Google Scholar] [CrossRef]
  43. Gao, T.; Xu, C.-Z.; Zhang, L.; Kong, H. GSB: Group superposition binarization for vision transformer with limited training samples. Neural Netw. 2024, 172, 106133. [Google Scholar] [CrossRef]
  44. Tang, W.-D.; Zhao, J.-X. Volatilisation Behaviour and Mechanism of Lead-Containing Slag during Physical Property Tests. Mater 2024, 17, 1531. [Google Scholar] [CrossRef] [PubMed]
  45. Snodgrass, J.G.; Vanderwart, M. A standardized set of 260 pictures: Norms for name agreement, image agreement, familiarity, and visual complexity. J. Exp. Psychol. Hum. Learn. Mem. 1980, 6, 174–215. [Google Scholar] [CrossRef] [PubMed]
Figure 1. Volatile substances collected.
Processes 12 02734 g001
Figure 2. Schematic diagram of the collection devices. 1—Sample; 2—Support bar; 3—Steel plate with hole; 4—Firebrick with hole; 5—Condenser shell; 6—Control system; 7—Furnace tube.
Processes 12 02734 g002
Figure 3. Image processing flowchart. (a) Micrograph; (b) Remove text; (c) Adjust color and brightness; (d) Adjust grayscale; (e) Edge extraction; (f-1) Binaryzation (Keep details); (f-2) Binaryzation (No details).
Processes 12 02734 g003
Figure 4. Determination of grayscale distribution and binarization threshold.
Processes 12 02734 g004
Figure 5. Data processing flow. (a) Raw data of #1(no detail); (b) Scatter plot; (c) Fitting curves; (d) Coverage of fitting curves; (e) Coverages of #1 to #3; (f-1) Upper limit of coverages; (f-2) Lower limit of coverages; (g-1) Comparison of the upper limit, lower limit, and average value of all coverages; (g-2) Coverage area and R2.
Processes 12 02734 g005
Figure 6. Particle size distribution of slags with different compositions.
Processes 12 02734 g006
Figure 7. Volume (y) and particle size (x) of the Zone II peak.
Processes 12 02734 g007
Figure 8. Particle size distribution and year-on-year growth rate of the different dust types. (a) Cumulative particle size distribution; (b) average particle size; (c) specific surface area.
Processes 12 02734 g008
Figure 9. Fractal dimension and year-on-year growth rate of different dust types (a) 10 K, NO; (b) 10 K, Detail; (c) 30 K, NO; (d) 30 K, Detail.
Processes 12 02734 g009
Figure 10. Comparison of key microscopic images. (a) 10 K, 1#; (b) 30 K, 1#; (c) 10 K, 2#; (d) 30 K, 2#; (e) 10 K, 3#; (f) 30 K, 3#; (g) 10 K, 4#; (h) 30 K, 4#; (i) 10 K, 7#; (j) 30 K, 7#.
Processes 12 02734 g010
Figure 11. Fractal dimension distribution area and year-on-year growth rate. (a) 10 K, NO; (b) 10 K, Detail; (c) 30 K, NO; (d) 30 K, Detail.
Processes 12 02734 g011
Table 1. Compositions of dust samples used in this study.
NO.Dust Composition (%, ω)Slag Composition (%, ω)
ZnOPbOPbOZnOFeOtCaOSiO2
#19.60790.3932.691344.9711.2428.10
#24.88495.116101142.1310.5326.33
#33.89896.102201037.339.3323.33
#41.45798.54340628.4211.3714.21
#51.36898.63240627.0010.1316.88
#61.31398.68740630.386.7516.88
#71.09598.90540625.4112.7115.88
#80.79799.20240628.807.2018.00
#90.71999.28140628.599.5315.88
#100.55299.44840631.766.3515.88
Disclaimer/Publisher’s Note: The statements, opinions and data contained in all publications are solely those of the individual author(s) and contributor(s) and not of MDPI and/or the editor(s). MDPI and/or the editor(s) disclaim responsibility for any injury to people or property resulting from any ideas, methods, instructions or products referred to in the content.

