Article

Simulation of Shale Gas Reservoir Production Considering the Effects of the Adsorbed Water Layer and Flow Differences

1
State Key Laboratory of Oil and Gas Reservoir Geology and Exploitation, Southwest Petroleum University, Chengdu 610500, China
2
School of Sciences, Southwest Petroleum University, Chengdu 610500, China
3
Chengdu North Petroleum Exploration and Development Technology Co., Ltd., Chengdu 610051, China
*
Authors to whom correspondence should be addressed.
Processes 2024, 12(12), 2693; https://doi.org/10.3390/pr12122693
Submission received: 27 September 2024 / Revised: 7 November 2024 / Accepted: 13 November 2024 / Published: 29 November 2024
(This article belongs to the Section Chemical Processes and Systems)

Abstract

Accurately describing the behavior of a gas-water two-phase flow in shale gas reservoirs is crucial for analyzing production dynamics in the field. Current research generally lacks consideration of the differences in physical properties and adsorption characteristics between the oleophilic organic matrix and the hydrophilic inorganic matrix. This study considers the organic matrix system as a single-phase gas flow, while the inorganic matrix and fracture systems involve a gas-water two-phase flow. Taking into account the impact of the adsorbed water layer on permeability at the surface of nanoscale pores in an inorganic matrix, the model comprehensively incorporates multiple mechanisms such as adsorption-desorption, the slippage effect, and Knudsen diffusion in the organic matrix and clay minerals. A multiscale gas-water two-phase comprehensive flow model for shale gas reservoirs has been established, and the results of the numerical model were validated against commercial software and actual field data. Simulation results over 1000 days indicate that early production from gas wells is primarily supplied by fractures, whereas free gas or desorbed gas from inorganic and organic matrices gradually contributes to the flow during the middle and later stages of production. As the Langmuir pressure and volume in the organic matrix and clay minerals increase, so does the corresponding gas production. The adsorbed water layer on the surface of inorganic nanopores reduces permeability, leading to a decrease in single-well cumulative gas production by 8.41%. The impact of the adsorbed water layer on gas production cannot be overlooked. The simulation method proposed in this study provides theoretical support for analyzing the gas-water two-phase flow behavior in shale gas reservoirs.

1. Introduction

Shale gas is not only a clean unconventional natural gas resource but also a strategically important asset for oil and gas exploration and development worldwide [1]. Shale gas reservoirs are characterized by multiscale porous media, which include nanopores, micropores, and microfractures [2]. Additionally, shale gas reservoirs also exhibit multiscale flow characteristics, encompassing processes such as desorption, diffusion, slippage, and seepage [3]. In shale formation, organic matter typically coexists with clay minerals [4]. The organic matter contains numerous nanopores with adsorption properties, while the inorganic matter not only contains hydrophilic nanopores but also possesses methane adsorption due to the unique crystalline structures of clay minerals [5]. A small portion of existing research roughly assumes that flow in the entire matrix is predominantly single-phase gas due to the low permeability of the matrix [6,7]. However, besides developing numerous nanopores, the clay and brittle minerals in the matrix also contain some micrometer-scale microfractures. When the formation undergoes gas-water two-phase flow, water tends to enter the hydrophilic inorganic matter and adsorb on the surface of clay minerals. Typically, water does not flow into the more oleophilic organic matter [8,9,10,11].
There is a paucity of studies about how the water phase in a shale inorganic matrix impacts its permeability. Research by Passey et al. [12] highlighted that the thickness of the adsorbed water layer on the nanopore wall in a shale inorganic matrix is comparable to the pore size itself. Shi et al. [13] observed that the effect of the adsorbed water layer on the permeability of the inorganic matrix varies with the level of water saturation. Li et al. [14] indicated the presence of an adsorbed water layer on the surface of clay minerals in shale, with the layer thickness predominantly determined by relative humidity and pore size. Jin and Firoozabadi [15] demonstrated through grand canonical Monte Carlo (GCMC) simulations that an adsorbed water layer forms on the surface of clay minerals, constricting the space available for gas flow. A molecular dynamics (MD) study by Liu et al. [16] revealed that the adsorption energy of water molecules on the surface of clay minerals surpasses that of methane molecules, resulting in a noticeable aggregation of water molecules in an adsorbed layer. Current research uniformly acknowledges the existence of an adsorbed water layer on the surface of inorganic clay minerals in shale, yet the specific effects on gas production remain unexplored. Moreover, precisely describing the multiscale porous structure and flow characteristics in shale gas reservoirs remains a significant challenge.
Shale gas wells undergo extensive multistage hydraulic fracturing to enhance production, involving substantial volumes of fracturing fluid injected into the reservoir. This results in the entire production lifecycle of shale gas wells being accompanied by the flowback of fracturing fluids. After fracturing, the reservoir exhibits hydraulic fracturing and gas-water two-phase flow [17], which complicates the accurate description of multiscale effects and dynamic changes in gas-water flow behavior in shale gas reservoirs. The flow model of shale gas reservoirs is key to describing the dynamic analysis of gas well production under multiscale effects, and many scholars have proposed different models for shale gas reservoir flow. For instance, some scholars have introduced matrix-fracture dual-porosity models for gas-water two-phase flow [18,19,20,21]. These models often consider the multiscale flow characteristics of shale gas reservoirs and use source function methods to obtain semi-analytical solutions or numerical methods like finite difference to achieve numerical solutions. However, they are not sufficient to precisely describe the multiscale porous media characteristics of shale formation. Additionally, fewer scholars have proposed gas-water two-phase triple-porosity models with comparative analyses presented in Table 1. It is evident that current research on gas-water two-phase flow in shale gas reservoirs is predominantly based on matrix-fracture dual-porosity models. Some scholars have further developed triple-porosity flow models based on the traditional dual-porosity models. These models provide a theoretical foundation for predicting the production dynamics of shale gas reservoirs. However, current research lacks a clear understanding of the gas-water two-phase flow mechanisms in the matrix, and the dynamic pressure characteristics of the organic matrix, inorganic matrix, and fractures during production are not sufficiently studied. It is necessary to consider the flow characteristics of organic and inorganic matrices separately in gas-water two-phase flow models. This is crucial for a more detailed description of the gas-water two-phase flow behavior under the multiscale porous media of shale gas reservoirs.
This study develops a comprehensive gas-water two-phase flow model for shale gas reservoirs. It includes independent physical systems for the organic matrix, inorganic matrix, and fractures. This model not only integrates dissolved gas in the organic matrix as a gas source into the matrix system but also considers multiscale flow phenomena in organic nanopores. It considers viscous flow driven by pressure differences, adsorption-desorption processes, the slippage effect, and Knudsen diffusion mechanisms in the organic matrix and clay minerals. Finally, we apply the model to multistage fractured horizontal wells in shale gas reservoirs and analyze the dynamic pressure changes, gas well production capacity, and the impact factors of the model. This has significant implications for the accurate simulation and prediction of production dynamics in shale gas wells.

2. Theory and Methods

2.1. Conceptual Model

A scanning electron microscope was utilized to observe the distribution of organic and inorganic matrices in the shale matrix, as depicted in Figure 1 [31,32,33]. Figure 1a reveals that the organic matrix is encircled by inorganic matters such as clay minerals, calcite, and pyrite [31]. In Figure 1b, “OM” signifies organic matrix, while “Cal-Clay” denotes a mixture of clay minerals and calcite [31]. Figure 1c illustrates the symbiotic coexistence of the organic matrix with clay minerals, quartz, and feldspar [32]. Figure 1d highlights the physical structural differences between organic and inorganic matrices [33]. It can be observed that a large number of organic pores develop in the shale organic matter, which coexists with clay minerals. The organic matter is either adsorbed on the surface of clay minerals or bound in an adhered state with them. Additionally, a small portion of the organic matter is associated with pyrite and calcite.
This study analyzes the coexistence of the organic matrix with clay minerals, pyrite, and calcite in the microscopic pore structures of shale. It models the organic matter as spherical aggregates based on the De Swaan spherical model [34]. A physical model is proposed where the organic matrix forms spherical aggregates symbiotically with the inorganic matrix. To enhance the mathematical description of distinct adsorption, desorption, and seepage behaviors of both organic and inorganic matters, the model also considers the impact of an adsorbed water layer on the permeability of inorganic nanopores. The shale organic matrix, inorganic matrix, and fractures are treated as three distinct systems. The physical model is shown in Figure 2, and the flow process is depicted in Figure 3. The model assumptions are as follows: (1) water is disregarded in the organic matter, with only single-phase gas flow considered; (2) the imbibition of fracturing fluid into the inorganic matter under capillary pressure is considered; (3) the fracture system exhibits gas-water two-phase flow; (4) capillary pressure is present only in the inorganic matrix and fracture systems, not in the organic matrix; (5) the effect of gravity is considered.

2.2. Mathematical Models

2.2.1. Permeability Correction Model

In the shale matrix, nanopore sizes typically range from a few nanometers to several hundred nanometers, resulting in the flow of shale gas no longer being linear Darcy flow. Therefore, it is necessary to correct permeability. Beskok et al. [35] developed a corrected permeability model that accounts for Knudsen diffusion and slip effect, applicable across the entire range of Knudsen numbers, including continuum flow, slip flow, transition flow, and free molecular flow. The corrected form of Darcy’s law can be expressed as [36,37]:
v g = k a μ g ( 1 + a K n ) 1 + 4 K n 1 b K n d p d x
The Knudsen number can be calculated using the following equation:
K n = K B T 2 π δ 2 p r n
The rarefaction coefficient can be calculated using the following equation [38]:
a = 128 15 π 2 tan 1 4 K n 0.4
Therefore, the apparent permeability of the shale matrix considering Knudsen diffusion and slip effect can be expressed as follows:
k = k a ξ ,
ξ = ( 1 + a K n ) 1 + 4 K n 1 b K n

2.2.2. Single-Phase Flow in Organic Matrix System

When the shale formation exhibits gas-water two-phase flow, water typically does not flow into the oleophilic organic matrix. Therefore, it is unnecessary to consider the impact of the adsorbed water layer on permeability in the organic matrix. Attention should be focused solely on Knudsen diffusion and slip effect. Additionally, as development progresses and formation pressure decreases to the desorption pressure of shale gas, the adsorbed gas on the surface of clay minerals or the organic matrix begins to desorb. This process is commonly represented by the Langmuir isotherm adsorption model. The gas-phase flow differential equation in the organic matrix system can be derived from the law of mass conservation as follows:
k o ξ o B g μ g p og ρ og g D q o c ,   g = t ϕ o s og B g + ρ bi V Lo p og p Lo + p og
The gas exchange term from the organic matrix to the inorganic matrix can be expressed as follows:
q o c ,   g   = α k o ξ o B g μ g p og p cg

2.2.3. Two-Phase Flow in Inorganic Matrix System

When shale reservoirs experience gas-water two-phase flow, water enters the inorganic matter under the influence of capillary pressure. Water also adsorbs onto the surface of inorganic nanopores. Therefore, it is necessary to consider the impact of the adsorbed water layer on the gas-water two-phase flow in inorganic matrix pores [12]. Based on the research by Shi et al. [13], corrections are made to the permeability of the inorganic matrix to account for the adsorbed water layer. The model of inorganic nanopores with the adsorbed water layer is shown in Figure 4.
The equation for the water saturation in the inorganic matrix with a pore diameter of D c is:
s w = π D c , 0 2 L / 4 π D c 2 L / 4 π D c , 0 2 L / 4 = 1 D c 2 D c , 0 2
Assuming β is the influence factor of the adsorbed water layer, Equation (8) can be further simplified to:
β = D c D c , 0 = 1 s w 0.5
By combining the permeability correction Equations (4) and (5) and considering the effect of the adsorbed water layer, Knudsen diffusion, and slippage, the equation for the corrected permeability in the inorganic matrix is as follows:
k = k c ξ c ,
ξ c = 1 + 128 15 π 2 tan 1 4 ( K n β 1 ) 0.4 K n β 1 1 + 4 K n β 1 1 b K n β 1
The differential flow equation for the gas phase in the inorganic matrix system can be expressed as:
k c ξ c k crg B g μ g p cg ρ cg g D q c - mf ,   g + q o c ,   g   = t ϕ c s cg B g + ρ bi V Lc p cg p Lc + p cg
The gas exchange term from the inorganic matrix to microfractures can be expressed as:
q c - mf ,   g = α k c ξ c k crg B g μ g p cg p mfg
According to the law of mass conservation, the differential equation for the water-phase flow in the inorganic system can be derived as follows:
k c k crw B w μ w p cw ρ cw g D q c mf ,   w = t ϕ c s cw B w
The water exchange term from the inorganic matrix to microfractures can be expressed as:
q c mf ,   w = α k c k crw B w μ w p cw p mfw
The saturation of the gas phase and the water phase in the inorganic matrix satisfy the following equation:
s cg + s cw = 1
Capillary pressure exists in the inorganic matrix, and it satisfies the following equation:
p cc s cw = p cg p cw

2.2.4. Two-Phase Flow in Fracture System

The shale gas reservoir exhibits gas-water two-phase flow after hydraulic fracturing, with the fracture system serving as the primary conduit for this flow. Additionally, with continuous development of the reservoir, the decrease in formation pressure leads to the gradual closure of fractures, which reduces porosity and permeability. The stress sensitivity of porosity and permeability in microfractures can be respectively represented as follows [39,40]:
ϕ s , mf = ϕ mf 0 exp C ( p mf 0 p mf ) ,
k s , mf = k mf 0 exp 2 C ( p mf 0 p mf )
The equation for gas-phase flow in microfractures is as follows:
k s , mf k mfrg B g μ g p mfg ρ mfg g D q mf hf ,   g + q c mf ,   g = t ϕ s , mf s mfg B g
The gas exchange term from microfractures to hydraulic fractures can be expressed as:
q mf hf ,   g = α k s , mf k mfrg B g μ g p mfg p hfg
The equation for water-phase flow in microfractures is as follows:
k s , mf k mfrw B w μ w p mfw ρ mfw g D q mf hf ,   w + q c mf ,   w = t ϕ s , mf s mfw B w
The water exchange term from microfractures to hydraulic fractures can be expressed as:
q mf hf ,   w = α k s , mf k mfrw B w μ w p mfw p hfw
The saturation of the gas phase and the water phase in microfractures satisfy the following equation:
s mfg + s mfw = 1
Capillary pressure exists in microfractures, satisfying the following equation:
p mfc s mfw = p mfg p mfw
After hydraulic fracturing of the shale gas well, the gas-water two-phase flow in the hydraulic fracture system must be considered. The differential equation for the gas-phase flow in hydraulic fractures can be derived as follows:
k s , hf k hfrg B g μ g p hfg ρ hfg g D q g + q mf hf ,   g = t ϕ s , hf s hfg B g
The differential equation for the water-phase flow in hydraulic fractures is:
k s , hf k hfrw B w μ w p hfw ρ hfw g D q w + q mf hf ,   w = t ϕ s , hf s hfw B w
The gas-phase saturation and water-phase saturation in hydraulic fractures satisfy the following equation:
s hfg + s hfw = 1
Capillary pressure exists in hydraulic fractures, satisfying the following equation:
p hfc s hfw = p hfg p hfw

2.3. Solution-Determining Conditions

2.3.1. Initial Conditions

The gas-water two-phase flow model of shale gas reservoirs developed in this study satisfies the following initial conditions:
p hfg ( x , y , z , 0 ) t = 0 = p hfg 0 ( x , y , z ) p mfg ( x , y , z , 0 ) t = 0 = p mfg 0 ( x , y , z ) p cg ( x , y , z , 0 ) t = 0 = p cg 0 ( x , y , z ) p og ( x , y , z , 0 ) t = 0 = p og 0 ( x , y , z ) s hfw ( x , y , z , 0 ) t = 0 = s hfw 0 ( x , y , z ) s mfw ( x , y , z , 0 ) t = 0 = s mfw 0 ( x , y , z ) s cw ( x , y , z , 0 ) t = 0 = s cw 0 ( x , y , z )

2.3.2. Boundary Conditions

The model in this study assumes a closed outer boundary, and the pressure at the outer boundary satisfies the following relationship:
p hfg n τ = 0 p mfg n τ = 0 p cg n τ = 0 p og n τ = 0
The model assumes a constant bottomhole flowing pressure at the inner boundary. According to the Peaceman model [41], the production can be expressed as:
q vg = 2 π h k hf k hfrg B g μ g ln r e / r w + S p hfg i , j , k p wf δ ( i , j , k )
q vw = 2 π h k hf k hfrw B w μ w ln r e / r w + S p hfw i , j , k p wf δ ( i , j , k )
For anisotropic formation, the shale permeability and the equivalent radius of the grid block can be expressed as:
k hf = k l k m ,
r e = 0.28 k l / k m 1 / 2 Δ m 2 + k m / k l 1 / 2 Δ l 2 1 / 2 k l / k m 1 / 4 + k m / k l 1 / 4 ,
where the coordinate transformation related to permeability is referenced in Table 2.

2.4. Mathematical Transformation and Production Method for the Well

2.4.1. Mathematical Transformation for the Well

If a well exists in a grid of shale formation, it is typically treated as a point source or sink in mathematical models. According to numerical simulation theory, the production from a well in formation grids can be expressed as:
q l = 2 π h k hf k hfr l B l μ l 1 ln r e / r w + S p hfl i , j , k p wf
The productivity index of the well can be defined as:
P I D = 2 π h k hf ln r e / r w + S

2.4.2. Constant Bottomhole Flowing Pressure
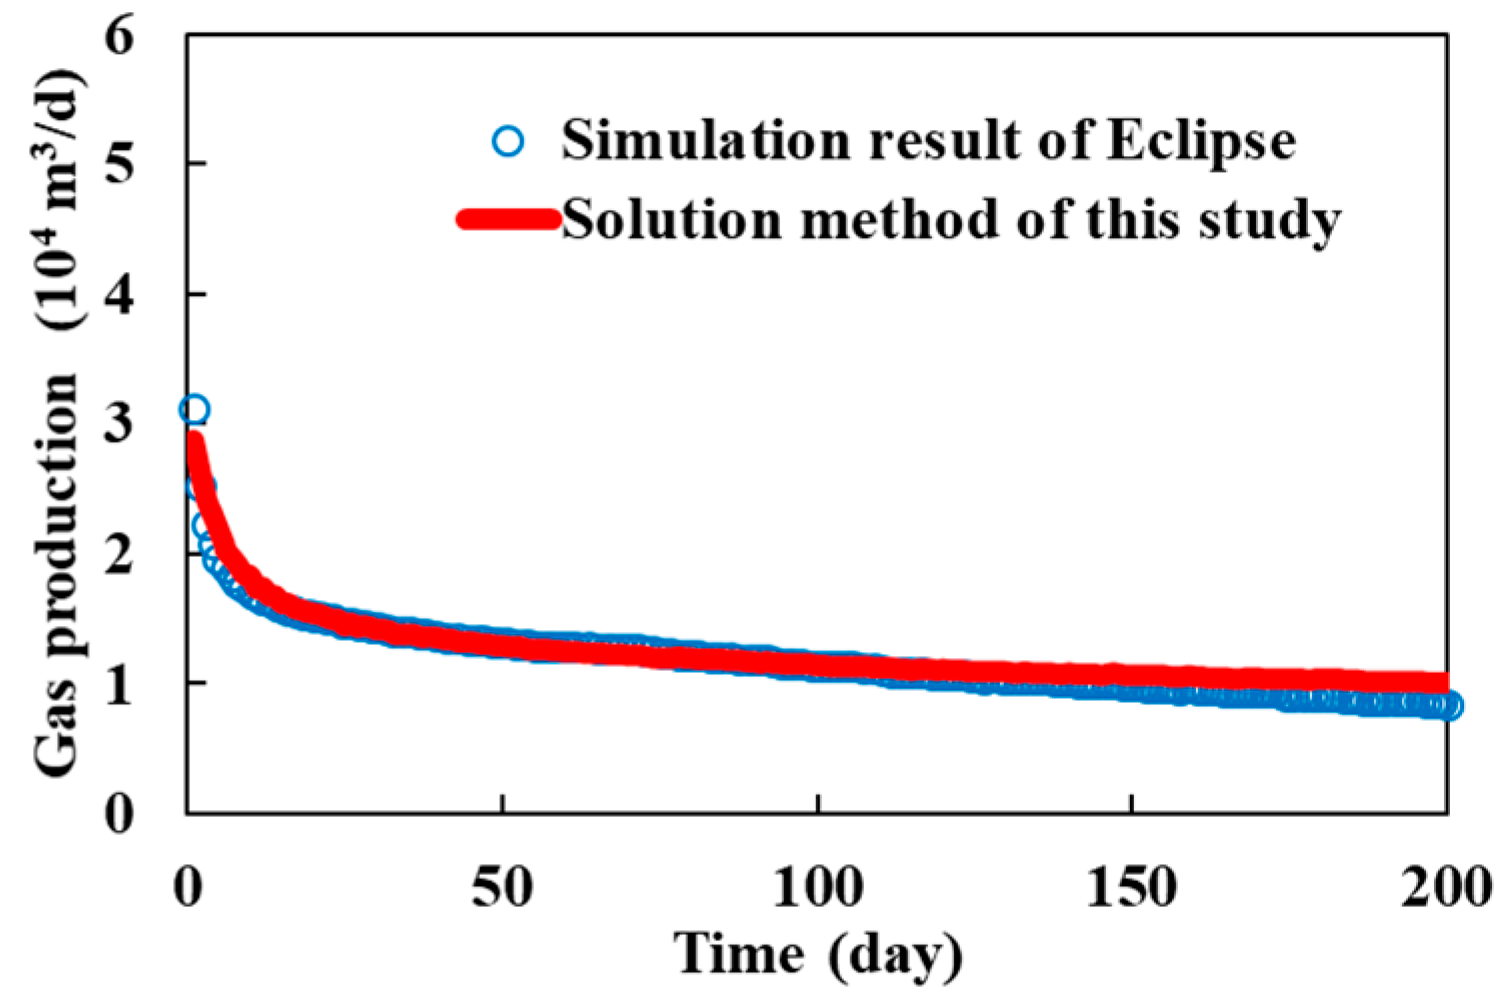
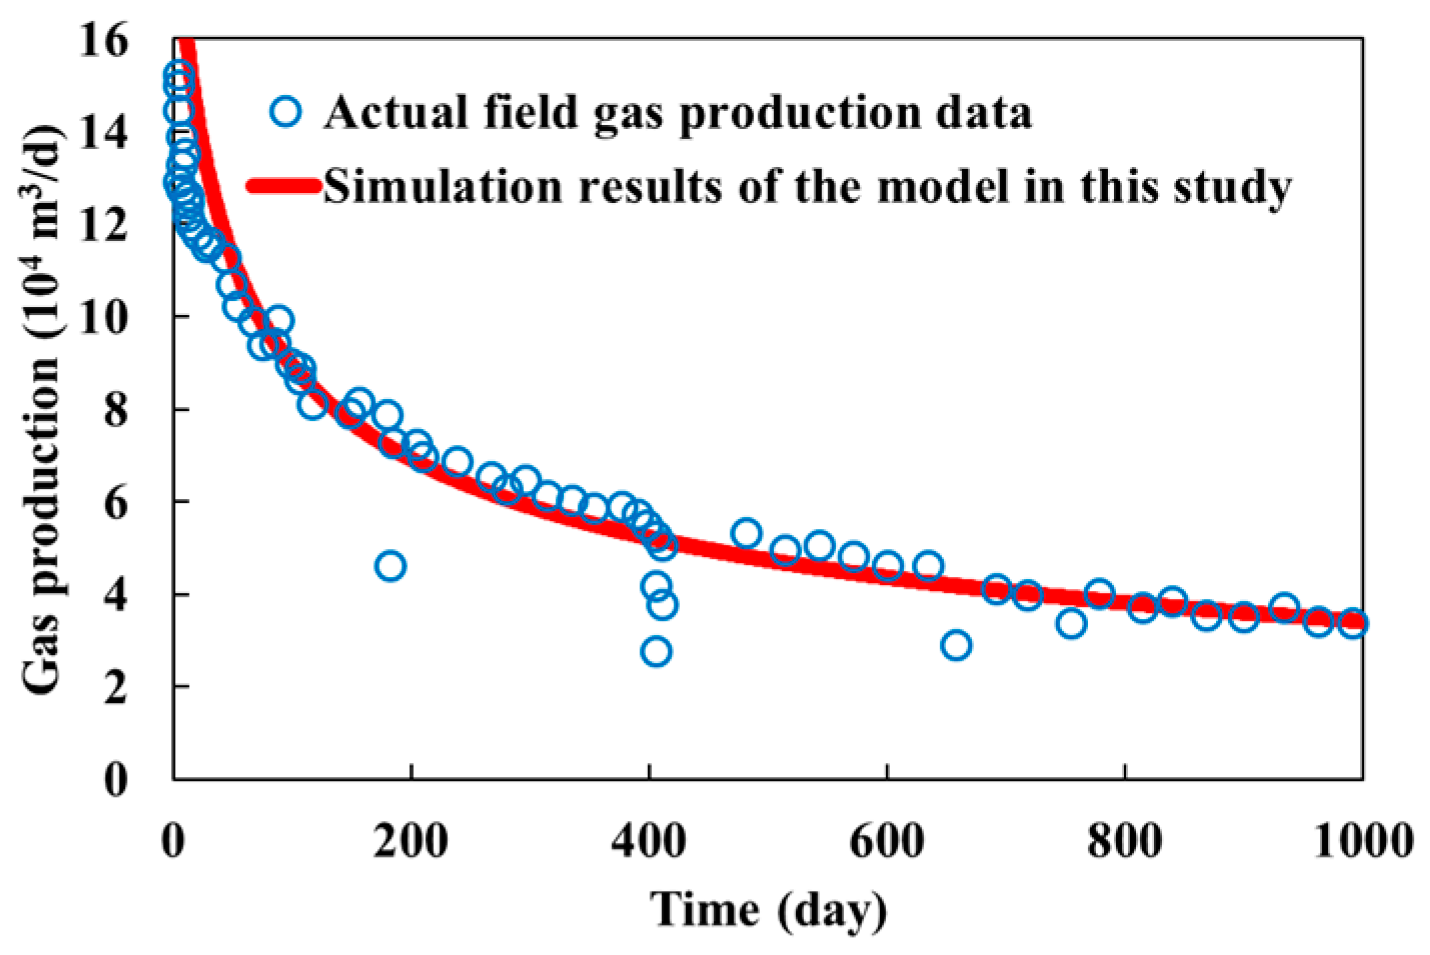
When the well produces at a constant bottomhole flowing pressure, the gas production from the kth completed section can be expressed as:
Q g k = P I D λ g B g k n p n p wf k
The water production from the kth completed section is:
Q w k = P I D λ w B w k n p n p wf k

3. Model Validation

Capillary pressure is required in numerical simulation calculations. For the capillary pressure present in the inorganic matrix and microfractures, this study uses the model proposed by Brooks et al. [42] for calculation:
s ew = p e p c λ
The normalized water saturation can be expressed as:
s ew = s w s wc 1 s wc
Relative permeability curves are also needed in numerical simulation calculations. This study uses the method proposed by Li et al. [43] to calculate the relative permeability of the matrix and microfractures. The relative permeability of the water phase can be calculated by the following equation:
k rw = s w s wc 1 s wc 2 s w s wc 1 s wc 2 + λ λ
Similarly, the relative permeability of the gas phase can be calculated by:
k rg = s g 1 s wc 2 2 μ g s w s wc + μ w s g μ w 1 s w s wc 1 s wc 2 + λ λ
The relative permeability curves for microfractures and matrices during gas-water two-phase flow in shale gas reservoirs were obtained through calculation, as depicted in Figure 5. However, due to the high conductivity of hydraulic fractures, multiphase flows do not significantly affect each other’s flow, and there is an approximate linear relationship between relative permeability and saturation [44].
The simplified flowchart of the solver simulator developed in this study is shown in Figure 6. In order to validate the accuracy of the numerical solution method for the model in this study, we compared our model with the commercial software (Eclipse 2018.1). Since the commercial software lacks a module for dividing shale gas formation into organic matrix, inorganic matrix, and fractures, we used a simplified validation method. Based on the parameter settings simulated for single-well production by Huang et al. [23], detailed parameter settings are shown in Table 3. By setting the same parameters in both the simplified numerical model and the Eclipse software for simulating production, the comparison results are depicted in Figure 7. By comparing the simulated production from the model in this study with that of the Eclipse software, the average absolute deviation is 4.8%. This demonstrates that the numerical solution method of the model in this study is accurate and reliable.
The use of multistage fracturing technology has been successful in developing shale gas reservoirs, significantly increasing the production of shale gas wells. To further validate that the model developed in this study is suitable for the production process of multistage fractured horizontal wells in shale gas reservoirs, we simulated the gas production for 1000 days after fracturing. We based this simulation on field production data and related simulation parameters reported by Grieser et al. [45]. The comparison of simulation results with field data appears in Figure 8. The daily gas production calculated by the model established in this study shows a high degree of consistency with the field data. This consistency confirms the correctness and effectiveness of the model in this study.

4. Results and Discussion

In order to simulate production dynamics and perform parameter sensitivity analysis, a simulation model was constructed with dimensions of 600 m in length, 220 m in width, and 30 m in height. Since the porosity and permeability data of organic and inorganic matrices in actual shale gas reservoirs cannot be distinguished and obtained separately, the parameters for the numerical simulation in this study were based on actual shale gas formation parameters and relevant literature [46,47,48]. The detailed parameter settings are shown in Table 4.

4.1. Analysis of Dynamic Pressure

Reservoir pressure is a crucial parameter during the production of shale gas reservoirs, and it directly affects the output and production efficiency of shale gas wells. The model established in this study can calculate changes in the gas-phase pressure, as illustrated in Figure 9. By the 100th day of simulation, it was observed that fracture pressure decreased the fastest, followed by a slower decrease in inorganic matrix pressure, and the organic matrix pressure decreased the slowest. By the 500th day, the pressure drop had propagated to the grid boundary. The fracture pressure continued to decrease, and the inorganic matrix contributed to the energy supply, resulting in a pressure drop. The organic matrix pressure decreased at a slower rate compared to the inorganic matrix. By the 1000th day of production, the pressure drop had further propagated to the boundary. All grid fracture pressure continued to decrease, with a noticeable drop in the inorganic matrix pressure at the boundary, while the organic matrix pressure decreased slowly.
Simulation results from the 100th day to the 1000th day reveal that natural gas in the fracture system was developed first during the early stages of production. As the fracture system served as the main conduit for output, the overall production process experienced a rapid decrease in fracture pressure. As production continued, free gas in the inorganic matrix began to flow towards the fracture system, and adsorbed gas further desorbed to participate in the flow as free gas, leading to a more noticeable pressure decrease in the inorganic matrix in the middle and later stages. Additionally, a decrease in the organic matrix pressure was observed in the later stage, and it indicates that free and adsorbed gases in the organic matrix also participated in the flow. We can observe that the dynamic changes in pressure during the production process align with the actual development process of shale gas reservoirs. This further validates the reasonableness and accuracy of the model presented in this study.

4.2. Analysis of Langmuir Adsorption Constants

The simulation calculates the impact of Langmuir pressure and Langmuir volume of organic and inorganic matrices on gas production, as illustrated in Figure 10 and Figure 11. It is observed that an increase in the adsorption constant leads to higher gas production, and this confirms the contribution of adsorbed gas on the surface of organic matrix and clay minerals to the gas output.

4.3. Analysis of Hydraulic Fracturing Parameters

The effects of the number and length of hydraulic fractures on gas production are shown in Figure 12. The results indicate a positive correlation between gas production and both the number and length of hydraulic fractures. More and longer fractures enhance the reservoir’s gas production. Therefore, the number and length of hydraulic fractures greatly influence production, and optimal fracturing parameters should be designed based on the actual conditions of the shale gas reservoir.

4.4. Analysis of Adsorbed Water Layer

The adsorbed water layer on the surface of inorganic nanopores decreases the diameter of pore throats and affects permeability. The influence of the adsorbed water layer on the inorganic nanopore surface on gas production in shale gas reservoirs is illustrated in Figure 13. After 1000 days of production, the cumulative gas production per well considering the adsorbed water layer effect is 930.63 × 10⁴ m3, whereas the cumulative gas production is 1008.88 × 104 m3, which excludes the adsorbed water layer. The adsorbed water layer reduces the cumulative gas production of a single well by 78.25 × 10⁴ m3, which is equivalent to a reduction rate of 8.41%. This decrease is due to the reduction in the pore throat diameter and permeability caused by the adsorbed water layer, which significantly impacts gas output.

5. Conclusions

This study develops a gas-water two-phase comprehensive flow model for shale gas reservoirs and validates the model with actual production parameters from shale gas wells. Through validation with commercial software and field production data, the mathematical model and its numerical solution method established in this paper have been proven to be accurate and reliable. Simulating production for 1000 days leads to the following conclusions:
(1) Analysis of dynamic pressure changes reveals that as production progresses, the fastest decrease in reservoir pressure occurs in the fractures, followed by the inorganic matrix, and then the organic matrix. Early in production, gas output is primarily from the fractures. As production continues, the pressure drop gradually spreads to the boundary, and gas from the inorganic and organic matrices contributes to the flow.
(2) Results of the model’s influential factor analysis indicate that increasing the Langmuir pressure and Langmuir volume for organic and inorganic matrices assists in enhancing gas well production. This is because higher Langmuir constants enhance the storage capacity of the shale matrix, thereby increasing gas output during production. As the number and length of hydraulic fractures increase, the gas well production increases.
(3) The adsorbed water layer decreases the diameter of pore throats in the inorganic matrix, thereby reducing its permeability and leading to a reduction in the gas production of a single well by 78.25 × 10⁴ m3. Although this work considers the impact of the adsorbed water layer on permeability, future work should further analyze the effect of shale hydration on production.

Author Contributions

Conceptualization, J.L.; Methodology, H.Y., J.L. and Q.D.; Software, W.H.; Validation, Q.D. and Z.L.; Formal analysis, Y.W.; Data curation, L.J.; Writing—original draft, H.Y. All authors have read and agreed to the published version of the manuscript.

Funding

This research did not receive any specific grant from funding agencies in the public, commercial, or not-for-profit sectors.

Data Availability Statement

Data are available on reasonable request from the corresponding author.

Acknowledgments

We greatly appreciate the technical support from all members at the Gas Reservoir Engineering Laboratory in Southwest Petroleum University.

Conflicts of Interest

Author Lu Jiang was employed by the company Chengdu North Petroleum Exploration and Development Technology Co., Ltd. The remaining authors declare that the research was conducted in the absence of any commercial or financial relationships that could be construed as a potential conflict of interest. The company had no role in the design of the study; in the collection, analyses, or interpretation of data; in the writing of the manuscript, or in the decision to publish the results.

Nomenclature

ararefaction coefficient, dimensionless
bslip factor, dimensionless
B g gas volume factor, dimensionless
B w water volume factor, dimensionless
C stress sensitivity coefficient (compressibility coefficient), MPa−1
D vertical depth of the fluid, m
D c , 0 initial pore diameter, m
D c effective pore diameter, m
ggravitational acceleration, 9.8 m/s2
h thickness of the grid block, m
i , j , k are coordinates of the grid block, dimensionless
k a absolute permeability, m2
K B Boltzmann constant, J·K−1
k c absolute permeability of inorganic matrix, m2
k crg relative permeability of gas in inorganic matrix, dimensionless
k crw relative permeability of water in inorganic matrix, dimensionless
k hfrg relative permeability of gas in hydraulic fractures, dimensionless
k hfrw relative permeability of water in hydraulic fractures, dimensionless
k hfr l relative permeability of l phase (either gas or water) in the fracture system
k mfrg relative permeability of gas in microfractures, dimensionless
k mfrw relative permeability of water in microfractures, dimensionless
k mf 0 initial permeability of microfractures, m2
K n Knudsen number, dimensionless
k o absolute permeability of organic matrix, m2
k s , mf permeability of microfractures considering stress sensitivity, m2
k s , hf permeability of hydraulic fractures considering stress sensitivity, m2
L length of a single inorganic nanochannel, m
nnormal vector, dimensionless
p c capillary pressure, MPa
p cc capillary pressure in inorganic matrix, MPa
p cg pressure of gas in inorganic matrix, MPa
p cw pressure of water in inorganic matrix, MPa
p cg 0 initial gas pressure in inorganic matrix, MPa
p e displacement pressure, MPa
p hfc capillary pressure in hydraulic fractures, MPa
p hfg pressure of gas in hydraulic fractures, MPa
p hfw pressure of water in hydraulic fractures, MPa
p hfg 0 initial gas pressure in hydraulic fractures, MPa
p Lo Langmuir pressure of organic matrix, MPa
p Lc Langmuir pressure of inorganic matrix, MPa
p mfc capillary pressure in microfractures, MPa
p mfg pressure of gas in microfractures, MPa
p mfw pressure of water in microfractures, MPa
p mfg 0 initial gas pressure in microfractures, MPa
p mf 0 initial pressure in microfractures, MPa
p og gas pressure in organic matrix, MPa
p og 0 initial gas pressure in organic matrix, MPa
p wf bottomhole flowing pressure, MPa
q c - mf ,   g gas exchange term from inorganic matrix to microfractures, sm3/m3/s
q c mf ,   w water exchange term from inorganic matrix to microfractures, sm3/m3/s
q g volume of gas produced per unit volume of shale, sm3/m3/s
q mf hf ,   g gas exchange term from microfractures to hydraulic fractures, sm3/m3/s
q mf hf ,   w water exchange term from microfractures to hydraulic fractures, sm3/m3/s
q o c ,   g gas exchange term from organic matrix to inorganic matrix, sm3/m3/s
q w volume of water produced per unit volume of shale, sm3/m3/s
r e equivalent radius of the grid block at the well location, m
r n throat radius of the nanopores, m
r w radius of the wellbore, m
S skin factor, dimensionless
s cg saturation of gas in inorganic matrix, dimensionless
s cw saturation of water in inorganic matrix, dimensionless
s cw 0 initial saturation of water in inorganic matrix, dimensionless
s ew normalized water saturation, dimensionless
s hfg saturation of gas in hydraulic fractures, dimensionless
s hfw saturation of water in hydraulic fractures, dimensionless
s hfw 0 initial saturation of water in hydraulic fractures, dimensionless
s mfg saturation of gas in microfractures, dimensionless
s mfw saturation of water in microfractures, dimensionless
s mfw 0 initial saturation of water in microfractures, dimensionless
s og gas saturation in organic matrix, dimensionless
s wc irreducible water saturation, dimensionless
V Lo Langmuir volume of organic matrix, m3/kg
V Lc Langmuir volume of inorganic matrix, m3/kg
Hamilton operator, dimensionless
α shape factor, 1/m2
ϕ c porosity of inorganic matrix, dimensionless
ϕ mf 0 initial porosity of microfractures, dimensionless
ϕ o porosity of organic matrix, dimensionless
ϕ s , hf porosity of hydraulic fractures considering stress sensitivity, dimensionless
ϕ s , mf porosity of microfractures considering stress sensitivity, dimensionless
λ distribution index of pore size, dimensionless
λ g half-transmissibility of gas, m2/Pa/s
λ w half-transmissibility of water, m2/Pa/s
μ g viscosity of gas, MPa·s
μ w viscosity of water, MPa·s
ρ bi density of shale rock, kg/m3
ρ cg density of gas in inorganic matrix, kg/m3
ρ cw density of water in inorganic matrix, kg/m3
ρ hfg density of gas in hydraulic fractures, kg/m3
ρ hfw density of water in hydraulic fractures, kg/m3
ρ mfg density of gas in microfractures, kg/m3
ρ mfw density of water in microfractures, kg/m3
ρ og density of gas in organic matrix, kg/m3
δ effective collision diameter of gas molecules, m
δ ( i , j , k ) Dirac function, dimensionless
ξ permeability correction factor, dimensionless
ξ c permeability correction factor of inorganic matrix, dimensionless
ξ o permeability correction factor of organic matrix, dimensionless

References

  1. Zou, C.; Yang, Z.; He, D.; Wei, Y.S.; Li, J.; Jia, A.; Chen, J.J.; Zhao, Q.; Li, Y.L.; Li, J.; et al. Theory, technology and prospects of conventional and unconventional natural gas. Petrol. Explor. Dev. 2018, 45, 604–618. [Google Scholar] [CrossRef]
  2. Garum, M.; Glover, P.W.; Lorinczi, P.; Micklethwaite, S.; Hassanpour, A. Integration of multiscale imaging of nanoscale pore microstructures in gas shales. Energy Fuels 2021, 35, 10721–10732. [Google Scholar] [CrossRef]
  3. Wang, H.; Chen, L.; Qu, Z.; Yin, Y.; Kang, Q.; Yu, B.; Tao, W.Q. Modeling of multiscale transport phenomena in shale gas production—A critical review. Appl. Energy 2020, 262, 114575. [Google Scholar] [CrossRef]
  4. Ma, Y.; Zhong, N.; Li, D.; Pan, Z.; Cheng, L.; Liu, K. Organic matrix/clay mineral intergranular pores in the Lower Cambrian Lujia Shale in the north–eastern part of the upper Yangtze area, China: A possible microscopic mechanism for gas preservation. Int. J. Coal Geol. 2015, 137, 38–54. [Google Scholar] [CrossRef]
  5. Sang, G.; Elsworth, D.; Miao, X.; Mao, X.; Wang, J. Numerical study of a stress dependent triple porosity model for shale gas reservoirs accommodating gas diffusion in kerogen. J. Nat. Gas Sci. Eng. 2016, 32, 423–438. [Google Scholar] [CrossRef]
  6. Hu, B.; Wang, J.G.; Zhang, K.; Ye, Z. A new triple–porosity multiscale fractal model for gas transport in fractured shale gas reservoirs. J. Nat. Gas Sci. Eng. 2020, 78, 103335. [Google Scholar] [CrossRef]
  7. Zeng, J.; Liu, J.; Li, W.; Leong, Y.K.; Elsworth, D.; Guo, J. Shale gas reservoir modeling and production evaluation considering complex gas transport mechanisms and dispersed distribution of kerogen. Petrol. Sci. 2021, 18, 195–218. [Google Scholar] [CrossRef]
  8. Javadpour, F. Nanopores and apparent permeability of gas flow in mudrocks (shales and siltstone). J. Can. Petrol. Technol. 2009, 48, 16–21. [Google Scholar] [CrossRef]
  9. Chalmers, G.R.L.; Bustin, R.M. Geological evaluation of Halfway-Doig-Montney hybrid gas shale-tight gas reservoir, northeastern British Columbia. Mar. Petrol. Geol. 2012, 38, 53–72. [Google Scholar] [CrossRef]
  10. Xiong, J.; Tang, J.; Zhou, X.; Liu, X.; Liang, L.; Hou, L. Molecular dynamics simulation and experimental studies of the wettability behaviors of shales. Energy Fuels 2022, 36, 3526–3538. [Google Scholar] [CrossRef]
  11. Yang, Y.; Song, H.; Imani, G.; Zhang, Q.; Liu, F.; Zhang, L.; Sun, H.; Zhong, J.; Zhang, K.; Yao, J. Adsorption behavior of shale oil and water in the kerogen–kaolinite pore by molecular simulations. J. Mol. Liq. 2024, 393, 123549. [Google Scholar] [CrossRef]
  12. Passey, Q.R.; Bohacs, K.M.; Esch, W.L.; Klimentidis, R.; Sinha, S. From oil–prone source rock to gas–producing shale reservoir–geologic and petrophysical characterization of unconventional shale–gas reservoirs. In Proceedings of the SPE International Oil and Gas Conference and Exhibition in China, Beijing, China, 8–10 June 2010; p. SPE-131350. [Google Scholar] [CrossRef]
  13. Shi, J.; Zhang, L.; Li, Y.; Yu, W.; He, X.; Liu, N.; Li, X.; Wang, T. Diffusion and flow mechanisms of shale gas through matrix pores and gas production forecasting. In Proceedings of the SPE Canada Unconventional Resources Conference, Calgary, AB, Canada, 5–7 November 2013; p. SPE-167226. [Google Scholar] [CrossRef]
  14. Li, J.; Li, X.; Wang, X.; Li, Y.; Wu, K.; Shi, J.; Liu, Y.; Dong, F.; Tao, Z.; Yu, P. Water distribution characteristic and effect on methane adsorption capacity in shale clay. Int. J. Coal Geol. 2016, 159, 135–154. [Google Scholar] [CrossRef]
  15. Jin, Z.; Firoozabadi, A. Effect of water on methane and carbon dioxide sorption in clay minerals by Monte Carlo simulations. Fluid Phase Equilibr. 2014, 382, 10–20. [Google Scholar] [CrossRef]
  16. Liu, J.; Wen, Y.; Jiang, L.; Yuan, H.; Liu, Z.; Shui, Z.; Wang, B.; Yan, X. Molecular dynamics simulation of micro mechanisms of gas and water migration and diffusion in shale reservoirs. Colloid Surf. A 2024, 682, 132865. [Google Scholar] [CrossRef]
  17. Jia, P.; Cheng, L.; Clarkson, C.R.; Williams-Kovacs, J.D. Flow behavior analysis of two–phase (gas/water) flowback and early–time production from hydraulically–fractured shale gas wells using a hybrid numerical/analytical model. Int. J. Coal Geol. 2017, 182, 14–31. [Google Scholar] [CrossRef]
  18. Olorode, O.M.; Freeman, C.M.; Moridis, G.J.; Blasingame, T.A. High–resolution numerical modeling of complex and irregular fracture patterns in shale gas reservoirs and tight gas reservoirs. SPE Reserv. Eval. Eng. 2013, 16, 443–455. [Google Scholar] [CrossRef]
  19. Moinfar, A.; Varavei, A.; Sepehrnoori, K.; Johns, R.T. Development of an efficient embedded discrete fracture model for 3D compositional reservoir simulation in fractured reservoirs. SPE J. 2014, 19, 289–303. [Google Scholar] [CrossRef]
  20. Yang, R.; Huang, Z.; Li, G.; Yu, W.; Sepehrnoori, K.; Lashgari, H.R.; Tian, S.; Song, X.; Sheng, M. A semianalytical approach to model two–phase flowback of shale–gas wells with complex–fracture–network geometries. SPE J. 2017, 22, 1808–1833. [Google Scholar] [CrossRef]
  21. Xu, Y.; Cavalcante Filho, J.S.; Yu, W.; Sepehrnoori, K. Discrete–fracture modeling of complex hydraulic–fracture geometries in reservoir simulators. SPE Reserv. Eval. Eng. 2017, 20, 403–422. [Google Scholar] [CrossRef]
  22. Clarkson, C.R.; Nobakht, M.; Kaviani, D.; Ertekin, T. Production analysis of tight–gas and shale–gas reservoirs using the dynamic–slippage concept. SPE J. 2012, 17, 230–242. [Google Scholar] [CrossRef]
  23. Huang, T.; Li, E.P.; Tao, Z.W.; Guo, X. A nonlinear seepage model of gas and water transport in multiscale shale gas reservoirs based on dynamic permeability. J. Geophys. Eng. 2018, 15, 1255–1268. [Google Scholar] [CrossRef]
  24. Li, L.; Sheng, G.L.; Su, Y.L. Water-gas two-phase flow behavior of multi-fractured horizontal wells in shale gas reservoirs. Processes 2019, 7, 664. [Google Scholar] [CrossRef]
  25. Cui, G.; Tan, Y.; Chen, T.; Feng, X.T.; Elsworth, D.; Pan, Z.; Wang, C. Multidomain two–phase flow model to study the impacts of hydraulic fracturing on shale gas production. Energy Fuels 2020, 34, 4273–4288. [Google Scholar] [CrossRef]
  26. Cheng, S.; Huang, P.; Wang, K.; Wu, K.; Chen, Z. Comprehensive modeling of multiple transport mechanisms in shale gas reservoir production. Fuel 2020, 277, 118159. [Google Scholar] [CrossRef]
  27. Xu, E.; Yu, L.; Fan, M.; Chen, T.; Pan, Z.; Tan, Y.; Cui, G. Two–phase flow model for numerical investigation of impact of water retention on shale gas production. Geofluids 2021, 2021, 2637217. [Google Scholar] [CrossRef]
  28. Hu, Y.; Liu, G.; Zhu, J.; Yang, Y.; Yu, L.; Gao, F. Multiscale and multiphase fractal model considering water reflux in shale gas extraction. J. Nat. Gas Sci. Eng. 2022, 101, 104501. [Google Scholar] [CrossRef]
  29. Wang, W.; Xie, Q.; Li, J.; Sheng, G.; Lun, Z. Fracturing fluid imbibition impact on gas-water two phase flow in shale fracture–matrix system. Nat. Gas Ind. 2023, 10, 323–332. [Google Scholar] [CrossRef]
  30. Wang, D.; Liu, H.; Yao, J.; Wang, W.; Hu, X.; Wang, Y. Macroscale gas-water two–phase transport simulation in shales considering nanomicroscale effects. Int. J. Energy Res. 2024, 2024, 7198722. [Google Scholar] [CrossRef]
  31. Mathia, E.J.; Bowen, L.; Thomas, K.M.; Aplin, A.C. Evolution of porosity and pore types in organic–rich, calcareous, Lower Toarcian Posidonia Shale. Mar. Petrol. Geol. 2016, 75, 117–139. [Google Scholar] [CrossRef]
  32. Gao, Z.; Liang, Z.; Hu, Q.; Jiang, Z.; Xuan, Q. A new and integrated imaging and compositional method to investigate the contributions of organic matrix and inorganic minerals to the pore spaces of lacustrine shale in China. Mar. Petrol. Geol. 2021, 127, 104962. [Google Scholar] [CrossRef]
  33. Lyu, F.; Ning, Z.; Wu, X.; Wang, Q.; Gu, K.; Cheng, Z.; Mu, Z. A comparative study of gas transport in dry and moisturized shale matrix considering organic matrix volume fraction and water distribution characteristics. J. Petrol. Sci. Eng. 2022, 208, 109483. [Google Scholar] [CrossRef]
  34. De Swaan, O.A. Analytic solutions for determining naturally fractured reservoir properties by well testing. SPE J. 1976, 16, 117–122. [Google Scholar] [CrossRef]
  35. Beskok, A.; Karniadakis, G.E.; Trimmer, W. Rarefaction and compressibility effects in gas microflows. J. Fluids Eng. 1996, 118, 448–456. [Google Scholar] [CrossRef]
  36. Civan, F. Effective correlation of apparent gas permeability in tight porous media. Transp. Porous Med. 2010, 82, 375–384. [Google Scholar] [CrossRef]
  37. Ziarani, A.S.; Aguilera, R. Knudsen’s permeability correction for tight porous media. Transp. Porous Med. 2012, 91, 239–260. [Google Scholar] [CrossRef]
  38. Beskok, A.; Karniadakis, G.E. Report: A model for flows in channels, pipes, and ducts at micro and nano scales. Nanosc. Microsc. Therm. 1999, 3, 43–77. [Google Scholar] [CrossRef]
  39. Cao, P.; Liu, J.; Leong, Y.K. General gas permeability model for porous media: Bridging the gaps between conventional and unconventional natural gas reservoirs. Energy Fuels 2016, 30, 5492–5505. [Google Scholar] [CrossRef]
  40. Pan, Z.; Connell, L.D. Modelling permeability for coal reservoirs: A review of analytical models and testing data. Int. J. Coal Geol. 2012, 92, 1–44. [Google Scholar] [CrossRef]
  41. Peaceman, D.W. Interpretation of well–block pressures in numerical reservoir simulation with nonsquare grid blocks and anisotropic permeability. SPE J. 1983, 23, 531–543. [Google Scholar] [CrossRef]
  42. Brooks, R.H.; Corey, A.T. Hydraulic properties of porous media and their relation to drainage design. T. ASABE 1964, 4, 26–28. [Google Scholar]
  43. Li, Y.; Li, X.; Teng, S.; Xu, D. Improved models to predict gas-water relative permeability in fractures and porous media. J. Nat. Gas Sci. Eng. 2014, 19, 190–201. [Google Scholar] [CrossRef]
  44. Fanchi, J.R. Principles of Applied Reservoir Simulation, 4th ed.; Gulf Professional: Houston, TX, USA, 2018; pp. 241–256. [Google Scholar]
  45. Grieser, B.; Shelley, B.; Soliman, M. Predicting production outcome from multi–stage, horizontal Barnett completions. In Proceedings of the SPE Oklahoma City Oil and Gas Symposium/Production and Operations Symposium, Oklahoma City, OK, USA, 4–8 April 2009; p. SPE-120271. [Google Scholar] [CrossRef]
  46. Al–Ahmadi, H.A.; Wattenbarger, R.A. Triple–porosity models: One further step towards capturing fractured reservoirs heterogeneity. In Proceedings of the SPE Kingdom of Saudi Arabia Annual Technical Symposium and Exhibition, Al-Khobar, Saudi Arabia, 15–18 May 2011; p. SPE-149054. [Google Scholar] [CrossRef]
  47. Yu, W.; Sepehrnoori, K. Simulation of gas desorption and geomechanics effects for unconventional gas reservoirs. In Proceedings of the SPE Western Regional Meeting, Monterey, CA, USA, 19–25 April 2013; p. SPE-165377. [Google Scholar] [CrossRef]
  48. Cao, P.; Liu, J.; Leong, Y.K. A multiscale–multiphase simulation model for the evaluation of shale gas recovery coupled the effect of water flowback. Fuel 2017, 199, 191–205. [Google Scholar] [CrossRef]
Figure 1. Scanning electron microscope images of organic and inorganic matter [31,32,33]. (a) The organic matrix is encircled by inorganic matters. (b) “OM” signifies organic matrix, while “Cal-Clay” de-notes a mixture of clay minerals and calcite. (c) The symbiotic coexistence of the organic matrix with clay minerals, quartz, and feldspar. (d) The physical structural differences between organic and inorganic matrices.
Processes 12 02693 g001
Figure 2. Physical model of gas-water flow in shale gas reservoirs.
Processes 12 02693 g002
Figure 3. Schematic of gas-water flow process.
Processes 12 02693 g003
Figure 4. Adsorbed water layer on the wall of inorganic matrix nanopores.
Processes 12 02693 g004
Figure 5. Relative permeability curves for microfractures and matrices.
Processes 12 02693 g005
Figure 6. Flowchart for numerical simulation calculation.
Processes 12 02693 g006
Figure 7. Comparison of model solutions between this study and Eclipse software.
Processes 12 02693 g007
Figure 8. Simulation results for the gas production.
Processes 12 02693 g008
Figure 9. Pressure changes during the simulation production process.
Processes 12 02693 g009
Figure 10. Influence of adsorption constants for the organic matrix on gas production. (a) The relationship curve between Langmuir pressure of organic matrix and gas production. (b) The relationship curve between Langmuir volume of organic matrix and gas production.
Processes 12 02693 g010
Figure 11. Influence of adsorption constants for the inorganic matrix on gas production. (a) The relationship curve between Langmuir pressure of inorganic matrix and gas production. (b) The relationship curve between Langmuir volume of inorganic matrix and gas production.
Processes 12 02693 g011
Figure 12. Influence of hydraulic fracturing parameter on gas production. (a) The relationship curve between number of fractures and gas production. (b) The relationship curve between length of fractures and gas production.
Processes 12 02693 g012
Figure 13. Influence of adsorbed water layer on gas production.
Processes 12 02693 g013
Table 1. Comparison of triple-porosity models for gas-water flow in shale gas reservoirs.
ResearcherThree MediaCharacteristics of Model
Clarkson et al. [22] (2012)Hydraulic fracture, inorganic matrix,
organic matrix.
The desorption, diffusion, and slippage effect are considered. The matrix system is roughly regarded as single-phase gas flow.
Huang et al. [23] (2018)Hydraulic fracture, natural fracture,
matrix.
Both the matrix system and the natural fracture system are treated as a single porous medium. It failed to capture the distinct physical properties of the organic versus inorganic matrix.
Li et al. [24] (2019)Hydraulic fracture, inorganic matrix,
organic matrix.
The reservoir is divided into the unstimulated reservoir volume (USRV) region and the effectively stimulated reservoir volume (ESRV) region, without considering the slippage effect. It focuses on analyzing the gas-water flow behavior in different regions.
Cui et al. [25] (2020)Natural fracture, inorganic matrix,
organic matrix.
The model describes two-phase flow in fractures and single-phase gas flow in the matrix. It does not consider the influence of the water phase on gas production in the inorganic matrix.
Cheng et al. [26] (2020)Fracture system (natural fracture and hydraulic fracture), inorganic matrix, organic matrix.This model takes into account desorption, diffusion, and the slippage effect. It does not differentiate between the gas-water flow characteristics in the organic and inorganic matrices.
Xu et al. [27] (2021)Hydraulic fracture, inorganic matrix,
organic matrix.
The inorganic matrix solely considers the slippage effect, while both desorption and diffusion processes are overlooked.
Hu et al. [28] (2022)Fracture system (natural fracture and hydraulic fracture), inorganic matrix, organic matrix.The fracture system involves gas-water two-phase flow, while only single-phase gas flow is considered in the inorganic matrix. Both organic and inorganic matrices have ignored the slippage effect.
Wang et al. [29] (2023)Hydraulic fracture, natural fracture, matrix.The matrix system did not differentiate both the physical properties and gas-water flow differences of organic and inorganic matrices.
Wang et al. [30] (2024)Hydraulic fracture, microfracture, matrix.
Table 2. Coordinate transformation table.
CoordinatesHorizontal WellVertical Well
Horizontal Section is Parallel to the X-AxisHorizontal Section is Parallel to the y-Axis
LYXX
MZZY
NXYZ
Table 3. Parameter settings for comparison validation [23].
ParameterValueParameterValue
x-direction dimension (dimensionless)10Initial pressure (MPa)28
y-direction dimension (dimensionless)10Formation temperature (K)373.15
z-direction dimension (dimensionless)3Porosity (dimensionless)0.1
x-direction grid step (m)40Gas compressibility factor (MPa−1)1.29 × 10⁻²
y-direction grid step (m)40Water compressibility factor (MPa−1)4.35 × 10⁻⁴
z-direction grid step (m)10Rock compressibility factor (MPa−1)1.0 × 10⁻⁴
x-direction permeability (m2)1 × 10⁻¹⁵Water density (kg/m3)1000
y-direction permeability (m2)1 × 10⁻¹⁵Gas specific gravity (dimensionless)0.648
z-direction permeability (m2)1 × 10⁻¹⁶Water viscosity (MPa·s)1 × 10⁻⁹
Gas saturation (dimensionless)0.5Wellbore radius (m)0.08
Reservoir depth (m)2180Bottomhole flowing pressure (MPa)16
Table 4. Numerical simulation parameters.
ParameterValueParameterValue
Reservoir grid size (dimensionless)60 × 22 × 3Water compressibility factor (MPa−1)4.5 × 10⁻⁴
Grid side length (m)10Inorganic matrix Langmuir volume (m3/kg)2 × 10−3
Organic matrix porosity (%)5Inorganic matrix Langmuir pressure (MPa)5
Organic matrix permeability (m2)1 × 10⁻²⁰Initial water saturation in inorganic matrix0.3
Inorganic matrix porosity (%)4Organic matrix Langmuir pressure (MPa)10
Inorganic matrix permeability (m2)1 × 10⁻¹⁹Organic matrix Langmuir volume (m3/kg)4 × 10−3
Microfracture porosity (%)2Organic matrix nanopore throat radius (m)2 × 10⁻⁹
Microfracture permeability (m2)7.5 × 10⁻¹⁷Inorganic matrix nanopore throat radius (m)1 × 10⁻⁹
Gas-phase critical pressure (MPa)4.6Initial water saturation in fractures (dimensionless)0.5
Gas-phase critical temperature (K)181Fracture compressibility factor (MPa−1)2 × 10⁻³
Slip factor (dimensionless)−1Hydraulic fracture porosity (%)1.6
Initial formation pressure (MPa)30Number of hydraulic fractures (dimensionless)4
Reservoir temperature (K)362.15Hydraulic fracture spacing (m)100
Shale rock density (kg/m3)2500Hydraulic fracture length (m)140
Rock compressibility factor (MPa−1)1.5 × 10⁻³Hydraulic fracture width (m)3 × 10⁻³
Fick diffusion coefficient (m2/s)5.86 × 10−8Hydraulic fracture permeability (m2)1.5 × 10⁻¹⁴
Wellbore radius (m)0.06Formation water density (kg/m3)1100
Reservoir depth (m)2500Formation water viscosity (MPa·s)1 × 10⁻⁹
Total days of simulation (day)1000Bottomhole flowing pressure (MPa)16
Disclaimer/Publisher’s Note: The statements, opinions and data contained in all publications are solely those of the individual author(s) and contributor(s) and not of MDPI and/or the editor(s). MDPI and/or the editor(s) disclaim responsibility for any injury to people or property resulting from any ideas, methods, instructions or products referred to in the content.

