


Food Functional Powders with Redox Capacity and Antioxidant Properties Obtained from Food Losses and Waste of Olive Oil Industry

 ,
,
Abstract

1. Introduction
2. Olive Pomace
3. Methodology
3.1. Food Powders
3.1.1. Freeze-Drying
3.1.2. Characterization
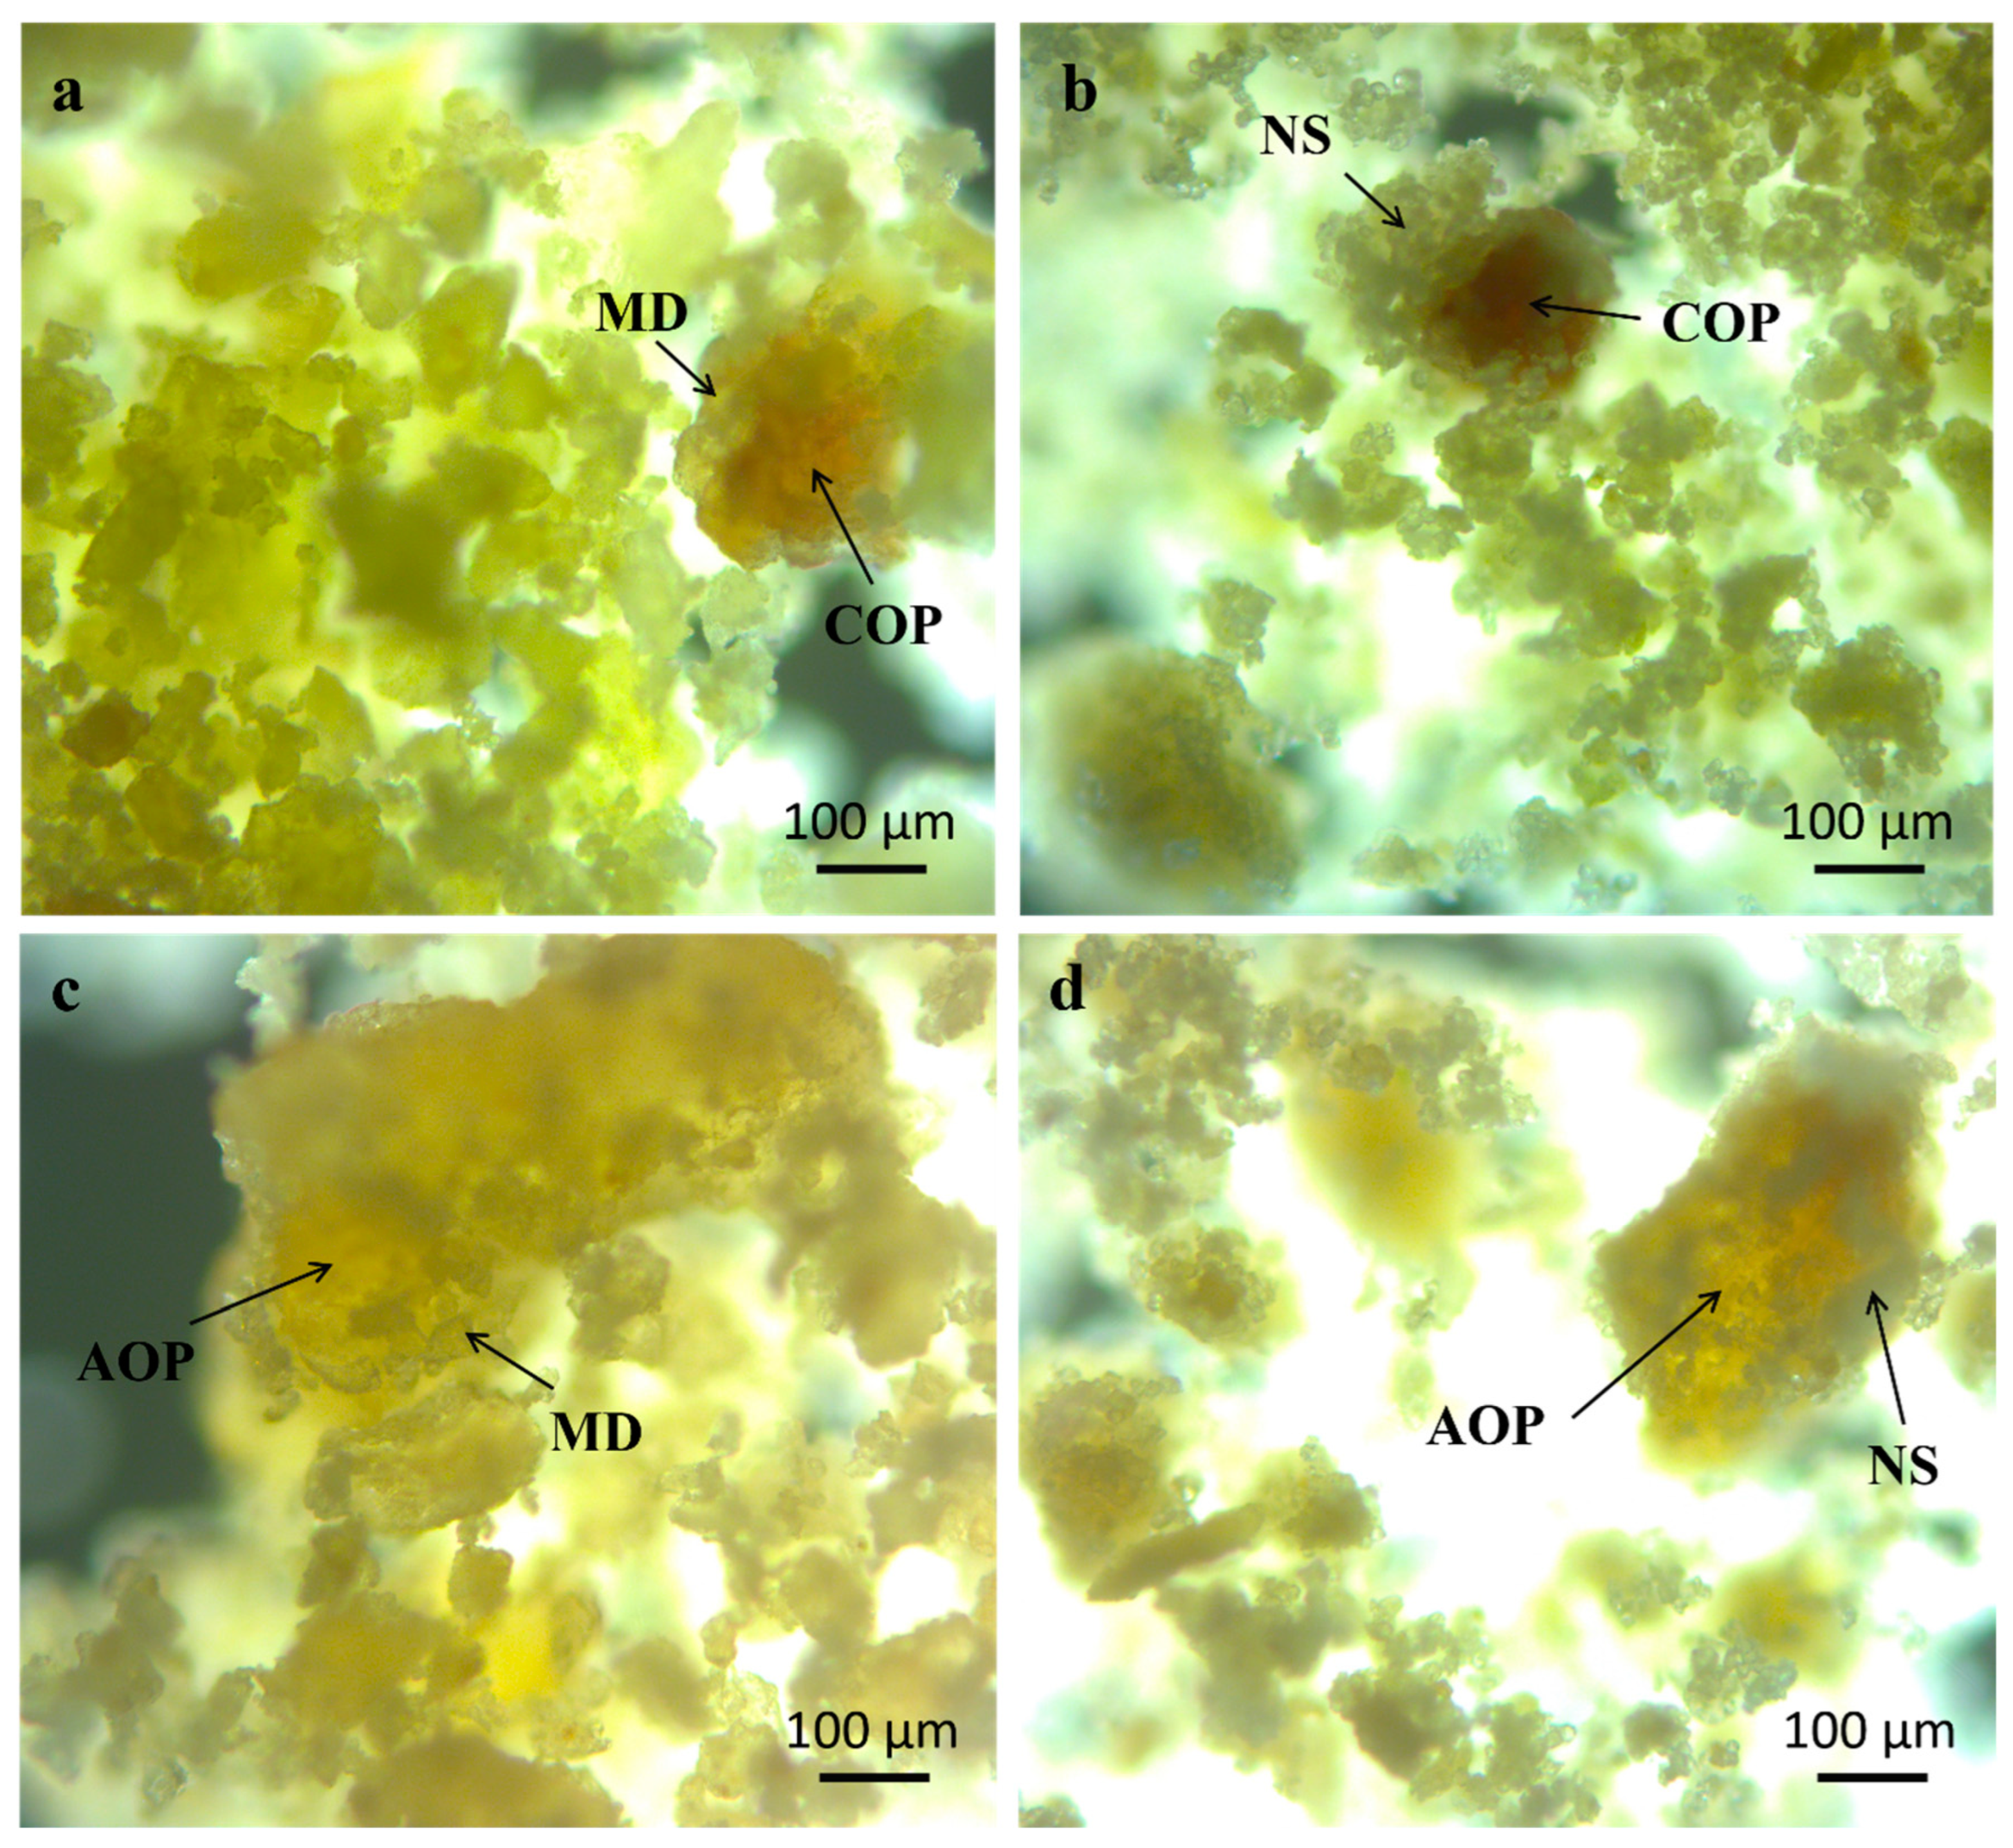
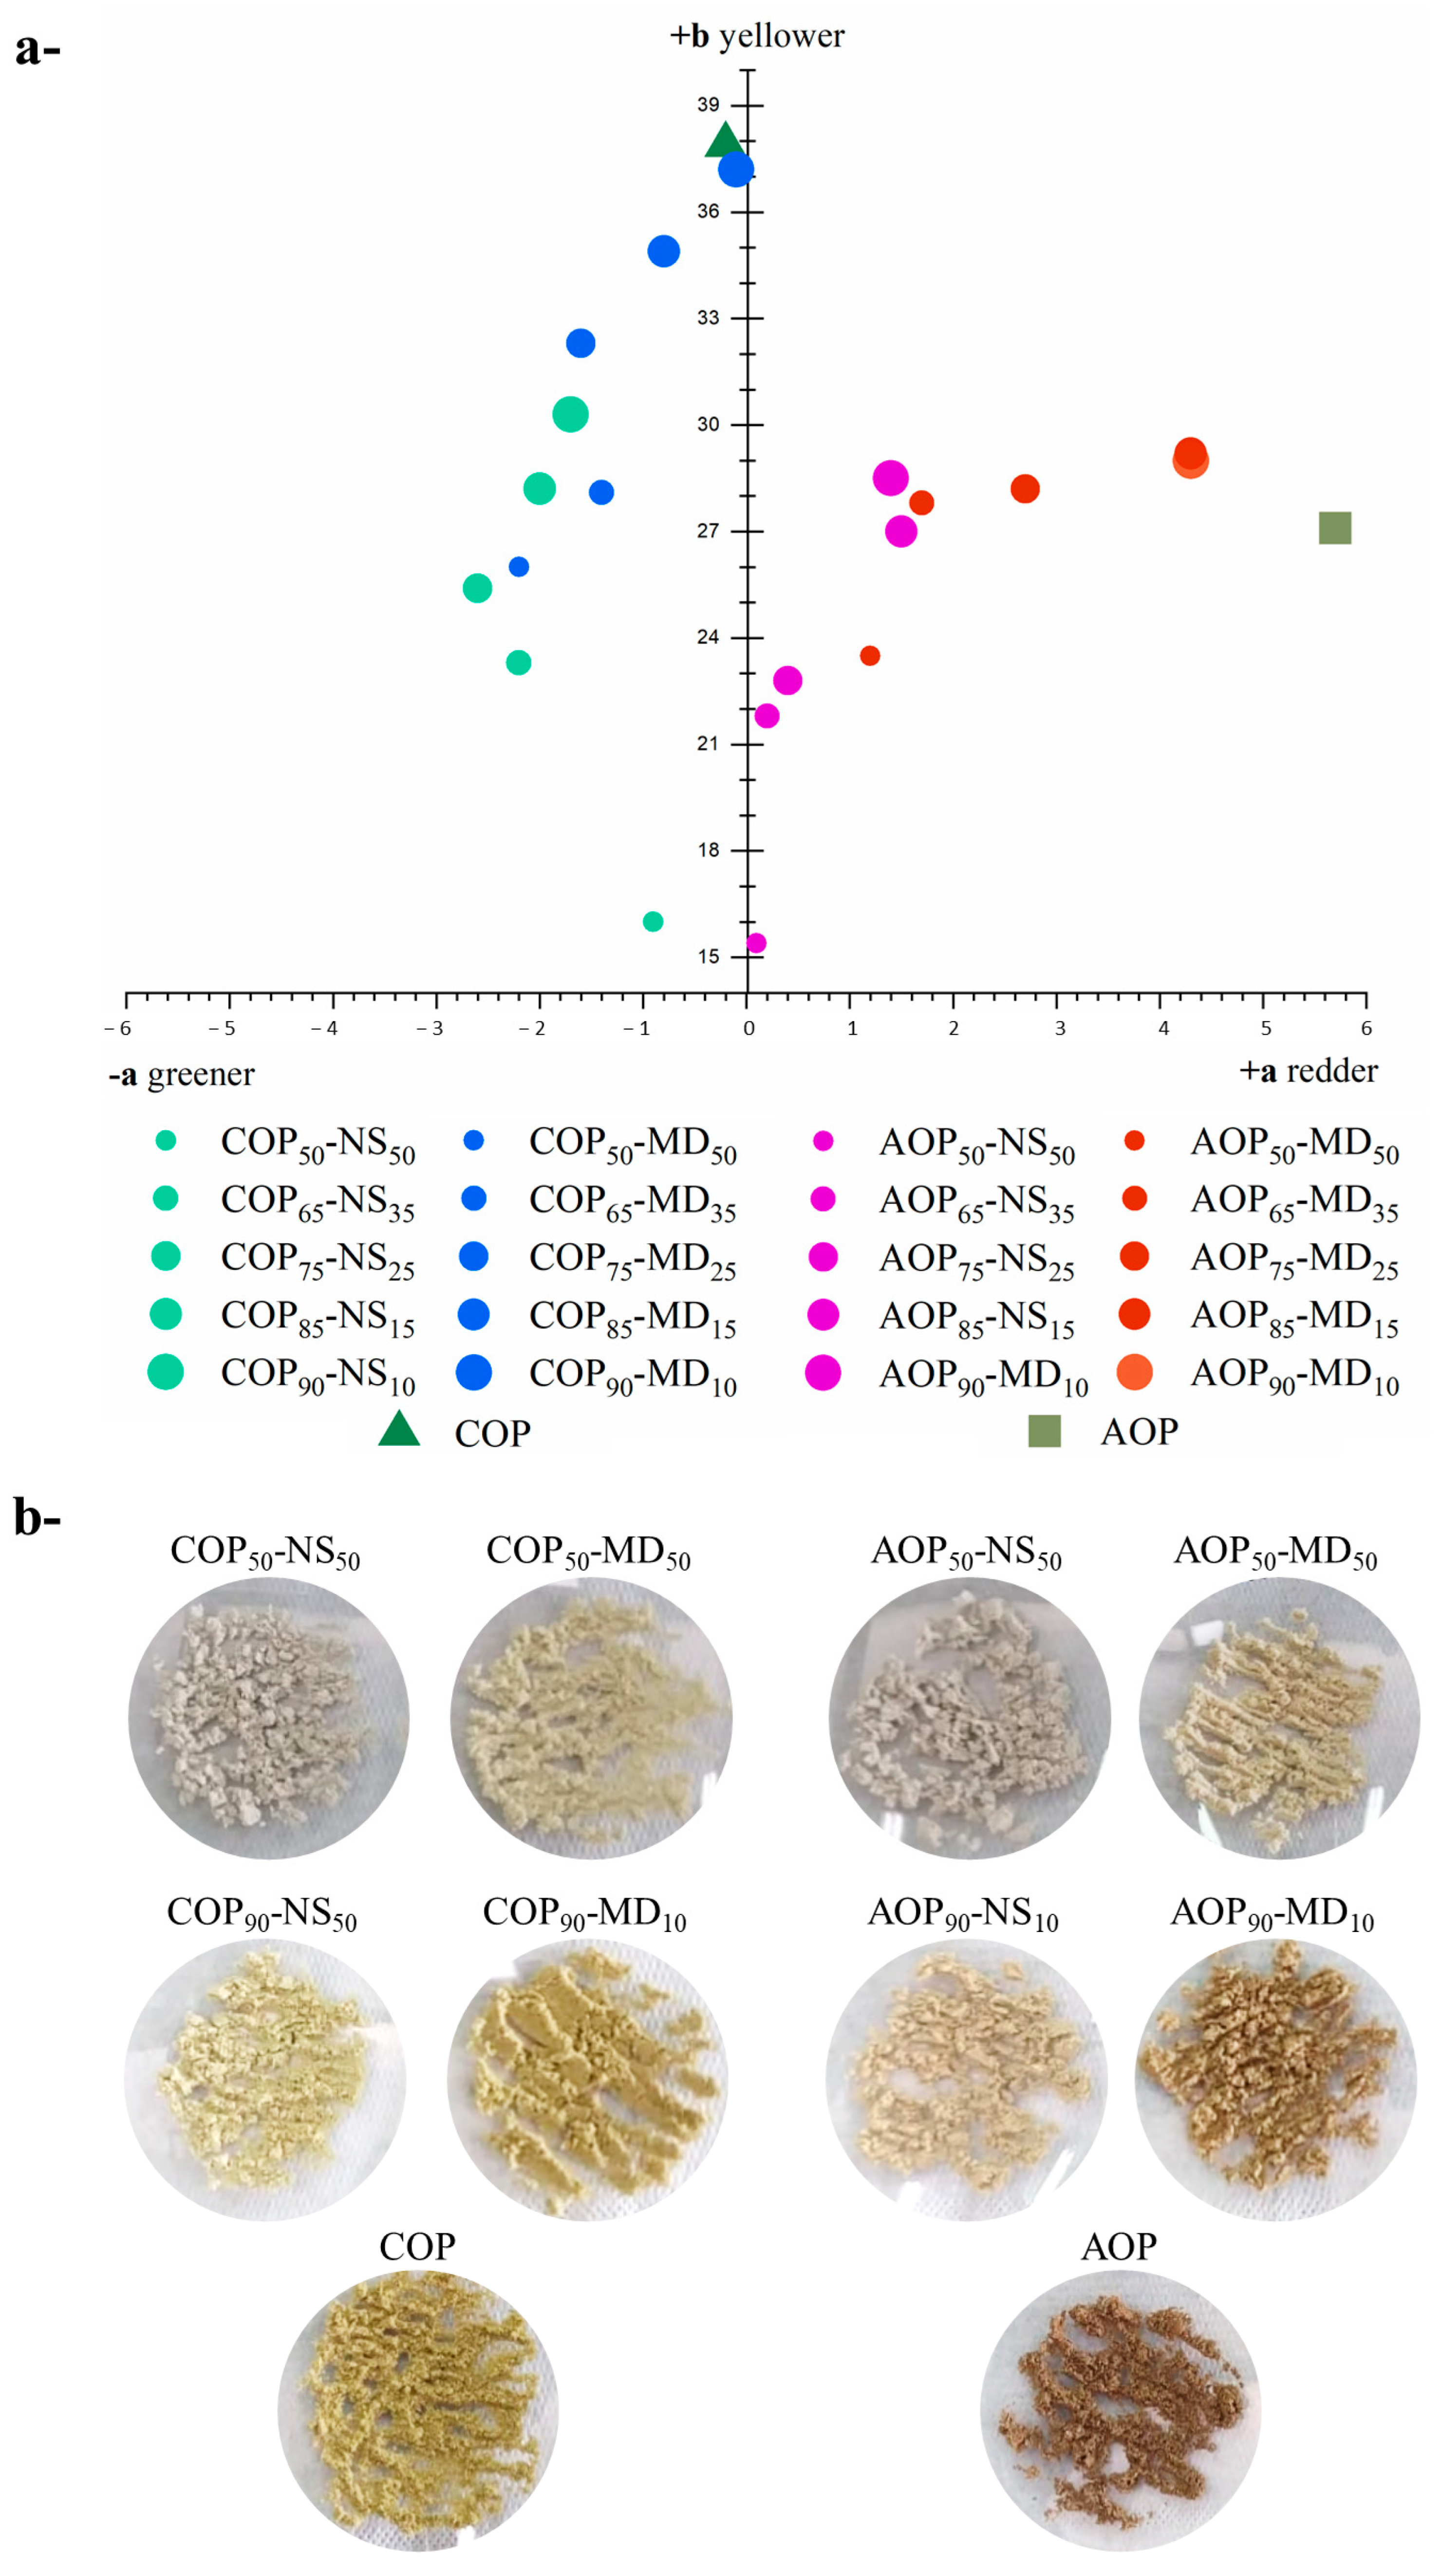
- Morphology, Particle Size Distribution (PSD), and Color
- Moisture Content and Hygroscopicity
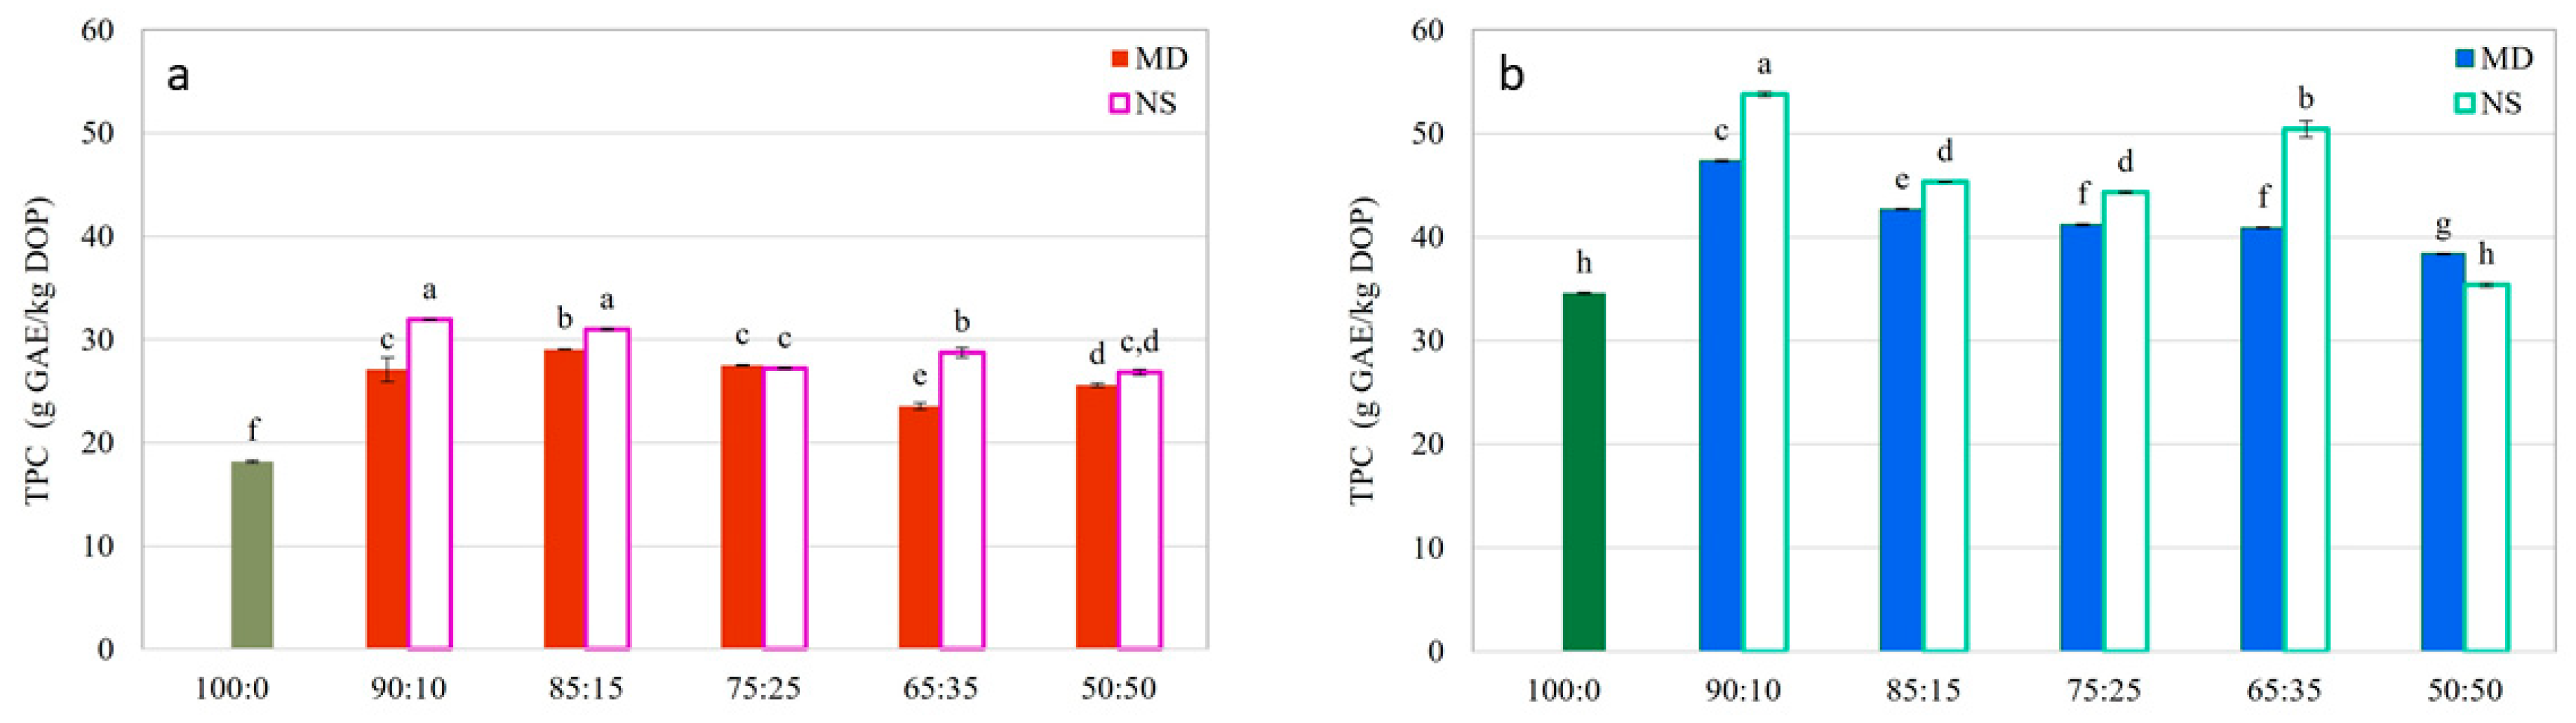
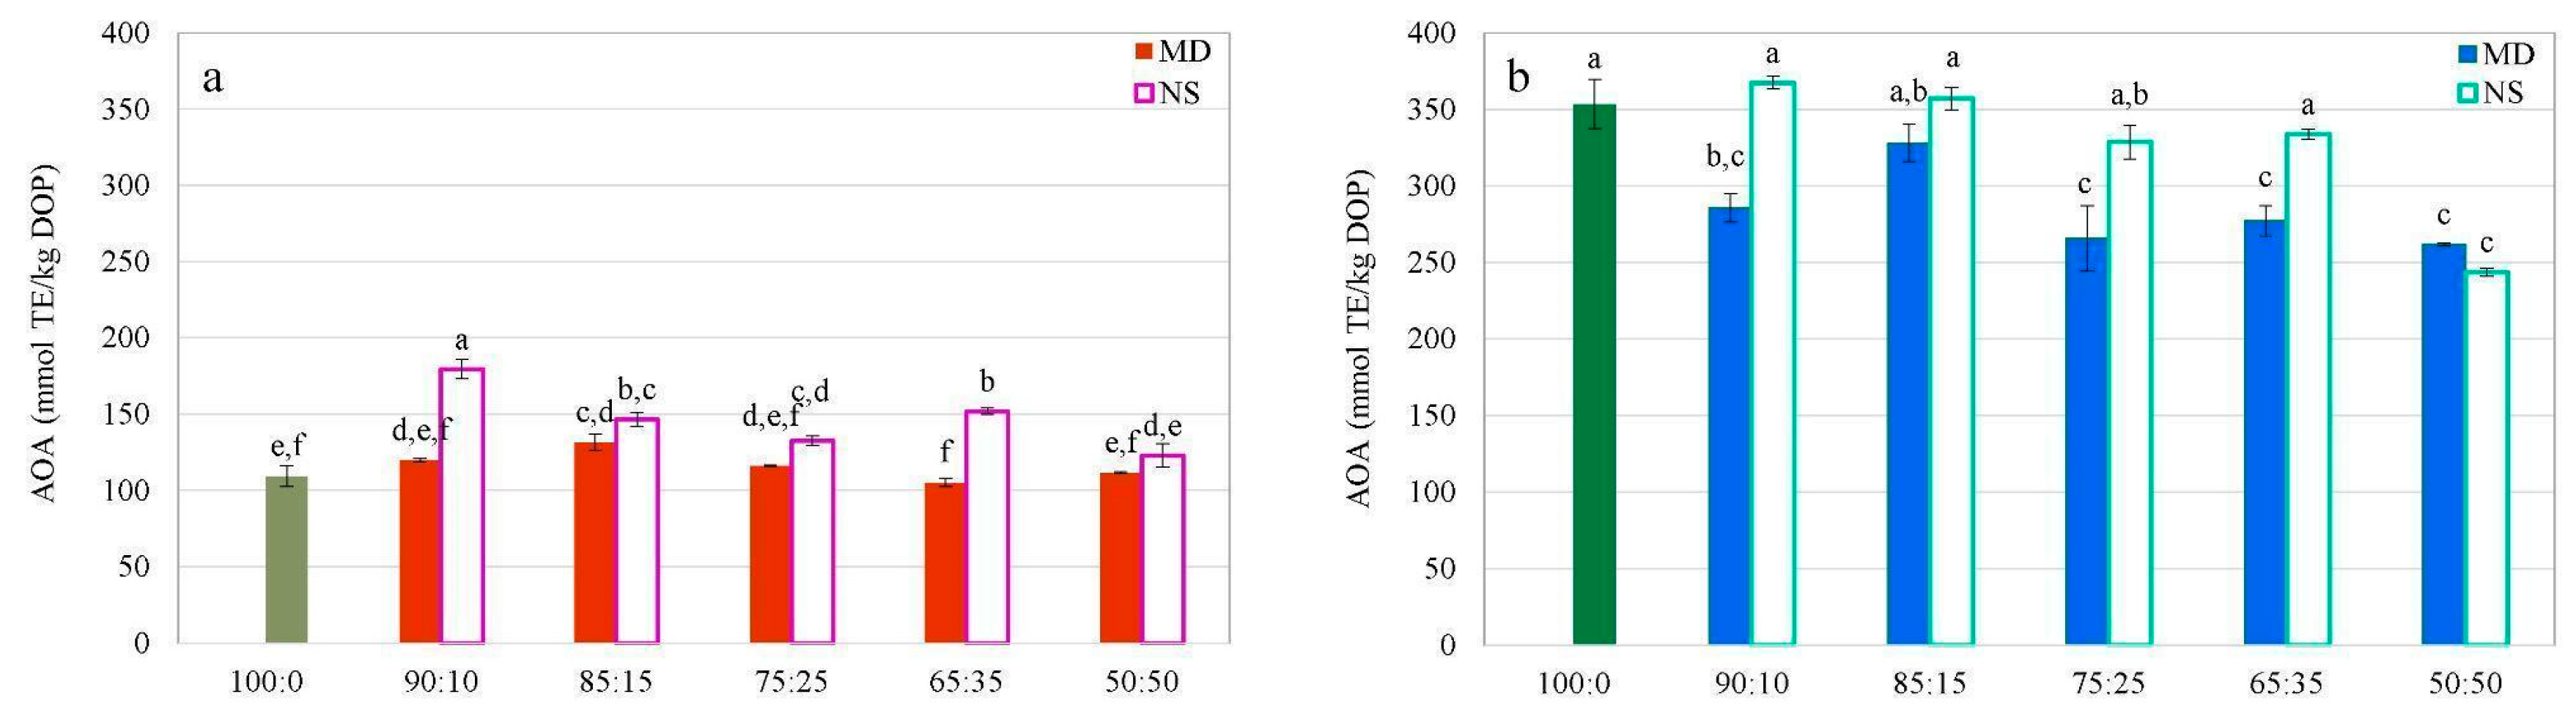
- Total Phenolic Content (TPC) and Antioxidant Activity (AOA)
- Encapsulation Efficiency (EE)
- Determination of Phenolic Compounds (PC) Using High Performance Liquid Chromatography
- Thermal degradation
3.1.3. Classification of Olive Pomace/Wall Material Mixtures and Quantification of Olive Pomace in Food Powders
3.2. Statistical Analysis
4. Results and Discussion
4.1. Food Powders Characterization
- Morphology, PSD, and Color
- Moisture Content and Hygroscopicity
- Total Phenolic Content (TPC) and Antioxidant Activity (AOA)
- Encapsulation Efficiency (EE)
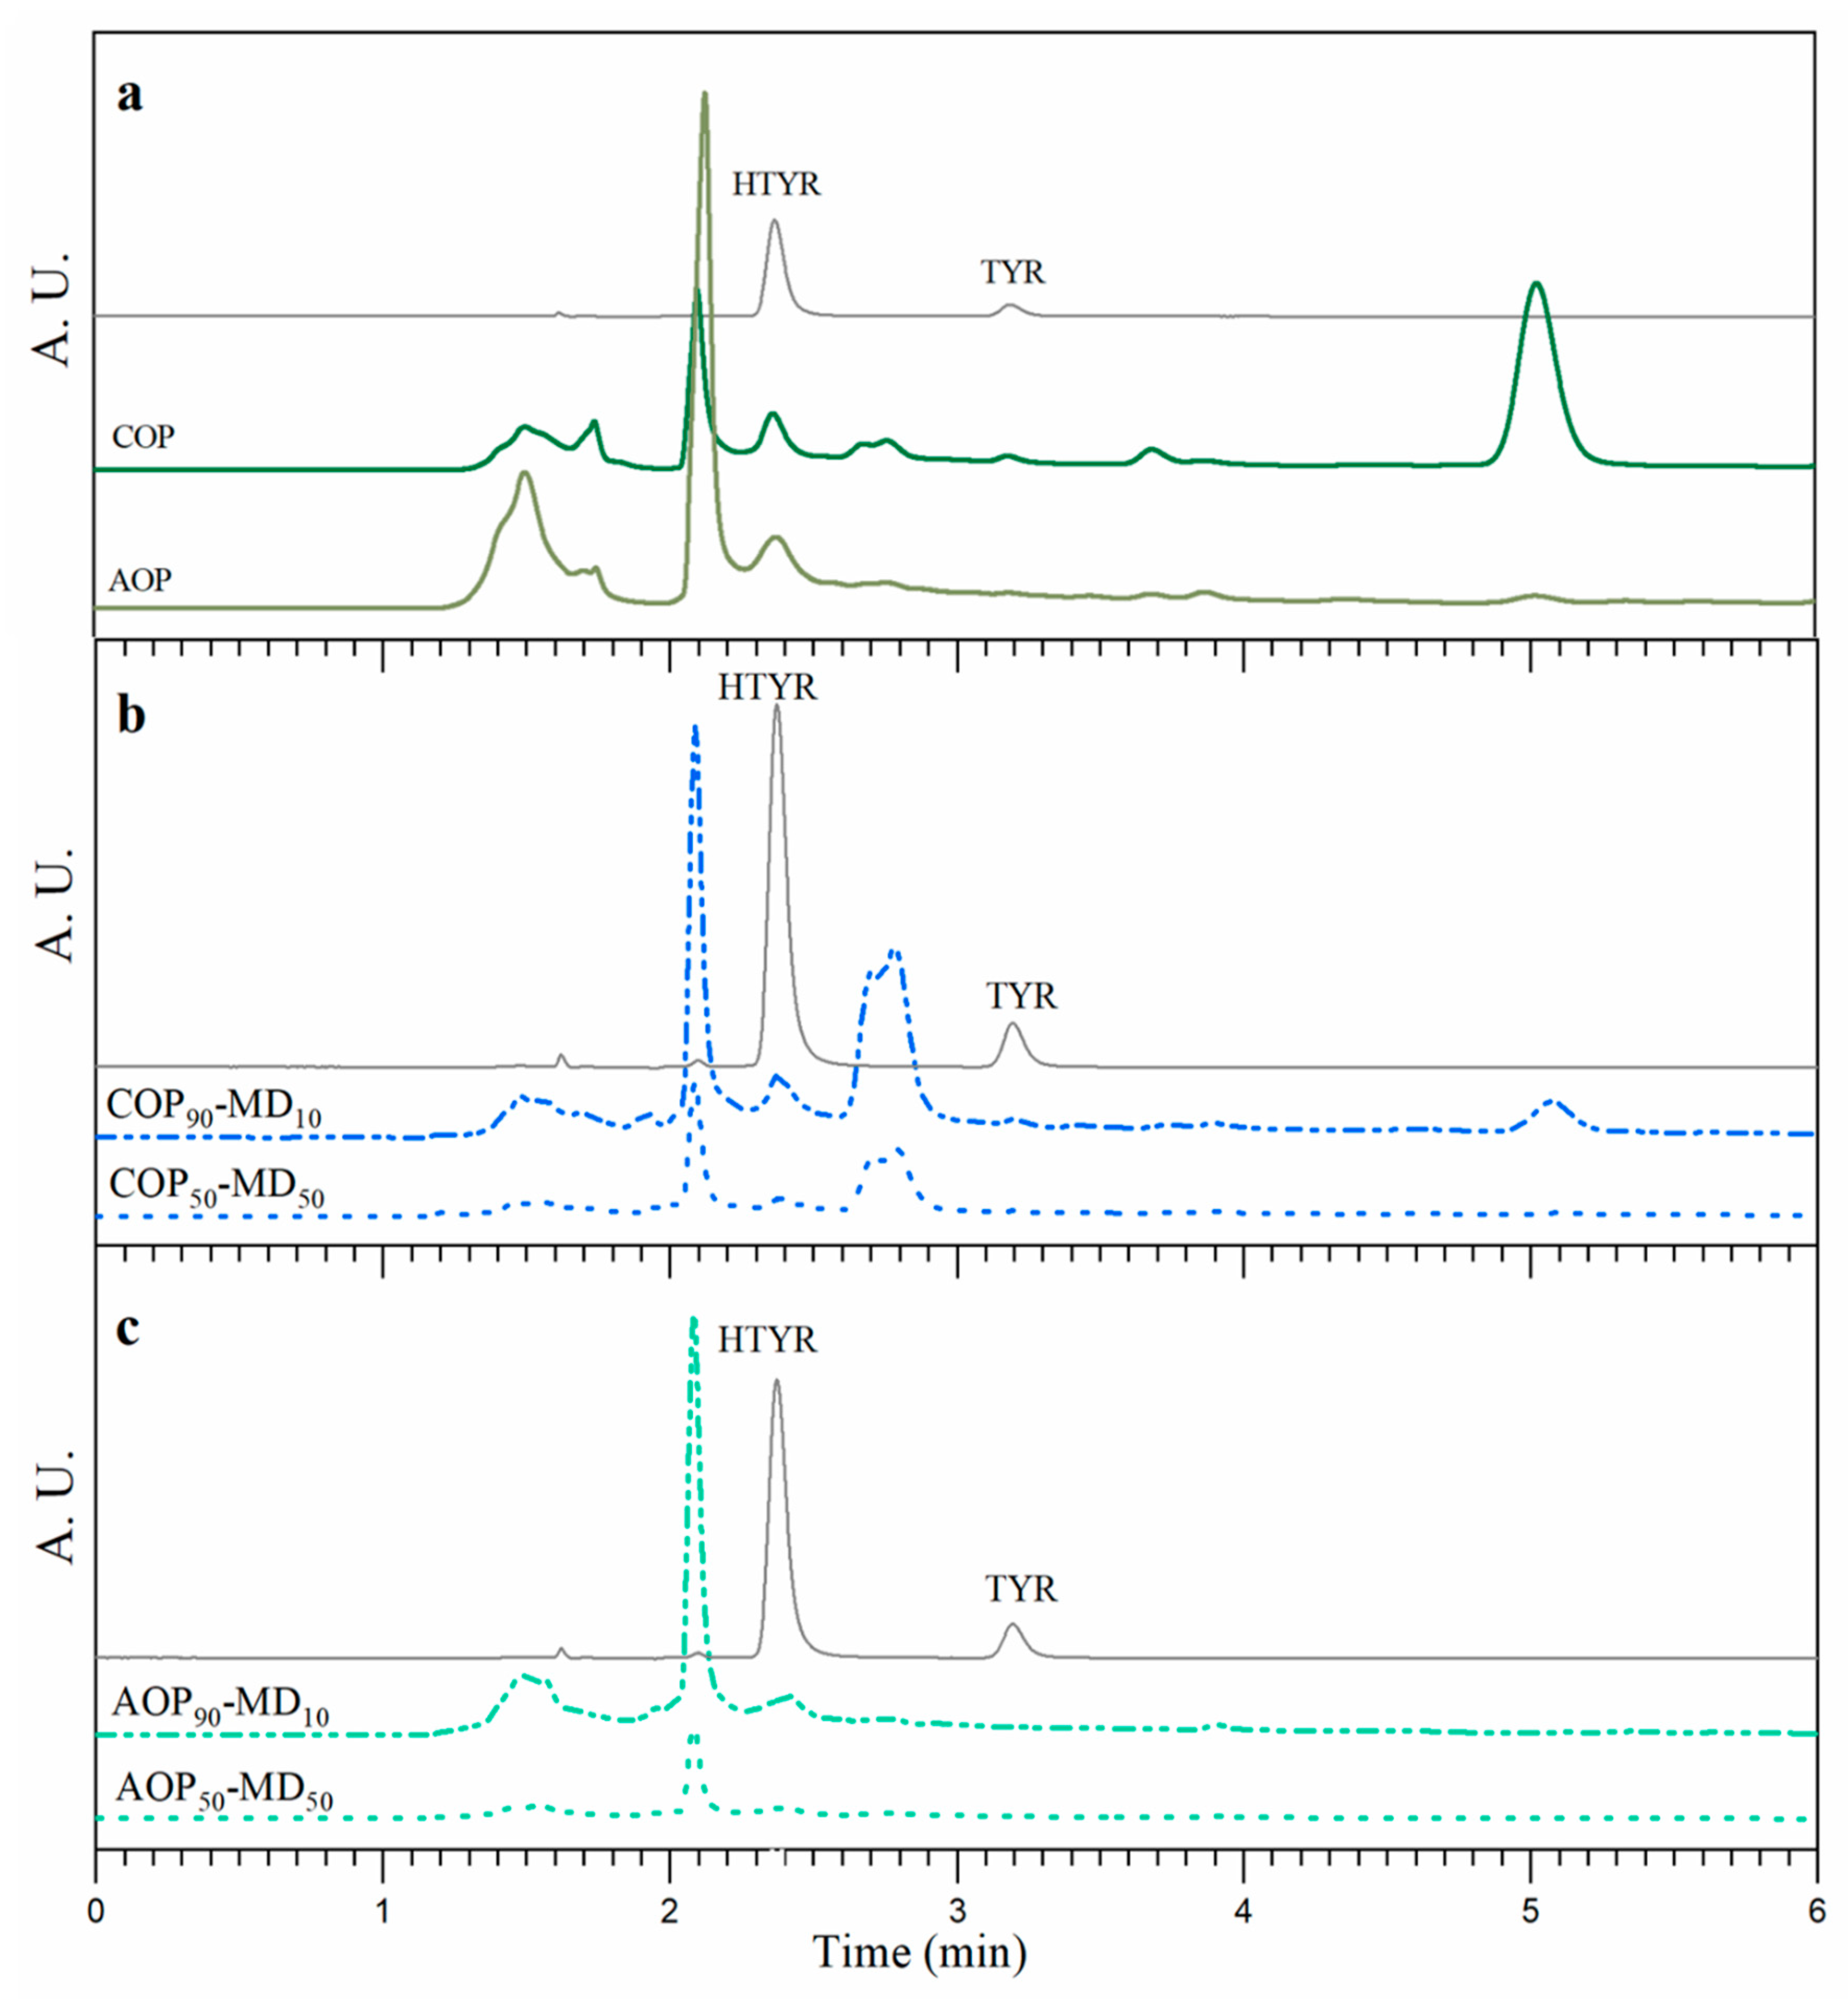
- Determination of Phenolic Compounds (PC) using High Performance Liquid Chromatography
- Thermal Degradation
4.2. Classification of Olive Pomace/Wall Material Mixtures and Quantification of Olive Pomace in Food Powders
5. Conclusions
Supplementary Materials
Author Contributions
Funding
Data Availability Statement
Acknowledgments
Conflicts of Interest
References
- Rabizadeh, F.; Mirian, M.S.; Doosti, R.; Kiani-Anbouhi, R.; Eftekhari, E. Phytochemical classification of medicinal plants used in the treatment of kidney disease based on traditional persian medicine. Evid.-Based Complement. Altern. Med. 2022, 2022, 8022599. [Google Scholar] [CrossRef] [PubMed]
- Pan, Y.; Li, H.; Shahidi, F.; Luo, T.; Deng, Z. Interactions among dietary phytochemicals and nutrients: Role of cell membranes. Trends Food Sci. Technol. 2022, 124, 38–50. [Google Scholar] [CrossRef]
- Elshafie, H.S.; Camele, I.; Mohamed, A.A. A comprehensive review on the biological, agricultural and pharmaceutical properties of secondary metabolites based-plant origin. Int. J. Mol. Sci. 2023, 24, 3266. [Google Scholar] [CrossRef] [PubMed]
- Li, Z.; Kanwal, R.; Yue, X.; Li, M.; Xie, A. Polyphenols and Intestinal Microorganisms: A Review of Their Interactions and Effects on Human Health. Food Biosci. 2024, 62, 105220. [Google Scholar] [CrossRef]
- Saifullah, M.; McCullum, R.; Akanbi, T.O.; Van Vuong, Q. Encapsulation of phenolic-rich lemon-scented tea tree extract in lemon pomace powder. Food Hydrocoll. Health 2023, 4, 100157. [Google Scholar] [CrossRef]
- Hu, Y.; Lin, Q.; Zhao, H.; Li, X.; Sang, S.; McClements, D.J.; Long, J.; Jin, Z.; Wang, J.; Qiu, C. Bioaccessibility and bioavailability of phytochemicals: Influencing factors, improvements, and evaluations. Food Hydrocoll. 2023, 135, 108165. [Google Scholar] [CrossRef]
- Mohapatra, A.; Bareen, M.A.; Sahu, J.K. Encapsulation of probiotics and bioactives. In Conductive Hydro Drying of Foods; Academic Press: Cambridge, MA, USA, 2025; pp. 245–271. [Google Scholar]
- Comunian, T.A.; Silva, M.P.; Souza, C.J. The use of food by-products as a novel for functional foods: Their use as ingredients and for the encapsulation process. Trends Food Sci. Technol. 2021, 108, 269–280. [Google Scholar] [CrossRef]
- Siddiqui, S.A.; Singh, P.; Utama, D.T.; Samatra, M.Y.; Ahmad, A.; Wani, S.A. Encapsulation of Bioactive Compounds in Foods for Diabetics-Sources, Encapsulation Technologies, Market Trends and Future Perspectives–A Systematic Review. Food Bioprod. Process. 2024, 147, 277–303. [Google Scholar] [CrossRef]
- Zabot, G.L.; Rodrigues, F.S.; Ody, L.P.; Tres, M.V.; Herrera, E.; Palacin, H.; Olivera-Montenegro, L. Encapsulation of bioactive compounds for food and agricultural applications. Polymers 2022, 14, 4194. [Google Scholar] [CrossRef]
- Somera, T.; Mafaldo, Í.M.; Bezerril, F.F.; Rosset, M.; Magnani, M.; Pimentel, T.C. Unconventional foods and by-products as sustainable encapsulating materials carrying probiotic cultures: An overview of the encapsulation methods, and incorporation on food products. Food Biosci. 2024, 61, 104892. [Google Scholar] [CrossRef]
- Goderska, K.; Pena, S.A. An in vitro gastrointestinal model to evaluate the tolerance of encapsulated Lactobacillus and Lactococcus strains with synbiotic containing lactobionic acid via lyophilization technique to harsh gastric conditions during storage time. Eur. J. Pharm. Biopharm. 2024, 197, 114147. [Google Scholar] [CrossRef] [PubMed]
- Moshfegh, N.; Niakousary, M.; Hosseini, S.M.H.; Mazloomi, S.M.; Abbasi, A. Effect of maltodextrin and Persian gum as wall materials and tannic acid as copigment on some properties of encapsulated sour cherry anthocyanin microcapsules. Food Chem. 2025, 463, 141165. [Google Scholar] [CrossRef]
- Pacheco, C.; García-Martínez, E.; Moraga, G.; Piña, J.; Nazareno, M.A.; Martínez-Navarrete, N. Development of dried functional foods: Stabilization of orange pulp powder by addition of biopolymers. Powder Technol. 2020, 362, 11–16. [Google Scholar] [CrossRef]
- Illingworth, K.A.; Lee, Y.Y.; Siow, L.F. Moringa oleifera protein isolates as novel wall materials in the encapsulation of limonene: Physicochemical properties and its stability. Ind. Crop. Prod. 2024, 221, 119354. [Google Scholar] [CrossRef]
- Yang, Z.; Guo, Y.; Zeng, C.; Sun, F.; Wang, Z.; Zhang, W.; Jian, L. Encapsulation and characterization of ω-3 medium- and long-chain triacylglycerols microencapsulated with different proteins as wall materials. Food Chem. X 2024, 22, 101363. [Google Scholar] [CrossRef]
- Díaz-Montes, E. Wall Materials for Encapsulating Bioactive Compounds via Spray-Drying: A Review. Polymers 2023, 15, 2659. [Google Scholar] [CrossRef]
- Zhao, D.; Li, Z.; Xia, J.; Kang, Y.; Sun, P.; Xiao, Z.; Niu, Y. Research progress of starch as microencapsulated wall material. Carbohydr. Polym. 2023, 318, 121118. [Google Scholar] [CrossRef]
- Huang, J.; Zhang, Y.; Lin, Y.; Chen, W.; Yi, J.; Li, X.; Gao, C.; Wu, F.; Huang, Z.; Gao, H.; et al. Development and evaluation of novel taste-masking tilmicosin microcapsules containing octenylsuccinic anhydride modified starch and maltodextrin as wall materials. Int. J. Biol. Macromol. 2024, 282, 136619. [Google Scholar] [CrossRef]
- Jan, K.; Riar, C.S.; Saxena, D.C. Characterization of agro-industrial byproducts and wastes for sustainable industrial application. J. Food Meas. Charact. 2017, 11, 1254–1265. [Google Scholar] [CrossRef]
- Available online: https://www.fao.org/in-action/seeking-end-to-loss-and-waste-of-food-along-production-chain/en/ (accessed on 13 November 2024).
- Monasterio, R.; Caselles, C.; Trentacoste, E.; Olmo-García, L.; Carrasco-Pancorbo, A.; Galmarini, C.; Soto, V. Use of olive pomace extract as a pollinator attractant to increase onion (Allium cepa L.) seed crop production. Eur. J. Agron. 2023, 149, 126921. [Google Scholar] [CrossRef]
- Baker, P.W.; Višnjevec, A.M.; Peeters, K.; Schwarzkopf, M.; Charlton, A. Valorisation of waste olive pomace: Laboratory and pilot scale processing to extract dietary fibre. Clean. Circ. Bioecon. 2023, 5, 100045. [Google Scholar] [CrossRef]
- Tsali, A.; Goula, A.M. Valorization of grape pomace: Encapsulation and storage stability of its phenolic extract. Powder Technol. 2018, 340, 194–207. [Google Scholar] [CrossRef]
- Ribeiro, T.B.; Bonifácio-Lopes, T.; Morais, P.; Miranda, A.; Nunes, J.; Vicente, A.A.; Pintado, M. Incorporation of olive pomace ingredients into yoghurts as a source of fibre and hydroxytyrosol: Antioxidant activity and stability throughout gastrointestinal digestion. J. Food Eng. 2021, 297, 110476. [Google Scholar] [CrossRef]
- Karantonis, H.C.; Tsoupras, A.; Moran, D.; Zabetakis, I.; Nasopoulou, C. Olive, apple, and grape pomaces with antioxidant and anti-inflammatory bioactivities for functional foods. In Functional Foods and Their Implications for Health Promotion; Academic Press: Cambridge, MA, USA, 2023; pp. 131–159. [Google Scholar]
- Balli, D.; Cecchi, L.; Innocenti, M.; Bellumori, M.; Mulinacci, N. Food by-products valorisation: Grape pomace and olive pomace (pâté) as sources of phenolic compounds and fiber for enrichment of tagliatelle pasta. Food Chem. 2021, 355, 129642. [Google Scholar] [CrossRef]
- Alexandre, E.M.; Silva, S.; Santos, S.A.; Silvestre, A.J.; Duarte, M.F.; Saraiva, J.A.; Pintado, M. Antimicrobial activity of pomegranate peel extracts performed by high pressure and enzymatic assisted extraction. Food Res. Int. 2019, 115, 167–176. [Google Scholar] [CrossRef]
- Rodriguez, E.B.; Vidallon, M.L.P.; Mendoza, D.J.R.; Dalisay, K.A.M.; Reyes, C.T. Stabilization of betalains from the peel of red dragon fruit [Hylocereus polyrhizus (Weber) Britton & Rose] through biopolymeric encapsulation. Philipp. Agric. Sci. 2015, 98, 276–286. [Google Scholar]
- Hammoui, Y.; Molina-Boisseau, S.; Duval, A.; Djerrada, N.; Adjeroud, N.; Remini, H.; Dahmoune, F.; Madani, K. Preparation of plasticized wheat gluten/olive pomace powder biocomposite: Effect of powder content and chemical modifications. Mater. Des. 2015, 87, 742–749. [Google Scholar] [CrossRef]
- Lammi, S.; Barakat, A.; Mayer-Laigle, C.; Djenane, D.; Gontard, N.; Angellier-Coussy, H. Dry fractionation of olive pomace as a sustainable process to produce fillers for biocomposites. Powder Technol. 2018, 326, 44–53. [Google Scholar] [CrossRef]
- Association of Official Analytical Chemists. Official Methods of Analysis: Changes in Official Methods of Analysis Made at the Annual Meeting; Association of Official Analytical Chemists: Arlington, VA, USA, 1990; Volume 15, pp. 132–137. [Google Scholar]
- Callahan, J.C.; Cleary, G.W.; Elefant, M.; Kaplan, G.; Kensler, T.; Nash, R.A. Equilibrium moisture content of pharmaceutical excipients. Drug Dev. Ind. Pharm. 1982, 8, 355–369. [Google Scholar] [CrossRef]
- Singleton, V.L.; Orthofer, R.; Lamuela-Raventós, R.M. [14] Analysis of total phenols and other oxidation substrates and antioxidants by means of folin-ciocalteu reagent. Methods Enzymol. 1999, 299, 152–178. [Google Scholar]
- Brand-Williams, W.; Cuvelier, M.E.; Berset, C. Use of a free radical method to evaluate antioxidant activity. LWT Food Sci. Technol. 1995, 28, 25–30. [Google Scholar] [CrossRef]
- Kulisic, T.; Radonic, A.; Katalinic, V.; Milos, M. Use of different methods for testing antioxidative activity of oregano essential oil. Food Chem. 2004, 85, 633–640. [Google Scholar] [CrossRef]
- Zanoni, F.; Primiterra, M.; Angeli, N.; Zoccatelli, G. Microencapsulation by spray-drying of polyphenols extracted from red chicory and red cabbage: Effects on stability and color properties. Food Chem. 2020, 307, 125535. [Google Scholar] [CrossRef] [PubMed]
- González, E.; Gómez-Caravaca, A.M.; Giménez, B.; Cebrián, R.; Maqueda, M.; Martínez-Férez, A.; Robert, P. Evolution of the phenolic compounds profile of olive leaf extract encapsulated by spray-drying during in vitro gastrointestinal digestion. Food Chem. 2019, 279, 40–48. [Google Scholar] [CrossRef] [PubMed]
- Rezvankhah, A.; Emam-Djomeh, Z.; Askari, G. Encapsulation and delivery of bioactive compounds using spray and freeze-drying techniques: A review. Dry. Technol. 2020, 38, 235–258. [Google Scholar] [CrossRef]
- Wang, H.; Tong, X.; Yuan, Y.; Peng, X.; Zhang, Q.; Zhang, S.; Li, Y. Effect of spray-drying and freeze-drying on the properties of soybean hydrolysates. J. Chem. 2020, 2020, 9201457. [Google Scholar] [CrossRef]
- Xiao, H.; Wang, S.; Xu, W.; Yin, Y.; Xu, D.; Zhang, L.; Liu, G.-Q.; Luo, F.; Sun, S.; Lin, Q.; et al. The study on starch granules by using darkfield and polarized light microscopy. J. Food Compos. Anal. 2020, 92, 103576. [Google Scholar] [CrossRef]
- Venkateshaiah, A.; Padil, V.V.; Nagalakshmaiah, M.; Waclawek, S.; Černík, M.; Varma, R.S. Microscopic techniques for the analysis of micro and nanostructures of biopolymers and their derivatives. Polymers 2020, 12, 512. [Google Scholar] [CrossRef]
- González-Ortega, R.; Faieta, M.; Di Mattia, C.D.; Valbonetti, L.; Pittia, P. Microencapsulation of olive leaf extract by freeze-drying: Effect of carrier composition on process efficiency and technological properties of the powders. J. Food Eng. 2020, 285, 110089. [Google Scholar] [CrossRef]
- Sahai, D.; Jackson, D.S. Structural and chemical properties of native corn starch granules. Starch-Stärke 1996, 48, 249–255. [Google Scholar] [CrossRef]
- Shogren, R.; Biresaw, G. Surface properties of water soluble maltodextrin, starch acetates and starch acetates/alkenylsuccinates. Colloids Surf. A Physicochem. Eng. Asp. 2007, 298, 170–176. [Google Scholar] [CrossRef]
- Aliakbarian, B.; Sampaio, F.C.; de Faria, J.T.; Pitangui, C.G.; Lovaglio, F.; Casazza, A.A.; Perego, P. Optimization of spray drying microencapsulation of olive pomace polyphenols using response surface methodology and artificial neural network. LWT 2018, 93, 220–228. [Google Scholar] [CrossRef]
- Parikh, A.; Agarwal, S.; Raut, K. A review on applications of maltodextrin in pharmaceutical industry. System 2014, 4, 6. [Google Scholar]
- Ezenarro, J.; García-Pizarro, Á.; Busto, O.; de Juan, A.; Boqué, R. Analysing olive ripening with digital image RGB histograms. Anal. Chim. Acta 2023, 1280, 341884. [Google Scholar] [CrossRef]
- Fernández, J.-E. Understanding olive adaptation to abiotic stresses as a tool to increase crop performance. Environ. Exp. Bot. 2014, 103, 158–179. [Google Scholar] [CrossRef]
- Ivancic, T.; Jakopic, J.; Veberic, R.; Vesel, V.; Hudina, M. Effect of ripening on the phenolic and sugar contents in the meso-and epicarp of olive fruits (Olea europaea L.) cultivar ‘Leccino’. Agriculture 2022, 12, 1347. [Google Scholar] [CrossRef]
- Dauber, C.; Carreras, T.; Fernández, A.F.; Irigaray, B.; Albores, S.; Gámbaro, A.; Vieitez, I. Response surface methodology for the optimization of biophenols recovery from “alperujo” using supercritical fluid extraction. Comparison between Arbequina and Coratina cultivars. J. Supercrit. Fluids 2022, 180, 105460. [Google Scholar] [CrossRef]
- Mahdavi, S.A.; Jafari, S.M.; Assadpoor, E.; Dehnad, D. Microencapsulation optimization of natural anthocyanins with maltodextrin, gum Arabic and gelatin. Int. J. Biol. Macromol. 2016, 85, 379–385. [Google Scholar] [CrossRef]
- Righetto, A.M.; Netto, F.M. Effect of encapsulating materials on water sorption, glass transition and stability of juice from immature acerola. Int. J. Food Prop. 2005, 8, 337–346. [Google Scholar] [CrossRef]
- Bhandari, B.R.; Howes, T. Implication of glass transition for the drying and stability of dried foods. J. Food Eng. 1999, 40, 71–79. [Google Scholar] [CrossRef]
- Morales, N.X.C.; Gómez, K.Y.V.; Schweiggert, R.M.; Delgado, G.T.C. Stabilisation of betalains and phenolic compounds extracted from red cactus pear (Opuntia ficus-indica) by spray and freeze-drying using oca (Oxalis tuberosa) starch as drying aid. Food Sci. Technol. Int. 2021, 27, 456–469. [Google Scholar] [CrossRef] [PubMed]
- Newman, A.W.; Reutzel-Edens, S.M.; Zografi, G. Characterization of the “hygroscopic” properties of active pharmaceutical ingredients. J. Pharm. Sci. 2008, 97, 1047–1059. [Google Scholar] [CrossRef] [PubMed]
- Raja, K.C.M.; Sankarikutty, B.; Sreekumar, M.; Jayalekshmy, A.; Narayanan, C.S. Material characterization studies of maltodextrin samples for the use of wall material. Starch-Stärke 1989, 41, 298–303. [Google Scholar] [CrossRef]
- Cai, Y.; Corke, H. Production and properties of spray-dried amaranthus betacyanin pigments. J. Food Sci. 2000, 65, 1248–1252. [Google Scholar] [CrossRef]
- Cedola, A.; Cardinali, A.; D'Antuono, I.; Conte, A.; Del Nobile, M.A. Cereal foods fortified with by-products from the olive oil industry. Food Biosci. 2020, 33, 100490. [Google Scholar] [CrossRef]
- Gómez-Cruz, I.; Cara, C.; Romero, I.; Castro, E.; Gullón, B. Valorisation of exhausted olive pomace by an eco-friendly solvent extraction process of natural antioxidants. Antioxidants 2020, 9, 1010. [Google Scholar] [CrossRef]
- Ribeiro, T.B.; Oliveira, A.L.; Costa, C.; Nunes, J.; Vicente, A.A.; Pintado, M. Total and sustainable valorisation of olive pomace using a fractionation approach. Appl. Sci. 2020, 10, 6785. [Google Scholar] [CrossRef]
- Liu, W.; Xu, J.; Shuai, X.; Geng, Q.; Guo, X.; Chen, J.; Li, T.; Liu, C.; Dai, T. The interaction and physicochemical properties of the starch-polyphenol complex: Polymeric proanthocyanidins and maize starch with different amylose/amylopectin ratios. Int. J. Biol. Macromol. 2023, 253, 126617. [Google Scholar] [CrossRef]
- Xiao, Y.; Zheng, M.; Yang, S.; Li, Z.; Liu, M.; Yang, X.; Lin, N.; Liu, J. Physicochemical properties and in vitro digestibility of proso millet starch after addition of Proanthocyanidins. Int. J. Biol. Macromol. 2021, 168, 784–791. [Google Scholar] [CrossRef]
- Ramírez, M.J.; Giraldo, G.I.; Orrego, C.E. Modeling and stability of polyphenol in spray-dried and freeze-dried fruit encapsulates. Powder Technol. 2015, 277, 89–96. [Google Scholar] [CrossRef]
- Vidal, A.M.; Moya, M.; Alcalá, S.; Romero, I.; Espínola, F. Enrichment of refined olive oils with phenolic extracts of olive leaf and exhausted olive pomace. Antioxidants 2022, 11, 204. [Google Scholar] [CrossRef] [PubMed]
- Uribe, E.; Lemus-Mondaca, R.; Vega-Gálvez, A.; Zamorano, M.; Quispe-Fuentes, I.; Pasten, A.; Di Scala, K. Influence of process temperature on drying kinetics, physicochemical properties and antioxidant capacity of the olive-waste cake. Food Chem. 2014, 147, 170–176. [Google Scholar] [CrossRef]
- Loksuwan, J. Characteristics of microencapsulated β-carotene formed by spray drying with modified tapioca starch, native tapioca starch and maltodextrin. Food Hydrocoll. 2007, 21, 928–935. [Google Scholar] [CrossRef]
- Guo, J.; Li, P.; Kong, L.; Xu, B. Microencapsulation of curcumin by spray drying and freeze drying. LWT 2020, 132, 109892. [Google Scholar] [CrossRef]
- Yarlina, V.P.; Rizky, A.; Diva, A.; Zaida, Z.; Djali, M.; Andoyo, R.; Lani, M.N. Maltodextrin concentration on the encapsulation efficiency of tempeh protein concentrate from Jack Bean (Canavalia ensiformis): Physical, chemical, and structural properties. Int. J. Food Prop. 2024, 27, 1120–1132. [Google Scholar] [CrossRef]
- Smaoui, S.; Hlima, H.B.; Braïek, O.B.; Ennouri, K.; Mellouli, L.; Khaneghah, A.M. Recent advancements in encapsulation of bioactive compounds as a promising technique for meat preservation. Meat Sci 2021, 181, 108585. [Google Scholar] [CrossRef]
- Urzúa, C.; González, E.; Dueik, V.; Bouchon, P.; Giménez, B.; Robert, P. Olive leaves extract encapsulated by spray-drying in vacuum fried starch–gluten doughs. Food Bioprod. Process. 2017, 106, 171–180. [Google Scholar] [CrossRef]
- Tapia-Quirós, P.; Montenegro-Landívar, M.F.; Reig, M.; Vecino, X.; Cortina, J.L.; Saurina, J.; Granados, M. Recovery of polyphenols from agri-food by-products: The olive oil and winery industries cases. Foods 2022, 11, 362. [Google Scholar] [CrossRef]
- D’Antuono, I.; Kontogianni, V.G.; Kotsiou, K.; Linsalata, V.; Logrieco, A.F.; Tasioula-Margari, M.; Cardinali, A. Polyphenolic characterization of olive mill wastewaters, coming from Italian and Greek olive cultivars, after membrane technology. Food Res. Int. 2014, 65, 301–310. [Google Scholar] [CrossRef]
- Nunes, M.A.; Costa, A.S.; Bessada, S.; Santos, J.; Puga, H.; Alves, R.C.; Oliveira, M.B.P. Olive pomace as a valuable source of bioactive compounds: A study regarding its lipid- and water-soluble components. Sci. Total Environ. 2018, 644, 229–236. [Google Scholar] [CrossRef]
- Zveren, U.; Özdoğan, Z.S. Investigation of the slow pyrolysis kinetics of olive oil pomace using thermo-gravimetric analysis coupled with mass spectrometry. Biomass Bioenergy 2013, 58, 168–179. [Google Scholar] [CrossRef]
- García-Ibañez, P.; Sánchez, M.; Cabanillas, A. Thermogravimetric analysis of olive-oil residue in air atmosphere. Fuel Process. Technol. 2006, 87, 103–107. [Google Scholar] [CrossRef]
- Wu, D.D.; Tan, Y.; Cao, Z.W.; Han, L.J.; Zhang, H.L.; Dong, L.S. Preparation and characterization of maltodextrin-based polyurethane. Carbohydr. Polym. 2018, 194, 236–244. [Google Scholar] [CrossRef] [PubMed]
- Rodrigues, S.C.S.; da Silva, A.S.; de Carvalho, L.H.; Alves, T.S.; Barbosa, R. Morphological, structural, thermal properties of a native starch obtained from babassu mesocarp for food packaging application. J. Mater. Res. Technol. 2020, 9, 15670–15678. [Google Scholar] [CrossRef]
- Difonzo, G.; Troilo, M.; Squeo, G.; Pasqualone, A.; Caponio, F. Functional compounds from olive pomace to obtain high-added value foods—A review. J. Sci. Food Agric. 2021, 101, 15–26. [Google Scholar] [CrossRef]
- Simonato, B.; Trevisan, S.; Tolve, R.; Favati, F.; Pasini, G. Pasta fortification with olive pomace: Effects on the technological characteristics and nutritional properties. LWT 2019, 114, 108368. [Google Scholar] [CrossRef]
- Padalino, L.; D’Antuono, I.; Durante, M.; Conte, A.; Cardinali, A.; Linsalata, V.; Mita, G.; Logrieco, A.F.; Del Nobile, M.A. Use of olive oil industrial by-product for pasta enrichment. Antioxidants 2018, 7, 59. [Google Scholar] [CrossRef]
- Cedola, A.; Cardinali, A.; Del Nobile, M.A.; Conte, A. Fish burger enriched by olive oil industrial by-product. Food Sci. Nutr. 2017, 5, 837–844. [Google Scholar] [CrossRef]
- Lin, S.; Chi, W.; Hu, J.; Pan, Q.; Zheng, B.; Zeng, S. Sensory and nutritional properties of Chinese olive pomace based high fibre biscuit. Emir. J. Food Agric. 2017, 29, 495–501. [Google Scholar] [CrossRef]
- Ying, D.; Hlaing, M.M.; Lerisson, J.; Pitts, K.; Cheng, L.; Sanguansri, L.; Augustin, M.A. Physical properties and FTIR analysis of rice-oat flour and maize-oat flour based extruded food products containing olive pomace. Food Res. Int. 2017, 100, 665–673. [Google Scholar] [CrossRef]
- Razuc, M.; Grafia, A.; Gallo, L.; Ramírez-Rigo, M.V.; Romañach, R.J. Near-infrared spectroscopic applications in pharmaceutical particle technology. Drug Dev. Ind. Pharm. 2019, 45, 1565–1589. [Google Scholar] [CrossRef] [PubMed]
- Chanda, A.; Daly, A.M.; Foley, D.A.; LaPack, M.A.; Mukherjee, S.; Orr, J.D.; Reid, G.L.; Thompson, D.R.; Ward, H.W. Industry Perspectives on Process Analytical Technology: Tools and Applications in API Development. Org. Process. Res. Dev. 2014, 19, 63–83. [Google Scholar] [CrossRef]
- Kim, E.J.; Kim, J.H.; Kim, M.-S.; Jeong, S.H.; Choi, D.H. Process Analytical Technology Tools for Monitoring Pharmaceutical Unit Operations: A Control Strategy for Continuous Process Verification. Pharmaceutics 2021, 13, 919. [Google Scholar] [CrossRef] [PubMed]
- Nunes, M.A.; Páscoa, R.N.; Alves, R.C.; Costa, A.S.; Bessada, S.; Oliveira, M.B.P. Fourier transform near infrared spectroscopy as a tool to discriminate olive wastes: The case of monocultivar pomaces. Waste Manag. 2020, 103, 378–387. [Google Scholar] [CrossRef]
- Páscoa, R.N.; Nunes, M.A.; Reszczyński, F.; Costa, A.S.; Oliveira, M.B.P.; Alves, R.C. Near Infrared (NIR) Spectroscopy as a Tool to Assess Blends Composition and Discriminate Antioxidant Activity of Olive Pomace Cultivars. Waste Biomass-Valorization 2021, 12, 4901–4913. [Google Scholar] [CrossRef]
- Martín, J.F.G. Potential of near-infrared spectroscopy for the determination of olive oil quality. Sensors 2022, 22, 2831. [Google Scholar] [CrossRef]
- Mahesar, S.A.; Lucarini, M.; Durazzo, A.; Santini, A.; Lampe, A.I.; Kiefer, J. Application of infrared spectroscopy for functional compounds evaluation in olive oil: A current snapshot. J. Spectrosc. 2019, 2019, 5319024. [Google Scholar] [CrossRef]
- Rohman, A.; Man, Y.B.C. Fourier transform infrared (FTIR) spectroscopy for analysis of extra virgin olive oil adulterated with palm oil. Food Res. Int. 2010, 43, 886–892. [Google Scholar] [CrossRef]


| Sample | Olive Pomace Variety (%, w/w) | Wall Agent (%, w/w) | ||
|---|---|---|---|---|
| Coratina Olive Pomace (COP) | Arbequina Olive Pomace (AOP) | Maltodextrin (MD) | Native Starch (NS) | |
| COP | 100 | - | - | - |
| AOP | - | 100 | - | - |
| MD | - | - | 100 | - |
| NS | - | - | - | 100 |
| COP50-MD50 | 50 | - | 50 | - |
| COP65-MD35 | 65 | - | 35 | - |
| COP75-MD25 | 75 | - | 25 | - |
| COP85-MD15 | 85 | - | 15 | - |
| COP90-MD10 | 90 | - | 10 | - |
| COP50-NS50 | 50 | - | - | 50 |
| COP65-NS35 | 65 | - | - | 35 |
| COP75-NS25 | 75 | - | - | 25 |
| COP85-NS15 | 85 | - | - | 15 |
| COP90-NS10 | 90 | - | - | 10 |
| AOP50-MD50 | - | 50 | 50 | - |
| AOP65-MD35 | - | 65 | 35 | - |
| AOP75-MD25 | - | 75 | 25 | - |
| AOP85-MD15 | - | 85 | 15 | - |
| AOP90-MD10 | - | 90 | 10 | - |
| AOP50-NS50 | - | 50 | - | 50 |
| AOP65-NS35 | - | 65 | - | 35 |
| AOP75-NS25 | - | 75 | - | 25 |
| AOP85-NS15 | - | 85 | - | 15 |
| AOP90-NS10 | - | 90 | - | 10 |
| Sample | Moisture Content (%) | EMC (%) |
|---|---|---|
| MD | - | 14.3 ± 0.4 a,b |
| NS | - | 13.8 ± 0.2 b,c,d |
| COP | 4.05 ± 0.04 a | 12.9 ± 0.1 c,d,e |
| AOP | 3.69 ± 0.02 b | 15.2 ± 0.6 a |
| COP50-MD50 | 4.18 ± 0.04 c,d | 14.0 ± 0.1 b,c |
| COP65-MD35 | 3.87 ± 0.06 e | - |
| COP75-MD25 | 4.60 ± 0.05 f,g | - |
| COP85-MD15 | 4.06 ± 0.04 d,a | - |
| COP90-MD10 | 4.81 ± 0.03 h,i | 12.9 ± 0.1 c,d,e |
| COP50-NS50 | 4.04 ± 0.03 a | 12.7 ± 0.3 d,e |
| COP65-NS35 | 3.69 ± 0.04 b | - |
| COP75-NS25 | 4.69 ± 0.04 i,f | - |
| COP85-NS15 | 4.25 ± 0.05 c | - |
| COP90-NS10 | 3.84 ± 0.05 e | 10.7 ± 0.2 f |
| AOP50-MD50 | 4.20 ± 0.06 c | 13.5 ± 0.1 b,c,d |
| AOP65-MD35 | 4.50 ± 0.04 g | - |
| AOP75-MD25 | 4.20 ± 0.04 c | - |
| AOP85-MD15 | 4.61 ± 0.03 f,g | - |
| AOP90-MD10 | 4.70 ± 0.02 i,f | 12.6 ± 0.2 d,e |
| AOP50-NS50 | 3.80 ± 0.02 e,b | 12.3 ± 0.3 e |
| AOP65-NS35 | 4.28 ± 0.05 c | - |
| AOP75-NS25 | 3.91 ± 0.02 e | - |
| AOP85-NS15 | 4.87 ±0.05 h | - |
| AOP90-NS10 | 3.83 ± 0.05 e | 12.6 ± 0.3 d,e |
| Sample | Encapsulation Efficiency (EE, %) |
|---|---|
| COP50-MD50 | 23.9 ± 0.1 a |
| COP65-MD35 | 35.9 ± 0.1 b |
| COP75-MD25 | 56.9 ± 0.1 c |
| COP85-MD15 | 94.9 ± 0.1 d |
| COP90-MD10 | 94.4 ± 0.1 e |
| COP50-NS50 | 18.5 ± 0.1 f |
| COP65-NS35 | 23.9 ± 0.1 a |
| COP75-NS25 | 50.0 ± 0.1 g |
| COP85-NS15 | 80.4 ± 0.1 h |
| COP90-NS10 | 80.1 ± 0.1 i |
| AOP50-MD50 | 23.7 ± 0.1 a |
| AOP65-MD35 | 20.1 ± 0.1 j |
| AOP75-MD25 | 50.3 ± 0.1 g |
| AOP85-MD15 | 89.4 ± 0.1 k |
| AOP90-MD10 | 88.5 ± 0.0 l |
| AOP50-NS50 | 15.4 ± 0.0 m |
| AOP65-NS35 | 33.5 ± 0.1 n |
| AOP75-NS25 | 44.9 ± 0.1 o |
| AOP85-NS15 | 70.1 ± 0.1 p |
| AOP90-NS10 | 69.6 ± 0.1 q |
| Analytes | Linear Range (mg L−1) | Slope | Intercept | R2 |
|---|---|---|---|---|
| TYR | 1.44–10.80 | 26,107 ± 644 | −10,508 ± 3875 | 0.990 |
| HTYR | 5.48–41.10 | 50,833 ± 704 | −37,434 ± 6046 | 0.998 |
| Sample | Polyphenol Content (mg/100 g of Food Powder) | |
|---|---|---|
| HTYR | TYR | |
| COP | 123.2 ± 0.3 a | 27.1 ± 0.5 |
| AOP | 103.1 ± 0.3 b | - |
| COP50-MD50 | 51.9 ± 0.4 c | - |
| COP90-MD10 | 111.3 ± 0.3 d | - |
| ACO50-MD50 | 50.1 ± 0.4 c | - |
| ACO90-MD10 | 91.2 ± 0.3 e | - |
| NIR | MIR | |
|---|---|---|
| Spectral Region | 1707–1808 nm | 5650–6800 nm |
| Preprocessing | Second derivative | SNV |
| MD | ||
| R2 Cal | 0.975 | 0.982 |
| EV (%) | 92.83 | 96.72 |
| CP | 3 | 2 |
| NS | ||
| R2 Cal | 0.971 | 0.982 |
| EV (%) | 86.92 | 96.93 |
| CP | 3 | 2 |
Disclaimer/Publisher’s Note: The statements, opinions and data contained in all publications are solely those of the individual author(s) and contributor(s) and not of MDPI and/or the editor(s). MDPI and/or the editor(s) disclaim responsibility for any injury to people or property resulting from any ideas, methods, instructions or products referred to in the content. |
© 2024 by the authors. Licensee MDPI, Basel, Switzerland. This article is an open access article distributed under the terms and conditions of the Creative Commons Attribution (CC BY) license (https://creativecommons.org/licenses/by/4.0/).
Share and Cite
González, N.; Pacheco, C.; Grafia, A.L.; Razuc, M.F.; Acebal, C.C.; López, O.V. Food Functional Powders with Redox Capacity and Antioxidant Properties Obtained from Food Losses and Waste of Olive Oil Industry. Processes 2024, 12, 2666. https://doi.org/10.3390/pr12122666
González N, Pacheco C, Grafia AL, Razuc MF, Acebal CC, López OV. Food Functional Powders with Redox Capacity and Antioxidant Properties Obtained from Food Losses and Waste of Olive Oil Industry. Processes. 2024; 12(12):2666. https://doi.org/10.3390/pr12122666
Chicago/Turabian StyleGonzález, Natalia, Consuelo Pacheco, Ana Luisa Grafia, Mariela Fernanda Razuc, Carolina Cecilia Acebal, and Olivia Valeria López. 2024. "Food Functional Powders with Redox Capacity and Antioxidant Properties Obtained from Food Losses and Waste of Olive Oil Industry" Processes 12, no. 12: 2666. https://doi.org/10.3390/pr12122666
APA StyleGonzález, N., Pacheco, C., Grafia, A. L., Razuc, M. F., Acebal, C. C., & López, O. V. (2024). Food Functional Powders with Redox Capacity and Antioxidant Properties Obtained from Food Losses and Waste of Olive Oil Industry. Processes, 12(12), 2666. https://doi.org/10.3390/pr12122666