
Comprehensive Analysis of the Annulus Pressure Buildup in Wells with Sustained Gas Leakage Below the Liquid Level

Abstract
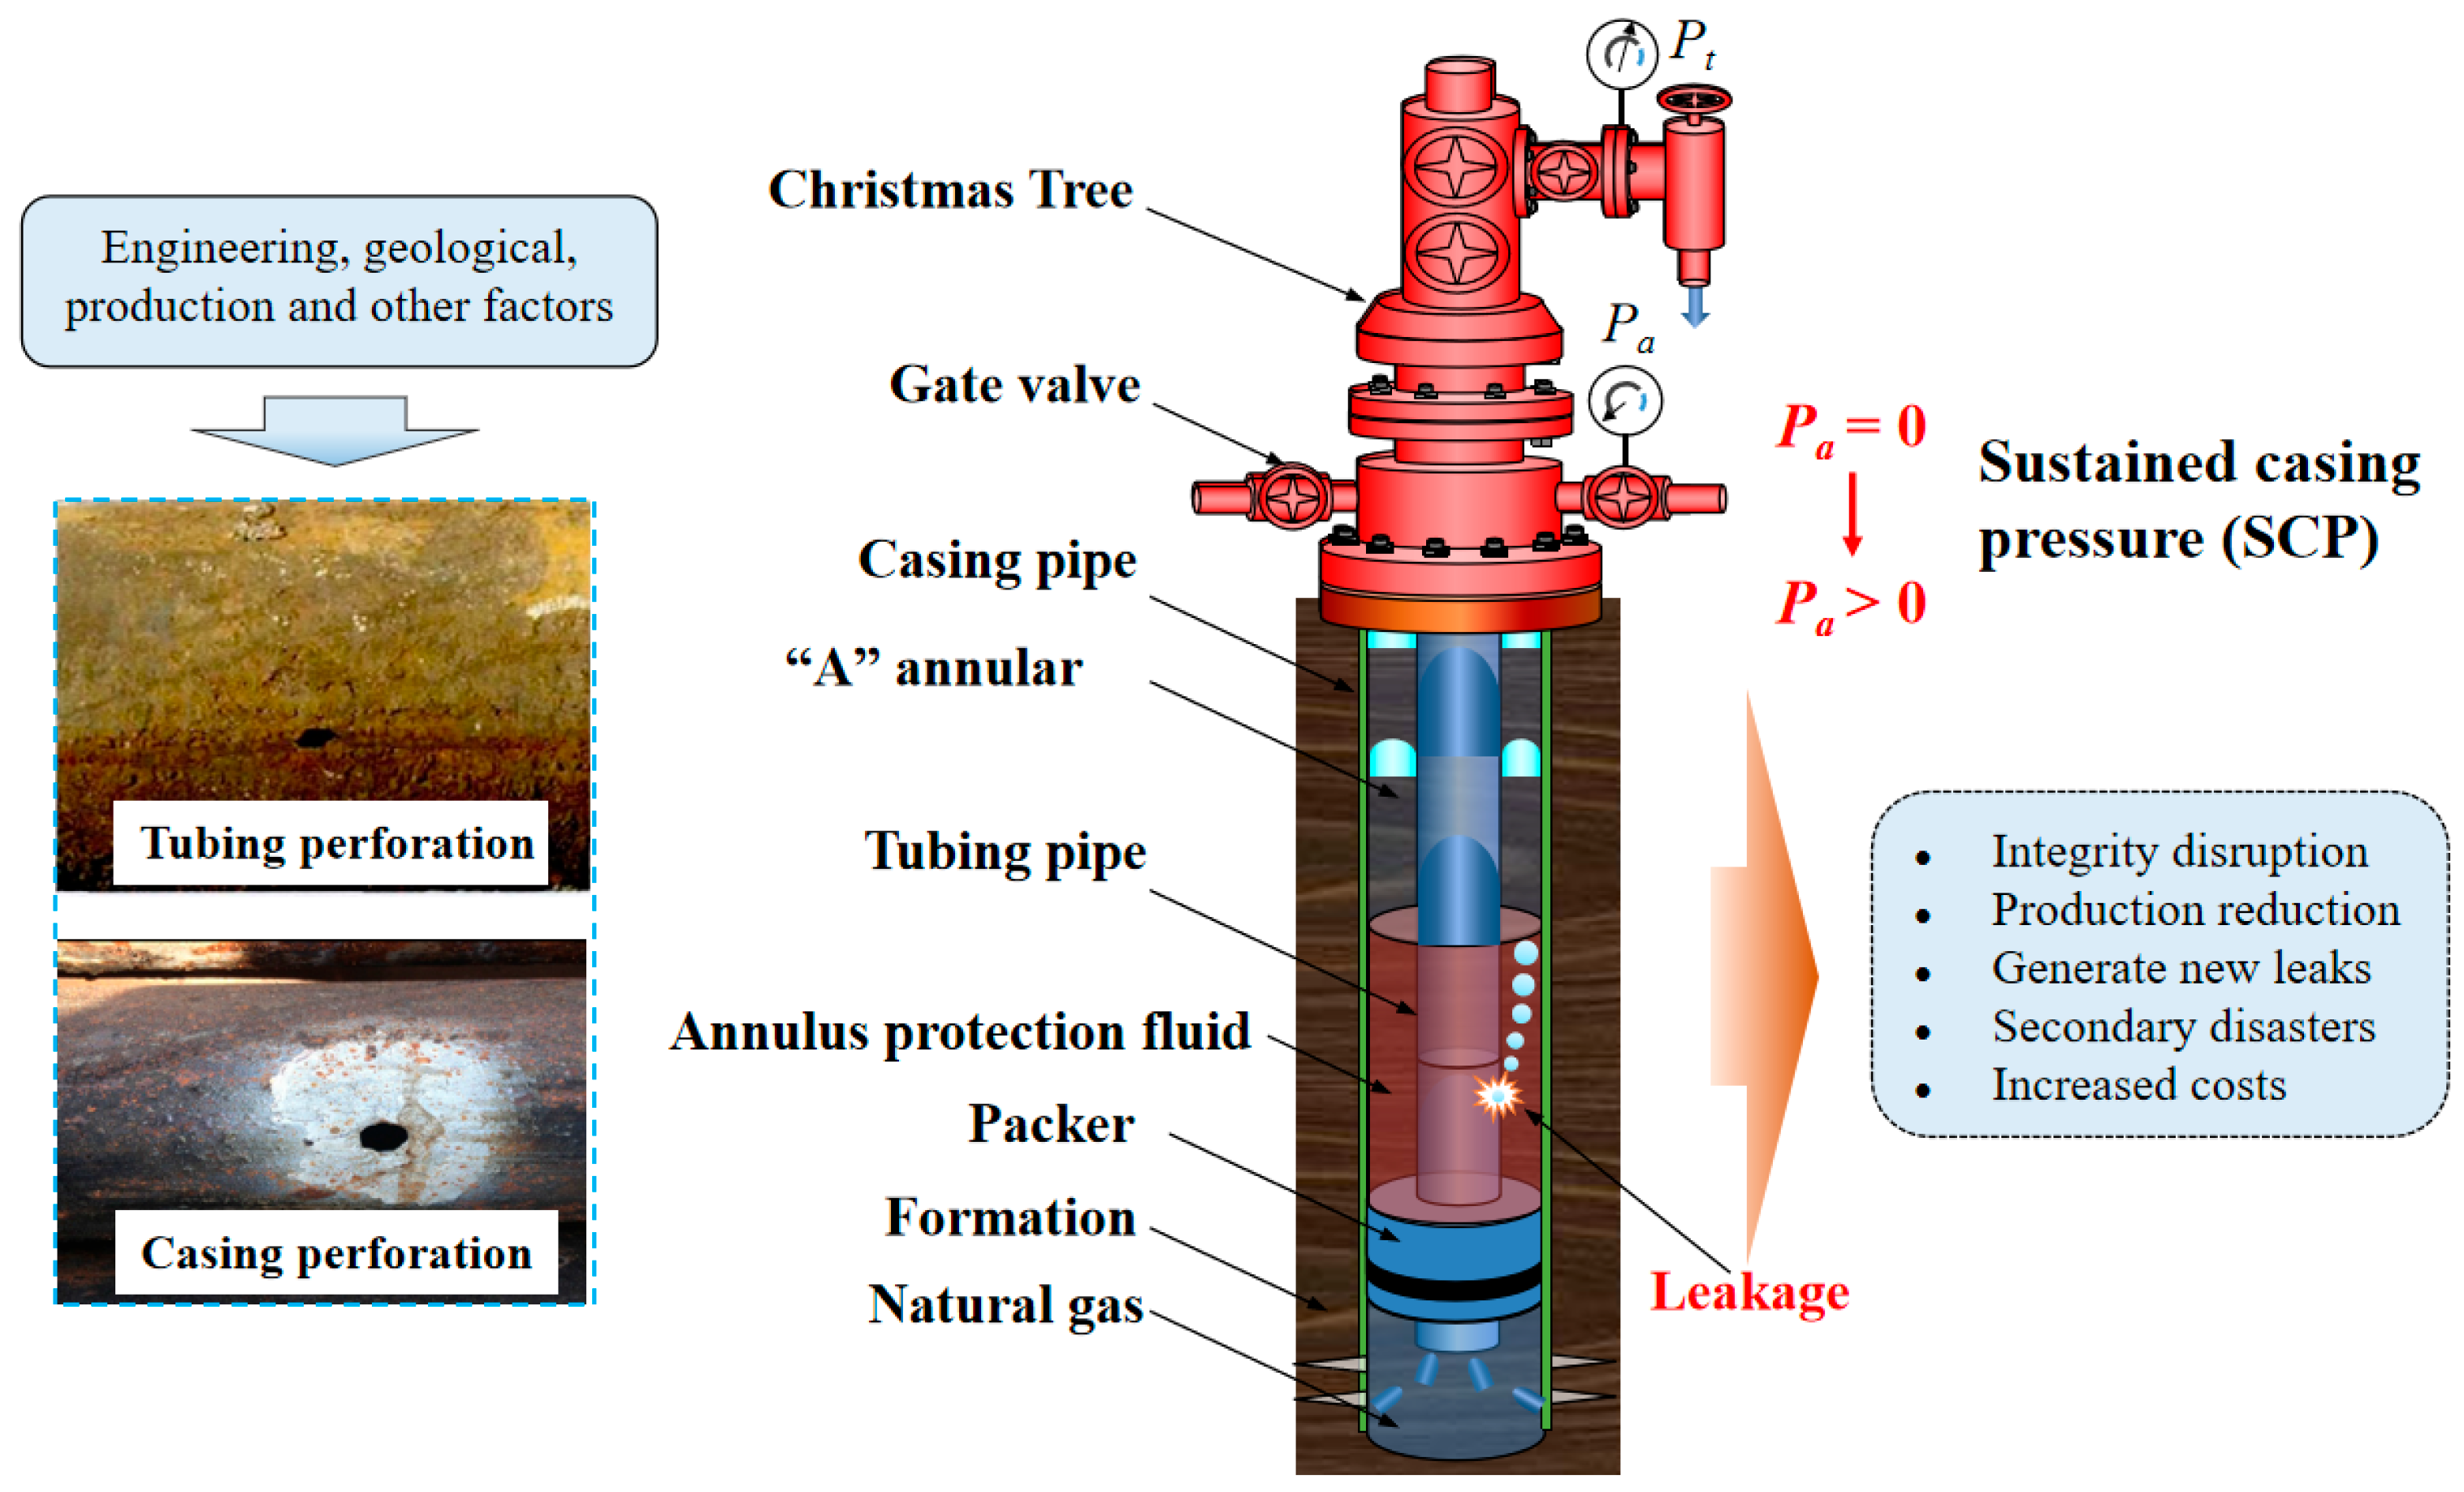
1. Introduction
2. Experimental Methodology
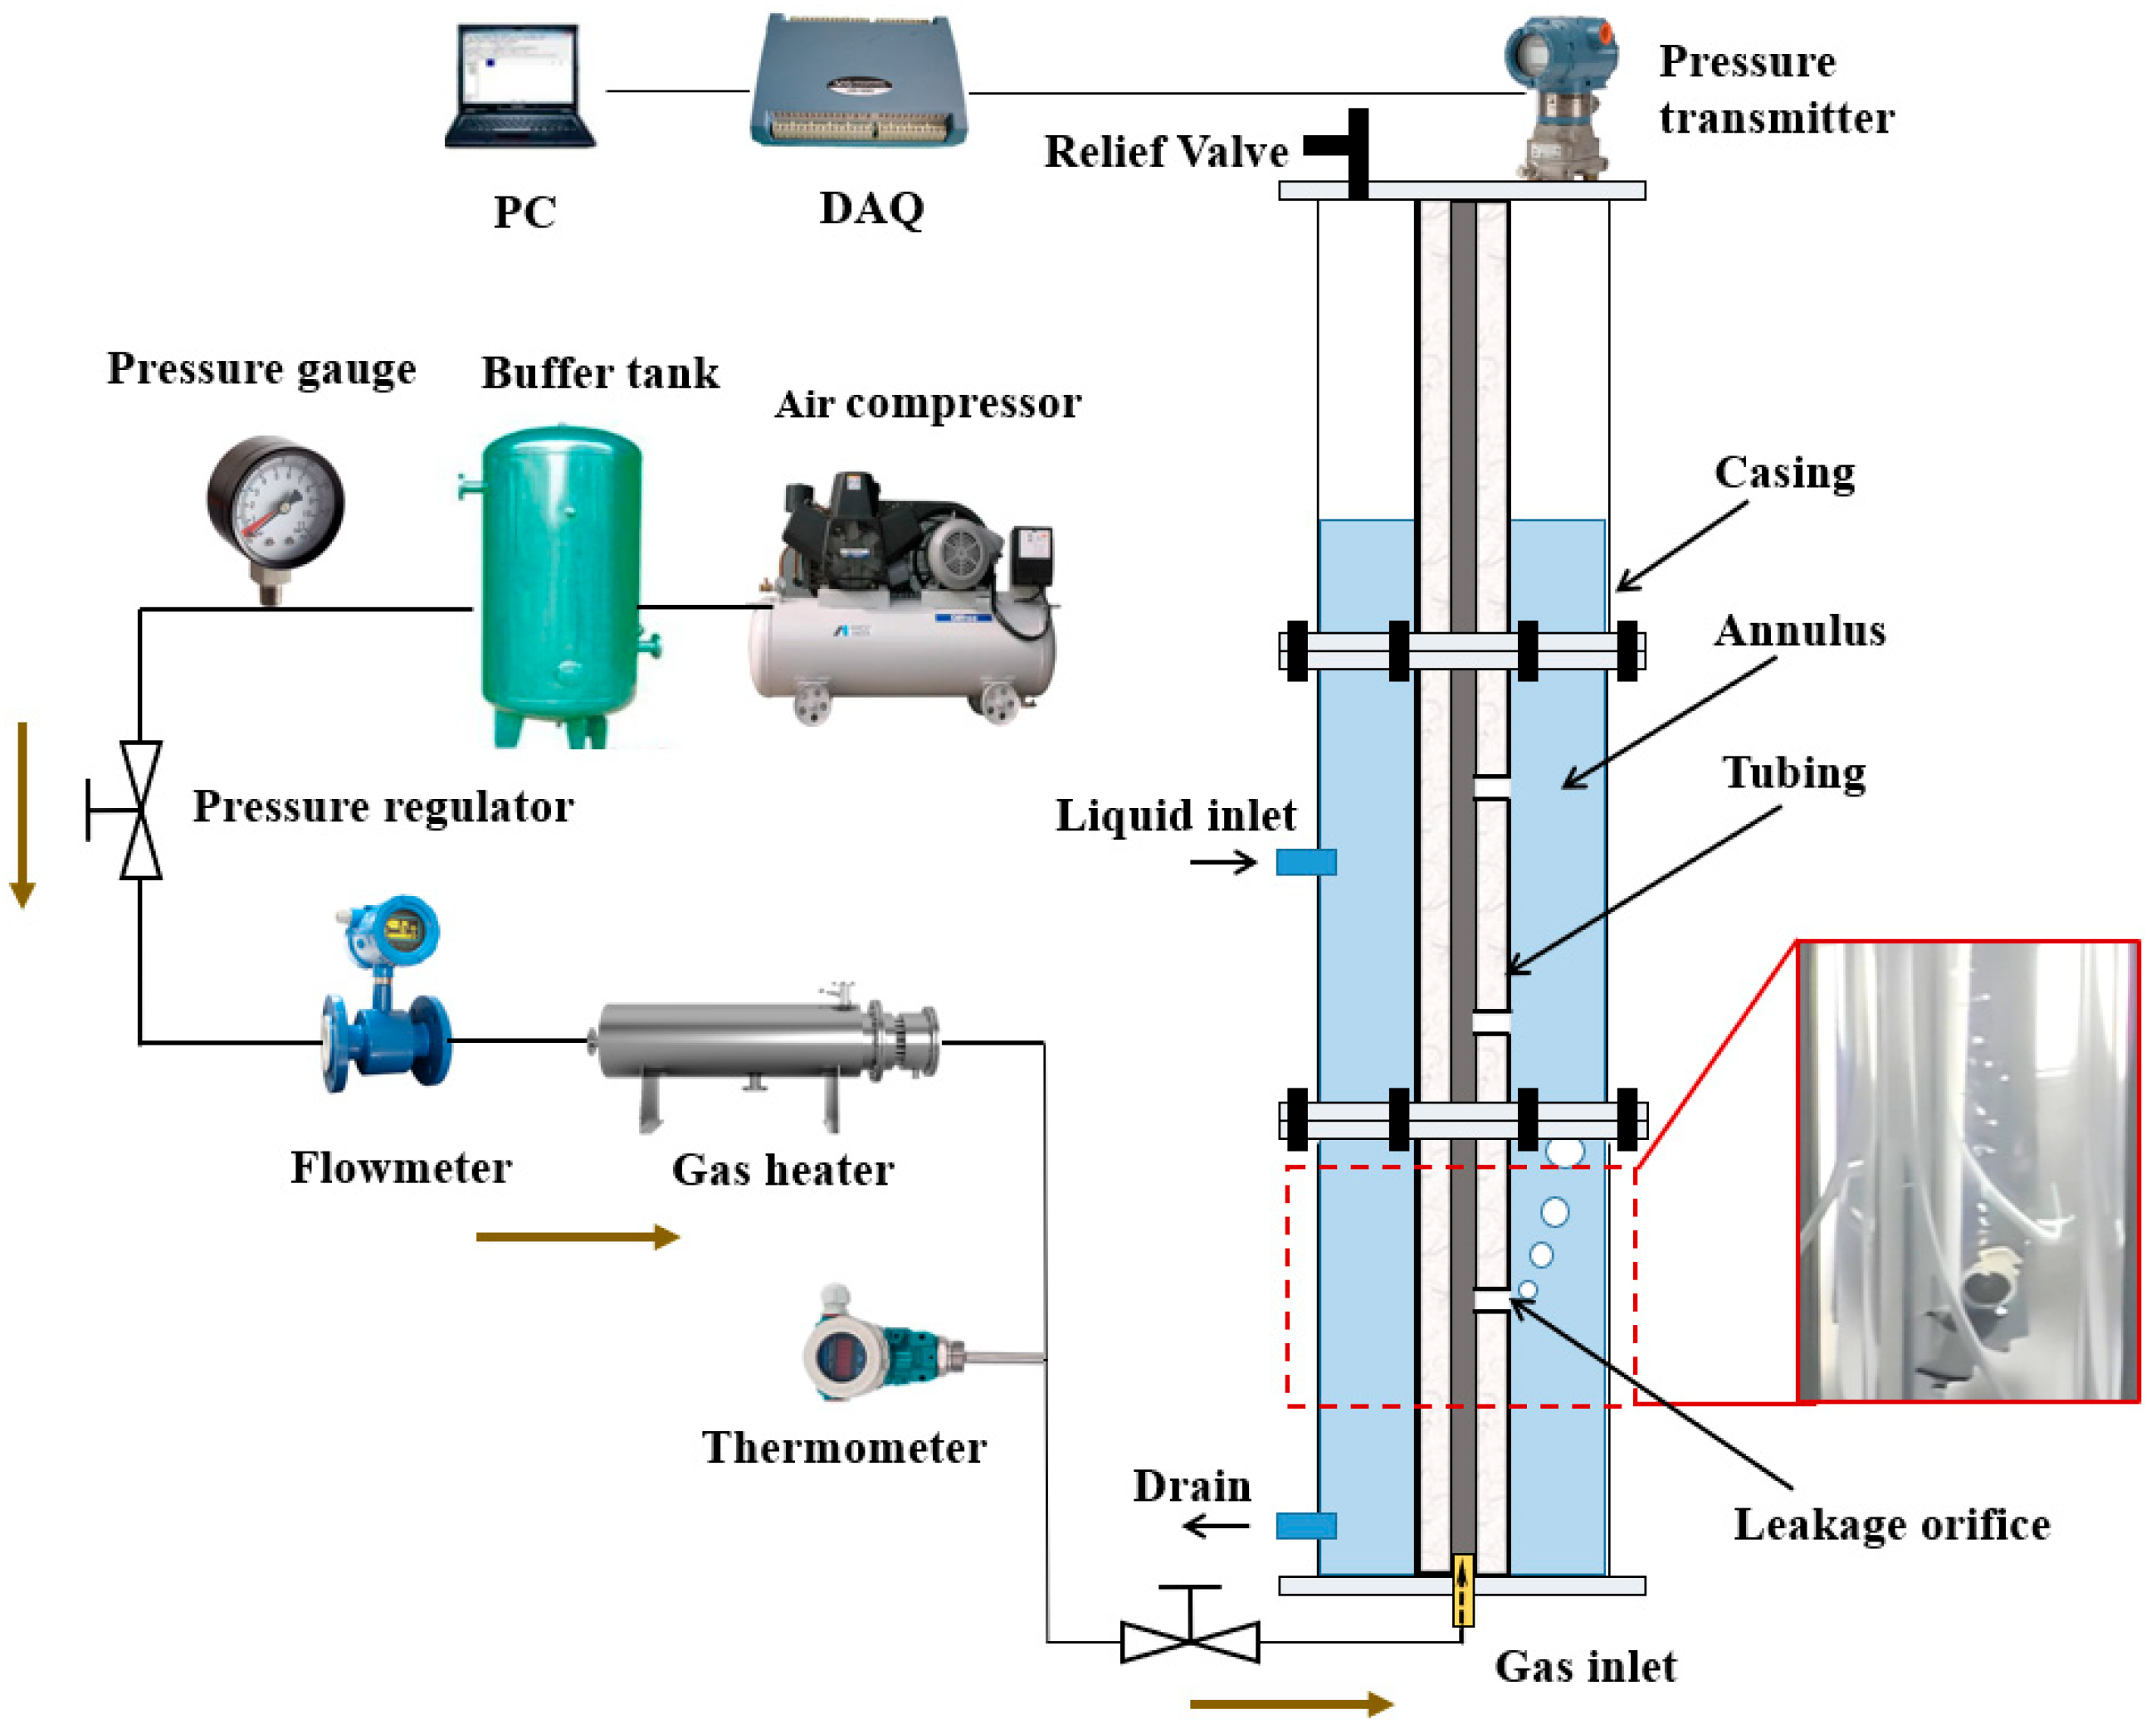
2.1. Experimental Setup
2.2. Experimental Procedure
3. Experimental Results and Analysis
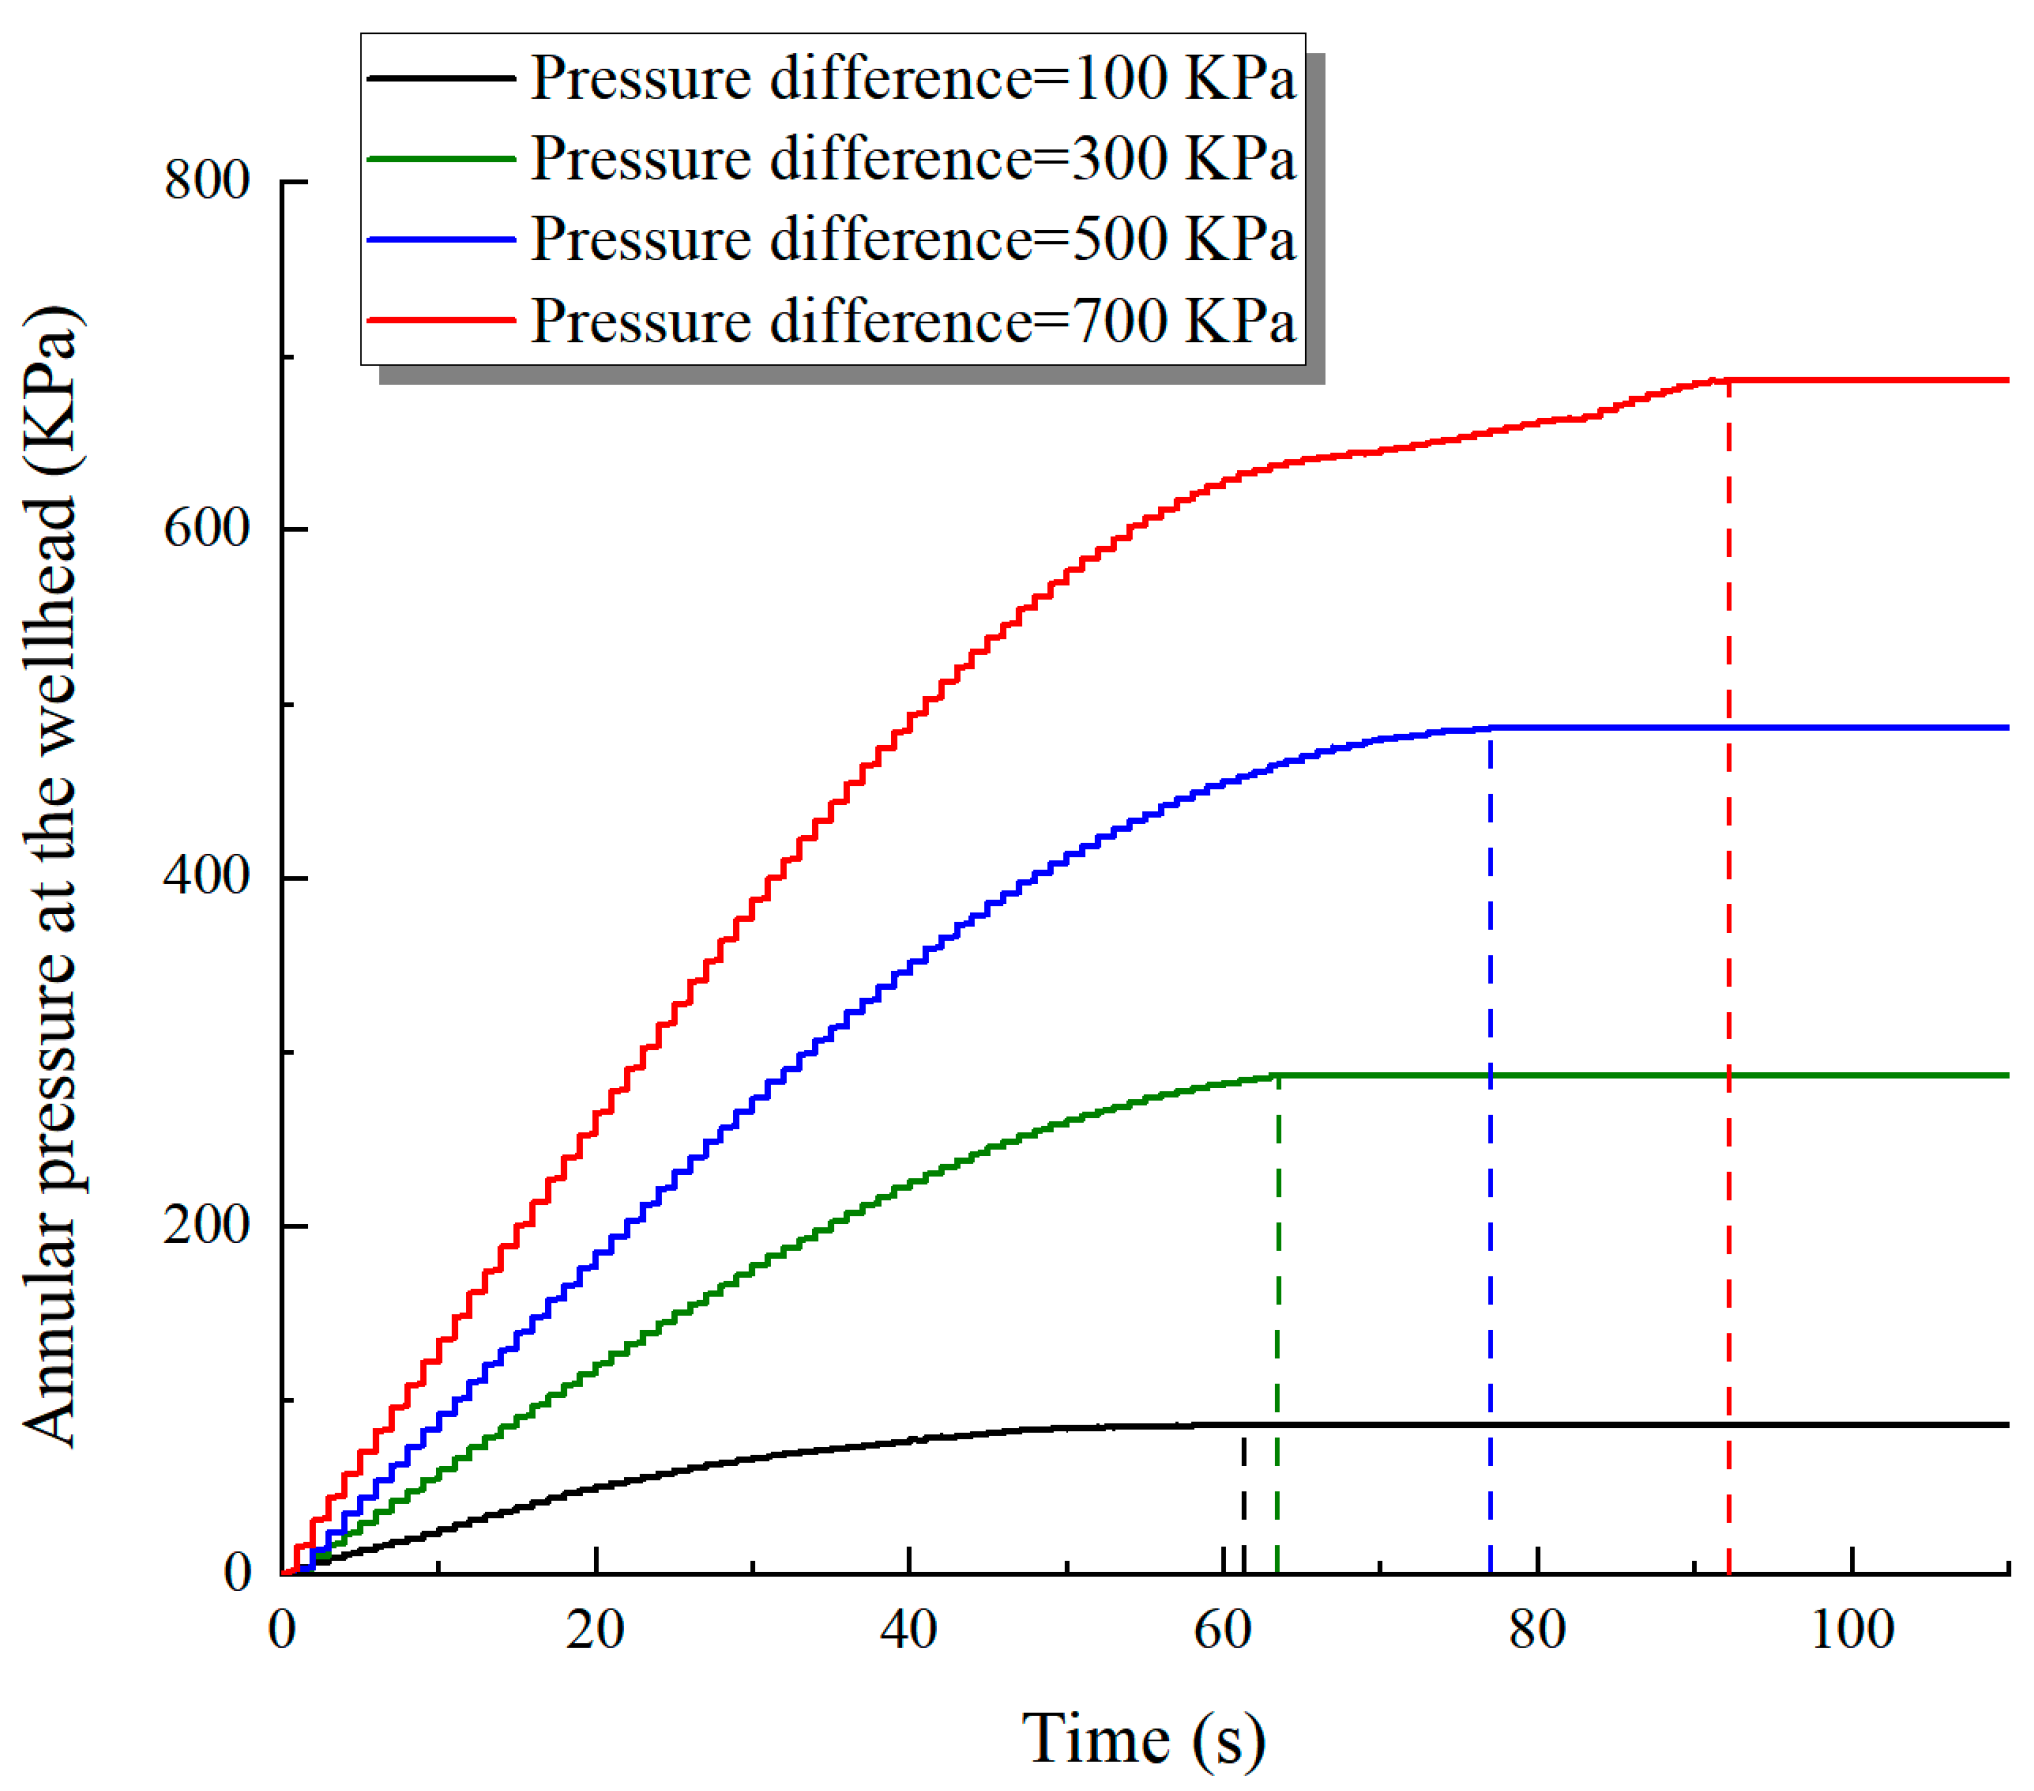
3.1. Effect of Pressure Difference Between the Tubing and Casing
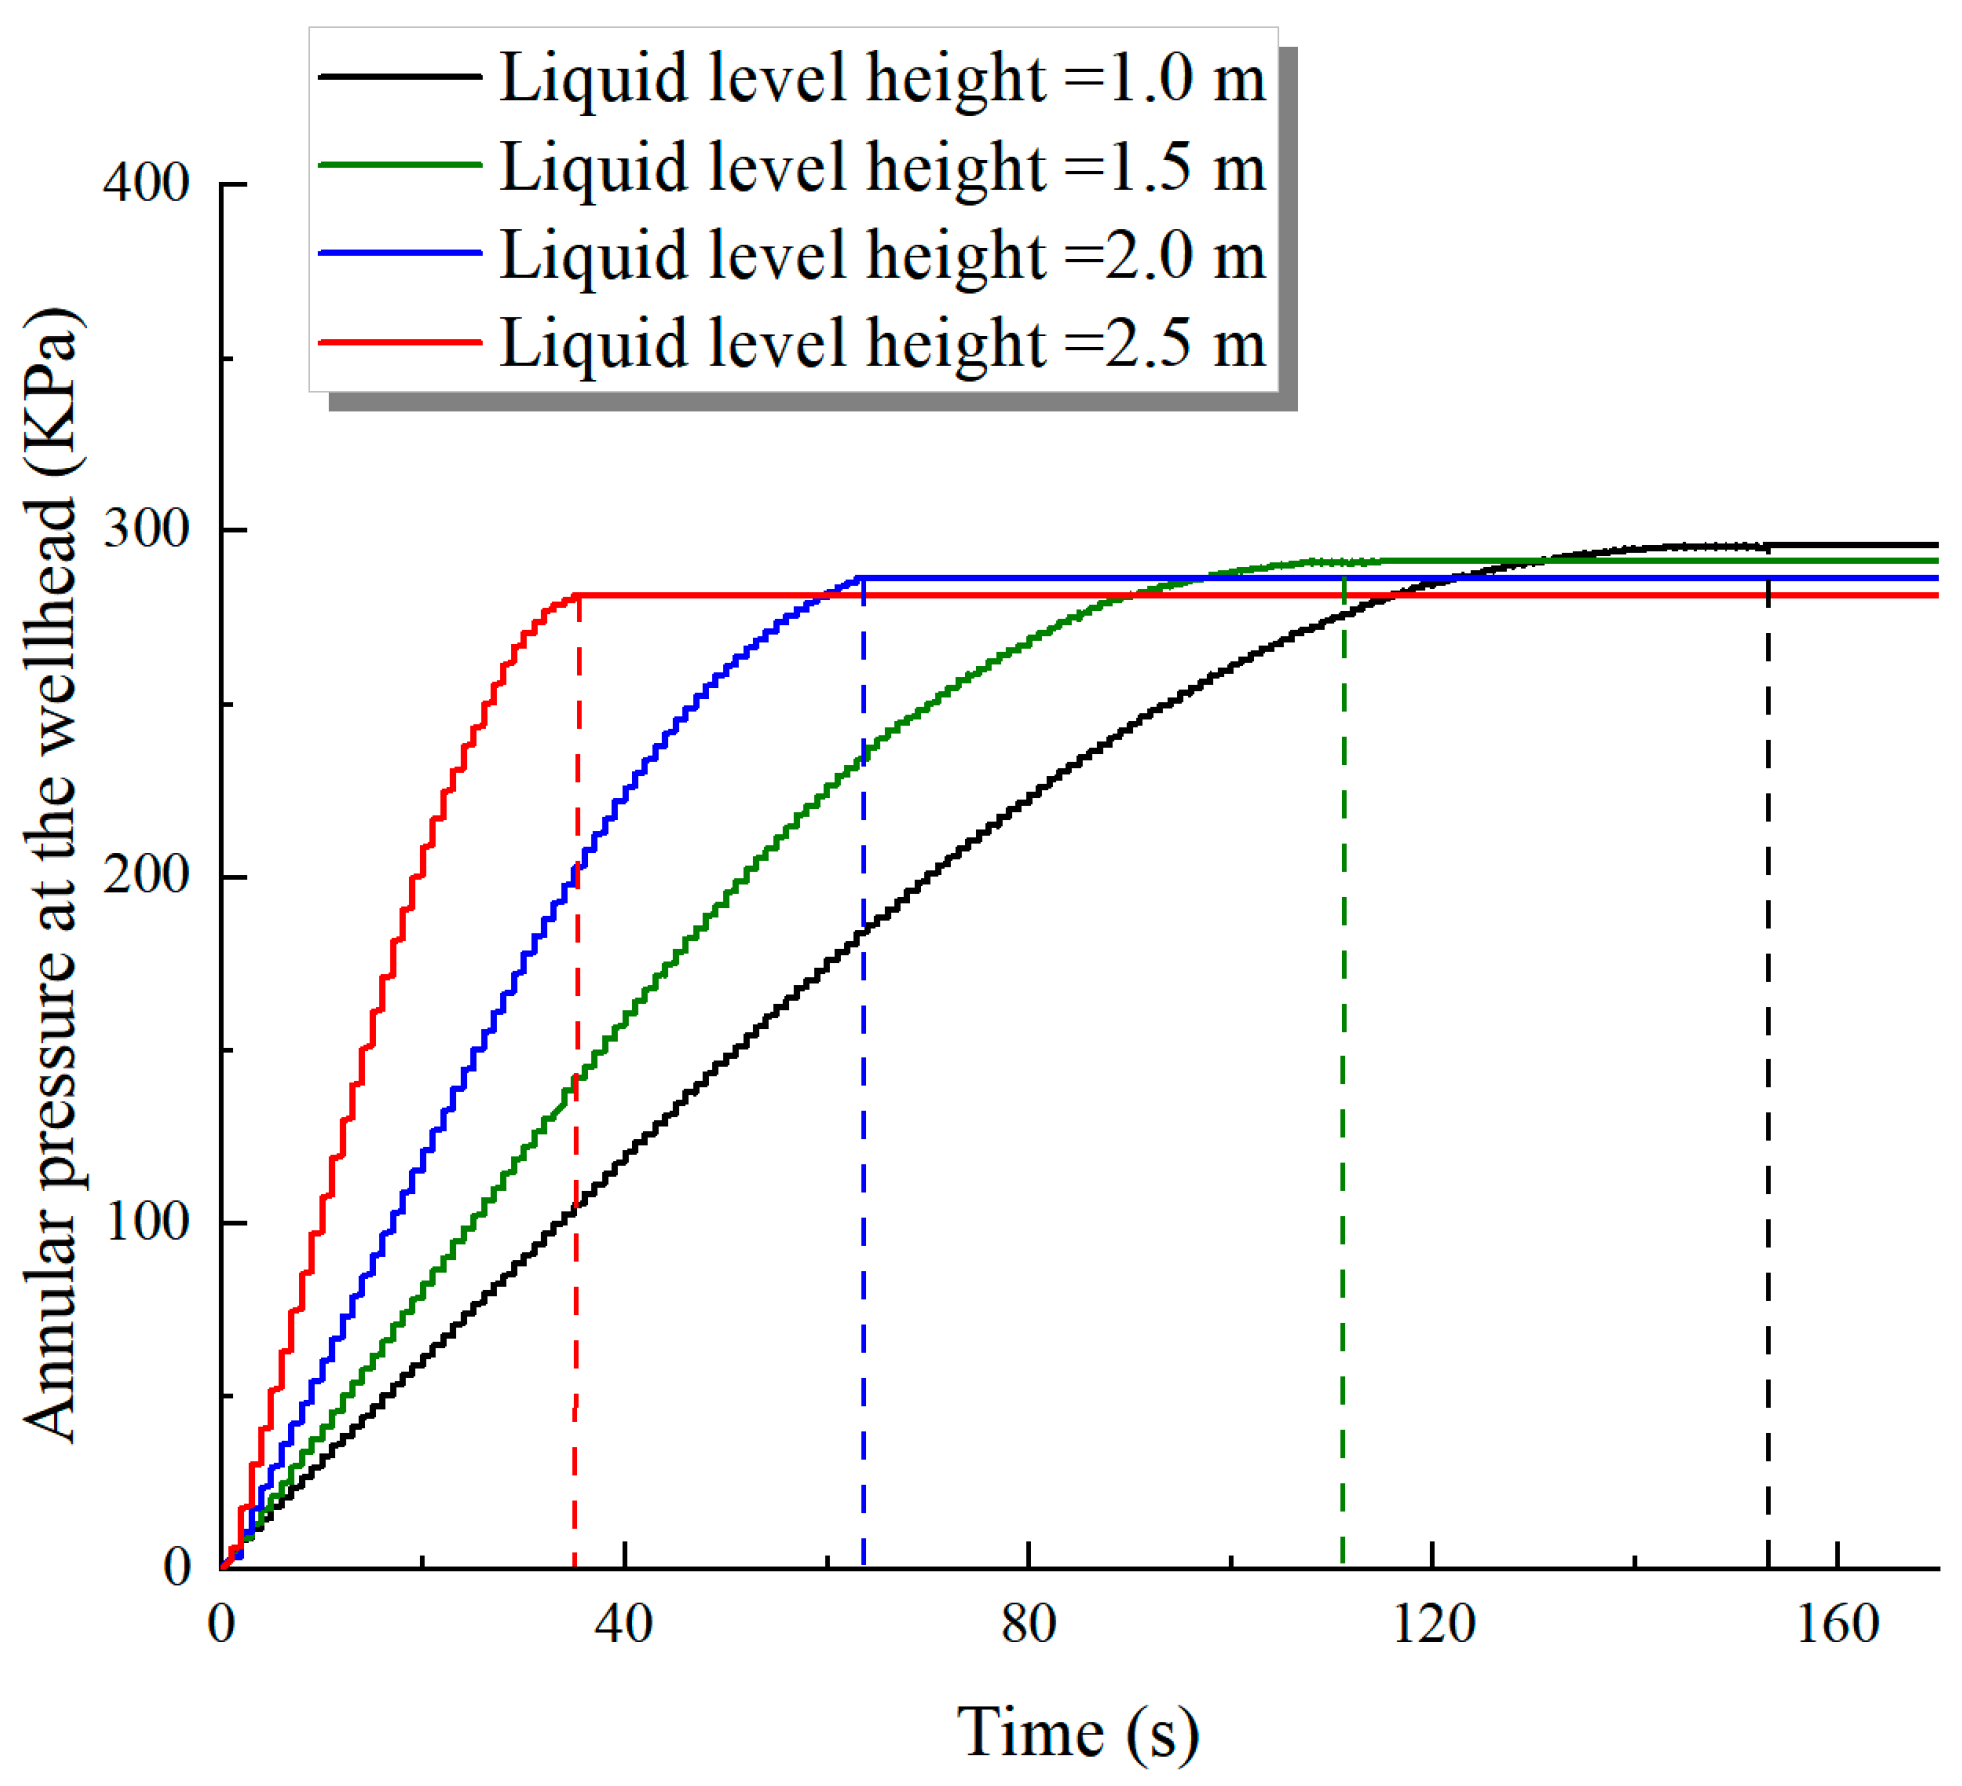
3.2. Effect of Liquid Level Height
3.3. Effect of Gas Temperature
3.4. Effect of Leakage Position
3.5. Effect of Leakage Orifice Diameter
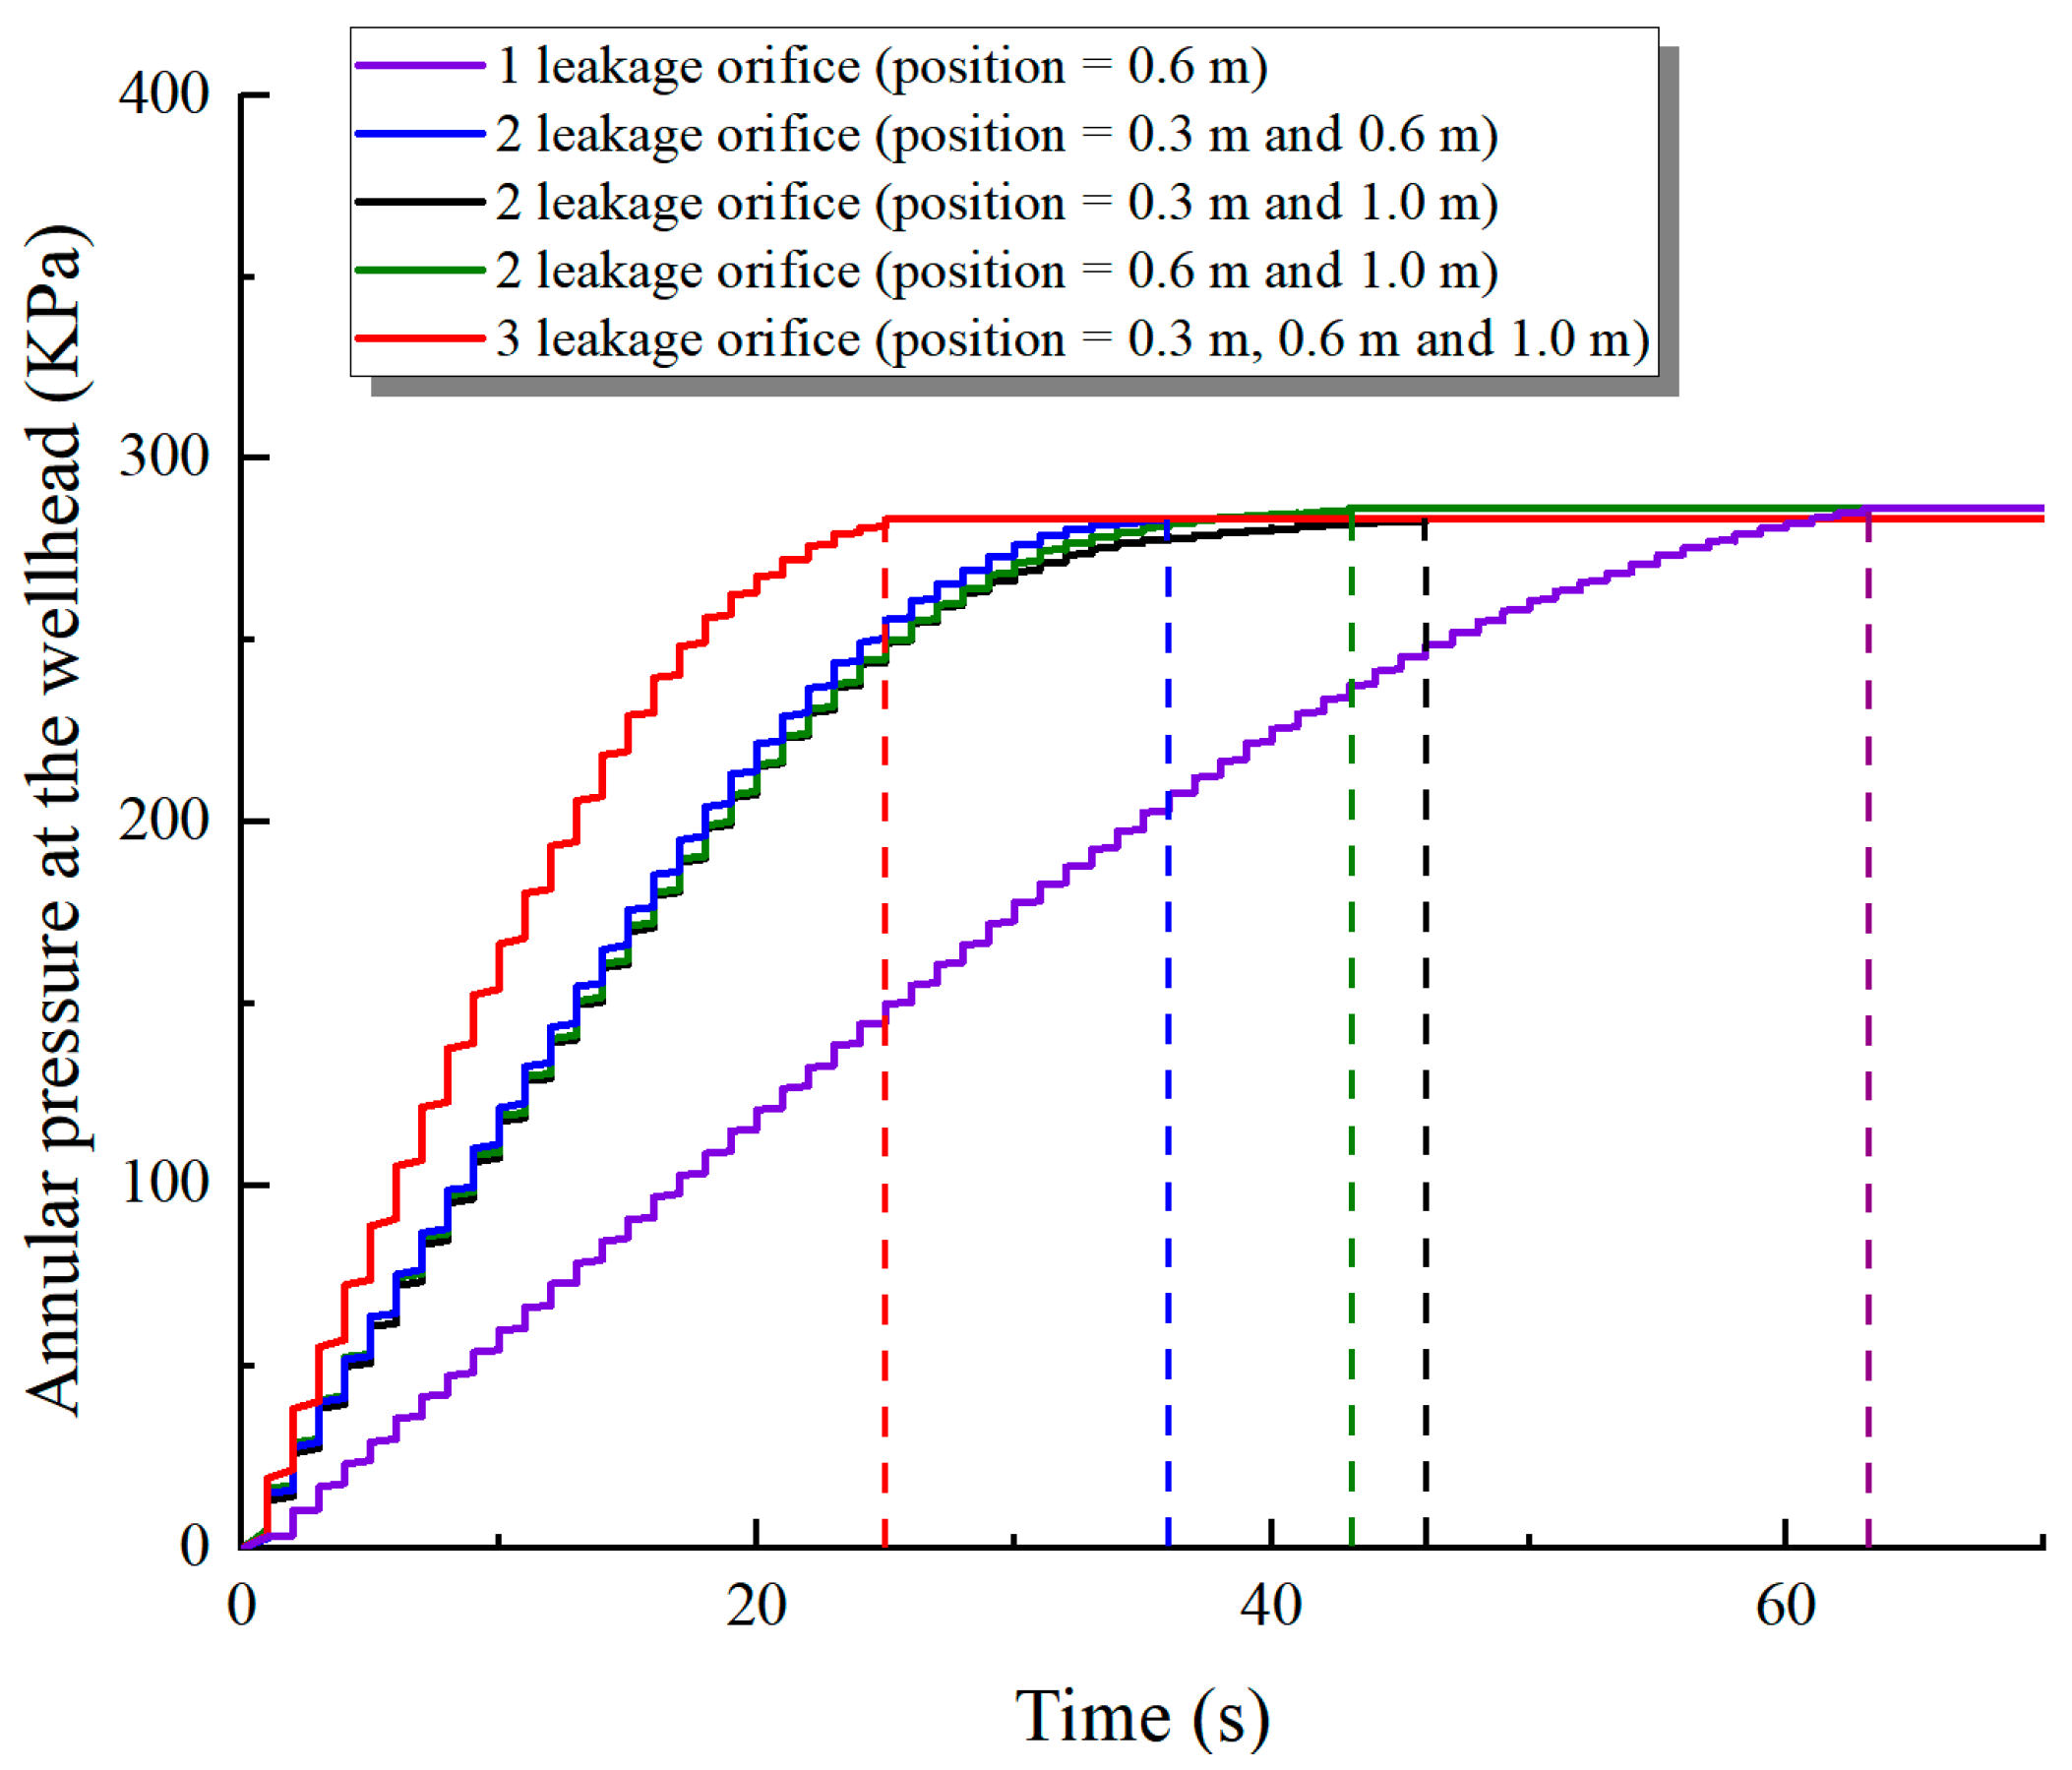
3.6. Effect of Leakage Orifice Quantity
4. Predictive Model of the Pressure Buildup in the Annulus
4.1. Bubble Generation Below Liquid Surface
4.2. Bubbles Moving Upwards in the Fluid
4.3. Model Establishment
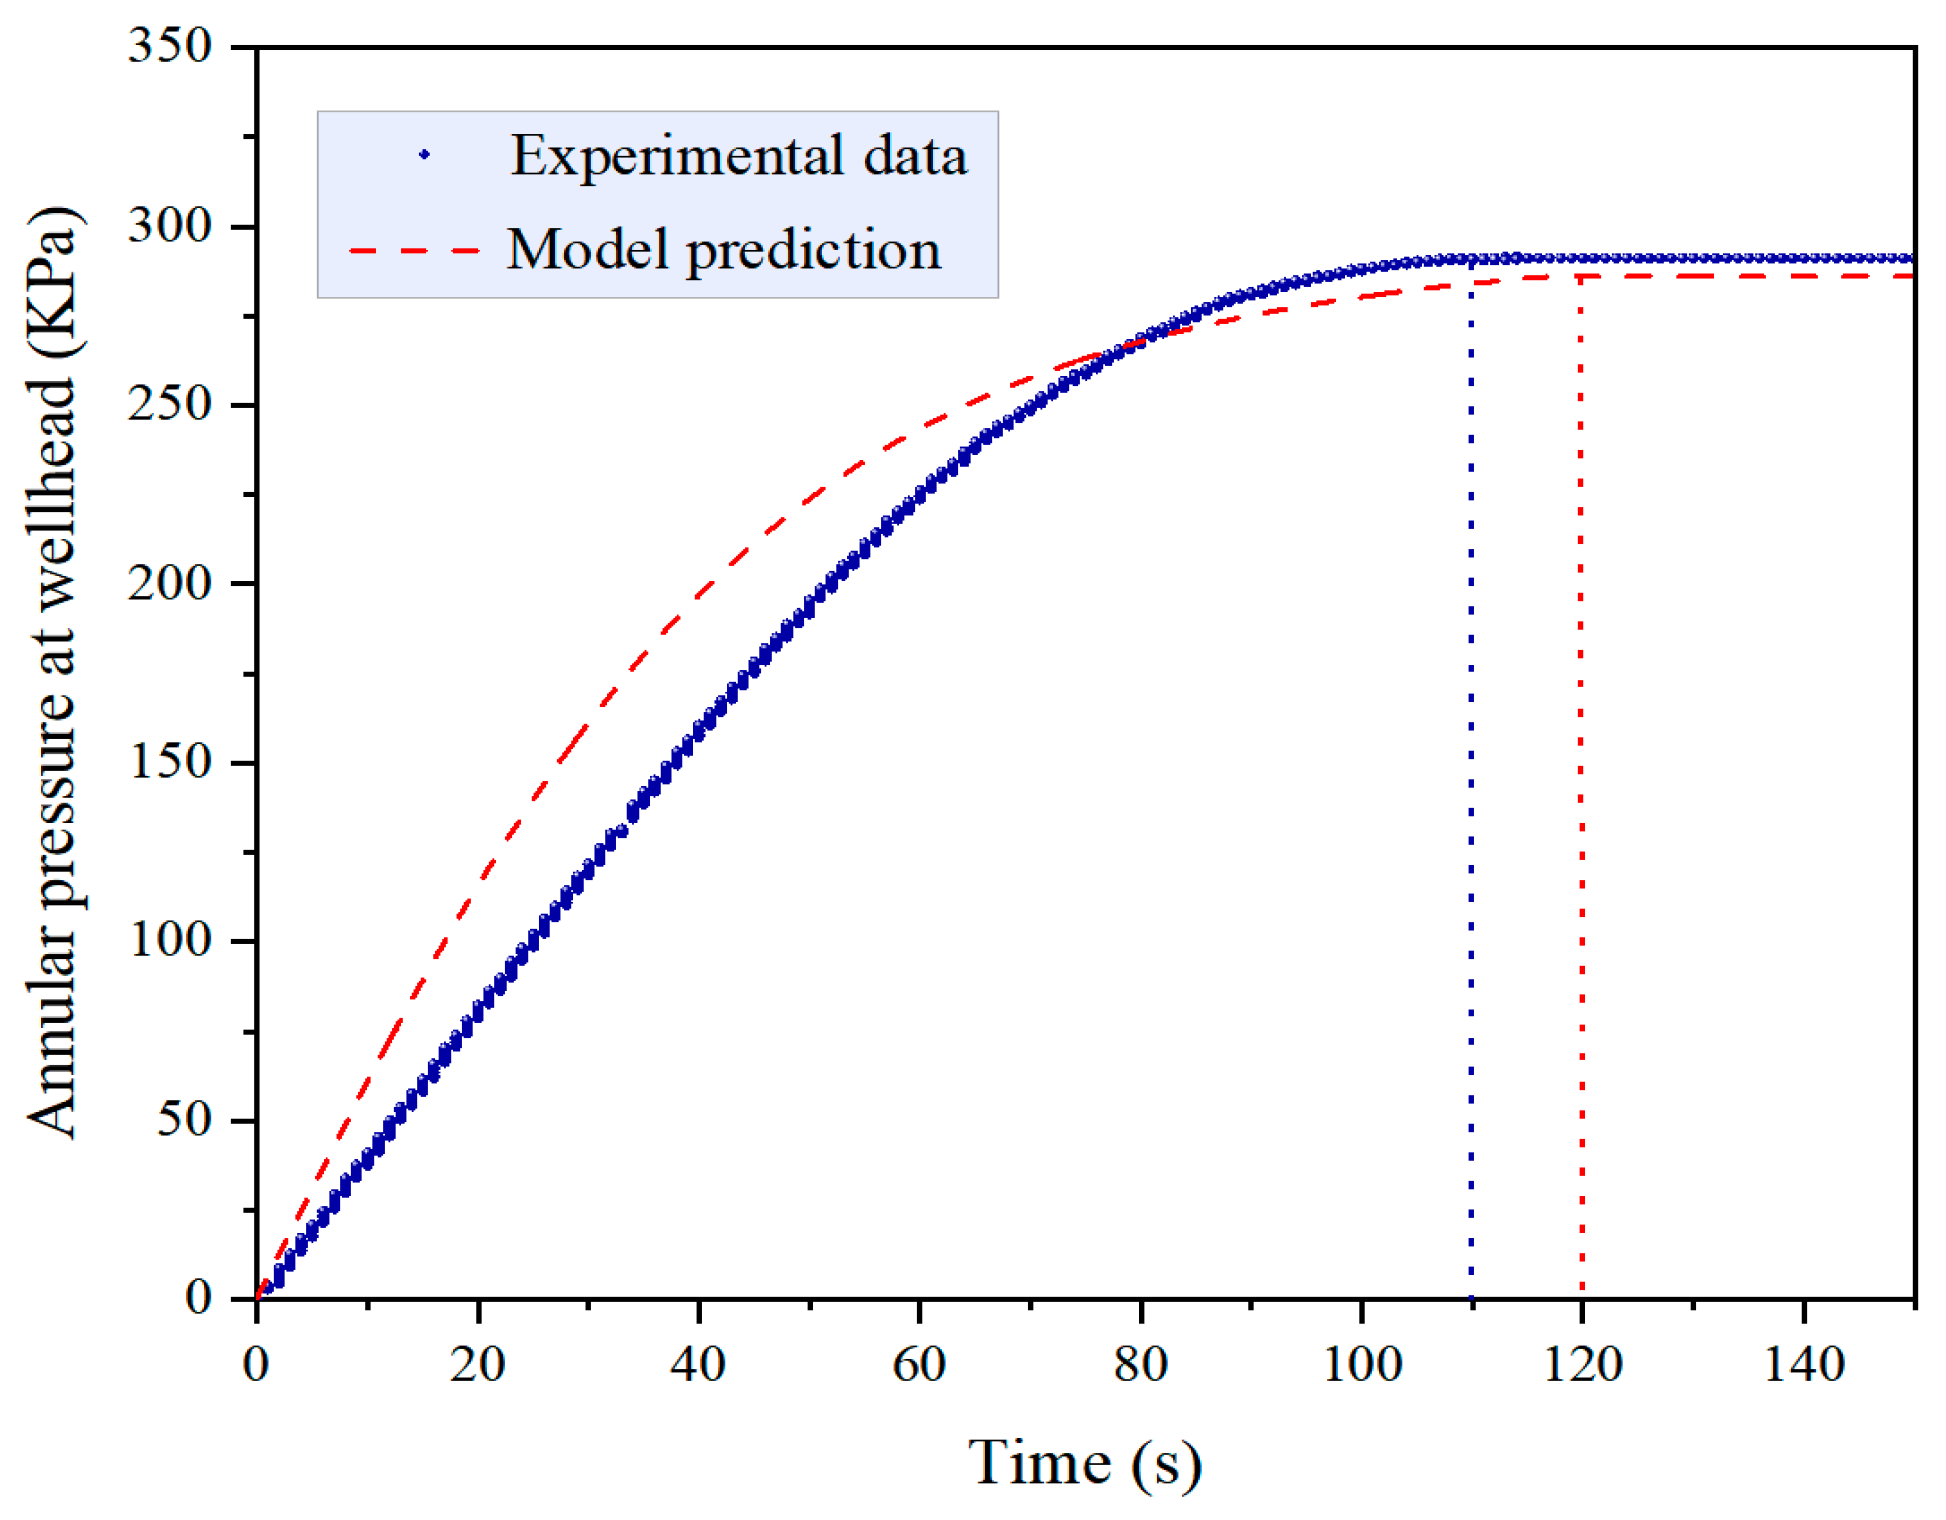
4.4. Model Validation
5. Conclusions
- Based on the rigorous experimental investigation on the annulus pressure buildup caused by tubing leakage below the liquid, the effects of the pressure difference between the tubing and casing, the liquid level height, the gas temperature, the leakage position, the leakage orifice diameter, and the quantity on the annulus pressure buildup patterns were explored. After tubing leakage, the time required for the annulus pressure at the wellhead to reach equilibrium decreased with an increase in the pressure difference between the tubing and casing, liquid level height, and leakage orifice diameter and quantity. Conversely, this equilibrium time extended with an increase in the leakage position and gas temperature;
- According to the theory of gas fluid dynamics, the evolution mechanism of the annulus pressure during the generation of bubbles and the migration towards the top of the annulus were analyzed, and a predictive model of the pressure buildup of annulus was established. The variation in annular pressure at the wellhead after gas leakage can be predicted through the new model;
- The new model was compared and validated against the experimental results; it could be seen that the prediction model could effectively predict the equilibrium attainment time and the equilibrium value of the annular pressure at the wellhead, with R2 of 0.951 and 0.996, respectively. This demonstrates the validity of the prediction model, which can serve as a theoretical reference for advancing the diagnostic technology of SCP in the annulus of gas wells caused by sustained gas leakage below the liquid level.
Author Contributions
Funding
Data Availability Statement
Conflicts of Interest
Abbreviations
| Nomenclature | |
| a, b, j, k | index of the bubble after leakage |
| ab | acceleration of a bubble |
| CD | drag coefficient |
| cm | volume compression coefficient of the annular protective fluid |
| db | equivalent diameter of bubble detachment |
| dch | equivalent diameter of the leakage orifice |
| Ff | viscous drag force on a bubble |
| Fg | gravity of a bubble |
| Fl | buoyancy of a bubble |
| Fσ | additional surface force on a bubble |
| g | gravitational acceleration |
| hf | liquid level height |
| hg | leakage orifice height |
| i | index of the time interval after leakage |
| k | adiabatic index of gas |
| mg | mass of a bubble |
| Nbs | amount of substance of a bubble |
| Ng | total amount of substance in the gas column |
| P1 | pressure on one side of the tubing at the leakage orifice |
| P2 | pressure on one side of the annulus at the leakage orifice |
| PA | annular pressure at the wellhead |
| Pbs | pressure of a bubble |
| Qc | gas flow rate |
| R | gas constant |
| Re | Reynolds number of moving a bubble |
| S | displacement of a bubble |
| T1 | gas temperature in the tubing |
| T1k | temperature on one side of the annulus at the leakage orifice |
| Tbs | temperature of a bubble |
| Twh | annular temperature at wellhead |
| Vbs | volume of a bubble |
| Vb | increment in bubble volume within the liquid column |
| Vbo | total volume of bubbles entering the gas column over a time period |
| Vg | gas volume in the gas column |
| Vy | volume of liquid column in the annulus |
| vg | vertical upward velocity of a bubble |
| Z1 | gas deviation factor |
| Greek letters | |
| σ | surface tension of a bubble |
| θ | angle of a bubble emanating from leakage orifice |
| ρg | gas density at the leakage orifice |
| ρy | density of annulus protection fluid |
| Δt | The duration of a bubble to expand and detach from the leakage orifice |
| ΔVy | volume compression of the liquid column due to increased annular pressure over a time period |
| μl | dynamic viscosity of liquid |
| γg | relative density of gas |
References
- Jaculli, M.A.; Choueri, N.; Mata, C.R.; Leite, A.G.A.S.; Mendes, J.R.P.; Colombo, D. Well safety and integrity evaluation of offshore wells: A review of past, present, and future. J. Petrol. Sci. Eng. 2022, 212, 110329. [Google Scholar] [CrossRef]
- Ramadan, M.A.; Salehi, S.; Kwatia, G.; Ezeakacha, C.; Teodoriu, C. Experimental investigation of well integrity: Annular gas migration in cement column. J. Petrol. Sci. Eng. 2019, 179, 126–135. [Google Scholar] [CrossRef]
- Liu, J.G.; Fan, H.H.; Peng, Q.; Deng, S.; Kang, B.; Ren, W.Y. Research on the prediction model of annular pressure buildup in subsea wells. J. Nat. Gas. Sci. Eng. 2015, 27, 1677–1683. [Google Scholar] [CrossRef]
- Cahill, A.G.; Sofia, P.; Samano, G. Prioritizing stewardship of decommissioned onshore oil and gas wells in the United Kingdom based on risk factors associated with potential long-term integrity. Int. J. Greenh. Gas Control 2022, 114, 103560. [Google Scholar] [CrossRef]
- Wu, S.G.; Zhang, L.B.; Fan, J.C.; Zhang, X.M.; Liu, D.; Wang, D.G. A leakage diagnosis testing model for gas wells with sustained casing pressure from offshore platform. J. Nat. Gas Sci. Eng. 2018, 55, 276–287. [Google Scholar] [CrossRef]
- Zhang, B.; Guan, Z.; Zhang, Q.; Han, D. Prediction of sustained annular pressure and thepressure control measures for high pressure gas wells. Petrol. Explor. 2015, 42, 567–572. [Google Scholar] [CrossRef]
- Ding, L.L.; Li, S.; Lian, Z.H.; Cao, L.H. Prediction and analysis of sustained annular pressure of gas wells considering the influence of production system and liquid thermodynamic properties. J. Energy Resour. Technol. 2023, 145, 013001. [Google Scholar] [CrossRef]
- Zhang, Z.; Xiang, S.L.; Yuan, Z.; Tang, H.R. A coupling prediction model of annular pressure build-up for deepwater oil and gas wells during transient-state testing. Geoenergy Sci. Eng. 2023, 230, 212162. [Google Scholar] [CrossRef]
- Wang, H.; Zhang, H.; Li, J.; Chen, A.M.; Liu, J.; Sun, T.F.; Lin, C. Study on annular pressure buildup in offshore heavy oil thermal recovery wells considering dissolved gas contained in annuli. Energies 2021, 14, 3213. [Google Scholar] [CrossRef]
- Zhang, Z.; Wang, H. Sealed annulus thermal expansion pressure mechanical calculation method and application among multiple packers in HPHT gas wells. J. Nat. Gas Sci. Eng. 2016, 31, 692–702. [Google Scholar] [CrossRef]
- Zhang, Z.; Xiang, S.L.; Liu, S.J.; Luo, M.; Wu, J. Study on the influence of tripping operation on annular transient surge-swab pressure of Herschel-Bulkley fluid. J. Energy Resour. Technol. 2023, 145, 051701. [Google Scholar] [CrossRef]
- Bellarby, J.; Kofoed, S.S.; Marketz, F. Annular pressure build-up analysis and methodologywith examples from multifrac horizontal wells and HPHT reservoirs. In Proceedings of the SPE/IADC Drilling Conference, Amsterdam, The Netherlands, 5–7 March 2013. [Google Scholar]
- Zhang, B.; Xu, Z.X.; Lu, N.; Liu, H.; Liu, J.; Hu, Z.; Xiet, J.; Walng, K. Characteristics of sustained annular pressure and fluid distribution in high pressure and high temperature gas wells considering multiple leakage of tubing string. J. Petrol. Sci. Eng. 2020, 196, 108083. [Google Scholar] [CrossRef]
- Xi, Y.; Jin, J.Z.; Fan, L.F.; Guo, X.L.; Shen, J.Y.; Li, J. Research on the establishment of gas channeling barrier for preventing SCP caused by cyclic loading-unloading in shale gas horizontal wells. J. Petrol. Sci. Eng. 2022, 208, 109640. [Google Scholar] [CrossRef]
- Xi, Y.; Li, J.; Tao, Q.; Guo, B.Y.; Liu, G.H. Experimental and numerical investigations of accumulated plastic deformation in cement sheath during multistage fracturing in shale gas wells. J. Petrol. Sci. Eng. 2020, 187, 106790. [Google Scholar] [CrossRef]
- Kinik, K.; Wojtanowicz, A.K. Identifying enviromental risk of sustained casing pressure. In Proceedings of the SPE Americas E&P Health, Safety, Security, and Environmental Conference, Houston, TX, USA, 21–23 March 2011; p. 143713. [Google Scholar]
- Oudeman, P.; Bacarreza, L.J. Field trial results of annular pressure behavior in a high-pressure/high-temperature well. SPE Drill. Complet. 1995, 10, 84–88. [Google Scholar] [CrossRef]
- Bourgoyne, A.T.; Scott, S.L.; Regg, J.B. Sustained casing pressure in offshore producing wells. In Proceedings of the 1999 Offshore Technology Conference, Houston, TX, USA, 3–6 May 1999. [Google Scholar]
- Xu, R.; Wojtanowicz, A.K. Diagnostic testing of wells with sustained casing pressure an analytical approach. In Proceedings of the Petroleum Society’s Canadian International Petroleum Conference, Calgary, AB, Canada, 10–12 June 2003. [Google Scholar]
- Xu, R. Analysis of Diagnostic Testing of Sustained Casing Pressure in Wells; Louisiana State University: Baton Rouge, LA, USA, 2002. [Google Scholar]
- Xu, R.; Wojtanowicz, A.K. Pressure buildup test analysis in wells with sustained casing pressure. J. Nat. Gas Sci. Eng. 2017, 38, 608–620. [Google Scholar] [CrossRef]
- Rocha-Valadez, T.; Mentzer, R.A.; Hasan, A.R.; Mannan, M.S. Inherently safer sustained casing pressure testing for well integrity evaluation. Loss Prev. Process Ind. 2014, 29, 209–215. [Google Scholar] [CrossRef]
- Rocha-Valade, T.; Hasan, A.R.; Mannan, S.; Kabir, C.S. Assessing wellbore integrity in sustained casing pressure annulus. SPE Drill. Complet. 2014, 29, 131–138. [Google Scholar] [CrossRef]
- Gao, D.; Qian, F.; Zheng, H. On a method of prediction of the annular pressure buildup in deepwater wells for oil & gas. CMES-COMP Model. Eng. 2012, 89, 1–16. [Google Scholar]
- Yang, J.; Tang, H.X.; Liu, Z.L.; Yang, L.P.; Huang, X.L.; Yan, D.; Tian, R.R. Prediction model of casing annulus pressure for deepwater well drilling and completion operation. Petrol. Explor. 2013, 40, 661–664. [Google Scholar] [CrossRef]
- ISO/TS 16530-2; Well Integrity-Part 2-Well Integrity for the Operational Phase. Rev:ISO: Saint-Martin-d’Hères, France, 2014.
- Johns, J.E.; Blount, C.G.; Dethlefs, J.C.; Loveland, M.J.; McConnell, M.L.; Schwartz, G.L.; Julian, J.Y. Applied ultrasonic technology in wellbore-leak detection and case histories in Alaska North Slope Wells. In Proceedings of the 2006 SPE Annual Technical Conference and Exhibition, San Antonio, TX, USA, 24–27 September 2006. [Google Scholar]
- Liu, D.; Fan, J.; Wu, S. Acoustic wave-based method of locating tubing leakage for offshore gas wells. Energies 2018, 11, 3454. [Google Scholar] [CrossRef]
- Yang, Y.P.; Fan, J.C.; Wu, S.G.; Liu, D.; Ma, F.F. Multi-acoustic-wave-feature-based method for detection and quantification of downhole tubing leakage. J. Nat. Gas Sci. Eng. 2022, 102, 104582. [Google Scholar] [CrossRef]
- Beggs, H.D. Gas Production Operations; OGCI Publications: Tulsa, OK, USA, 1984. [Google Scholar]
- Argyriou, D.T.; List, H.L.; Shinnalr, R. Bubble growth by coalescence in gas fluidized beds. AIChE J. 1971, 17, 122–130. [Google Scholar] [CrossRef]
- Santos Otto, L.A.; Azar, J.J. A study on gas migration in stagnant non-Newtonian fluids. In Proceedings of the Fifth Latin American and Caribbean Petroleum Engineering Conference and Exhibition, Rio de Janeiro, Brazil, 30 August–3 September 1997; p. SPE 39019. [Google Scholar]
- Forsythe, G.E.; Wasow, R.W. Finite Difference Methods for Partial Differential Equations; John Wiley & Sons Inc.: New York, NY, USA, 1967. [Google Scholar]
- Sangani, A.S.; Acrivos, A. Creeping flow through cubic arrays of spherical bubbles. Int. J. Multiphas Flow. 1983, 9, 181. [Google Scholar] [CrossRef]
- Patankar, S.V. Series in computational methods in mechanics & thermal sciences. In Numerical Heat Transfer and Fluid Flow; CRC Press: Boca Raton, FL, USA, 1980. [Google Scholar]


| Experimental Parameters | Value |
|---|---|
| Pressure difference between the tubing and casing (KPa) | 100, 300, 500, 700 |
| Liquid level height (m) | 1, 1.5, 2, 2.5 |
| Gas temperature (°C) | 25, 80, 100, 120 |
| Leakage position (m) | 0.3, 0.6, 1 |
| Leakage orifice diameter (mm) | 0.5, 1, 1.5, 2 |
| Leakage orifice quantity | 1, 2, 3 |
Disclaimer/Publisher’s Note: The statements, opinions and data contained in all publications are solely those of the individual author(s) and contributor(s) and not of MDPI and/or the editor(s). MDPI and/or the editor(s) disclaim responsibility for any injury to people or property resulting from any ideas, methods, instructions or products referred to in the content. |
© 2024 by the authors. Licensee MDPI, Basel, Switzerland. This article is an open access article distributed under the terms and conditions of the Creative Commons Attribution (CC BY) license (https://creativecommons.org/licenses/by/4.0/).
Share and Cite
Yang, S.; Fu, J.; Zhao, N.; Xu, C.; Han, L.; Wang, J.; Liu, H.; Zhang, Y.; Liu, J. Comprehensive Analysis of the Annulus Pressure Buildup in Wells with Sustained Gas Leakage Below the Liquid Level. Processes 2024, 12, 2631. https://doi.org/10.3390/pr12122631
Yang S, Fu J, Zhao N, Xu C, Han L, Wang J, Liu H, Zhang Y, Liu J. Comprehensive Analysis of the Annulus Pressure Buildup in Wells with Sustained Gas Leakage Below the Liquid Level. Processes. 2024; 12(12):2631. https://doi.org/10.3390/pr12122631
Chicago/Turabian StyleYang, Siqi, Jianglong Fu, Nan Zhao, Changfeng Xu, Lihong Han, Jianjun Wang, Hailong Liu, Yuhang Zhang, and Jun Liu. 2024. "Comprehensive Analysis of the Annulus Pressure Buildup in Wells with Sustained Gas Leakage Below the Liquid Level" Processes 12, no. 12: 2631. https://doi.org/10.3390/pr12122631
APA StyleYang, S., Fu, J., Zhao, N., Xu, C., Han, L., Wang, J., Liu, H., Zhang, Y., & Liu, J. (2024). Comprehensive Analysis of the Annulus Pressure Buildup in Wells with Sustained Gas Leakage Below the Liquid Level. Processes, 12(12), 2631. https://doi.org/10.3390/pr12122631