

Fluid Phase Behavior of the Licuri (Syagrus coronata) Fatty Acid Ethyl Ester + Glycerol + Ethanol Mixtures at Different Temperatures—Experimental and Thermodynamic Modeling


 , ,
, ,  , , , ,
Abstract
1. Introduction
2. Experimental Section
2.1. Materials
2.2. Synthesis of Methyl and Ethyl Biofuels from Sesame (Sesamum indicum) Oil
2.3. Equipment and Methods for Liquid–Liquid Equilibrium
Liquid–Liquid Equilibrium Data
2.4. Quality Test of the Experimental Data
2.5. Distribution Coefficient and Selectivity
3. Thermodynamic Modeling
4. Results and Discussion
4.1. Experimental Data
4.2. Quality Test of the LLE Data
4.3. Separation Factor and Distribution Coefficient
4.4. Thermodynamic Modeling Results
5. Conclusions
Author Contributions
Funding
Data Availability Statement
Conflicts of Interest
References
- Ma, F.; Hanna, M.A. Biodiesel Production: A Review. Bioresour. Technol. 1999, 70, 1–15. [Google Scholar] [CrossRef]
- Paraízo, A.; Junior, E.; Paraízo, J. Produção de Biodiesel; Universidade Federal de Santa Catarina: Florianópolis, Brazil, 2005. [Google Scholar]
- Jones, J.C. On the Processing of Biodiesel Fuels. Fuel 2009, 88, 583. [Google Scholar] [CrossRef]
- Miller, S.F.; Miller, B.G. The Occurrence of Inorganic Elements in Various Biofuels and Its Effect on Ash Chemistry and Behavior and Use in Combustion Products. Fuel Process. Technol. 2007, 88, 1155–1164. [Google Scholar] [CrossRef]
- Doppalapudi, A.T.; Azad, A.K.; Khan, M.M.K. Exergy, Energy, Performance, and Combustion Analysis for Biodiesel NOx Reduction Using New Blends with Alcohol, Nanoparticle, and Essential Oil. J. Clean. Prod. 2024, 467, 142968. [Google Scholar] [CrossRef]
- Tesfa, B.; Mishra, R.; Gu, F.; Powles, N. Prediction Models for Density and Viscosity of Biodiesel and Their Effects on Fuel Supply System in CI Engines. Renew. Energy 2010, 35, 2752–2760. [Google Scholar] [CrossRef]
- Knothe, G. Biodiesel and Renewable Diesel: A Comparison. Prog. Energy Combust. Sci. 2010, 36, 364–373. [Google Scholar] [CrossRef]
- Zeb, A. A Comprehensive Review on Different Classes of Polyphenolic Compounds Present in Edible Oils. Food Res. Int. 2021, 143, 110312. [Google Scholar] [CrossRef]
- Eskin, N.A.M.; Przybylski, R. RAPE SEED OIL/CANOLA. In Encyclopedia of Food Sciences and Nutrition; Elsevier: Oxford, UK, 2003; pp. 4911–4916. [Google Scholar]
- de Almeida, E.S.; da Silva Damaceno, D.; Carvalho, L.; Victor, P.A.; dos Passos, R.M.; de Almeida Pontes, P.V.; Cunha-Filho, M.; Sampaio, K.A.; Monteiro, S. Thermal and Physical Properties of Crude Palm Oil with Higher Oleic Content. Appl. Sci. 2021, 11, 7094. [Google Scholar] [CrossRef]
- Wahyudi; Wardana, I.N.G.; Widodo, A.; Wijayanti, W. Improving Vegetable Oil Properties by Transforming Fatty Acid Chain Length in Jatropha Oil and Coconut Oil Blends. Energies 2018, 11, 394. [Google Scholar] [CrossRef]
- Sahasrabudhe, S.N.; Rodriguez-Martinez, V.; O’Meara, M.; Farkas, B.E. Density, Viscosity, and Surface Tension of Five Vegetable Oils at Elevated Temperatures: Measurement and Modeling. Int. J. Food Prop. 2017, 20, 1965–1981. [Google Scholar] [CrossRef]
- La Salles, K.T.S.; Meneghetti, S.M.P.; Ferreira de La Salles, W.; Meneghetti, M.R.; dos Santos, I.C.F.; da Silva, J.P.V.; de Carvalho, S.H.V.; Soletti, J.I. Characterization of Syagrus coronata (Mart.) Becc. Oil and Properties of Methyl Esters for Use as Biodiesel. Ind. Crops Prod. 2010, 32, 518–521. [Google Scholar] [CrossRef]
- Sampaio Nunes Bezerra, S. Produção de Enzimas por Fungos Isolados das Folhas, Frutos e Árvores do Licuri. An. Semin. De Iniciação Científica 2021. [Google Scholar] [CrossRef]
- Antoniassi, R.; Miranda, P.C.; Ferreira, G.F.; Vieira, T.M.F.S.; de Freitas, S.C.; Matsuura, M.I.d.S.F. Nutritional Evaluation of Syagrus coronata Kernels and Development of Cookies Prepared with Cassava Flour and Licuri Kernels. Food Sci. Technol. 2022, 42, e69720. [Google Scholar] [CrossRef]
- Iha, O.K.; Alves, F.C.S.C.; Suarez, P.A.Z.; Silva, C.R.P.; Meneghetti, M.R.; Meneghetti, S.M.P. Potential Application of Terminalia Catappa L. and Carapa Guianensis Oils for Biofuel Production: Physical-Chemical Properties of Neat Vegetable Oils, Their Methyl-Esters and Bio-Oils (Hydrocarbons). Ind. Crops Prod. 2014, 52, 95–98. [Google Scholar] [CrossRef]
- Iha, O.K.; Alves, F.C.S.C.; Suarez, P.A.Z.; de Oliveira, M.B.F.; Meneghetti, S.M.P.; Santos, B.P.T.; Soletti, J.I. Physicochemical Properties of Syagrus coronata and Acrocomia aculeata Oils for Biofuel Production. Ind. Crops Prod. 2014, 62, 318–322. [Google Scholar] [CrossRef]
- Mesquita, F.M.R.; Feitosa, F.X.; Sombra, N.E.; De Santiago-Aguiar, R.S.; De Sant’Ana, H.B. Liquid-Liquid Equilibrium for Ternary Mixtures of Biodiesel (Soybean or Sunflower) + Glycerol + Ethanol at Different Temperatures. J. Chem. Eng. Data 2011, 56, 4061–4067. [Google Scholar] [CrossRef]
- Dias, T.P.V.B.; Mielke Neto, P.; Ansolin, M.; Follegatti-Romero, L.A.; Batista, E.A.C.; Meirelles, A.J.A. Liquid-Liquid Equilibrium for Ternary Systems Containing Ethylic Biodiesel + Anhydrous Ethanol + Refined Vegetable Oil (Sunflower Oil, Canola Oil And Palm Oil): Experimental Data and Thermodynamic Modeling. Braz. J. Chem. Eng. 2015, 32, 699–706. [Google Scholar] [CrossRef]
- Machado, A.B.; Ardila, Y.C.; De Oliveira, L.H.; Aznar, M.; Wolf Maciel, M.R. Liquid-Liquid Equilibria in Ternary and Quaternary Systems Present in Biodiesel Production from Soybean Oil at (298.2 and 333.2) K. J. Chem. Eng. Data 2012, 57, 1417–1422. [Google Scholar] [CrossRef]
- Negi, D.S.; Sobotka, F.; Kimmel, T.; Wozny, G.; Schomäcker, R. Liquid-Liquid Phase Equilibrium in Glycerol-Methanol-Methyl Oleate and Glycerol-Monoolein-Methyl Oleate Ternary Systems. Ind. Eng. Chem. Res. 2006, 45, 3693–3696. [Google Scholar] [CrossRef]
- Atadashi, I.M.; Aroua, M.K.; Abdul Aziz, A.R.; Sulaiman, N.M.N. The Effects of Water on Biodiesel Production and Refining Technologies: A Review. Renew. Sustain. Energy Rev. 2012, 16, 3456–3470. [Google Scholar] [CrossRef]
- Machado, G.D.; Pessoa, F.L.P.; Castier, M.; Aranda, D.A.G.; Cabral, V.F.; Cardozo-Filho, L. Biodiesel Production by Esterification of Hydrolyzed Soybean Oil with Ethanol in Reactive Distillation Columns: Simulation Studies. Ind. Eng. Chem. Res. 2013, 52, 9461–9469. [Google Scholar] [CrossRef]
- França, B.B.; Pinto, F.M.; Pessoa, F.L.P.; Uller, A.M.C. Liquid−Liquid Equilibria for Castor Oil Biodiesel + Glycerol + Alcohol. J. Chem. Eng. Data 2009, 54, 2359–2364. [Google Scholar] [CrossRef]
- Carvalho dos Santos, K.; Pedersen Voll, F.A.; Corazza, M.L. Thermodynamic Analysis of Biodiesel Production Systems at Supercritical Conditions. Fluid Phase Equilibria 2019, 484, 106–113. [Google Scholar] [CrossRef]
- Renon, H.; Prausnitz, J.M. Local Compositions in Thermodynamic Excess Functions for Liquid Mixtures. AIChE J. 1968, 14, 135–144. [Google Scholar] [CrossRef]
- Hand, D.B. Dineric Distribution. J. Phys. Chem. 1929, 34, 1961–2000. [Google Scholar] [CrossRef]
- Othmer, D.; Tobias, P. Liquid-Liquid Extraction Data—The Line Correlation. Ind. Eng. Chem. 1942, 34, 693–696. [Google Scholar] [CrossRef]
- Gomes Filho, J.C.; Peiter, A.S.; Pimentel, W.R.O.; Soletti, J.I.; Carvalho, S.H.V.; Meili, L. Biodiesel Production from Sterculia Striata Oil by Ethyl Transesterification Method. Ind. Crops Prod. 2015, 74, 767–772. [Google Scholar] [CrossRef]
- Toledo, I.E.P.; Ferreira-Pinto, L.; Voll, F.A.P.; Cardozo-Filho, L.; Meili, L.; Coêlho, D.d.G.; de Carvalho, S.H.V.; Soletti, J.I. Liquid–Liquid Equilibrium of the System {Peanut Biodiesel + Glycerol + Ethanol} at Atmospheric Pressure. J. Chem. Eng. Data 2019, 64, 2207–2212. [Google Scholar] [CrossRef]
- EN14103; Fat and Oil Derivatives—Fatty Acid Methyl Esters (FAME)—Determination of Ester and Linolenic Acid Methyl Ester Contents. European Committee for Standardization: Brussels, Belgium, 2020.
- Halvorsen, J.D.; Mammel, W.C.; Clements, L.D. Density Estimation for Fatty Acids and Vegetable Oils Based on Their Fatty Acid Composition. J. Am. Oil Chem. Soc. 1993, 70, 875–880. [Google Scholar] [CrossRef]
- Araújo, P.H.M.; Maia, A.S.; Cordeiro, A.M.T.M.; Gondim, A.D.; Santos, N.A. Catalytic Deoxygenation of the Oil and Biodiesel of Licuri (Syagrus coronata) To Obtain n-Alkanes with Chains in the Range of Biojet Fuels. ACS Omega 2019, 4, 15849–15855. [Google Scholar] [CrossRef]
- Antoniassi, R.; Arriel, N.H.C.; Gonçalves, E.B.; de Freitas, S.C.; Zanotto, D.L.; Bizzo, H.R. Influência Das Condições de Cultivo Na Composição Da Semente e Do Óleo de Gergelim. Rev. Ceres 2013, 60, 301–310. [Google Scholar] [CrossRef]
- Ferrari, J.C.; Nagatani, G.; Corazza, F.C.; Oliveira, J.V.; Corazza, M.L. Application of Stochastic Algorithms for Parameter Estimation in the Liquid–Liquid Phase Equilibrium Modeling. Fluid Phase Equilibria 2009, 280, 110–119. [Google Scholar] [CrossRef]
- Press, W.H.; Teukolsky, S.A.; Vetterling, W.T.; Flannery, B.P. Numerical Recipes in FORTRAN 77, 2nd ed.; Cambridge University Press: New York, NY, USA, 1992; ISBN 052143064X. [Google Scholar]
- Taylor, B.N.; Kuyatt, C.E. Guidelines for the Evaluation and Expression of Uncertainty in NIST Measurement Results Technical Note 1297 for NIST; National Institute of Standards and Technology: Gaithersburg, MD, USA, 1994. [Google Scholar]
- Zhang, M.; Wu, H. Phase Behavior and Fuel Properties of Bio-Oil/Glycerol/Methanol Blends. Energy Fuels 2014, 28, 4650–4656. [Google Scholar] [CrossRef]

 , tie line; and ○, binodal points) and NRTL model (
 , tie line; and
  , binodal line).
, tie line; and ○, binodal points) and NRTL model (, tie line; and , binodal line).
, binodal line).
, tie line; and ○, binodal points) and NRTL model (, tie line; and , binodal line).

| Compound | Fatty Acid | Cx:y a | Molar Mass(g·gmol–1) | Content wt% | |||
|---|---|---|---|---|---|---|---|
| This Study b | Antoniassi et al. [15] | Araújo et al. [33] | La Salles et al. [13] | ||||
| 1 | Caprylic acid | 08:0—C8H16O2 | 144.21 | 13.3 | 9.2 | 8.8 | 9.0 |
| 2 | Capric acid | 10:0—C10H20O2 | 172.27 | 8.3 | 6.6 | 6.0 | 6.0 |
| 3 | Lauric acid | 12:0—C12H24O2 | 200.32 | 48.2 | 46.1 | 36.0 | 44.0 |
| 4 | Myristic acid | 14:0—C14H28O2 | 228.38 | 13.7 | 14 | 16.5 | 17.0 |
| 5 | Palmitic acid | 16:0—C16H32O2 | 256.43 | 5.4 | 6.5 | 8.9 | 8.0 |
| 6 | Stearic acid | 18:0—C18H36O2 | 284.48 | 2.2 | 3.5 | 5.7 | 4.0 |
| 7 | Oleic acid | 18:1—C18H34O2 | 282.46 | 7.0 | 10.3 | 14.2 | 14.0 |
| 8 | Linoleic acid | 18:2—C18H32O2 | 280.45 | 1.9 | 2.8 | 3.9 | 2.0 |
| T = 303.15 K | T = 318.15 K | ||||
|---|---|---|---|---|---|
| 100.w1 | 100.w2 | 100.w3 | 100.w1 | 100.w2 | 100.w3 |
| 83.82 | 6.31 | 9.87 | 86.81 | 3.56 | 9.62 |
| 74.09 | 6.93 | 18.98 | 76.75 | 4.82 | 18.42 |
| 64.59 | 7.84 | 27.57 | 62.61 | 8.19 | 29.19 |
| 53.85 | 10.18 | 35.97 | 53.24 | 11.26 | 35.49 |
| 42.81 | 14.77 | 42.42 | 41.88 | 16.23 | 41.88 |
| 31.81 | 20.73 | 47.46 | 30.51 | 22.56 | 46.92 |
| 22.94 | 25.91 | 51.15 | 21.5 | 28.17 | 50.32 |
| 13.61 | 32.93 | 53.47 | 13.21 | 34.37 | 52.41 |
| 6.87 | 41.91 | 51.22 | 5.72 | 46.04 | 48.26 |
| 2.62 | 53.55 | 43.83 | 1.66 | 69.04 | 29.29 |
| 2.33 | 63.78 | 33.89 | 1.47 | 78.57 | 19.96 |
| 1.08 | 73.68 | 25.22 | 1.26 | 88.12 | 10.61 |
| 0.99 | 89.1 | 9.91 | |||
| T (K) | Overall Composition (Sol) | Experimental (Tie-Lines) | |||||||
|---|---|---|---|---|---|---|---|---|---|
| Biodiesel Rich-Phase (FAEE) | Glycerol Rich-Phase (Gly) | ||||||||
| 100.w1 | 100.w2 | 100.w3 | 100.w1 | 100.w2 | 100.w3 | 100.w1 | 100.w2 | 100.w3 | |
| 303.15 | 32.01 | 23.41 | 44.58 | 54.64 | 10.24 | 35.12 | 10.18 | 36.41 | 53.41 |
| 32.68 | 26.45 | 40.87 | 59.13 | 9.24 | 31.63 | 8.55 | 42.74 | 48.71 | |
| 33.49 | 31.02 | 35.49 | 67.33 | 7.75 | 24.92 | 4.46 | 49.54 | 46.00 | |
| 34.39 | 34.56 | 31.05 | 70.97 | 7.12 | 21.91 | 2.67 | 58.11 | 39.22 | |
| 38.97 | 38.51 | 22.52 | 79.34 | 6.23 | 14.43 | 1.37 | 67.64 | 30.99 | |
| 41.91 | 42.03 | 16.06 | 83.62 | 6.07 | 10.31 | 0.82 | 76.66 | 22.52 | |
| 44.04 | 44.21 | 11.75 | 87.53 | 5.93 | 6.54 | 1.22 | 82.49 | 16.29 | |
| 47.45 | 46.52 | 6.03 | 91.17 | 5.71 | 3.12 | 1.20 | 90.35 | 8.45 | |
| 318.15 | 39.41 | 21.06 | 39.53 | 54.61 | 10.82 | 34.57 | 7.20 | 42.33 | 50.47 |
| 37.43 | 25.01 | 37.56 | 61.73 | 8.23 | 30.04 | 5.25 | 47.57 | 47.18 | |
| 34.87 | 31.05 | 34.08 | 66.74 | 7.33 | 25.93 | 3.66 | 54.13 | 42.21 | |
| 33.52 | 35.21 | 31.27 | 70.14 | 6.65 | 23.21 | 2.89 | 59.88 | 37.23 | |
| 32.01 | 40.86 | 27.13 | 74.59 | 6.13 | 19.28 | 2.43 | 65.48 | 32.09 | |
| 31.04 | 46.63 | 22.33 | 80.71 | 5.22 | 14.07 | 1.41 | 71.85 | 26.74 | |
| 30.19 | 52.64 | 17.17 | 85.34 | 5.04 | 9.62 | 1.39 | 78.16 | 20.45 | |
| 30.72 | 58.22 | 11.06 | 90.48 | 4.26 | 5.26 | 0.80 | 85.42 | 14.18 | |
| T (K) | Hand | Othmer-Tobias | ||||
|---|---|---|---|---|---|---|
| R2 | A | B | R2 | A′ | B′ | |
| 303.15 | 0.9969 | −0.8265 | 1.0724 | 0.9912 | −0.6702 | 0.7881 |
| 318.15 | 0.9894 | −0.6232 | 1.1856 | 0.9967 | −0.5088 | 0.9758 |
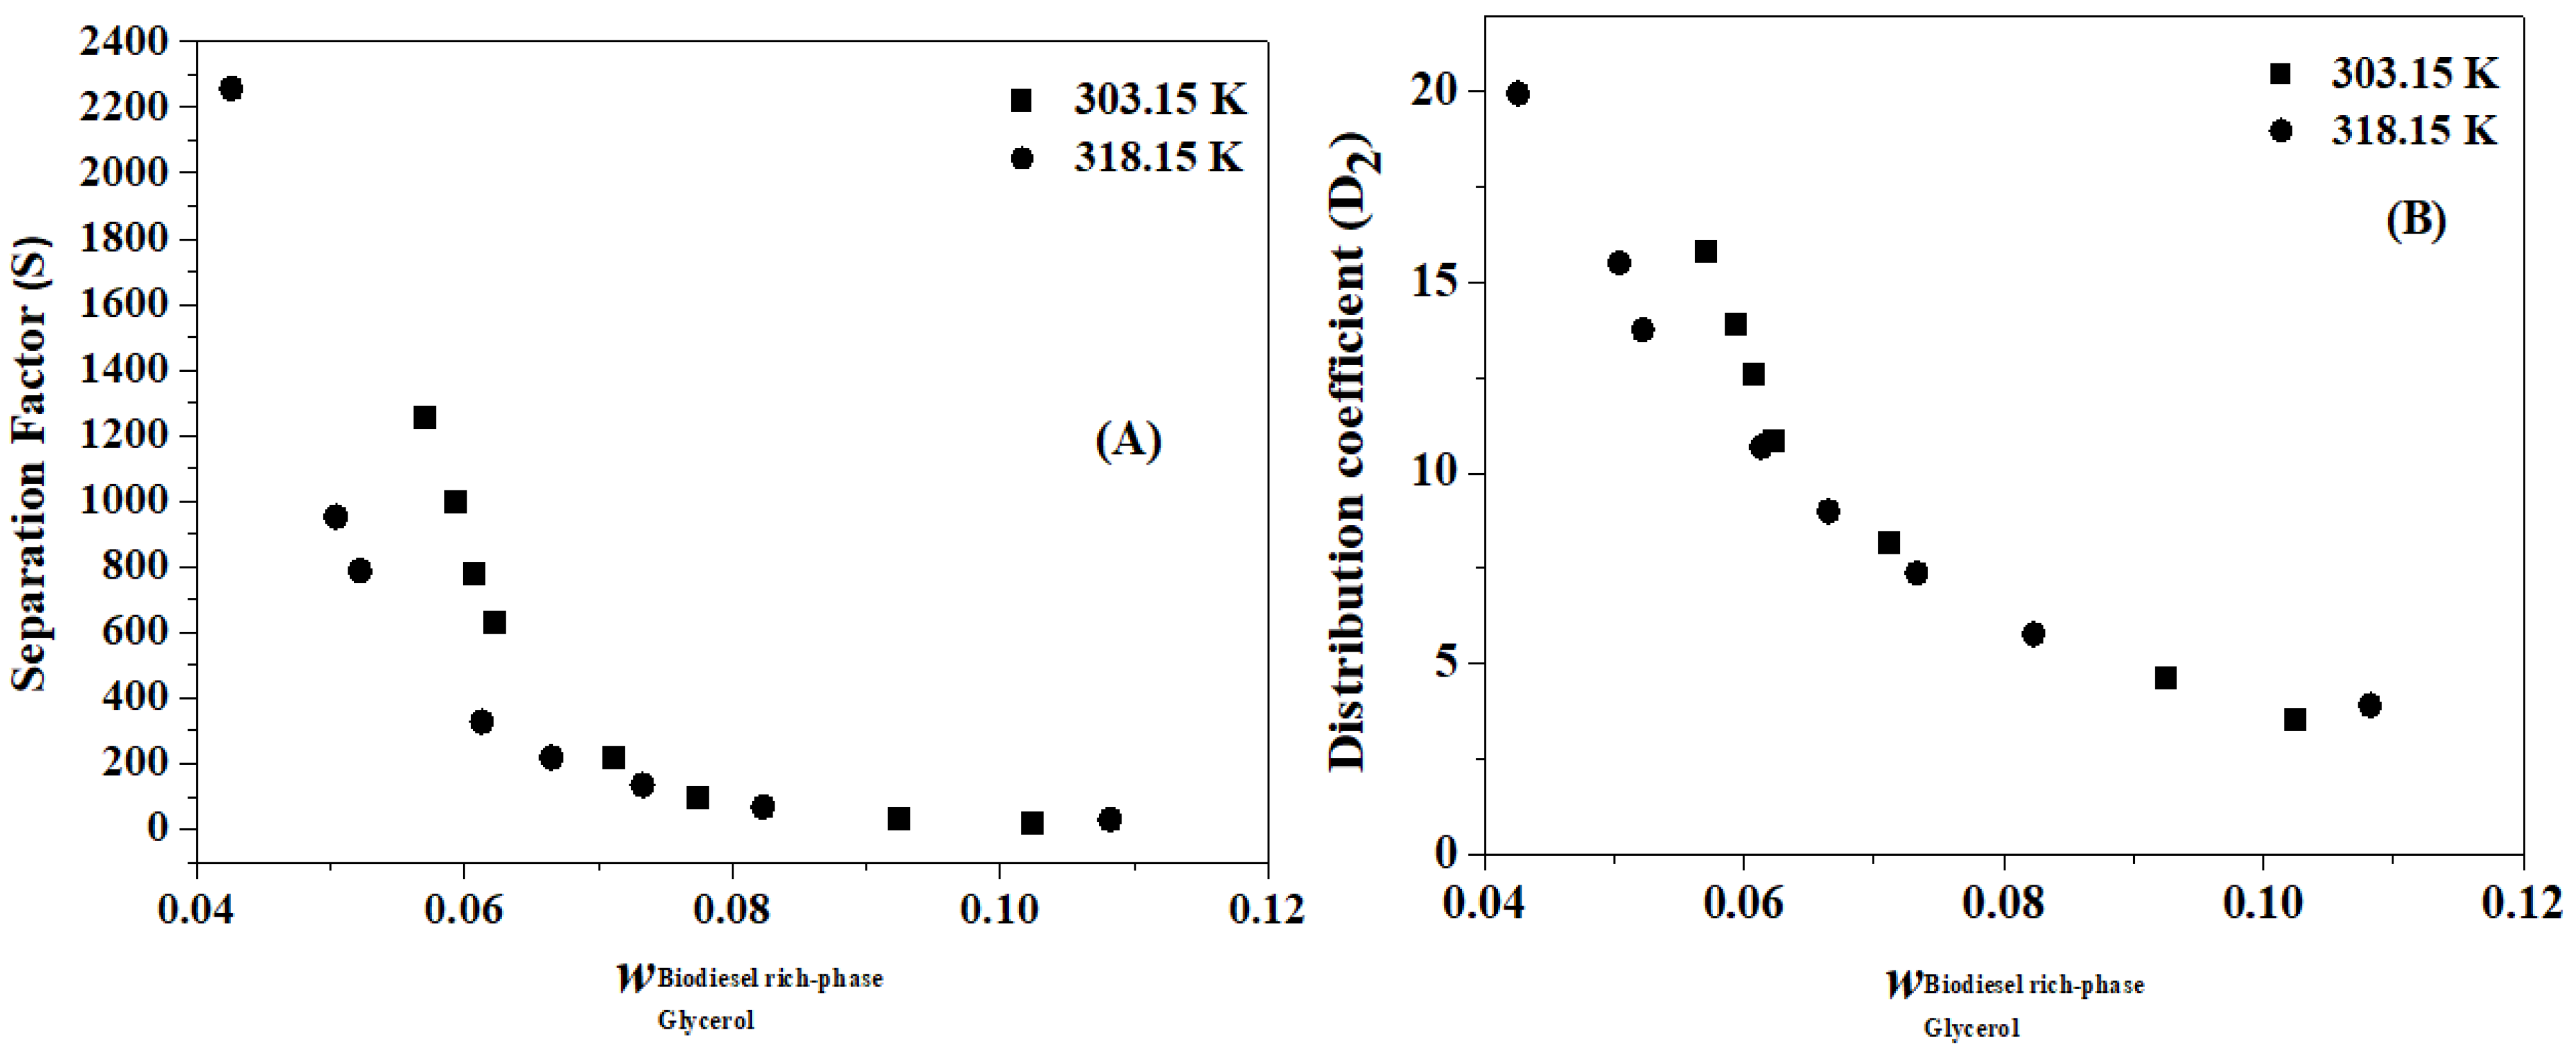
| T (K) | S | D1 | D2 | T (K) | S | D1 | D2 |
|---|---|---|---|---|---|---|---|
| 303.15 | 1254.85 | 0.01 | 15.83 | 318.15 | 2257.22 | 0.01 | 19.96 |
| 999.12 | 0.01 | 13.93 | 952.12 | 0.02 | 15.51 | ||
| 778.90 | 0.02 | 12.57 | 787.89 | 0.02 | 13.76 | ||
| 628.76 | 0.02 | 10.86 | 327.89 | 0.03 | 10.68 | ||
| 216.91 | 0.04 | 8.16 | 218.54 | 0.04 | 9.00 | ||
| 96.50 | 0.07 | 6.39 | 134.66 | 0.05 | 7.38 | ||
| 31.99 | 0.14 | 4.63 | 67.96 | 0.09 | 5.78 | ||
| 19.08 | 0.19 | 3.56 | 29.67 | 0.13 | 3.91 |
| System: FAEE licuri (1) + glycerol (2) + ethanol (3) | |||||
|---|---|---|---|---|---|
| Temperature (K) | Pair i-j | Δgij (K) a | Δgji (K) a | rmsd × 100 | |
| Phase FAEE | Phase Glyc | ||||
| 303.15–318.15 | 1-2 | 348.53 | 3766.41 | 1.18 | 0.71 |
| 1-3 | −336.62 | 1146.82 | |||
| 2-3 | −291.87 | 1029.74 | |||
Disclaimer/Publisher’s Note: The statements, opinions and data contained in all publications are solely those of the individual author(s) and contributor(s) and not of MDPI and/or the editor(s). MDPI and/or the editor(s) disclaim responsibility for any injury to people or property resulting from any ideas, methods, instructions or products referred to in the content. |
© 2024 by the authors. Licensee MDPI, Basel, Switzerland. This article is an open access article distributed under the terms and conditions of the Creative Commons Attribution (CC BY) license (https://creativecommons.org/licenses/by/4.0/).
Share and Cite
Toledo, I.E.P.; Coêlho, D.d.G.; Meili, L.; Hiranobe, C.T.; Corazza, M.L.; Arce, P.; da Silva, E.A.; de Carvalho, S.H.V.; dos Santos, R.J.; Soletti, J.I.; et al. Fluid Phase Behavior of the Licuri (Syagrus coronata) Fatty Acid Ethyl Ester + Glycerol + Ethanol Mixtures at Different Temperatures—Experimental and Thermodynamic Modeling. Processes 2024, 12, 2624. https://doi.org/10.3390/pr12122624
Toledo IEP, Coêlho DdG, Meili L, Hiranobe CT, Corazza ML, Arce P, da Silva EA, de Carvalho SHV, dos Santos RJ, Soletti JI, et al. Fluid Phase Behavior of the Licuri (Syagrus coronata) Fatty Acid Ethyl Ester + Glycerol + Ethanol Mixtures at Different Temperatures—Experimental and Thermodynamic Modeling. Processes. 2024; 12(12):2624. https://doi.org/10.3390/pr12122624
Chicago/Turabian StyleToledo, Iza Estevam Pedrosa, Dayana de Gusmão Coêlho, Lucas Meili, Carlos Toshiyuki Hiranobe, Marcos Lúcio Corazza, Pedro Arce, Erivaldo Antônio da Silva, Sandra Helena Vieira de Carvalho, Renivaldo José dos Santos, João Inácio Soletti, and et al. 2024. "Fluid Phase Behavior of the Licuri (Syagrus coronata) Fatty Acid Ethyl Ester + Glycerol + Ethanol Mixtures at Different Temperatures—Experimental and Thermodynamic Modeling" Processes 12, no. 12: 2624. https://doi.org/10.3390/pr12122624
APA StyleToledo, I. E. P., Coêlho, D. d. G., Meili, L., Hiranobe, C. T., Corazza, M. L., Arce, P., da Silva, E. A., de Carvalho, S. H. V., dos Santos, R. J., Soletti, J. I., & Ferreira-Pinto, L. (2024). Fluid Phase Behavior of the Licuri (Syagrus coronata) Fatty Acid Ethyl Ester + Glycerol + Ethanol Mixtures at Different Temperatures—Experimental and Thermodynamic Modeling. Processes, 12(12), 2624. https://doi.org/10.3390/pr12122624