Article

A Discrete Distributed Activation Energy Model for Cedar and Polyethylene Fast Heating Pyrolysis Kinetics

1
China Datang Technology Innovation Co., Ltd., Baoding 071703, China
2
Key Laboratory for Thermal Science and Power Engineering of Ministry of Education, Department of Energy and Power Engineering, Tsinghua University, Beijing 100084, China
*
Author to whom correspondence should be addressed.
Processes 2024, 12(12), 2618; https://doi.org/10.3390/pr12122618
Submission received: 1 October 2024 / Revised: 30 October 2024 / Accepted: 19 November 2024 / Published: 21 November 2024
(This article belongs to the Section Chemical Processes and Systems)

Abstract

:
The pyrolysis of municipal solid waste (MSW) is an efficient, cost-effective, and environmentally beneficial thermochemical treatment method. A macro thermogravimetric analyzer (Macro TGA) was used to study the pyrolysis behavior of cedar and polyethylene (PE) at slow (10 K/min) and fast (700, 800, and 900 °C) heating rates. For cedar, the pyrolysis rate curve showed multi-peak characteristics at the slow heating rate and single-peak characteristics at the fast heating rate. Conversely, PE exhibited the opposite behavior. At fast heating rate of 700 °C, the pyrolysis rate for cedar increased from 0.685 to 0.847 min−1 as the sample temperature rose by over 100 °C, from 351 to 455 °C. By contrast, for PE, the rate increased from 0.217 to 1.008 min−1 with a smaller temperature rise of less than 30 °C, from 630 to 656 °C. According to the International Confederation for Thermal Analysis and Calorimetry (ICTAC) guidelines for analyzing pyrolysis thermogravimetric data, cedar pyrolysis primarily followed a single-step parallel reaction pathway, while PE exhibited some multi-step parallel reactions. A newly developed discrete distributed activation energy model (DDAEM), along with the traditional iso-conversional model (ICM) and distributed activation energy model (DAEM), were applied to predict pyrolysis characteristics at fast heating rates. For cedar, both DDAEM and ICM provide accurate predictions, with average activation energies calculated by these two models being 48.08 and 66.37 kJ/mol, respectively. For PE, DDAEM demonstrates significantly higher predictive accuracy than ICM, particularly when the conversion is below 0.2. As the pyrolysis conversion of PE increases from 0.25 to 0.65, the average activation energy calculated using ICM was found to be 58.32 kJ/mol. By contrast, for DDAEM, the activation energies for the first and second step reactions were 110 and 60 kJ/mol, respectively. This indicates that ICM can only calculate the activation energy for the final step and not for the rate-limiting step. For both cedar and PE, DAEM fails to provide accurate predictions due to the unsteady heating rate.

1. Introduction

With the rapid increase in the production of municipal solid waste (MSW) [1,2], there is an urgent need for efficient, cost-effective, and environmentally friendly waste treatment methods. Thermochemical waste-to-energy processes, such as MSW incineration, have emerged as the most widely adopted approach [3,4]. In China, the grate furnace, accounting for over 70% of the installed capacity, is the predominant device used for MSW combustion [5]. During MSW combustion, samples undergo three main stages: drying, pyrolysis, and char combustion [6]. Among them, pyrolysis is the initial chemical reaction that the materials undergo, and accounts for the primary weight loss throughout the combustion process. Conducting experimental and modeling studies on MSW pyrolysis has two important significances. On one hand, relevant research helps to better describe and understand the chemical reaction mechanisms during the pyrolysis stage of the MSW combustion process, laying the groundwork for establishing a comprehensive MSW combustion model [7]. On the other hand, such research can assist in optimizing the structural design of industrial-scale MSW combustion reactors and adjusting operational conditions [8]. However, there are some issues that need to be addressed in both the experimental and modeling aspects of MSW pyrolysis research.
The pyrolysis characteristics of MSW in a grate furnace during the incineration process can be summarized as follows: (a) The sample size is relatively large, typically ranging from 5 to 100 mm [9], which impacts both heat transfer and gas diffusion during the pyrolysis and combustion processes [10]. (b) The heating rate of the samples is fast, with a maximum heating rate exceeding 500 K/min, due to the swift introduction of samples into the high-temperature zone [11]. Previous studies have shown that varying heating rates can result in differences in pyrolysis kinetics and reaction pathways [12,13]. Additionally, two important signals—sample weight and temperature—should ideally be measured directly during experiments, as they are crucial for determining kinetic parameters [14]. In conclusion, the key aspects of experimental research on MSW pyrolysis focus on obtaining reliable thermogravimetric data under conditions that closely resemble those found in a grate furnace. However, most experimental apparatus currently available do not meet these requirements. Common devices used to study MSW pyrolysis include thermogravimetric analyzers (TGAs) [13,15,16,17], macro TGAs [18,19,20], drop tube furnaces [21,22], and fluidized bed reactors [23]. A TGA [13,15,16,17] is a commonly applied device to conduct MSW pyrolysis studies due to its high level of automation and measurement resolution. The maximum heating rate of a conventional TGA is generally below 120 K/min [15,16]. Some studies have mentioned that certain advanced TGAs can achieve heating rates as high as 500 K/min [13,17]. However, such commercial TGAs are only capable of conducting experiments for samples smaller than 6 mm. In addition, the sample temperature is usually regarded to be the same as a furnace temperature [24], which is not as reliable as the direct measurement by thermocouples. A macro TGA [18,19] is designed to accommodate larger samples, which functions similar to that of a TGA. Therefore, the drawbacks of TGAs, including the slow heating rate and inability to directly measure the sample temperature, still remain. A drop tube furnace [21,22] and fluidized bed reactor [
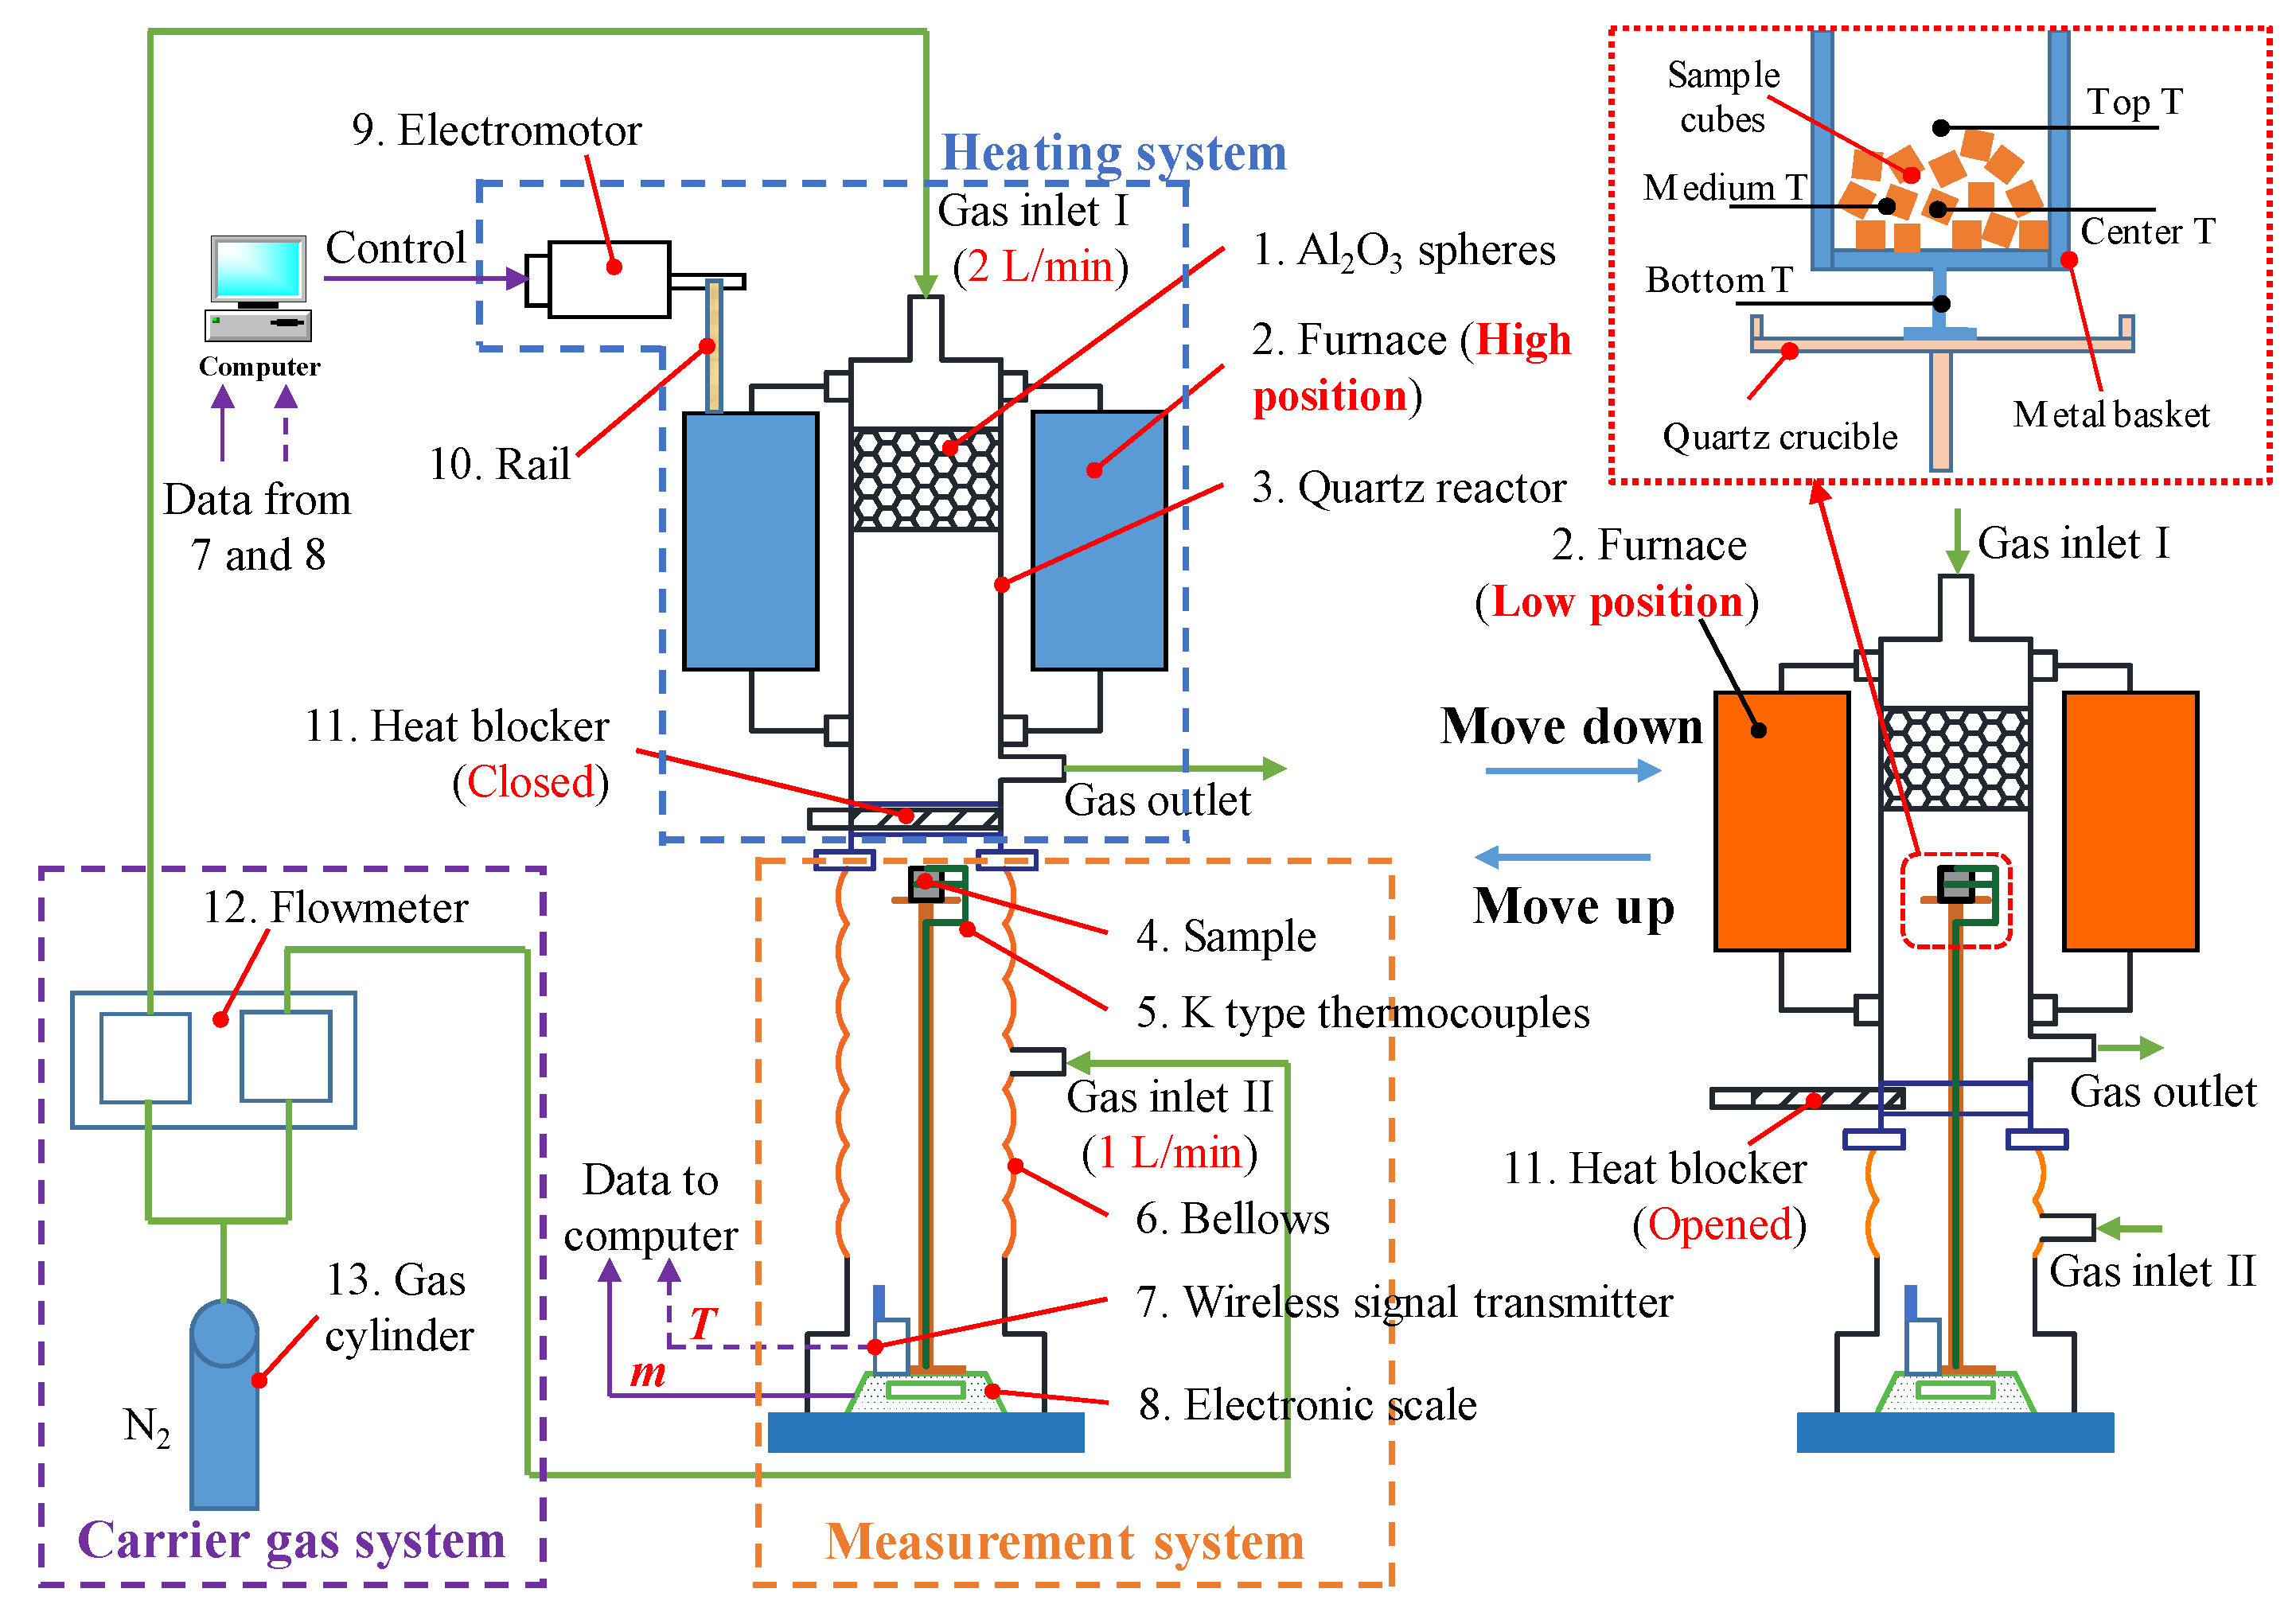
23] can perform fast heating pyrolysis experiments and record sample weight. However, these two devices also cannot directly obtain the sample temperature during pyrolysis. In order to conduct pyrolysis experiments with conditions similar to a grate furnace and record comprehensive and reliable thermogravimetric data, a newly built fast heating macro TGA (referred to as the Macro TGA) was applied. Due to its distinctive design, this device can perform pyrolysis experiments on centimeter-scale MSW samples at a fast heating rate, while measuring the on-line sample weight and temperature directly.
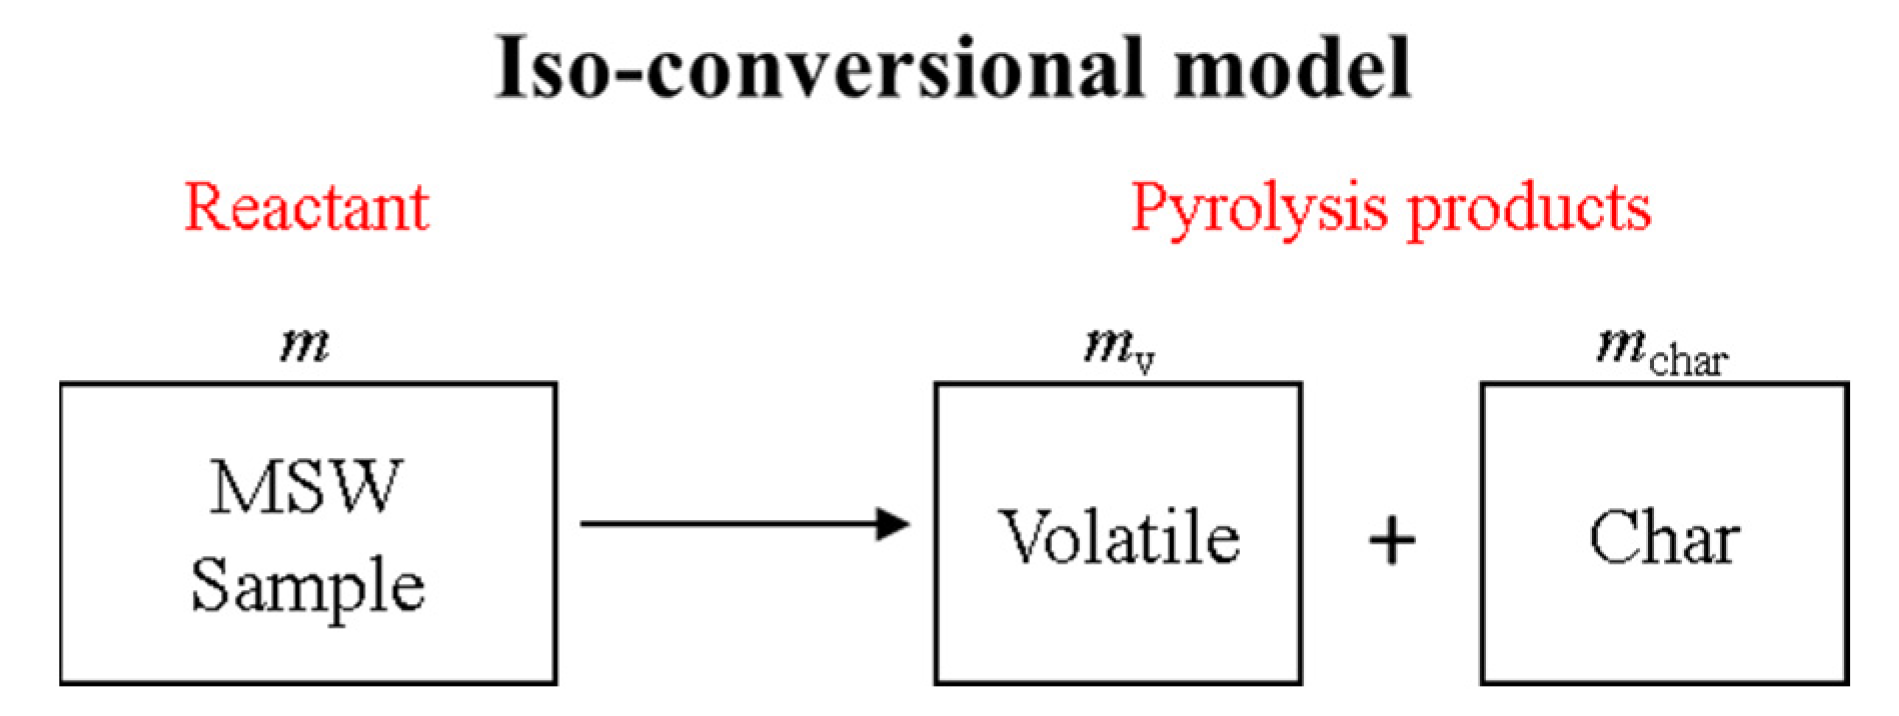
The most commonly used kinetic models for describing and predicting the characteristics of MSW pyrolysis are the iso-conversional model (ICM) and the distributed activation energy model (DAEM) [25,26,27]. The ICM assumes that the MSW sample undergoes a single-step reaction during pyrolysis, with kinetic parameters such as the pre-exponential factor A and activation energy E varying as the conversion X increases [28,29,30,31,32,33]. There are two main advantages of the ICM compared with other methods. Firstly, the ICM is a model-free method so that its calculation process to obtain kinetic parameters is concise, with no necessity to consider the pyrolysis mechanisms [34]. Secondly, under most conditions, the prediction accuracy of the ICM is relatively accurate based on its principles. Nonetheless, the International Confederation for Thermal Analysis and Calorimetry (ICTAC) has highlighted that the ICM may not be appropriate for modeling pyrolysis in specific biomass and plastic samples with complex mechanisms [35]. These samples can display characteristics such as parallel reactions, multi-step processes [36], or catalytic effects. Furthermore, while the ICM typically offers reliable predictions, it falls short in providing a thorough description of MSW pyrolysis, particularly regarding the parallel reaction characteristics.
The DAEM posits that the sample consists of several characteristic components (CCs), with pyrolysis involving the parallel reactions of these CCs. During the pyrolysis process, each CC has its own weight fraction and kinetic parameters, undergoing a single-step reaction. Unlike the ICM, the parameters for each CC remain constant throughout pyrolysis. To determine the activation energy distribution, common approaches include both model-fitting and model-free methods. In model-fitting methods [26,37], the pyrolysis mechanism and kinetic parameters must first be established. Utilizing these parameters and mechanisms, the pyrolysis conversion and rate can then be calculated under various conditions. Optimization techniques, such as genetic algorithms (GA), can be employed to minimize errors in the kinetic parameter predictions. However, model-fitting methods often require significant computational resources. Conversely, the model-free method in DAEM typically segments the sample into a finite number of CCs with equal weight fractions [38]. Generally, results obtained from methods in the ICM at each conversion value can inform the initial values of kinetic parameters for each CC [38]. Nevertheless, the assumption that all CCs undergo single-step reactions limits the DAEM’s applicability for certain MSW samples, such as PET [36].
In this study, several common issues encountered in the experimental and modeling research on MSW pyrolysis were addressed. A macro TGA was employed to investigate the pyrolysis characteristics of two representative MSW materials: cedar and polyethylene (PE). This device overcomes the limitations found in conventional equipment, such as the inability to conduct fast heating pyrolysis experiments and the lack of direct sample temperature measurements. Pyrolysis experiments were performed under both slow (10 K/min) and fast heating conditions (700, 800, and 900 °C). A newly developed discrete distributed activation energy model (DDAEM), in conjunction with a traditional ICM and DAEM, was utilized to analyze and predict pyrolysis characteristics under fast heating rates. The DDAEM, which is built upon the traditional DAEM, accommodates both single- and multi-step reaction pathways for each CC. As a result, the DDAEM offers improved predictions for the pyrolysis conversion and rate of PE compared to both the ICM and DAEM under fast heating conditions. Furthermore, the DDAEM facilitates a more thorough analysis of the factors contributing to the lower accuracy of the ICM and DAEM when predicting the pyrolysis of complex MSW samples.

2. Experimental

2.1. Materials

In this study, two representative MSW materials, cedar and PE, were used in the pyrolysis experiments. The sample analyses, including proximate and ultimate analyses, as well as measurement of heating value, were conducted, as shown in Table 1. Proximate analyses were carried out using samples on an as-received basis. Prior to the ultimate analyses and heating value measurement, the samples underwent an initial drying process at 105 °C for 6 h, followed by grinding into powders with a size of about 150 μm. The detailed calculation process can be found in Equations (S1)–(S3) in the Supplementary Materials. Before the experiments, individual materials were first cut into 5 mm cubes and then dried at 105 °C for 6 h for preparation, as shown in Figure 1.

2.2. Experimental Apparatus and Methods

In this study, experiments were conducted using a macro thermogravimetric analyzer, referred to as the Macro TGA. This device boasts several key features, including: (a) The ability to carry out pyrolysis experiments under both slow and fast heating rates. In the slow heating rate mode, the heating rate can be maintained steadily and reach up to 40 K/min. In the fast heating rate mode, the heating rate is not constant, with an average rate exceeding 500 K/min. (b) The capability to directly obtain the on-line sample weight and temperatures during the pyrolysis process. (c) The capacity to test samples of large size and mass (maximum weight: 200 g; maximum size: 60 mm).
As illustrated in Figure 2, the Macro TGA primarily consists of the carrier gas system, measurement system, and heating system. The carrier gas system’s key roles include maintaining an inert gas atmosphere within the reactor through the gas input from inlet I (2 L/min) and safeguarding the electronic scale and wireless temperature signal transmitter from corrosion caused by pyrolysis products, such as tar through the gas input from inlet II (1 L/min). The measurement system obtains on-line sample weight and temperature signals during pyrolysis. The electronic scale (XPR1203S produced by METTLER TOLEDO, made in USA) had a resolution of ±1 mg and sampled data at a frequency of 0.5 s. Prior to the experiments, samples based on a drying basis were placed in a metal basket measuring 50 mm in diameter and 60 mm in height, as depicted on the right side of Figure 2. Four thermocouples were utilized to monitor temperatures at different positions. Wireless signal transmitters (UWTC-2 produced by OMEGA, made in USA) were employed to relay temperature data from the four thermocouples. This wireless setup isolated the measurement system from other components of the Macro TGA, ensuring the high resolution of weight signal. Temperature signal resolution was ±1 K with a sampling frequency of 1 s. The heating system comprises an electric furnace, Al2O3 spheres, and a heat blocker. Fast heating was achieved through two main mechanisms. Firstly, the furnace was preheated to a high temperature before descending to expose the sample to intense heat radiation rapidly. Secondly, an incoming N2 stream from inlet I was preheated by high-temperature Al2O3 spheres, enhancing convective heat transfer between the stream and the sample. The heat blocker’s primary function was to prevent heat radiation and convection until the furnace’s movement occurs.
The Macro TGA apparatus is capable of conducting pyrolysis experiments under both slow and fast heating modes. In the slow heating mode, the procedure involved properly loading the sample and thermocouples, sealing the apparatus, and purging N2 into the system through two inlets for 5 min to create an inert atmosphere. The furnace was then lowered to the same height as the sample and heated to a steady 150 °C. Once the sample also reached 150 °C, the furnace temperature was gradually increased to 900 °C at a rate of 10 K/min. In the fast heating mode, after loading the sample and sealing the apparatus, the furnace was heated to a predetermined temperature, such as 900 °C. During this phase, the heat blocker remained closed while N2 was purged into the system. Upon reaching the target temperature, the heat blocker was opened, and the furnace was swiftly lowered to the same level as the sample within 30 s, exposing the sample to a high-temperature region and initiating a rapid heating process. All experimental conditions in this study are detailed in Table 2. All samples used in the pyrolysis experiments were on a drying basis.

2.3. Data Processing

During the pyrolysis experiments, the signals, including the sample weight and temperatures, were recorded. As introduced in Section 2.2, the sampling frequency for the weight signal was 0.5 s, whereas for the temperature signal, it was 1 s. For the convenience of data processing and modeling calculation, both the weight and temperature signals were interpolated into data points with an interval (∆t) of 0.1 s using linear interpolation function ‘interp1’ in MATLAB 2018b.
The pyrolysis conversion and rate at jth time step can be calculated by Equations (1) and (2) using the sample weight data. In Equation (1), m0 and mf represent the initial and final masses of the sample, and the subscript ‘E’ denotes the results derived from experimental data. In Equation (2), the pyrolysis rate will finally be smoothed by adjacent–averaging method to reduce the noise.
X E , j = m j m f / m 0 m f
d X E / d t j = X E , j X E , j 1 / Δ t
The Macro TGA could record sample temperature at four different locations, as shown in Figure 2. The characteristic temperature was defined to represent the average sample temperature, as shown in Equation (3). The characteristic temperature was actually calculated by the weighted addition of the temperatures at four locations, where λ represents the proportion of temperatures at each position. The values of λ for cedar and PE are provided in Table 3. The sample heating rate during pyrolysis is calculated by Equation (4), which will also be smoothed by adjacent–averaging method.
T j = λ 1 T top , j + λ 2 T med , j + λ 3 T cen , j + λ 4 T btm , j
d T / d t j = T j T j 1 / Δ t

3. Pyrolysis Kinetic Model

3.1. ICM

The ICM [25,26,27] assumes that during the pyrolysis process, the sample undergoes a single-step reaction and follows the Arrhenius law, as shown in Figure 3. The overall pyrolysis rate is determined by Equation (5), where mv is the normalized weight of the volatile released from the sample, A is the pre-exponential factor, E is the activation energy, R is the ideal gas constant, T is the sample temperature, and h(X) is the reaction rate function. In the ICM, it is considered that the essential kinetics parameters, such as A and E, will vary with the increase of conversion X, indicating that both A and E can be treated as functions of X, as depicted in Equation (5).
r = d X / d t = d m v / d t = A X exp E X / R T h X
The reaction rate function h(X) characterizes the pyrolysis reaction mechanism. Several typical formulations of h(X) corresponding to different mechanisms are detailed in Table S1 of the Supplementary Material [40,41]. In this study, in order to simplify the calculation process of the ICM, the samples are considered to experience the single-step first-order pyrolysis reaction.
To determine the quantitative relationships between conversion X and the kinetic parameters A and E, researchers have utilized several model-free algorithms. These include Friedman (FR) [29], Flynn–Wall–Ozawa (FWO) [30,31], Kissinger–Akahira–Sunose (KAS) [32,33], and Starink (ST) [41], as detailed in Table 4. The function g(X) in Table 4 represents the integral form of the reaction rate function h(X) described in Equation (6). Each specific formulation of h(X) corresponds to a distinct representation of g(X), as outlined in Table S1 of the Supplementary Material. The values of A and E at a particular conversion are obtained by analyzing the intercept and slope of the target curves at that conversion level, which are derived from varying heating rates or sample temperatures, as demonstrated in Table 4.
g X = 0 X 1 h X d X = T 0 T A β exp E R T d T
As outlined in Table 4, among these algorithms, FR is presented in a differential form, whereas FWO, KAS, and ST are depicted in integral form. Differential algorithms can assess pyrolysis kinetic parameters under both steady and unsteady heating rates β, whereas integral algorithms are limited to scenarios involving a steady heating rate. As shown in Table 4, the heating rate β appears in all target equations and curves for the integral algorithms, but it is absent in the differential FR. At fast heating rates, the temperature of the sample typically does not rise in a linear fashion over time. Therefore, FR is chosen to calculate the kinetic parameters for each individual waste material.
The ICM usually chooses more than 10 points evenly distributed within the conversion range of 0.1 to 0.9, calculating the kinetic parameters A and E at each point using experimental data from different heating rates [35,38]. In this study, the pyrolysis kinetic parameters were assessed using the FR method for conversion values ranging from 0.05 to 0.95, with increments of 0.05.

3.2. DAEM

The DAEM assumes that the MSW sample contains multiple CCs, which are indexed as i, where i = 1, 2, 3, …, s [26,38,42], as shown in Figure 4. The pyrolysis of the MSW sample is the sum of the independent and parallel decomposition reactions of each CC. All CCs follow a single-step pyrolysis reaction pathway. In Figure 4, φ and mCC represent the weight fraction and normalized weight of each CC, mv and mchar represent the normalized weight of the volatile and char produced by the decomposition of each CC.
The pyrolysis conversion for each CC is specified by Equation (7), where mv,i denotes the normalized mass of the volatile produced from the ith CC. The pyrolysis rate for each CC is determined using Equation (8), following the Arrhenius law, akin to Equation (5). However, in the DAEM framework, the kinetic parameters for all CCs remain constant and do not vary with the increase in conversion X. In the DAEM calculations, it is assumed that all CCs undergo a single-step first-order pyrolysis reaction.
X i = m v , i
r i = d X i / d t = A i exp E i / R T h i X i
The overall pyrolysis conversion and rate of the MSW sample are calculated by the weighted summation of each CC, as shown in Equations (9) and (10), where φi is the weight fraction of the ith CC in the sample.
X = 1 s φ i X i
r = d X / d t = 1 s φ i d X i / d t
In the DAEM, the model-fitting method and model-free method are most widely applied to solve the pyrolysis kinetic parameters.
The model-fitting approach generally presumes that the sample is composed of an infinite number of CCs. The distribution of activation energy among these CCs is continuous and can be represented by the function f(E). This f(E) typically conforms to specific forms, such Logistic [43], Weibull [44], or Gaussian [42], or their combination [37]. To identify the parameters, the pyrolysis mechanism and initial values of the kinetic parameters for each CC must first be established. An optimization algorithm is subsequently utilized to derive the kinetic parameters by minimizing the error function. It is crucial to highlight that the model-fitting method often demands considerable computational resources and operates under the assumption of a constant heating rate β [26].
The model-free method segments the sample into a finite number of CCs, each assigned equal weight fractions [34,45]. First, the initial values of the kinetic parameters for each CC can be calculated using the algorithms in the ICM, as shown in Table 4. Next, the weight fraction of each CC should be updated through sensitivity analysis using matrix calculations [34,45]. This step should be based on a constant heating rate β. In this study, the model-free method, FR, is used to calculate the initial kinetic parameters in the DAEM. Due to the unsteady heating rate during fast pyrolysis, the weight fraction of each CC cannot be updated. Therefore, the initial kinetic parameters are directly applied to calculate pyrolysis conversion and rate.

3.3. DDAEM

The DDAEM is an advancement of the traditional DAEM, which posits that the sample is made up of a finite number of CCs. However, different from the traditional DAEM, the newly built DDAEM allows the CCs to undergo both single- and multi-step pyrolysis reaction paths.
Figure 5 presents a schematic diagram illustrating the pyrolysis process of cedar. Cedar is considered to consist of four CCs, each undergoing single-step pyrolysis reactions. Therefore, the pyrolysis conversion and rate of each CC and the overall sample can be calculated by the same equations in the DAEM, as shown in Equations (7)–(10). However, in the DDAEM, a novel form of h(X) [36,46] was proposed, as illustrated in Equation (11). This function combines the reaction order kinetic [47] and random pore model [48,49], where a signifies the reaction order, and b represents the parameter for pore morphology evolution.
h X = 1 X a 1 b ln 1 X 0.5
The schematic diagram of PE pyrolysis is shown in Figure 6, illustrating that PE consists of three CCs, with two undergoing double-step reactions and one undergoing a single-step reaction. In the double-step reaction, the corresponding CC first converts into a precursor, which does not result in weight loss for the sample, as the precursor is not released into the atmosphere. Subsequently, the precursor transforms into volatile and char products, ultimately leading to the weight loss of the sample.
For CC3, which experiences single-step pyrolysis reaction, the pyrolysis rate can be calculated by the same method as shown in Equations (7), (8) and (11); while for CC1 and CC2, the reaction rate of the first step reaction, second step reaction, and the normalized mass change rate of the precursor can be calculated by Equations (12)–(14). The overall pyrolysis rate of PE is calculated by the weighted summation of each CC, as shown in Equation (15).
r i , 1 = d 1 m CC , i d t = A i , 1 exp E i , 1 R T h 1 m CC , i , i = 1 ,   2
r i , 2 = d m v , i d t = A i , 2 exp E i , 2 R T h m v , i m p , i , i = 1 ,   2
d m p , i / d t = r i , 1 r i , 2 , i = 1 ,   2
r = d X / d t = i = 1 s φ i r i
To provide a clearer comparison of the principles, advantages, disadvantages, kinetic parameter solving methods, and the processes for calculating pyrolysis conversion and rate for the ICM, DAEM, and DDAEM, Figure S1 in the Supplementary Material serves as a valuable reference.
In the DDAEM, the kinetic parameters are optimized through GA by minimizing the error function presented in Equation (16), utilizing experimental data collected at all three temperatures.
E r r o r φ i , A i , E i , a i , b i = c o n d j X E , j X M , j 2 , c o n d = 700 , 800 , 900   ° C

4. Results and Discussion

4.1. Experimental Results and Model Calculation for Cedar

4.1.1. Typical Experimental Results of Cedar Under Slow and Fast Heating Rates

Figure 7 illustrates the experimental results of cedar slow pyrolysis at a heating rate of 10 K/min. As illustrated in Figure 7a, a temperature gradient was present in the sample during the first 40 min, with a maximum temperature difference of 23 °C between Ttop and Tbtm. As shown in Figure 7b, the characteristic heating rate initially increased to approximately 13 K/min. However, as the pyrolysis rate rose, the heating rate subsequently decreased to about 10 K/min and remained stable until 75 min.
The pyrolysis conversion and rate curves indicate that the process can be divided into a fast reaction stage and a slow reaction stage. Stage I, the fast reaction stage, occurred between 10 and 28 min. During this stage, the sample temperature increased from 205 °C to 412 °C, while the conversion rose from 0 to 0.852. The pyrolysis conversion curve exhibited an ‘S’ shape, and the pyrolysis rate curve showed one main peak and two shoulder peaks. According to the guidelines published by the ICTAC, each peak or shoulder peak usually corresponds to at least one CC [14,35,50]. To minimize the number of CCs needed to describe the pyrolysis process of the cedar sample, the number of CCs for cedar in the DDAEM was finally determined to be three. The maximum pyrolysis rate reached 0.133 min−1, with corresponding values of time, conversion, and characteristic temperature at 23.95 min, 0.602, and 645 °C, respectively. Stage II was the slow reaction stage, which began at 28 min. During this stage, the pyrolysis conversion slowly increased until the end of pyrolysis.
Figure 8 presents the experimental results of cedar fast pyrolysis at 700 °C. As shown in Figure 8a, the temperature gradient was more pronounced under fast heating compared to slow heating, with a maximum temperature difference of 543 °C between Ttop and Tbtm. As the furnace moved down, the characteristic heating rate quickly reached a maximum of 822 K/min at 0.40 min. The weight loss of cedar began at 0.39 min when the characteristic temperature reached 161 °C. The rapid increase in the pyrolysis rate led to a significant decrease in the sample heating rate. As the pyrolysis rate declined, the rate of decrease in the heating rate became slower.
Based on the conversion and pyrolysis rate curves, the pyrolysis of cedar samples can be divided into two stages. Stage I, occurring from 0.39 to 2 min, was a fast reaction stage in which the conversion increased sharply to 0.821. During this stage, the pyrolysis rate curve exhibited a clear characteristic peak, with corresponding values of 0.847 min−1 for the pyrolysis rate, 1.20 min for occurrence time, and 0.439 for conversion value. Compared to the slow heating mode, no shoulder peaks appeared in the pyrolysis rate curve under fast heating. This reduction is attributed to the sample entering the high-temperature range within a short time during fast heating, which exacerbated the overlap of the weight loss time intervals for parallel reactions. Stage II began after 2 min and represented a slow reaction stage, characterized by a pyrolysis rate lower than 0.105 min−1.
Figure 9 compares the thermogravimetric pyrolysis characteristics of cedar under slow and fast heating rate conditions. Figure 9a shows that at a slow heating rate of 10 K/min, the temperature range was 286–362 °C as the conversion increased from 0.1 to 0.6. By contrast, under fast heating rates of 700, 800, and 900 °C, the corresponding temperature ranges were 286–362 °C, 331–522 °C, and 402–544 °C, respectively, indicating a clear shift to higher temperature regions as the heating rate increased. As the heating rate rose, the maximum pyrolysis rates were 0.134, 0.847, 0.955, and 1.565 min−1, occurring at temperatures of 362, 455, 460, and 478 °C, as shown in Figure 9b. In Figure 9b, the green arrows indicate the pyrolysis rate curve corresponding to the left vertical axis value for the slow heating pyrolysis at 10 K/min. The black arrows represent the rate curves for three operating conditions at furnace temperatures of 700, 800, and 900 °C under the fast heating mode, corresponding to the right vertical axis values. The arrows in subsequent figures in this paper serve the same purpose as those in this figure.

4.1.2. DDAEM Prediction for Cedar Fast Heating Pyrolysis

The DDAEM, improved from the traditional DAEM, was developed to describe the fast heating pyrolysis of cedar. The optimized weight fraction and kinetic parameters of each CC are shown in Table 5. The contribution of each CC and its corresponding parallel reaction to the overall fast heating pyrolysis rate of cedar under 700 °C is shown in Figure 10. The parallel reaction of CC1 took place at first, followed by CC2 and CC3. CC1 mainly contributed to the pyrolysis rate before 1 min. CC2 guaranteed the maximum pyrolysis heating rate in Stage I. CC3 mainly contributed to the slow conversion increase after 2 min in Stage II.
Figure 11 illustrates the experimental outcomes and the DDAEM predictions for the fast pyrolysis of cedar at temperatures of 700, 800, and 900 °C, focusing on both the conversion and the rate of pyrolysis. The model’s predictions closely match the experimental data. As depicted in Figure 11a, it is clear that the pyrolysis rate increases significantly with higher furnace temperatures. The duration required to reach a conversion of 0.8 was 1.87, 1.51, and 1.10 min, respectively, while the model estimated these times to be 1.75, 1.48, and 1.11 min, indicating a strong correlation with the experimental findings. Figure 11b shows that the maximum pyrolysis rates at elevated temperatures were 0.847, 0.955, and 1.565 min−1, occurring at 1.20, 0.96, and 0.71 min, respectively. The DDAEM predictions for the maximum pyrolysis rates were 1.004, 1.173, and 1.639 min−1, with corresponding times of 1.18, 0.94, and 0.62 min.

4.1.3. ICM and DAEM Prediction for Cedar

In the ICM, the kinetic parameters calculated by the differential algorithm FR are shown in Figure S2 and Table S2 in the Supplementary Material. Based on the calculation results in the Supplementary Material, the changes in activation energy E and the logarithmic pre-exponential factor ln(A) with respect to conversion, as well as the relationship between E and ln(A), are presented in Figure 12. As shown in Figure 12a, the activation energy initially increased from 29.89 kJ/mol to 152.94 kJ/mol as conversion rose from 0.05 to 0.85. It then rapidly decreased to 42.13 kJ/mol when the conversion reached 0.95. The ln(A) curve displays a trend that closely resembles that of the activation energy. The study conducted by Liu et al. [51] revealed that the pyrolysis activation energy of cedar ranges from 147.77 to 199.39 kJ/mol under a slow heating rate, which is higher than the activation energy calculated in this study. This difference may be attributed to the varying heating rates during the pyrolysis process. As illustrated in Figure 12b, ln(A) and E generally follow a linear relationship, with the exception of the points at conversions of 0.90 and 0.95. This result is in strong agreement with the findings from Várhegyi’s study [52]. According to the guidelines of the ICTAC [35], the differential algorithm, such as FR, directly uses the pyrolysis rate and sample temperature to calculate kinetic parameters without any approximations. Typically, the pyrolysis rate is calculated using Equation (2) and then smoothed by relevant algorithms. However, not all noise can be adequately eliminated, particularly when the absolute pyrolysis rate is low, such as during the initial and final stages of pyrolysis. Therefore, in the final stage of paper pyrolysis, when the conversion exceeds 0.90, the points do not align closely with the regression line.
Figure 13 illustrates a comparison between the experimental data and the ICM predictions for fast pyrolysis of cedar, indicating that the ICM effectively predicts both the conversion and rate of pyrolysis. In Figure 13a, the predicted times to reach a conversion of 0.8 are 1.78, 1.47, and 1.06 min, closely matching the experimental times of 1.87, 1.51, and 1.10 min. Figure 13b shows that the ICM forecasts maximum pyrolysis rates of 0.863, 1.048, and 1.690 min−1, which align well with the experimental rates of 0.847, 0.955, and 1.565 min−1.
The DAEM was also employed to calculate the pyrolysis conversion and rate of cedar during fast heating pyrolysis using a model-free method. Since the heating rate β during fast pyrolysis is not constant, the weight fraction of each CC cannot be updated through sensitivity analysis [34,45]. Therefore, the kinetic parameters calculated by the FR in the ICM were directly utilized as the kinetic parameters for each CC. The comparison between the experimental results and the DAEM predictions for pyrolysis conversion and rate is illustrated in Figure 14, revealing that the DAEM failed to accurately predict either parameter. The predicted times required for conversion to reach 0.8 were 2.15, 1.54, and 1.18 min, while the experimental results were 1.87, 1.51, and 1.10 min, respectively. The inaccuracies in the DAEM predictions were primarily due to the weight fractions of each component not being updated.
The comparison between the experimental and model-predicted cedar pyrolysis conversion using the DDAEM, ICM, and DAEM is shown in Figure S3 in the Supplementary Material. This figure reveals that both the DDAEM and ICM provide accurate predictions, with results within ±10%, although the DDAEM performs slightly better than ICM. By contrast, the DAEM does not yield accurate predictions. For cedar, all CCs undergo a single-step reaction, which allows the ICM to provide accurate predictions. In the case of the DAEM, the inaccuracy is primarily due to the unsteady heating rate (β), meaning that the weight fraction of each CC cannot be updated through matrix calculations [34,45].

4.2. Experimental Results and Model Calculation for PE

4.2.1. Typical Experimental Results of PE Under Slow and Fast Heating Rates

Figure 15 illustrates the experimental results of PE slow pyrolysis at 10 K/min. As shown in Figure 15a, a temperature gradient was present in the sample during 0–35 min, with a maximum temperature difference of 20 °C between Ttop and Tbtm. Additionally, compared to the slow heating pyrolysis of cedar, the disparity between the sample temperatures and the furnace temperature of PE is more pronounced. This may be attributed to the melting of PE, which absorbs more heat. As illustrated in Figure 15b, the characteristic heating rate initially increased to approximately 18 K/min. However, as the pyrolysis rate rose, the heating rate subsequently decreased to about 10 K/min and remained stable until 75 min.
The curves for pyrolysis conversion and rate suggest that the process consists of a single fast heating reaction stage when subjected to a slow heating rate. At 32 min, as the characteristic temperature reached 402 °C, the conversion rapidly increased, and the pyrolysis concluded at approximately 41 min. According to Figure 15b, the maximum pyrolysis rate reached 0.239 min−1, with corresponding values of time, conversion, and characteristic temperature at 36.23 min, 0.419, and 469 °C, respectively. In contrast to cedar, no multi-peak characteristics are observed in the PE slow heating pyrolysis rate curve.
Figure 16 presents the experimental results of PE fast pyrolysis at 700 °C. Figure 16a illustrated a more pronounced temperature gradient under a fast heating rate compared to a slow heating rate, with a maximum temperature difference of 456 °C between Ttop and Tbtm. As the furnace moved downward, the heating rate reached the first peak at 499 K/min at 0.41 min. Subsequently, due to the melting of the PE sample, the heating rate decreased to about 100 K/min. After melting, the heating rate rapidly increased again, reaching 635 K/min at 2.27 min. When the pyrolysis rate reached its maximum, the heating rate dropped to 0 K/min, while the characteristic temperature stabilized at around 655 °C. This stabilization occurred due to a balance between heat transfer and the heat absorbed by the pyrolysis process. As pyrolysis concluded, the heating rate slightly increased to about 37 K/min before ultimately decreasing to 0 K/min.
The conversion and pyrolysis rate curves indicate that the pyrolysis of PE samples can be categorized into three distinct stages when subjected to fast heating rates. Stage I occurred between 1.4 and 2.3 min, during which the conversion curves displayed an ‘S’ shape, and the pyrolysis rate curves exhibited a peak. The peak pyrolysis rate in Stage I was 0.220 min−1, occurring at 1.84 min. Stage II took place from 2.3 to 4 min, with the shapes of the conversion and rate curves resembling those of Stage I. However, the peak pyrolysis rate reached 1.008 min−1 at 3.35 min. Stage III began after 4 min, during which the pyrolysis conversion increased slowly until the end of the process.
Figure 17 compares the thermogravimetric pyrolysis characteristics of PE under slow and fast heating rate conditions. Figure 17a shows that at a slow heating rate of 10 K/min, the temperature range was 448–655 °C as the conversion increased from 0.1 to 0.6. By contrast, under fast heating rates with furnace temperatures of 700, 800, and 900 °C, the corresponding temperature ranges were 505–647, 575–700 and 623–737 °C, respectively, indicating a clear shift to higher temperature regions as the heating rate increased. As the heating rate rose, the maximum pyrolysis rates were 0.239, 1.008, 1.246, and 1.776 min−1, occurring at temperatures of 469, 656, 719, and 760 °C, as shown in Figure 17b.
The pyrolysis characteristics of cedar and polyethylene (PE) exhibit notable differences when comparing Figure 7, Figure 8, Figure 9, Figure 15, Figure 16 and Figure 17.
Cedar is a typical sample where all CCs undergo a single-step pyrolysis reaction. Under slow heating rates, the pyrolysis rate curve for cedar shows distinct multi-peak characteristics, with two shoulder peaks appearing before and after the main peak. However, when the pyrolysis shifts to fast heating, the multi-peak characteristics disappear, and only one main peak is observed. This change occurs because, at fast heating rates, reactions with both low and high activation energies tend to occur earlier, leading to a stronger overlap among these parallel reactions.
By contrast, the pyrolysis characteristics of PE under slow and fast heating rates are quite different from those of cedar. Under slow heating rates, the pyrolysis rate curve for PE displays only one peak, without any shoulder peaks. However, under fast heating rates, the overlap between parallel reactions becomes significantly weaker, resulting in two distinct peaks observed in Stage I and Stage II. This phenomenon strongly indicates the multi-step pyrolysis reactions of the CCs in PE.
Key evidence supporting the notion that cedar and PE follow different pyrolysis mechanisms can be found by comparing Figure 9 and Figure 17. Using fast heating pyrolysis at 700 °C as an example, two typical points were selected for each sample, as shown in Figure 9b and Figure 17b. The corresponding time, conversion, pyrolysis rate, and characteristic temperature for these four points are listed in Table 6. For cedar, from point A to point B, as the sample temperature increased from 351 to 455 °C, the pyrolysis rate only rose from 0.685 to 0.847 min−1. By contrast, for PE, from point C to point D, as the sample temperature increased from 630 to 656 °C, the pyrolysis rate surged from 0.217 to 1.008 min−1. Assuming both cedar and PE adhere to single-step first-order pyrolysis kinetics, as described in Equation (17), the calculated activation energies for cedar and PE are 22.17 and 1360.80 kJ/mol, respectively. The activation energy calculated for PE from the single-step first-order reaction is unreasonable; as such, a high activation energy typically prevents the pyrolysis reaction from occurring at a sample temperature of only about 650 °C. Therefore, in the DDAEM, a double-step reaction was employed to accurately describe parallel reactions in the pyrolysis of PE.
r = d X / d t = A exp E / R T 1 X

4.2.2. DDAEM Prediction for PE Fast Heating Pyrolysis

The optimized kinetic parameters for the fast heating pyrolysis of PE in the DDAEM are presented in Table 7. The results indicate that both CC1 and CC2 undergo double-step reactions, while CC3 follows a single-step reaction.
Using the kinetic parameters from Table 7, Figure 18 illustrates the contributions of each reaction to the overall pyrolysis rate of PE. CC1 corresponds to the first peak in the pyrolysis rate during Stage I, while CC2 corresponds to the peak in Stage II. CC3 contributes to the slower pyrolysis conversion increase in Stage II. For both CC1 and CC2, the rate-limiting steps are the reactions of the first step, R1,1, and R2,1. The use of a double-step reaction ensures the accuracy of the predicted peak pyrolysis rates and their corresponding times.
Figure 19 displays the experimental results alongside the DDAEM predictions for the fast pyrolysis of PE at temperatures of 700, 800, and 900 °C, covering both pyrolysis conversion and rate. The model predictions are in close agreement with the experimental findings. As shown in Figure 19a, it is clear that higher furnace temperatures significantly enhance the pyrolysis rate. The time taken to reach a conversion of 0.8 was 3.51, 2.49, and 1.84 min, respectively, while the model estimated these times at 3.63, 2.54, and 1.86 min, indicating strong concordance with the experimental data. In Figure 19b, it is noted that at higher temperatures, the maximum pyrolysis rates reached 1.008, 1.246, and 1.776 min−1, occurring at times of 3.35, 2.31, and 1.66 min, respectively. The DDAEM projected maximum pyrolysis rates of 0.832, 1.173, and 1.639 min−1, with corresponding times of 3.17, 2.34, and 1.64 min. Additionally, the DDAEM was able to accurately forecast the initial peak in the pyrolysis rate curves across all three temperatures.

4.2.3. ICM and DAEM Prediction for PE

In the ICM, the kinetic parameters calculated using the differential algorithm FR are presented in Figure S3 and Table S3 in the Supplementary Material. Figure 20 illustrates the changes in E and ln(A) as a function of X, along with the relationships between E and ln(A) based on the results shown in Table 6. As shown in Figure 20, the activation energy increases from 5.53 to 155.28 kJ/mol as conversion rises from 0.05 to 0.15. Subsequently, it decreases rapidly to 63.51 kJ/mol when conversion reaches 0.35. Finally, the activation energy gradually declines to 16.47 kJ/mol by the end of the pyrolysis process. The curve for ln(A) displays a similar trend to that of E. The study by Zhang et al. [53] revealed that the activation energy of polyethylene (PE) ranges from 218.13 to 244.08 kJ/mol under a slow heating rate, which is significantly higher than the results obtained in this study. This difference may be attributed to variations in sample size and heating rates. As illustrated in Figure 20b, ln(A) and E generally exhibit a linear relationship, except for the points at a conversion of 0.05.
Figure 21 compares the experimental results with the ICM predictions for the fast pyrolysis of PE. The findings reveal that the ICM accurately predicts the conversion and rate curves when the conversion exceeds 0.2, although it exhibits discrepancies at lower conversion levels. Notably, at a conversion rate of 0.8, the predicted times are 3.46, 2.49, and 1.83 min, which correspond well with the experimental data. The predicted maximum pyrolysis rates were 0.993, 1.379, and 1.786 min−1, with corresponding times of 3.28, 2.34, and 1.64 min, also consistent with experimental findings. However, during the initial phase, when the conversion is below 0.2, the ICM predicted conversion increases much more rapidly than the experimental results. At all three temperatures, the ICM estimated time to achieve a conversion of 0.06 was about 0.65 min, whereas the experimental times recorded were 1.89, 1.39, and 1.11 min. Additionally, the ICM’s prediction of the first peak in the pyrolysis rate curves was also inaccurate. For all three temperatures, the first peak occurred at 0.55 min, with a value of 0.156 min−1, failing to accurately represent both the peak value and the corresponding time.
The inaccurate predictions of the ICM during the initial period are primarily attributed to the single-step reaction kinetics and low activation energy. As shown in Table 6, the activation energy at a conversion value of 0.05 is only 5.53 kJ/mol, leading the ICM to predict that PE pyrolysis would begin at relatively low temperatures. As the conversion increases from 0.15 to 0.2, the activation energy rises above 100 kJ/mol, which slows the rate of conversion. Once the conversion exceeds 0.2, the activation energy decreases to approximately 60 kJ/mol, similar to the activation energy of the second-step reaction R2,2 of CC2, as indicated in Table 7. Consequently, both the ICM and DAEM can provide accurate predictions in Stage II. However, while the ICM accurately predicts conversion and pyrolysis rates during this stage, it does not offer a clear description of the pyrolysis mechanism.
The DAEM was utilized to forecast the kinetics of fast pyrolysis of PE, as illustrated in Figure 22. Similar to the cedar analysis, 19 CCs were used, and the kinetic parameters calculated from the ICM were directly applied to each CC. As shown in Figure 22a, when conversion reached 0.6 under 700, 800, and 900 °C, the DAEM predicted times were 2.80, 2.03, and 1.54 min, which had a big gap with the experimental results of 3.31, 2.33, and 1.71 min. As shown in Figure 22b, the maximum pyrolysis rates predicted by the DAEM were 0.610, 0.617, and 0.973 min−1, which is much lower than the experimental results.
Figure S5 in the Supplementary Material compares the experimental PE fast pyrolysis conversion and model predicted results by the DDAEM, ICM and DAEM. The results indicate that the prediction accuracy of the three models is ranked from high to low as follows: DDAEM, ICM, and DAEM. Among them, the prediction accuracy of the DAEM is within ±10%. The prediction accuracy of the ICM is lower at lower pyrolysis conversion rates; however, as the experimental conversion rate exceeds 0.2, the prediction accuracy of the ICM can reach within ±10%. For the DAEM, due to the variable heating rate in the fast pyrolysis process, it is challenging to optimize the kinetic parameters obtained from the ICM, resulting in a prediction error greater than ±10%.

5. Conclusions

This study employed the Macro TGA to perform pyrolysis experiments on cedar and PE under both slow (10 K/min) and fast (700, 800, and 900 °C) heating rates. A newly developed DDAEM, along with the traditional ICM and DAEM, was employed to predict pyrolysis characteristics under fast heating rates.
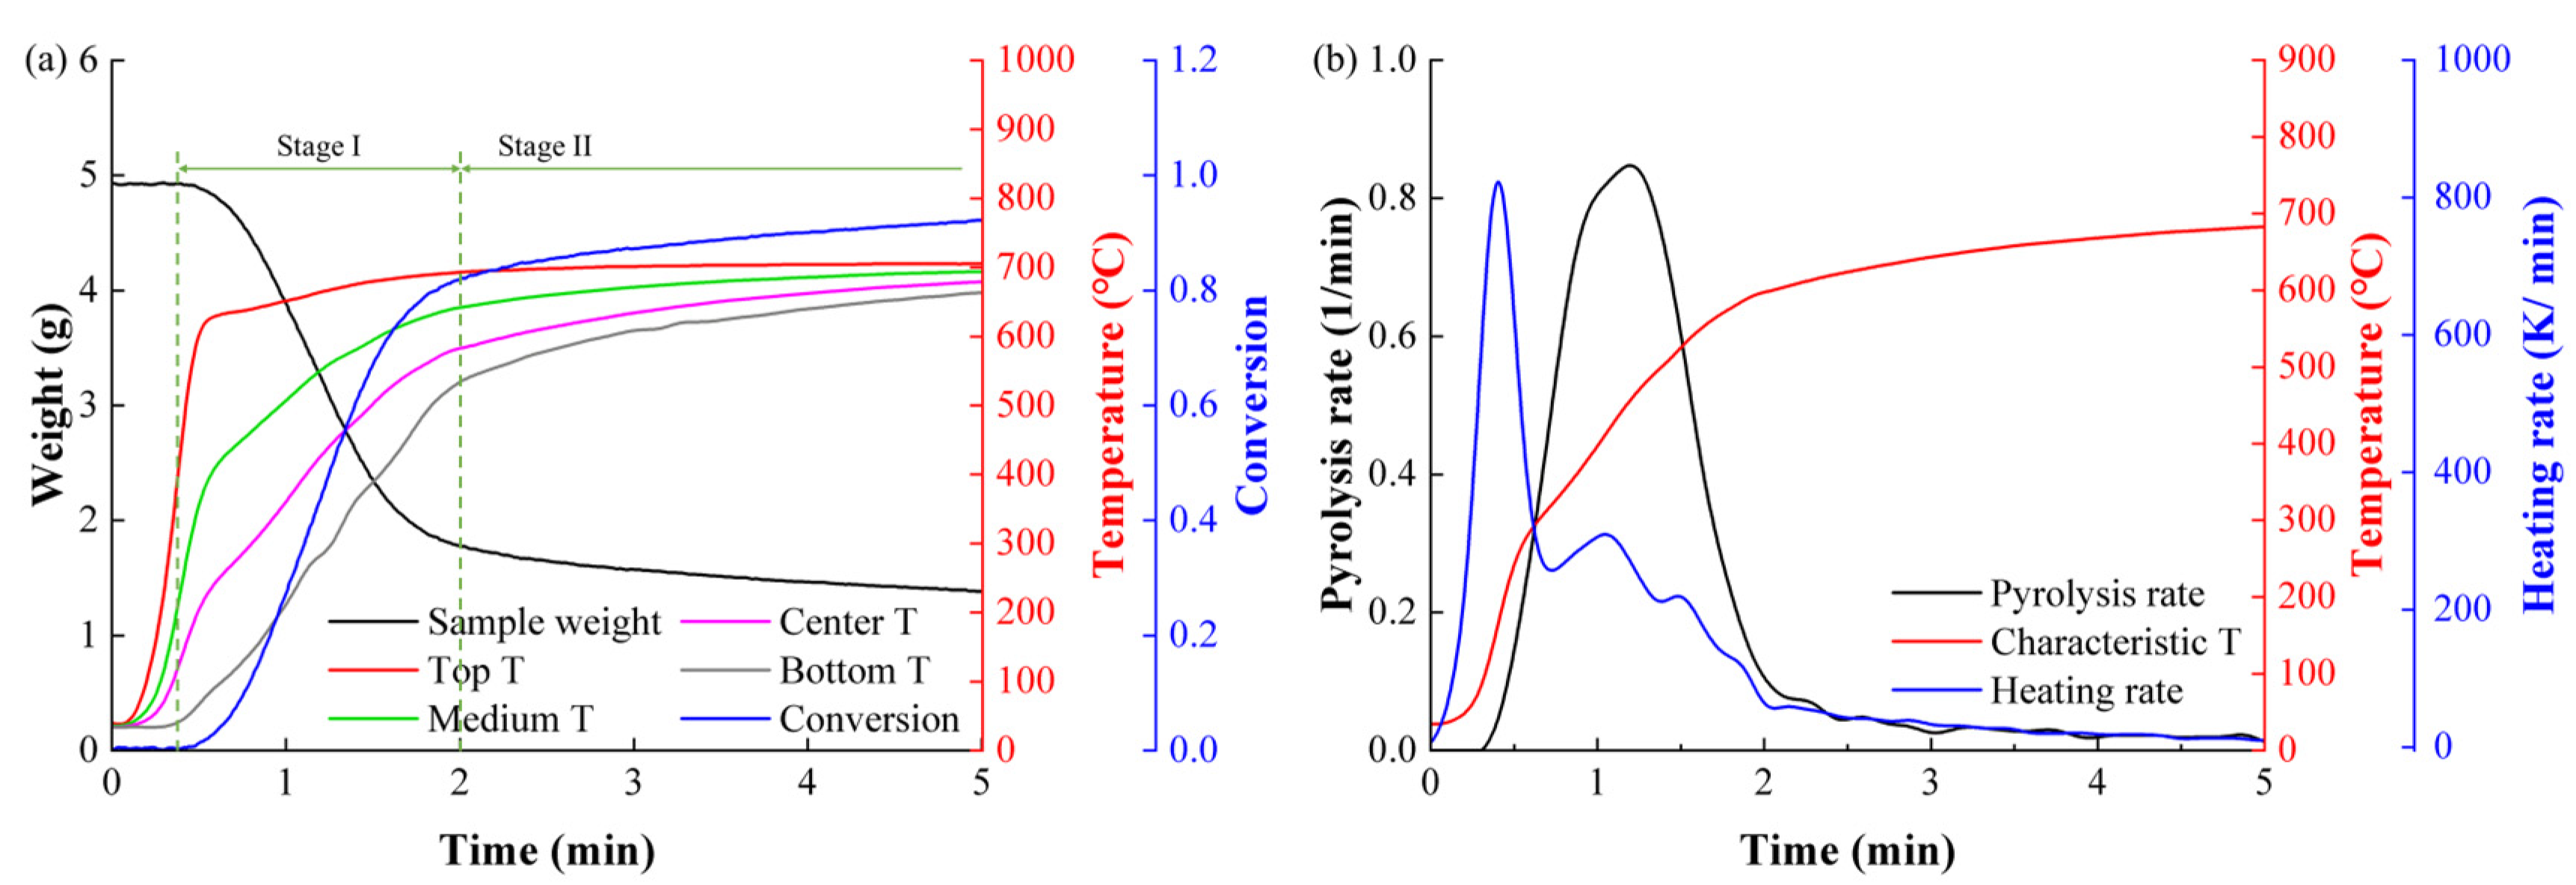
For cedar, the pyrolysis rate curve exhibited distinct shoulder-peak characteristics under slow heating, while only a single peak was observed under fast heating. At a fast heating rate of 700 °C, the pyrolysis rate for cedar increased from 0.685 to 0.847 min−1 as the temperature rose over 100 °C, from 351 to 455 °C. This phenomenon indicates that all CCs underwent single-step reactions. The average activation energies calculated from the ICM and DDAEM were 66.37 and 48.08 kJ/mol, respectively. Both the ICM and DDAEM provide accurate predictions of pyrolysis conversion and rate; however, the prediction accuracy of the DAEM is considerably lower.
The pyrolysis rate curve for PE displayed two prominent peaks under fast heating, whereas only one peak was evident under slow heating, highlighting a significant difference from cedar. At a fast heating rate of 700 °C, the rate increased from 0.217 to 1.008 min−1 with a smaller temperature rise from 630 to 656 °C. Therefore, some CCs in PE are considered to undergo multi-step pyrolysis reactions. The DDAEM demonstrated significantly higher predictive accuracy than the ICM and DAEM. The DDAEM showed that, as PE conversion increased from 0.25 to 0.65, the average activation energy of 58.32 kJ/mol calculated by ICM represented the final step reaction rather than the rate-limiting step.

Supplementary Materials

The following supporting information can be downloaded at: https://www.mdpi.com/article/10.3390/pr12122618/s1, Figure S1: Mathematical expressions of h(X) and g(X) based on the most common reaction mechanisms; Figure S2: The ln(dX/dt)-(1000/T) curves of cedar fast heating pyrolysis at each conversion; Figure S3: Experimental and modeling comparison of cedar fast heating pyrolysis conversion: (a) DDAEM; (b) ICM; (c) DAEM; Figure S4: The ln(dX/dt)-(1/T) curves of cedar fast heating pyrolysis at each conversion; Figure S5: Experimental and modeling comparison of PE fast heating pyrolysis conversion: (a) DDAEM; (b) ICM; (c) DAEM; Table S1: Mathematical expressions of h(X) and g(X) based on the most common reaction mechanisms; Table S2: Results of kinetic parameters for cedar fast heating pyrolysis in ICM calculated by FR; Table S3: Results of kinetic parameters for PE fast heating pyrolysis in ICM calculated by FR.

Author Contributions

Conceptualization, S.W. and Z.L.; Methodology, H.L. and Q.D.; Validation, S.W. and H.L.; Investigation, S.W., H.L., Q.D., J.L. and Q.S.; Data curation, S.W.; Writing—original draft, S.W. and H.L.; Writing—review & editing, Z.L.; Visualization, S.W., H.L., Q.D., J.L. and Q.S.; Supervision, Z.L.; Project administration, H.L. and Z.L.; Funding acquisition, Z.L. All authors have read and agreed to the published version of the manuscript.

Funding

This research was funded by the collaboration research of Tsinghua University and China Datang Technology Innovation Co., Ltd.: Research on the Green Hydrogen Ammonia Alcohol Technology Route and Key Technologies for Biomass Chemical Looping Gasification to Produce Methanol.

Data Availability Statement

The original contributions presented in this study are included in the article. Further inquiries can be directed to the corresponding author.

Acknowledgments

This study was supported by the collaborating research between Tsinghua University and China Datang Technology Innovation Co., Ltd., “Research on the Green Hydrogen Ammonia Alcohol Technology Route and Key Technologies for Biomass Chemical Looping Gasification to Produce Methanol”.

Conflicts of Interest

Authors Sanjun Wu, Haiyang Liu and Qiwei Duan were employed by the China Datang Technology Innovation Co., Ltd. The remaining authors declare that the research was conducted in the absence of any commercial or financial relationships that could be construed as a potential conflict of interest. The China Datang Technology Innovation Co., Ltd. had no role in the design of the study; in the collection, analyses, or interpretation of data; in the writing of the manuscript, or in the decision to publish the results.

References

  1. Tang, Y.; Huang, Q.; Sun, K.; Chi, Y.; Yan, J. Co-Pyrolysis Characteristics and Kinetic Analysis of Organic Food Waste and Plastic. Bioresour. Technol. 2018, 249, 16–23. [Google Scholar] [CrossRef] [PubMed]
  2. Monisha, R.S.; Mani, R.L.; Sivaprakash, B.; Rajamohan, N.; Vo, D.-V.N. Green Remediation of Pharmaceutical Wastes Using Biochar: A Review. Environ. Chem. Lett. 2021, 20, 681–704. [Google Scholar] [CrossRef]
  3. Lu, J.W.; Zhang, S.; Hai, J.; Lei, M. Status and Perspectives of Municipal Solid Waste Incineration in China: A Comparison with Developed Regions. Waste Manag. 2017, 69, 170–186. [Google Scholar] [CrossRef]
  4. Nandhini, R.; Berslin, D.; Sivaprakash, B.; Rajamohan, N.; Vo, D.N. Thermochemical Conversion of Municipal Solid Waste into Energy and Hydrogen: A Review. Environ. Chem. Lett. 2022, 20, 1645–1669. [Google Scholar] [CrossRef]
  5. Xiaoxin, Z.; Jin, H.; Ling, L.; Sinan, Z. Current Status of Technology and Standards of Domestic Solid Waste Incineration in China. 2020 IOP Conf. Ser. Earth Environ. Sci. 2020, 510, 042035. [Google Scholar] [CrossRef]
  6. Hosseini Rahdar, M.; Nasiri, F.; Lee, B. A Review of Numerical Modeling and Experimental Analysis of Combustion in Moving Grate Biomass Combustors. Energy Fuels 2019, 33, 9367–9402. [Google Scholar] [CrossRef]
  7. Haseli, Y.; van Oijen, J.A.; de Goey, L.P. A Detailed One-Dimensional Model of Combustion of a Woody Biomass Particle. Bioresour. Technol. 2011, 102, 9772–9782. [Google Scholar] [CrossRef]
  8. Arenas, C.N.; Navarro, M.V.; Martinez, J.D. Pyrolysis Kinetics of Biomass Wastes Using Isoconversional Methods and the Distributed Activation Energy Model. Bioresour. Technol. 2019, 288, 121485. [Google Scholar] [CrossRef]
  9. Williams, A.; Pourkashanian, M.; Jones, J.M. The Combustion of Coal and Some Other Solid Fuels. Proc. Combust. Inst. 2000, 28, 2141–2162. [Google Scholar] [CrossRef]
  10. Tian, B.; Qiao, Y.Y.; Tian, Y.Y.; Liu, Q. Investigation on the Effect of Particle Size and Heating Rate on Pyrolysis Characteristics of a Bituminous Coal by Tg–Ftir. J. Anal. Appl. Pyrolysis 2016, 121, 376–386. [Google Scholar] [CrossRef]
  11. Maqsood, T.; Dai, J.; Zhang, Y.; Guang, M.; Li, B. Pyrolysis of Plastic Species: A Review of Resources and Products. J. Anal. Appl. Pyrolysis 2021, 159, 105295. [Google Scholar] [CrossRef]
  12. Brems, A.; Baeyens, J.; Beerlandt, J.; Dewil, R. Thermogravimetric Pyrolysis of Waste Polyethylene-Terephthalate and Polystyrene: A Critical Assessment of Kinetics Modelling. Resour. Conserv. Recycl. 2011, 55, 772–781. [Google Scholar] [CrossRef]
  13. Wang, B.; Xu, F.; Zong, P.; Zhang, J.; Tian, Y.; Qiao, Y. Effects of Heating Rate on Fast Pyrolysis Behavior and Product Distribution of Jerusalem Artichoke Stalk by Using Tg-Ftir and Py-Gc/Ms. Renew. Energy 2019, 132, 486–496. [Google Scholar] [CrossRef]
  14. Koga, N.; Vyazovkin, S.; Burnham, A.K.; Favergeon, L.; Muravyev, N.V.; Pérez-Maqueda, L.A.; Saggese, C.; Sánchez-Jiménez, P.E. Ictac Kinetics Committee Recommendations for Analysis of Thermal Decomposition Kinetics. Thermochim. Acta 2023, 719, 179384. [Google Scholar] [CrossRef]
  15. Chen, Z.; Hu, M.; Zhu, X.; Guo, D.; Liu, S.; Hu, Z.; Xiao, B.; Wang, J.; Laghari, M. Characteristics and Kinetic Study on Pyrolysis of Five Lignocellulosic Biomass Via Thermogravimetric Analysis. Bioresour. Technol. 2015, 192, 441–450. [Google Scholar] [CrossRef] [PubMed]
  16. Diblasi, C. Modeling Chemical and Physical Processes of Wood and Biomass Pyrolysis. Prog. Energy Combust. Sci. 2008, 34, 47–90. [Google Scholar] [CrossRef]
  17. Li, J.; Qiao, Y.; Zong, P.; Qin, S.; Wang, C.; Tian, Y. Fast Pyrolysis Characteristics of Two Typical Coastal Zone Biomass Fuels by Thermal Gravimetric Analyzer and Down Tube Reactor. Bioresour. Technol. 2019, 283, 96–105. [Google Scholar] [CrossRef]
  18. Meng, A.; Chen, S.; Long, Y.; Zhou, H.; Zhang, Y.; Li, Q. Pyrolysis and Gasification of Typical Components in Wastes with Macro-Tga. Waste Manag. 2015, 46, 247–256. [Google Scholar] [CrossRef]
  19. Becidan, M. Experimental Studies on Municipal Solid Waste and Biomass Pyrolysis. Ph.D. Thesis, Norwegian University of Science and Technology, Trondheim, Norway, 2007. [Google Scholar]
  20. Castro, C.; Gonçalves, M.; Longo, A.; Vilarinho, C.; Ferreira, M.; Ribeiro, A.; Pacheco, N.; Teixeira, J.C. Influence of Temperature in the Thermo-Chemical Decomposition of Below-Stoichiometric Rdf Char—A Macro Tga Study. Energies 2023, 16, 3064. [Google Scholar] [CrossRef]
  21. He, C. Biomass and Municipal Solid Waste (Msw) Pyrolysis in a Bench-Scale Drop Tube Reactor. Master’s Thesis, University of Calgary, Calgary, AB, Canada, 2023. [Google Scholar]
  22. Wu, Z.; Wang, S.; Zhao, J.; Chen, L.; Meng, H. Product Distribution During Co-Pyrolysis of Bituminous Coal and Lignocellulosic Biomass Major Components in a Drop-Tube Furnace. Energy Fuels 2015, 29, 4168–4180. [Google Scholar] [CrossRef]
  23. Xue, Y.; Zhou, S.; Brown, R.C.; Kelkar, A.; Bai, X. Fast Pyrolysis of Biomass and Waste Plastic in a Fluidized Bed Reactor. Fuel 2015, 156, 40–46. [Google Scholar] [CrossRef]
  24. Anuar Sharuddin, S.D.; Abnisa, F.; Wan Daud, W.M.A.; Aroua, M.K. A Review on Pyrolysis of Plastic Wastes. Energy Convers. Manag. 2016, 115, 308–326. [Google Scholar] [CrossRef]
  25. Mortezaeikia, V.; Tavakoli, O.; Khodaparasti, M.S. A Review on Kinetic Study Approach for Pyrolysis of Plastic Wastes Using Thermogravimetric Analysis. J. Anal. Appl. Pyrolysis 2021, 160, 105340. [Google Scholar] [CrossRef]
  26. Cai, J.; Wu, W.; Liu, R. An Overview of Distributed Activation Energy Model and Its Application in the Pyrolysis of Lignocellulosic Biomass. Renew. Sustain. Energy Rev. 2014, 36, 236–246. [Google Scholar] [CrossRef]
  27. Li, J.; Qiao, Y.; Zong, P.; Wang, C.; Tian, Y.; Qin, S. Thermogravimetric Analysis and Isoconversional Kinetic Study of Biomass Pyrolysis Derived from Land, Coastal Zone, and Marine. Energy Fuels 2019, 33, 3299–3310. [Google Scholar] [CrossRef]
  28. Baroni, É.D.G.; Tannous, K.; Rueda-Ordóñez, Y.J.; Tinoco-Navarro, L.K. The Applicability of Isoconversional Models in Estimating the Kinetic Parameters of Biomass Pyrolysis. J. Therm. Anal. Calorim. 2015, 123, 909–917. [Google Scholar] [CrossRef]
  29. Friedman, H.L. Kinetics of Thermal Degradation of Char-Forming Plastics from Thermogravimetry. Application to a Phenolic Plastic. J. Polym. Sci. Part C Polym. Symp. 1964, 6, 183–195. [Google Scholar] [CrossRef]
  30. Flynn, J.H.; Wall, L.A. A Quick, Direct Method for the Determination of Activation Energy from Thermogravimetric Data. J. Polym. Sci. Part B Polym. Lett. 1966, 4, 323–328. [Google Scholar] [CrossRef]
  31. Ozawa, T. A New Method of Analyzing Thermogravimetric Data. Bull. Chem. Soc. Jpn. 1965, 38, 1881–1886. [Google Scholar] [CrossRef]
  32. Kissinger, H.E. Differential Thermal Analysis. J. Res. Natl. Bur. Stand. 1956, 57, 217. [Google Scholar] [CrossRef]
  33. Akahira, T. Trans. Joint Convention of Four Electrical Institutes. Res. Rep. Chiba Inst. Technol. 1971, 16, 22–31. [Google Scholar]
  34. Shokri, A.; Fotovat, F. Kinetic Analysis and Modeling of Paper-Laminated Phenolic Printed Circuit Board (Plp-Pcb) Pyrolysis Using Distributed Activation Energy Models (Daems). Thermochim. Acta 2023, 724, 179513. [Google Scholar] [CrossRef]
  35. Vyazovkin, S.; Burnham, A.K.; Criado, J.M.; Pérez-Maqueda, L.A.; Popescu, C.; Sbirrazzuoli, N. Ictac Kinetics Committee Recommendations for Performing Kinetic Computations on Thermal Analysis Data. Thermochim. Acta 2011, 520, 1–19. [Google Scholar] [CrossRef]
  36. Wu, S.; Li, J.; Sun, Q.; Li, Z. Experimental and Kinetic Study of Pet Pyrolysis under Fast and Slow Heating Rates Using a Visualized Macro Tga. Thermochim. Acta 2024, 739, 179812. [Google Scholar] [CrossRef]
  37. Tian, Y.; Perré, P. Multiple-Distribution Daem Modelling of Spruce Pyrolysis: An Investigation of the Best Trade-Off Regarding the Number and Shape of Distributions. Energy Convers. Manag. 2021, 229, 113756. [Google Scholar] [CrossRef]
  38. Liu, H.; Ahmad, M.S.; Alhumade, H.; Elkamel, A.; Sammak, S.; Shen, B. A Hybrid Kinetic and Optimization Approach for Biomass Pyrolysis: The Hybrid Scheme of the Isoconversional Methods, Daem, and a Parallel-Reaction Mechanism. Energy Convers. Manag. 2020, 208, 112531. [Google Scholar] [CrossRef]
  39. Wu, S.; Li, Z. Experimental and Modeling Study on Centimeter Pine Char Combustion in Fast-Heating Macro Tga. Proc. Combust. Inst. 2023, 39, 3497–3508. [Google Scholar] [CrossRef]
  40. Alhulaybi, Z.; Dubdub, I. Comprehensive Kinetic Study of Pet Pyrolysis Using Tga. Polymers 2023, 15, 3010. [Google Scholar] [CrossRef]
  41. Aboulkas, A.; El harfi, K.; El Bouadili, A. Thermal Degradation Behaviors of Polyethylene and Polypropylene. Part I: Pyrolysis Kinetics and Mechanisms. Energy Convers. Manag. 2010, 51, 1363–1369. [Google Scholar] [CrossRef]
  42. de Caprariis, B.; De Filippis, P.; Herce, C.; Verdone, N. Double-Gaussian Distributed Activation Energy Model for Coal Devolatilization. Energy Fuels 2012, 26, 6153–6159. [Google Scholar] [CrossRef]
  43. Chandrasekharan, L.C.; White, N. A New Distributed Activation Energy Model Using Weibull Distribution for the Representation of Complex Kinetics. Energy Fuels 1994, 8, 1158–1167. [Google Scholar]
  44. Cai, J.; Jin, C.; Yang, S.; Chen, Y. Logistic Distributed Activation Energy Model--Part 1: Derivation and Numerical Parametric Study. Bioresour. Technol. 2011, 102, 1556–1561. [Google Scholar] [CrossRef] [PubMed]
  45. Scott, S.A.; Dennis, J.S.; Davidson, J.F.; Hayhurst, A.N. An Algorithm for Determining the Kinetics of Devolatilisation of Complex Solid Fuels from Thermogravimetric Experiments. Chem. Eng. Sci. 2006, 61, 2339–2348. [Google Scholar] [CrossRef]
  46. Wu, S.; Wang, S.; Li, Z. Evaluation of Biomass Char Combustion Kinetics Using a Micro-Fluidized Bed with Thermogravimetry–Mass Spectrometry. Energy Fuels 2023, 37, 14021–14032. [Google Scholar] [CrossRef]
  47. White, J.E.; Catallo, W.J.; Legendre, B.L. Biomass Pyrolysis Kinetics: A Comparative Critical Review with Relevant Agricultural Residue Case Studies. J. Anal. Appl. Pyrolysis 2011, 91, 1–33. [Google Scholar] [CrossRef]
  48. Bhatia, S.K.; Perlmutter, D.D. A Random Pore Model for Fluid-Solid Reactions: I. Isothermal, Kinetic Control. AIChE 1980, 26, 379–386. [Google Scholar] [CrossRef]
  49. Bhatia, S.K.; Perlmutter, D.D. A Random Pore Model for Fluid-Solid Reactions: II. Diffusion and Transport Effects. AIChE 1981, 27, 247–254. [Google Scholar] [CrossRef]
  50. Vyazovkin, S.; Burnham, A.K.; Favergeon, L.; Koga, N.; Moukhina, E.; Pérez-Maqueda, L.A.; Sbirrazzuoli, N. Ictac Kinetics Committee Recommendations for Analysis of Multi-Step Kinetics. Thermochim. Acta 2020, 689, 178597. [Google Scholar] [CrossRef]
  51. Liu, P.; Lang, P.; Chen, Z.; Li, Y.; Sun, T.; Yang, Y.; Huhe, T.; Lei, T. Relevance of Chemical Structure in Different Wood Wastes to Pyrolysis Behavior: Kinetics and Hydrogen Release. J. Energy Inst. 2023, 111, 101416. [Google Scholar] [CrossRef]
  52. Várhegyi, G.; Bobály, B.; Jakab, E.; Chen, H. Thermogravimetric Study of Biomass Pyrolysis Kinetics. A Distributed Activation Energy Model with Prediction Tests. Energy Fuels 2010, 25, 24–32. [Google Scholar] [CrossRef]
  53. Zhang, Y.; Fu, Z.; Wang, W.; Ji, G.; Zhao, M.; Li, A. Kinetics, Product Evolution, and Mechanism for the Pyrolysis of Typical Plastic Waste. ACS Sustain. Chem. Eng. 2021, 10, 91–103. [Google Scholar] [CrossRef]
Figure 1. Photos of (a) cedar and (b) PE samples.
Processes 12 02618 g001
Figure 2. Schematic diagram of the Macro TGA [39].
Processes 12 02618 g002
Figure 3. Schematic diagram of the ICM.
Processes 12 02618 g003
Figure 4. Schematic diagram of the DAEM.
Processes 12 02618 g004
Figure 5. Schematic diagram of the DDAEM for cedar.
Processes 12 02618 g005
Figure 6. Schematic diagram of the DDAEM for PE.
Processes 12 02618 g006
Figure 7. Experimental results of cedar slow pyrolysis under 10 K/min: (a) weight, temperatures and conversion; (b) pyrolysis rate, characteristic temperature and heating rate.
Processes 12 02618 g007
Figure 8. Experimental results of cedar fast pyrolysis under 700 °C: (a) weight, temperatures and conversion; (b) pyrolysis rate, characteristic temperature and heating rate.
Processes 12 02618 g008
Figure 9. Comparison of pyrolysis thermogravimetric characteristics of cedar under slow and fast heating rates: (a) X-T curves; (b) r-T curves.
Processes 12 02618 g009
Figure 10. Contributions of each CC and its corresponding parallel reaction to the overall pyrolysis rate of cedar under fast heating rate mode with 700 °C.
Processes 12 02618 g010
Figure 11. Experimental results and the DDAEM prediction of cedar fast heating pyrolysis under 700, 800, and 900 °C: (a) Conversion; (b) Pyrolysis rate.
Processes 12 02618 g011
Figure 12. The kinetic parameters and their relationships of cedar calculated by FR: (a) E-X and ln(A)-X curves; (b) ln(A)-E curve.
Processes 12 02618 g012
Figure 13. Experimental results and the ICM prediction of cedar fast heating pyrolysis under 700, 800, and 900 °C: (a) Conversion; (b) Pyrolysis rate.
Processes 12 02618 g013
Figure 14. Experimental results and DAEM prediction of cedar fast heating pyrolysis under 700, 800, and 900 °C: (a) Conversion; (b) Pyrolysis rate.
Processes 12 02618 g014
Figure 15. Experimental results of PE slow pyrolysis under 10 K/min: (a) weight, temperatures and conversion; (b) pyrolysis rate, characteristic temperature and heating rate.
Processes 12 02618 g015
Figure 16. Experimental results of PE fast pyrolysis under 700 °C: (a) weight, temperatures and conversion; (b) pyrolysis rate, characteristic temperature and heating rate.
Processes 12 02618 g016
Figure 17. Comparison of pyrolysis thermogravimetric characteristics of PE under slow and fast heating rates: (a) Conversion-Temperature curves; (b) Pyrolysis rate-Temperature curves.
Processes 12 02618 g017
Figure 18. Contributions of each parallel reaction to the overall pyrolysis rate of PE under fast heating rate mode with 700 °C furnace temperature.
Processes 12 02618 g018
Figure 19. Experimental results and the DDAEM prediction of PE fast heating pyrolysis under 700, 800, and 900 °C: (a) Conversion; (b) Pyrolysis rate.
Processes 12 02618 g019
Figure 20. The kinetic parameters and their relationships of PE calculated by FR: (a) E-X and ln(A)-X curves; (b) ln(A)-E curve.
Processes 12 02618 g020
Figure 21. Experimental results and ICM prediction of PE fast heating pyrolysis under 700, 800, and 900 °C: (a) Conversion; (b) Pyrolysis rate.
Processes 12 02618 g021
Figure 22. Experimental results and the DAEM prediction of PE fast heating pyrolysis under 700, 800, and 900 °C: (a) Conversion; (b) Pyrolysis rate.
Processes 12 02618 g022
Table 1. Results of proximate and ultimate analyses, as well as heating value.
No. (i)SampleProximate Analysis [ar, %]Ultimate Analysis [Dry, %]HHV [Dry]LHV [Dry]
MVFCACHNOSAMJ/kgMJ/kg
1cedar2.7677.3619.410.4751.076.130.1042.160.060.4820.7319.35
2PE0.1699.830.320.0073.3811.620.1014.900.000.0044.6642.04
Table 2. Operation conditions of pyrolysis experiments.
SamplesModeConditionsSample Mass [Dry]
cedar and PESlow heating10 K/min~5 g
Fast heating700, 800, 900 °C~5 g
Table 3. Values of parameter λ to determine characteristic sample temperature.
No. (i)Sampleλ1λ2λ3λ4
TtopTmedTcenTbtm
1Cedar0100
2PE0010
Table 4. Common algorithms of ICM to calculate kinetic parameters.
AlgorithmTarget EquationTypeTarget CurveRef.
FR ln d X d t = ln A h X E R T Differentialln(dX/dt)-(1/T)[29]
FWO ln β = ln A E R g X E R T Integralln(β)-(1/T)[30,31]
KAS ln β T 2 = ln A E R g X E R T Integralln(β/T2)-(1/T)[32,33]
ST ln β T 1.92 = 1.0008 E R T + C Integralln(β/T1.92)-(1/T)[41]
Table 5. Weight fraction and kinetic parameters of each CC for cedar fast heating pyrolysis.
ReactionφA (1/s)E (kJ/mol)ab
CedarCC1R10.18004910
CC2R20.73200511.20
CC3R30.170.53510
Table 6. Key information at the four selected points during cedar and PE pyrolysis under 700 °C.
SamplePointst (min)Xr (min−1)T (°C)
CedarA0.840.1510.685351
B1.190.4330.847455
PEC2.960.3020.650650
D3.350.6421.008656
Table 7. Weight fraction and kinetic parameters of each CC for PE fast heating pyrolysis.
ReactionφA (1/s)E (kJ/mol)ab
PECC1R4,110.086 × 1036515
-R4,12-12008
CC2R4,210.881 × 10511010
-R4,22-4 × 1016007
CC3R4,30.042 × 1005010
Disclaimer/Publisher’s Note: The statements, opinions and data contained in all publications are solely those of the individual author(s) and contributor(s) and not of MDPI and/or the editor(s). MDPI and/or the editor(s) disclaim responsibility for any injury to people or property resulting from any ideas, methods, instructions or products referred to in the content.

