Article

Eliminating Scraps in Refrigerator Door Sealing—A Six Sigma Case Study

by
Ioana-Cătălina Enache
1,*,
Oana Roxana Chivu
2 and
Florin-Felix Raduică
1
1
Department of Engineering Graphics and Industrial Design, National University of Science and Technology Politehnica Bucharest, Splaiul Independenței Nr. 313, 060042 Bucharest, Romania
2
Quality Engineering and Industrial Technologies, National University of Science and Technology Politehnica Bucharest, Splaiul Independentei Nr. 313, 060042 Bucharest, Romania
*
Author to whom correspondence should be addressed.
Processes 2024, 12(11), 2460; https://doi.org/10.3390/pr12112460
Submission received: 31 July 2024 / Revised: 27 October 2024 / Accepted: 5 November 2024 / Published: 6 November 2024
(This article belongs to the Section Manufacturing Processes and Systems)

Abstract

:
This paper applies the Six Sigma method to an investigation and analysis of the factors contributing to sealing problems encountered in a refrigerated appliance model. By adopting a rigorous and systematic approach, the Six Sigma method relies on the use of advanced statistical and analytical tools to minimize variability and optimize processes. By utilizing the Six Sigma methodology, this work not only identifies and remedies sealing-related problems, but also contributes to a robust and efficient manufacturing process. The proposed methodology adopts the DMAIC approach and its associated tools to evaluate the impact of waste on the production process. This study aims to demonstrate how the DMAIC approach can effectively assist the company in minimizing scrap. Furthermore, detailed recommendations regarding the application and implementation of DMAIC tools are provided, enabling the company to thoroughly assess its existing processes. These insights will empower the company to identify areas for improvement and implement strategies for ongoing enhancement and operational excellence.

1. Introduction

Currently, domestic refrigerators are among the most widely used household appliances worldwide. When reviewing the literature, we observed that the research on refrigeration appliances is mainly focused on reducing greenhouse gas emissions and increasing energy efficiency [1,2,3]. In the literature, there are a limited number of studies related to the sealing of refrigeration appliances, mainly due to the diversity of cabinet designs and sizes available on the market [4]. Consequently, to achieve optimum operating results, it is essential that the seal design and selection of manufacturing materials are considered from the initial design phase [5]. This involves careful evaluation of the technical specifications of the materials, their compatibility with the operating environment, and the stress conditions to which they will be subjected. Rigorous planning at this stage can prevent failure while also ensuring maximum durability and efficiency in practical use [6].
The gaskets currently used in refrigerator doors use magnetic strips embedded in flexible polyvinyl chloride (PVC). These magnetic strips are attached to the outer sheet metal casing of the refrigerator to ensure proper sealing. The sealing process is essential in controlling heat exchange and has a significant impact on the energy efficiency of the refrigeration appliance [7]. The magnetic seal must have a certain grip force in vertical refrigeration appliances, such as in the case of refrigerators, freezers, chillers, refrigerated display cabinets, and blast chillers. Furthermore, in horizontal refrigeration appliances, the grip force of the seal is helped by the gravity of the door. As far as gasket sealing is concerned, there are many solutions that can be applied depending on the appliance model [8,9].
The aim of the present study is to improve the sealing systems of refrigeration appliances. Eliminating seal-related rejects that may occur in the assembly process requires more than just ensuring their compliance with quality standards and meeting customer needs. The authors used the Six Sigma methodology, as it is widely employed in industrial engineering to optimize processes and eliminate scrap [10]. To reach the set goal, the main problems that lead to defective sealing in refrigeration appliances were identified. A rigorous production process analysis can facilitate understanding and managing the level of rejects and defects, to work towards quality assurance [11].
Six Sigma is a well-established methodology developed by Motorola in 1987, which aims to reduce process variability, improve performance, and increase customer satisfaction [12,13]. The five stages of this methodology—Define, Measure, Analyze, Improve, and Control (DMAIC)—have been successfully implemented across various fields [14]. The effectiveness of this method relies on employing a systematic approach, making data-driven decisions, and focusing on problem-solving [15,16].
Section 2 of this paper presents a broad survey of the literature on the Six Sigma methodology, focusing on the theoretical and application aspects of this method. Various articles that describe the implementation of Six Sigma as a process improvement method in different industries are analyzed, highlighting the associated benefits and challenges. The fundamental concepts and specific tools used in Six Sigma are underlined. In Section 3 of the present work, a detailed description of the methodology for the application of the Six Sigma method to the case study is given. The way in which the Six Sigma principles and tools used have been adapted is explained in order to present a clear picture of the preparatory steps, including the selection of the project team, the definition of the objectives, and the planning of the required resources. Section 4 is dedicated to the case study itself, where the five steps of the DMAIC methodology are covered. Each step is detailed, presenting the methods and tools used, the data collected, and the analysis performed. In Section 5, the conclusions of the article are summarized, highlighting the impact of the implementation of this method on the performance of the analyzed process.

2. Literature Review

In the manufacturing industry, maintaining high quality is essential in order for products to remain competitive in an increasingly challenging market. Quality represents the attributes that customers care about. The Six Sigma methodology is recognized for its ability to reduce variation and improve performance, in industrial processes and beyond [17,18,19,20,21]. Numerous case studies illustrate the success of Six Sigma implementation in different industries, highlighting the benefits in terms of cost reduction [22,23,24], improved product quality [25,26,27], and increased customer satisfaction [28,29,30].
Six Sigma methodologies are employed to enhance company profits by optimizing resources, minimizing waste, and improving process efficiency and productivity [31,32]. The implementation of Six Sigma can utilize various tools based on the specific needs and issues of the companies. This methodology can be applied to existing processes, products, or services by going through the five phases, which are known as DMAIC or can be converted to DMADV (Define, Measure, Analyze, Design, and Verify) for the development of new processes, products, or services [33]. The five DMAIC phases are interconnected and have the role of eliminating losses in the analyzed process [34,35]. These losses, also known as Muda [26,36], can refer to transportation, unnecessary movements, overprocessing, excess inventory, scrap, and waiting time.
Specific statistical tools designed for reducing and controlling variation can be used to achieve the objectives set in each phase of the Six Sigma methodology [14]. The specialized literature includes a series of case studies that explore the use of these tools, with the main objective of understanding the relationships between input factors and the metrics that determine the quality level of the process. In Table 1, a selection of articles is presented that detail case studies where the Six Sigma methodology has been successfully applied across various industries and processes. These studies highlight the use of a diverse range of tools and techniques throughout the DMAIC phases.
From a mathematical point of view, the phenomenon can be described by the following function:
Y = f (Xi)
where
  • Xi defined by X1, X2… Xi represents independent inputs (causes, problems, or non-conformities identified by controls);
  • Y represents the outputs (effect, symptom) dependent on the inputs defined after monitoring.
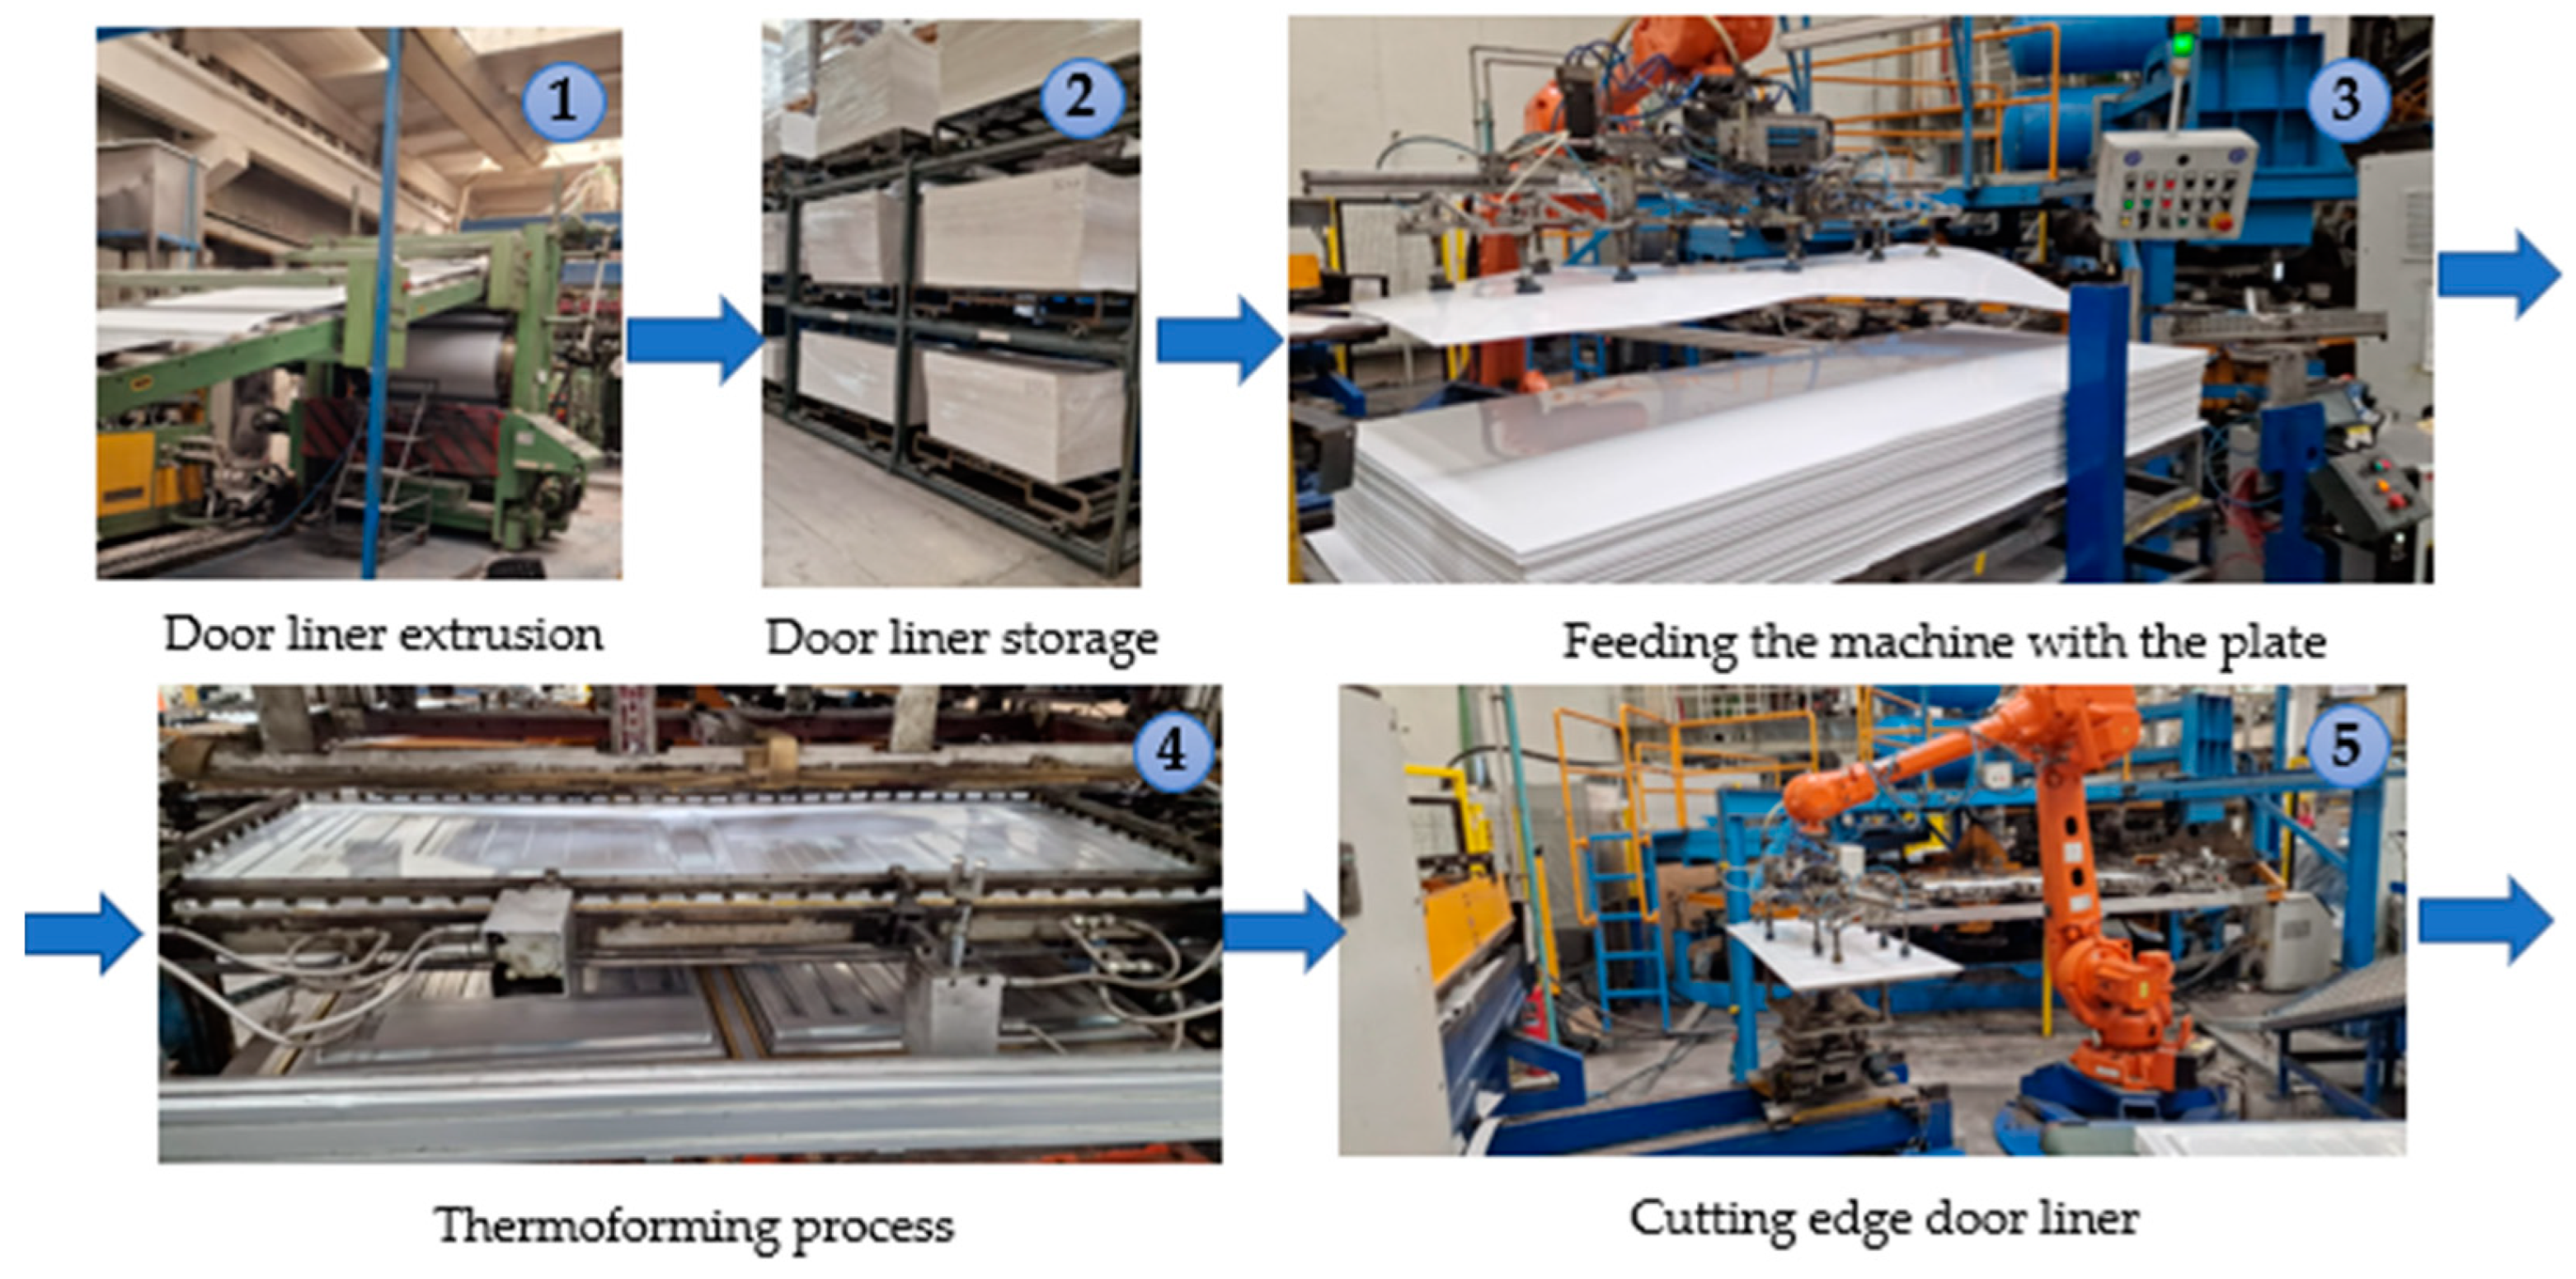
The individual measured values determine a general pattern of distribution of variation, based on which predictions can be made about a particular event. The quality level of a product, process, or service can be indicated by the Sigma level [43]. The higher the Sigma level, the higher the level of performance. The yield of Sigma can be calculated using Equation (2).
Y i e l d = n o . o p o r t u n i t i e s n o . d e f e c t s n o .   o p o r t u n i t i e s   × 100 =
The objective of companies is to achieve a Sigma level (Table 2) as high as possible, which can be indicated by the Defects Per Opportunity (DPO), calculated as the ratio of the number of defects in a process by the number of opportunities for defects. The DPO can be calculated using Equation (3).
D P O = n o .   o f   d e f e c t s n o .     o p p o r t u n i t i e s   f o r   d e f e c t s
To improve quality, it is necessary to determine the number of defects and to calculate the Defect Per Million Opportunities (DPMO) using the flawing equation. In Equation (4), we calculate the Defects Per Unit, or DPU, which quantifies the average number of defects in each product unit. It is calculated by dividing the total number of detected defects in a unit by the total number of units inspected.
D P U = n o .     o f   d e f e c t s   f o u n d   i n   a   u n i t n o .   o f   u n i t s
The DPMO indicates the number of defects that occur per one million opportunities. Essentially, it measures how often a defect or mistake happens for every possible opportunity for a defect. The DPMO can be calculated using Equation (5).
D P M O = D P U n o . o f   d e f e c t s   o p p o r t u n i t i e s   i n   a   u n i t × 100,000
PPM (Parts Per Million) assesses the probability of a defect in a product, considering each defective unit (a defective unit is an unacceptable item) as a single instance. It represents the number of defective units per one million units produced. PPM is calculated with Equation (6).
P P M = t o t a l   n o .   o f   d e f e c t i v e   u n i t s   f o u n d   i n   a   s a m p l e s a m p l e   s i z e × 1,000,000

3. Methodology

The case study was developed based on the identification of specific door sealing problems for one model of refrigeration appliances. It was observed that some appliances were not sealing due to defects in the channel supporting the door seal, which raised significant energy efficiency and product quality concerns, as seen in Figure 1. If the gasket does not seal or the door does not close properly, then frost will occur and the temperature inside the product will not meet customer standards and expectations.
To address this issue, it was decided to implement the Six Sigma methodology, with the aim of optimizing the door thermoforming process, reducing defect rates, and improving the operational efficiency. Furthermore, the decision was also driven by the fact that the number of orders for refrigerators had doubled, creating significant pressure regarding production capacity and product quality.
Through the application of this methodology, the five DMAIC steps were applied in order to reduce rejects and meet customer needs, starting from the definition phase, where the problems encountered with door sealing in refrigeration appliances were analyzed and documented, the issues requiring intervention were identified, and the objectives and targets to be achieved were clearly established. In the definition phase, tools such as SIPOC (Suppliers, Inputs, Process, Outputs, and Customers), VOC/VOB (Voice of Customers/Voice of Business), Project Charter, brainstorming [32], and VSM (Value System Map) [33] were used.
The goals for the project were as follows:
-
To reduce scrap in the thermoforming process for door liners;
-
To identify and eliminate the potential causes that could contribute to this problem;
-
To deliver a high-quality product to the customer.
During the measurement phase, measurements were taken and validated in order to identify the aspects in which to intervene. Quality tools such as process maps, the Ishikawa diagram, and the priority matrix were used.
In response to the problems identified and analyzed regarding door sealing, in the improvement phase, solutions to eliminate rejects were proposed.
The control stage is the last stage in the Six Sigma methodology and the one in which the proposed solutions are validated by monitoring the rejects related to door sealing and by verifying the fulfillment of the proposed target.
Data processing in the collection, analysis, and control stages are performed using the MINITAB 21.2.0 program.

4. Six Sigma—Case Study

4.1. Definition Phase

The definition phase identifies and describes the problems encountered in door sealing in refrigeration appliances. Also, at this stage, a team is chosen consisting of people from different departments, such as Process Quality Assurance, Tools Manufacturing, Process and Technical Control, and Constructive Design, who can contribute to the development of the project. The tools used at this stage identify the critical characteristics for quality (CTQ) and highlight issues that need correction [34].
Subsequently, these tools can
-
Assess the necessity of adapting the methodology to meet client requirements;
-
Identify key factors and determine the level of quality satisfaction;
-
Set a performance level.
The use of the SIPOC diagram at this stage is essential in understanding the thermoforming process, since door sealing issues are related to this process, as seen in Figure 2. Using the information from Suppliers, Inputs, Process, Outputs, and Customer, it is necessary for us to have an overview of the process that the door goes through on the production line. The diagram does not give much detail regarding the process steps, but it is very useful in showing the link between Suppliers, which are the input sources in the process; Inputs, which are the resources needed to run the process; the Process, where all the necessary steps are specified; Outputs, which are the results of the process; and Customers, who are the beneficiaries.
To determine customers’ feedback, preferences, expectations, and needs in relation to door sealing and gasketing, a VOC diagram was used, as illustrated in Figure 3.
To achieve a level of high quality, it is necessary to specify a target that can be stable after the careful monitoring of the process. For this case study, the number of door rejects obtained on the thermoforming line during five months was monitored, and data are presented in Table 3.
The number of rejections recorded varies from one month to another, and the percentage of rejections in relation to the number of doors made in a month is between 4.86 and 7.96%.
The PPM value is very high, as seen in Table 4, which means, according to Table 2, that the analyzed process is at Sigma level 3, which means that it is necessary to analyze and identify the necessary solutions to eliminate the rejects related to the sealing of the doors of refrigeration appliances.

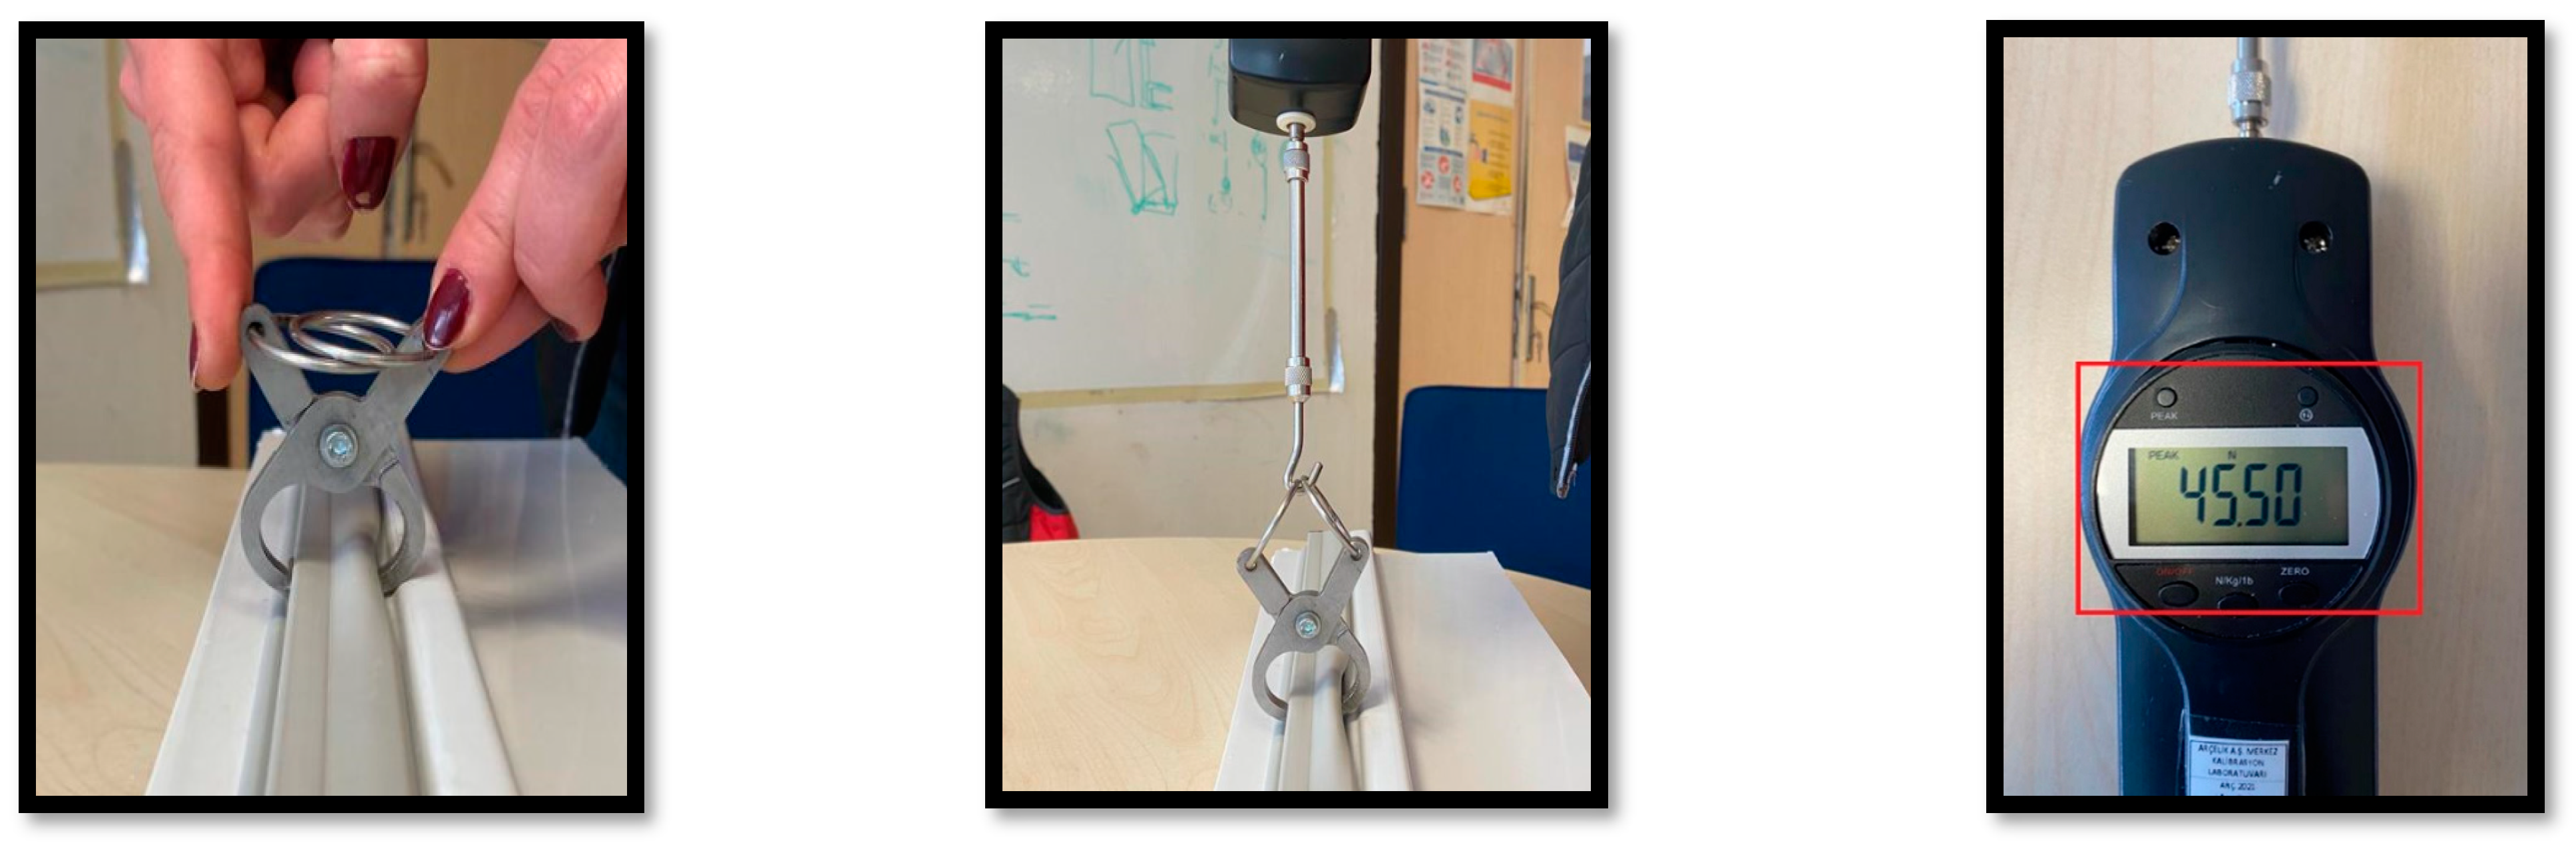
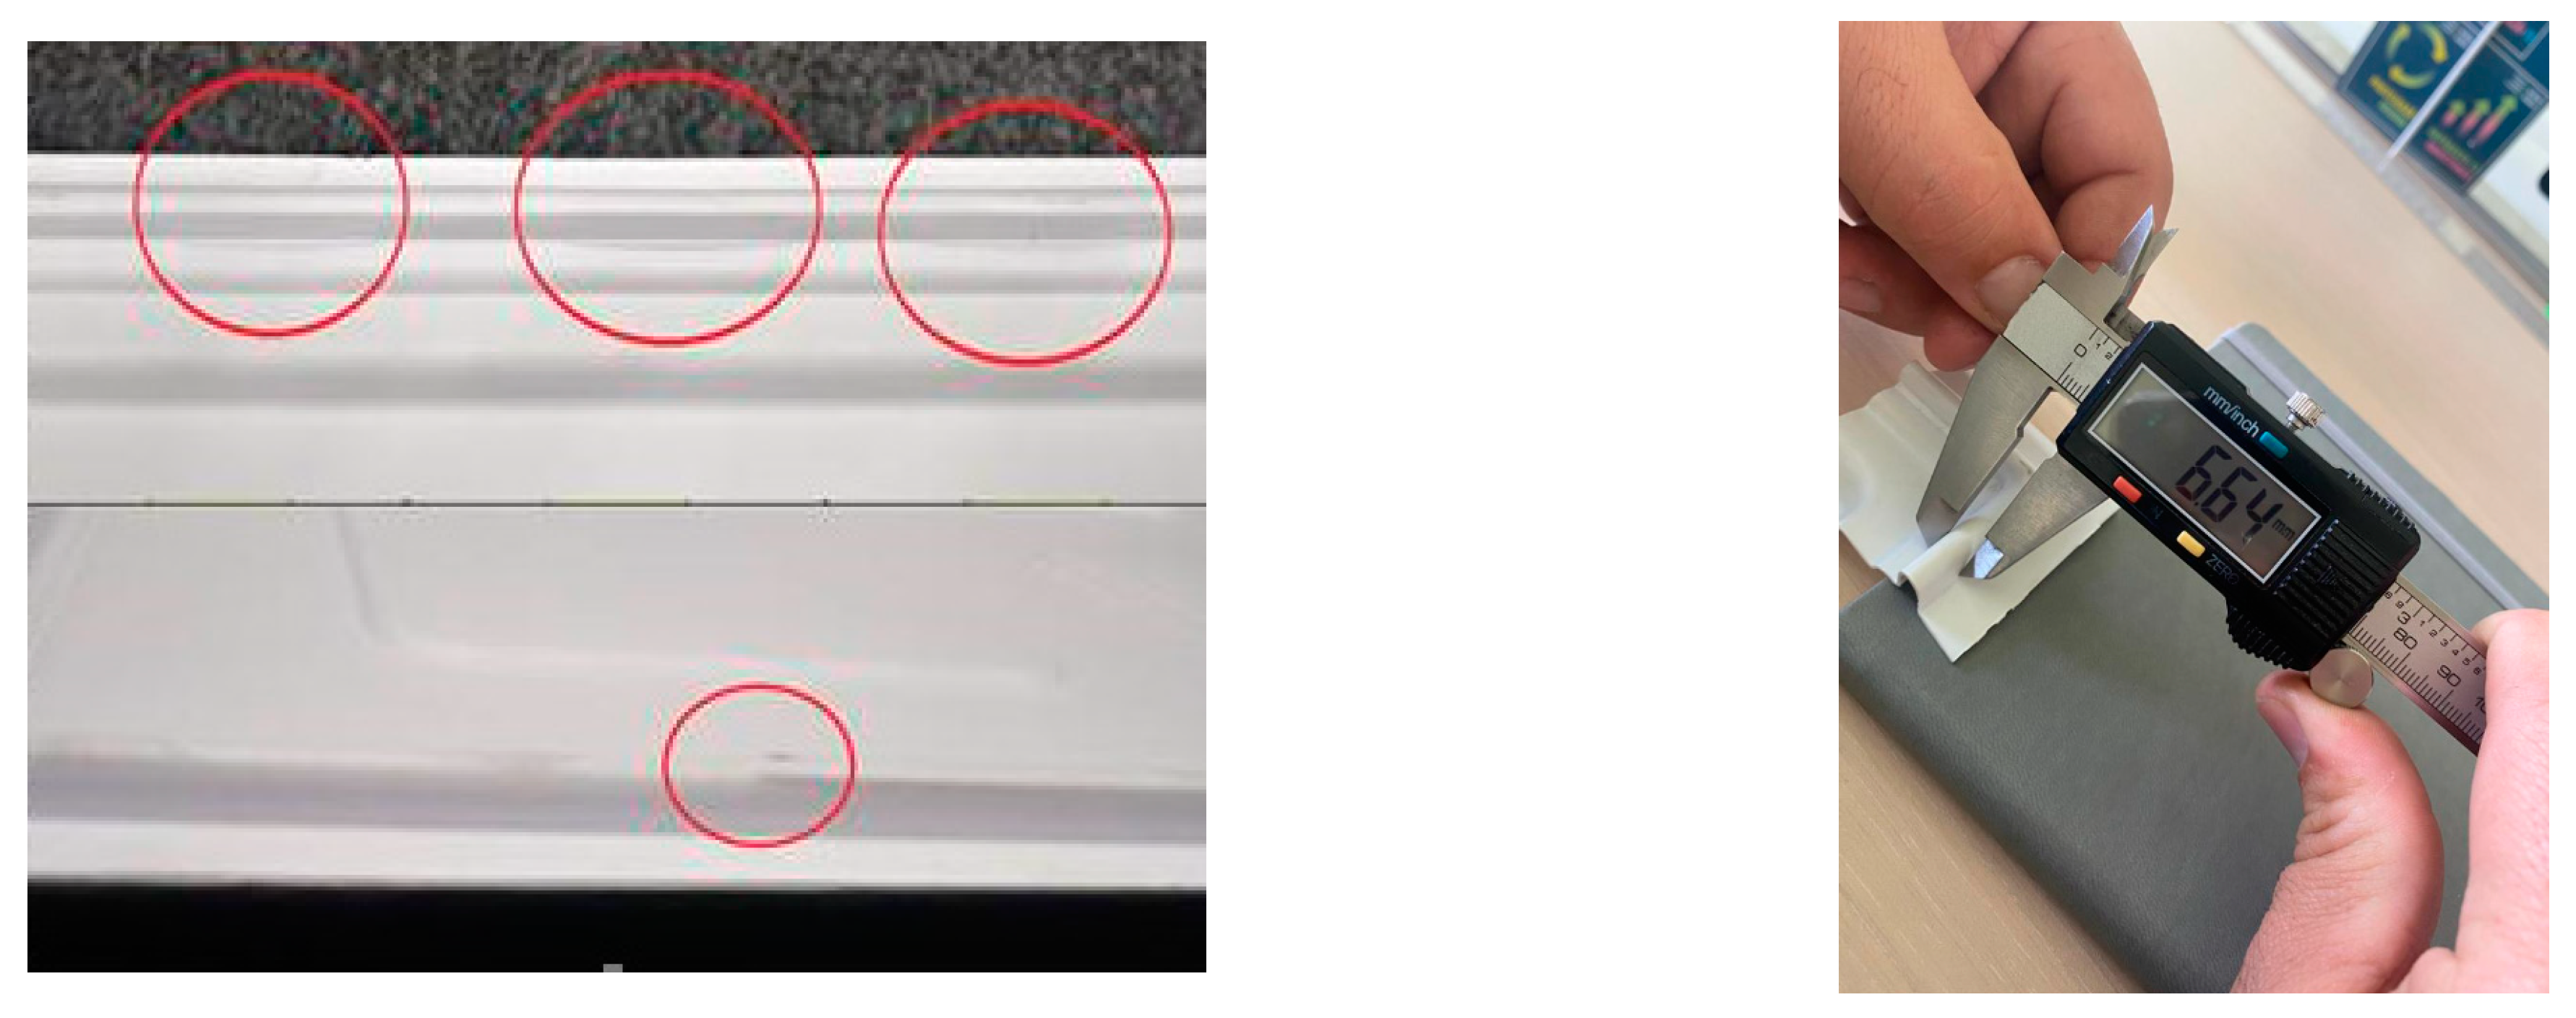
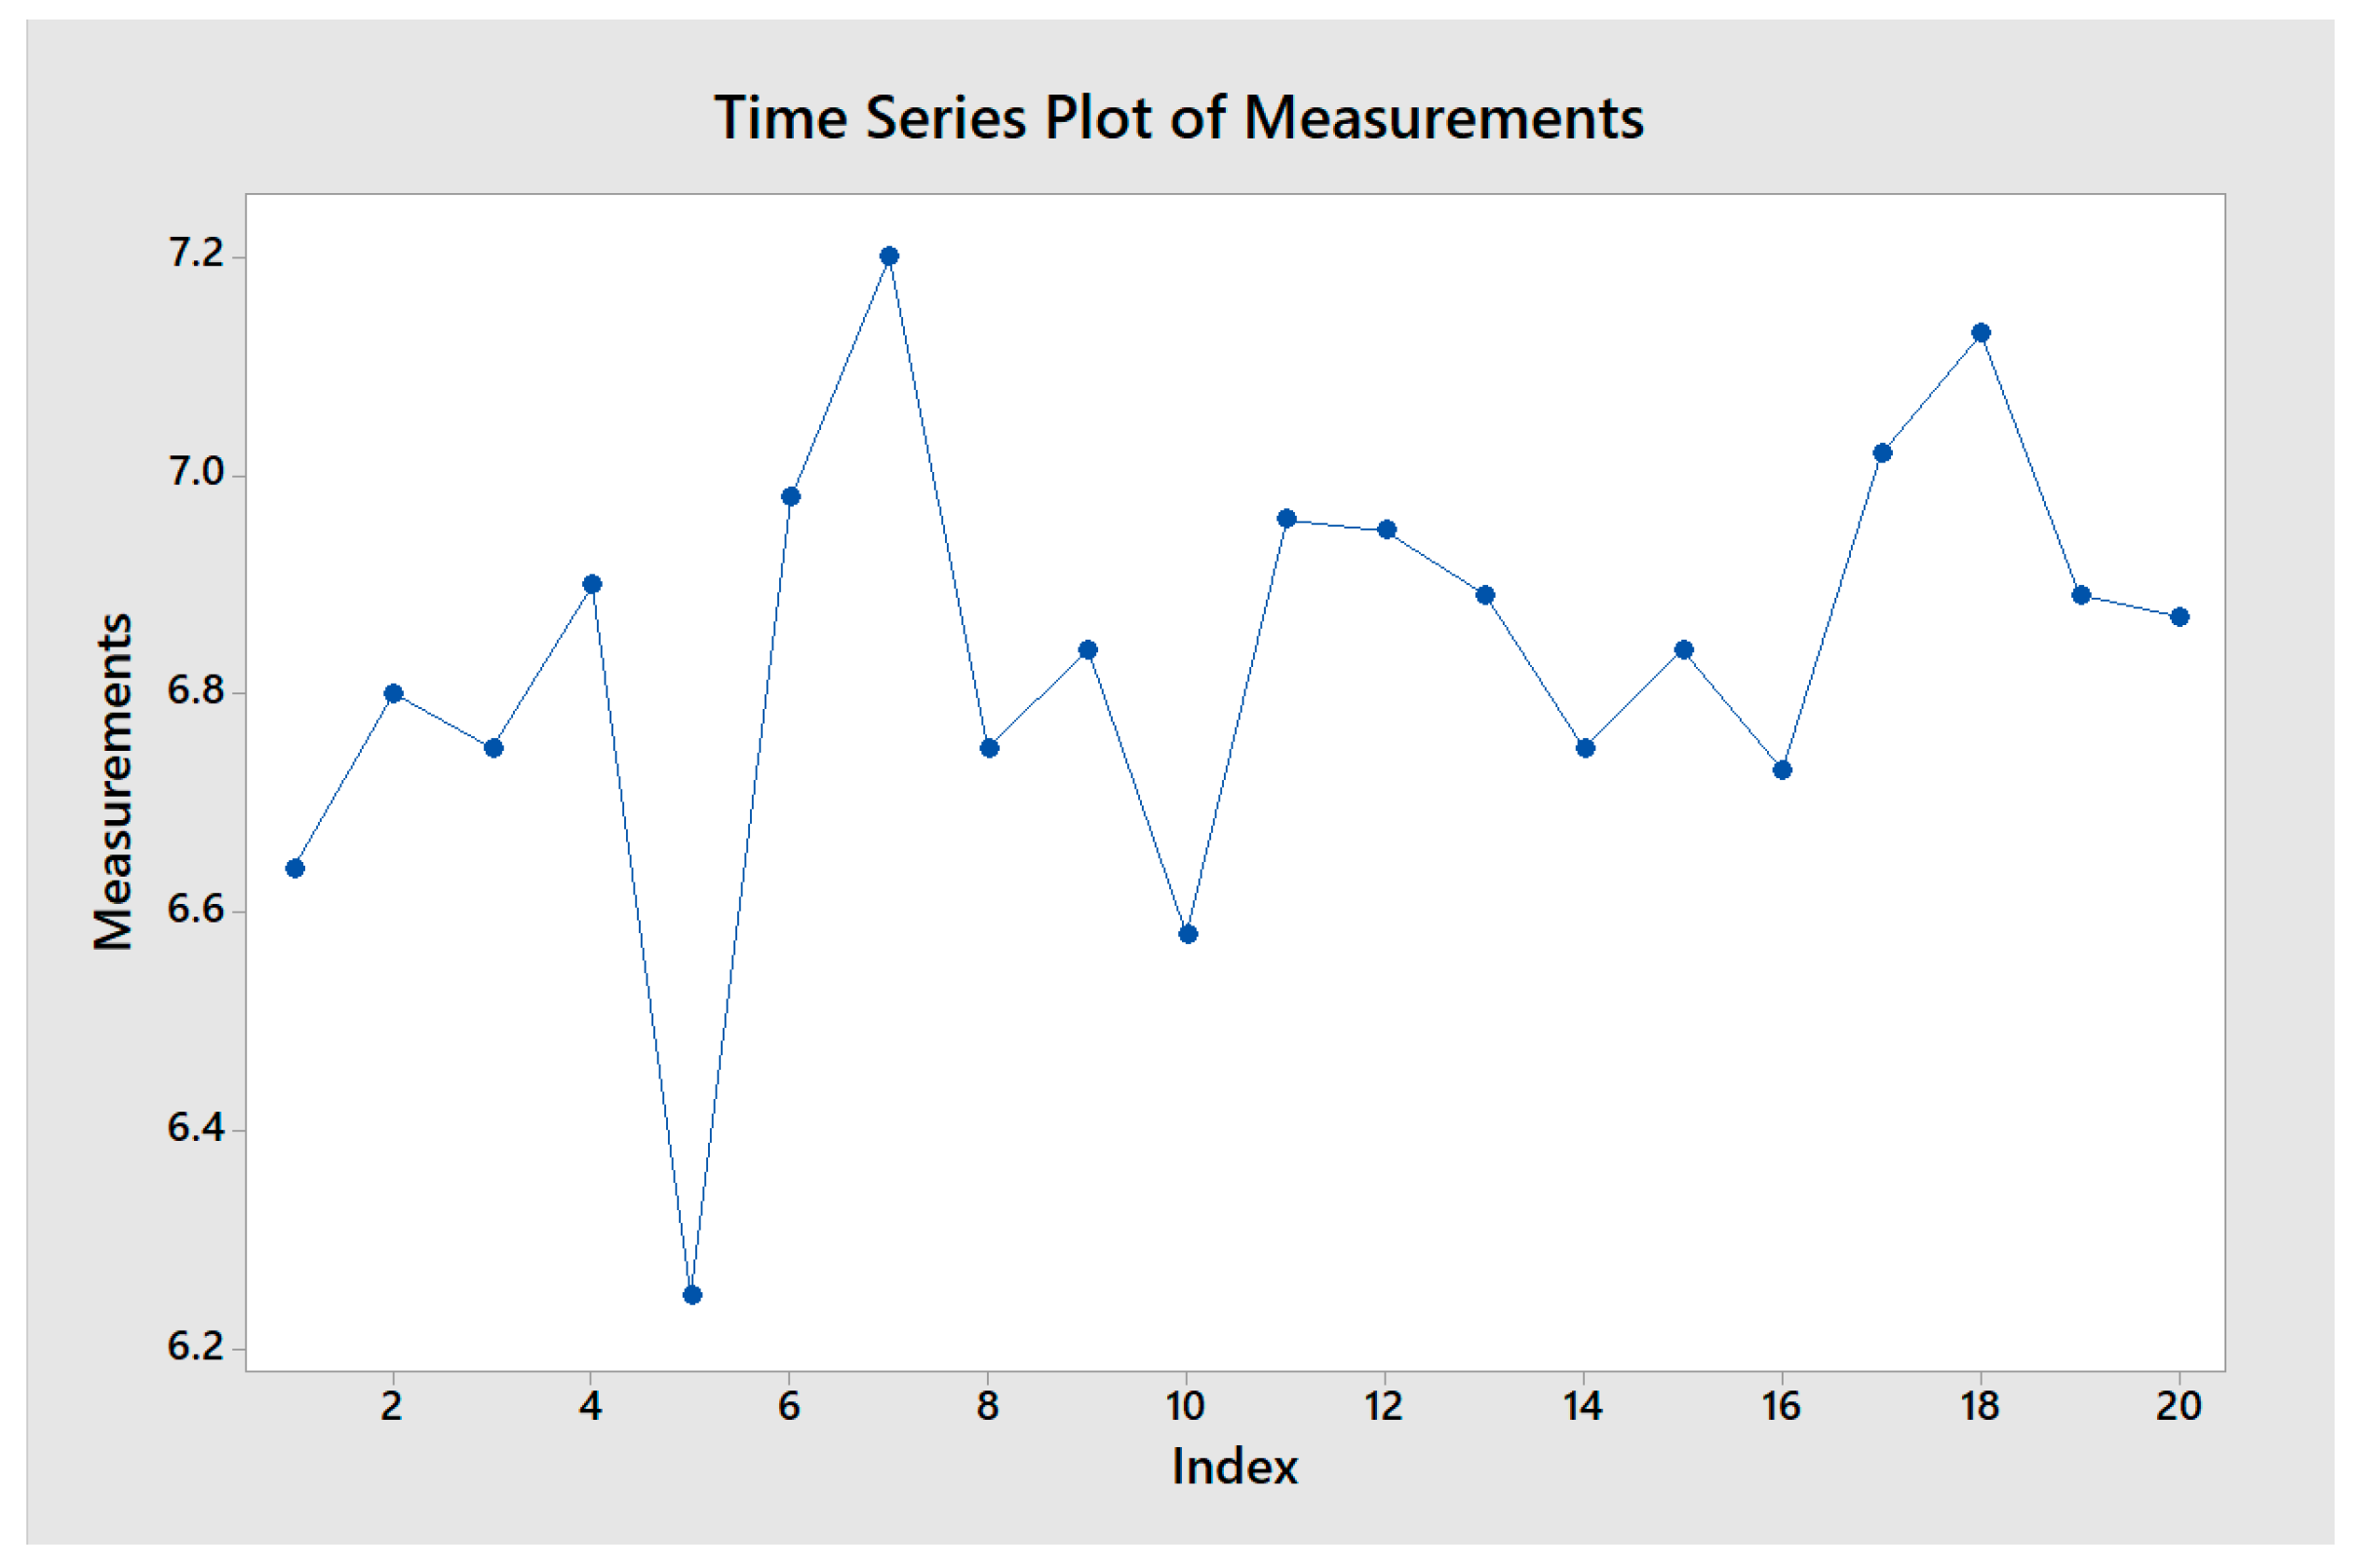
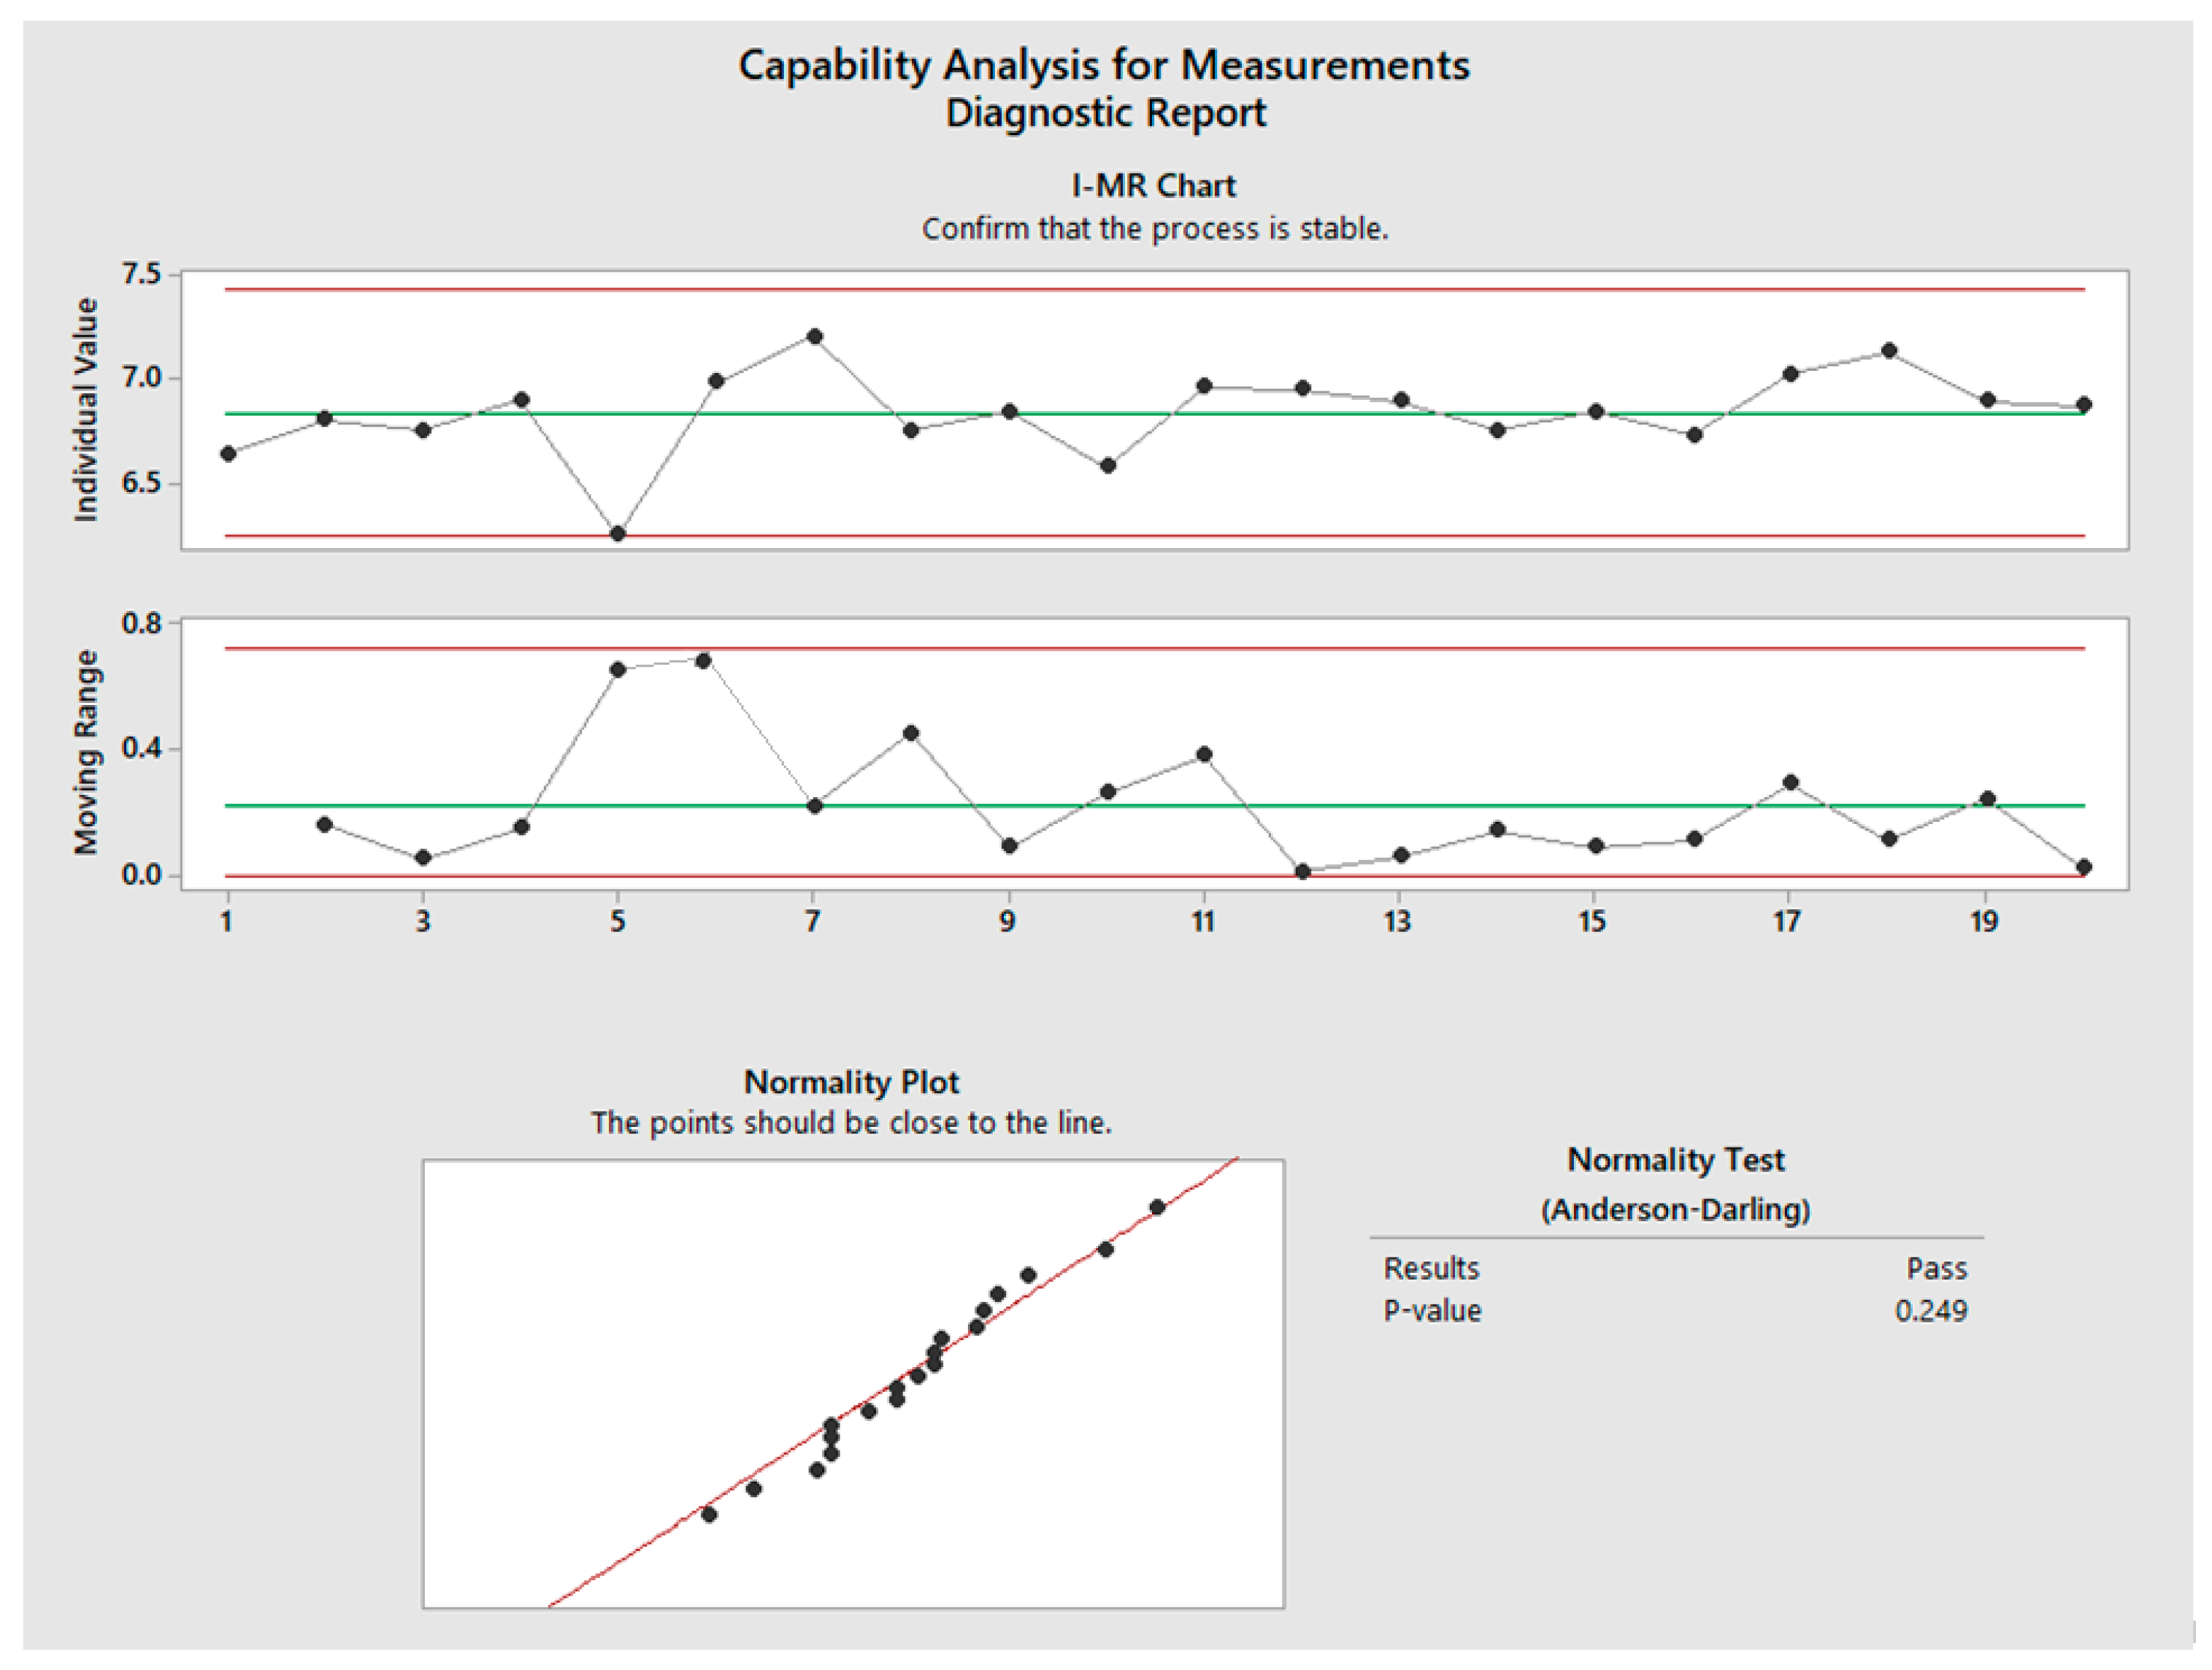
4.2. Measurement Phase
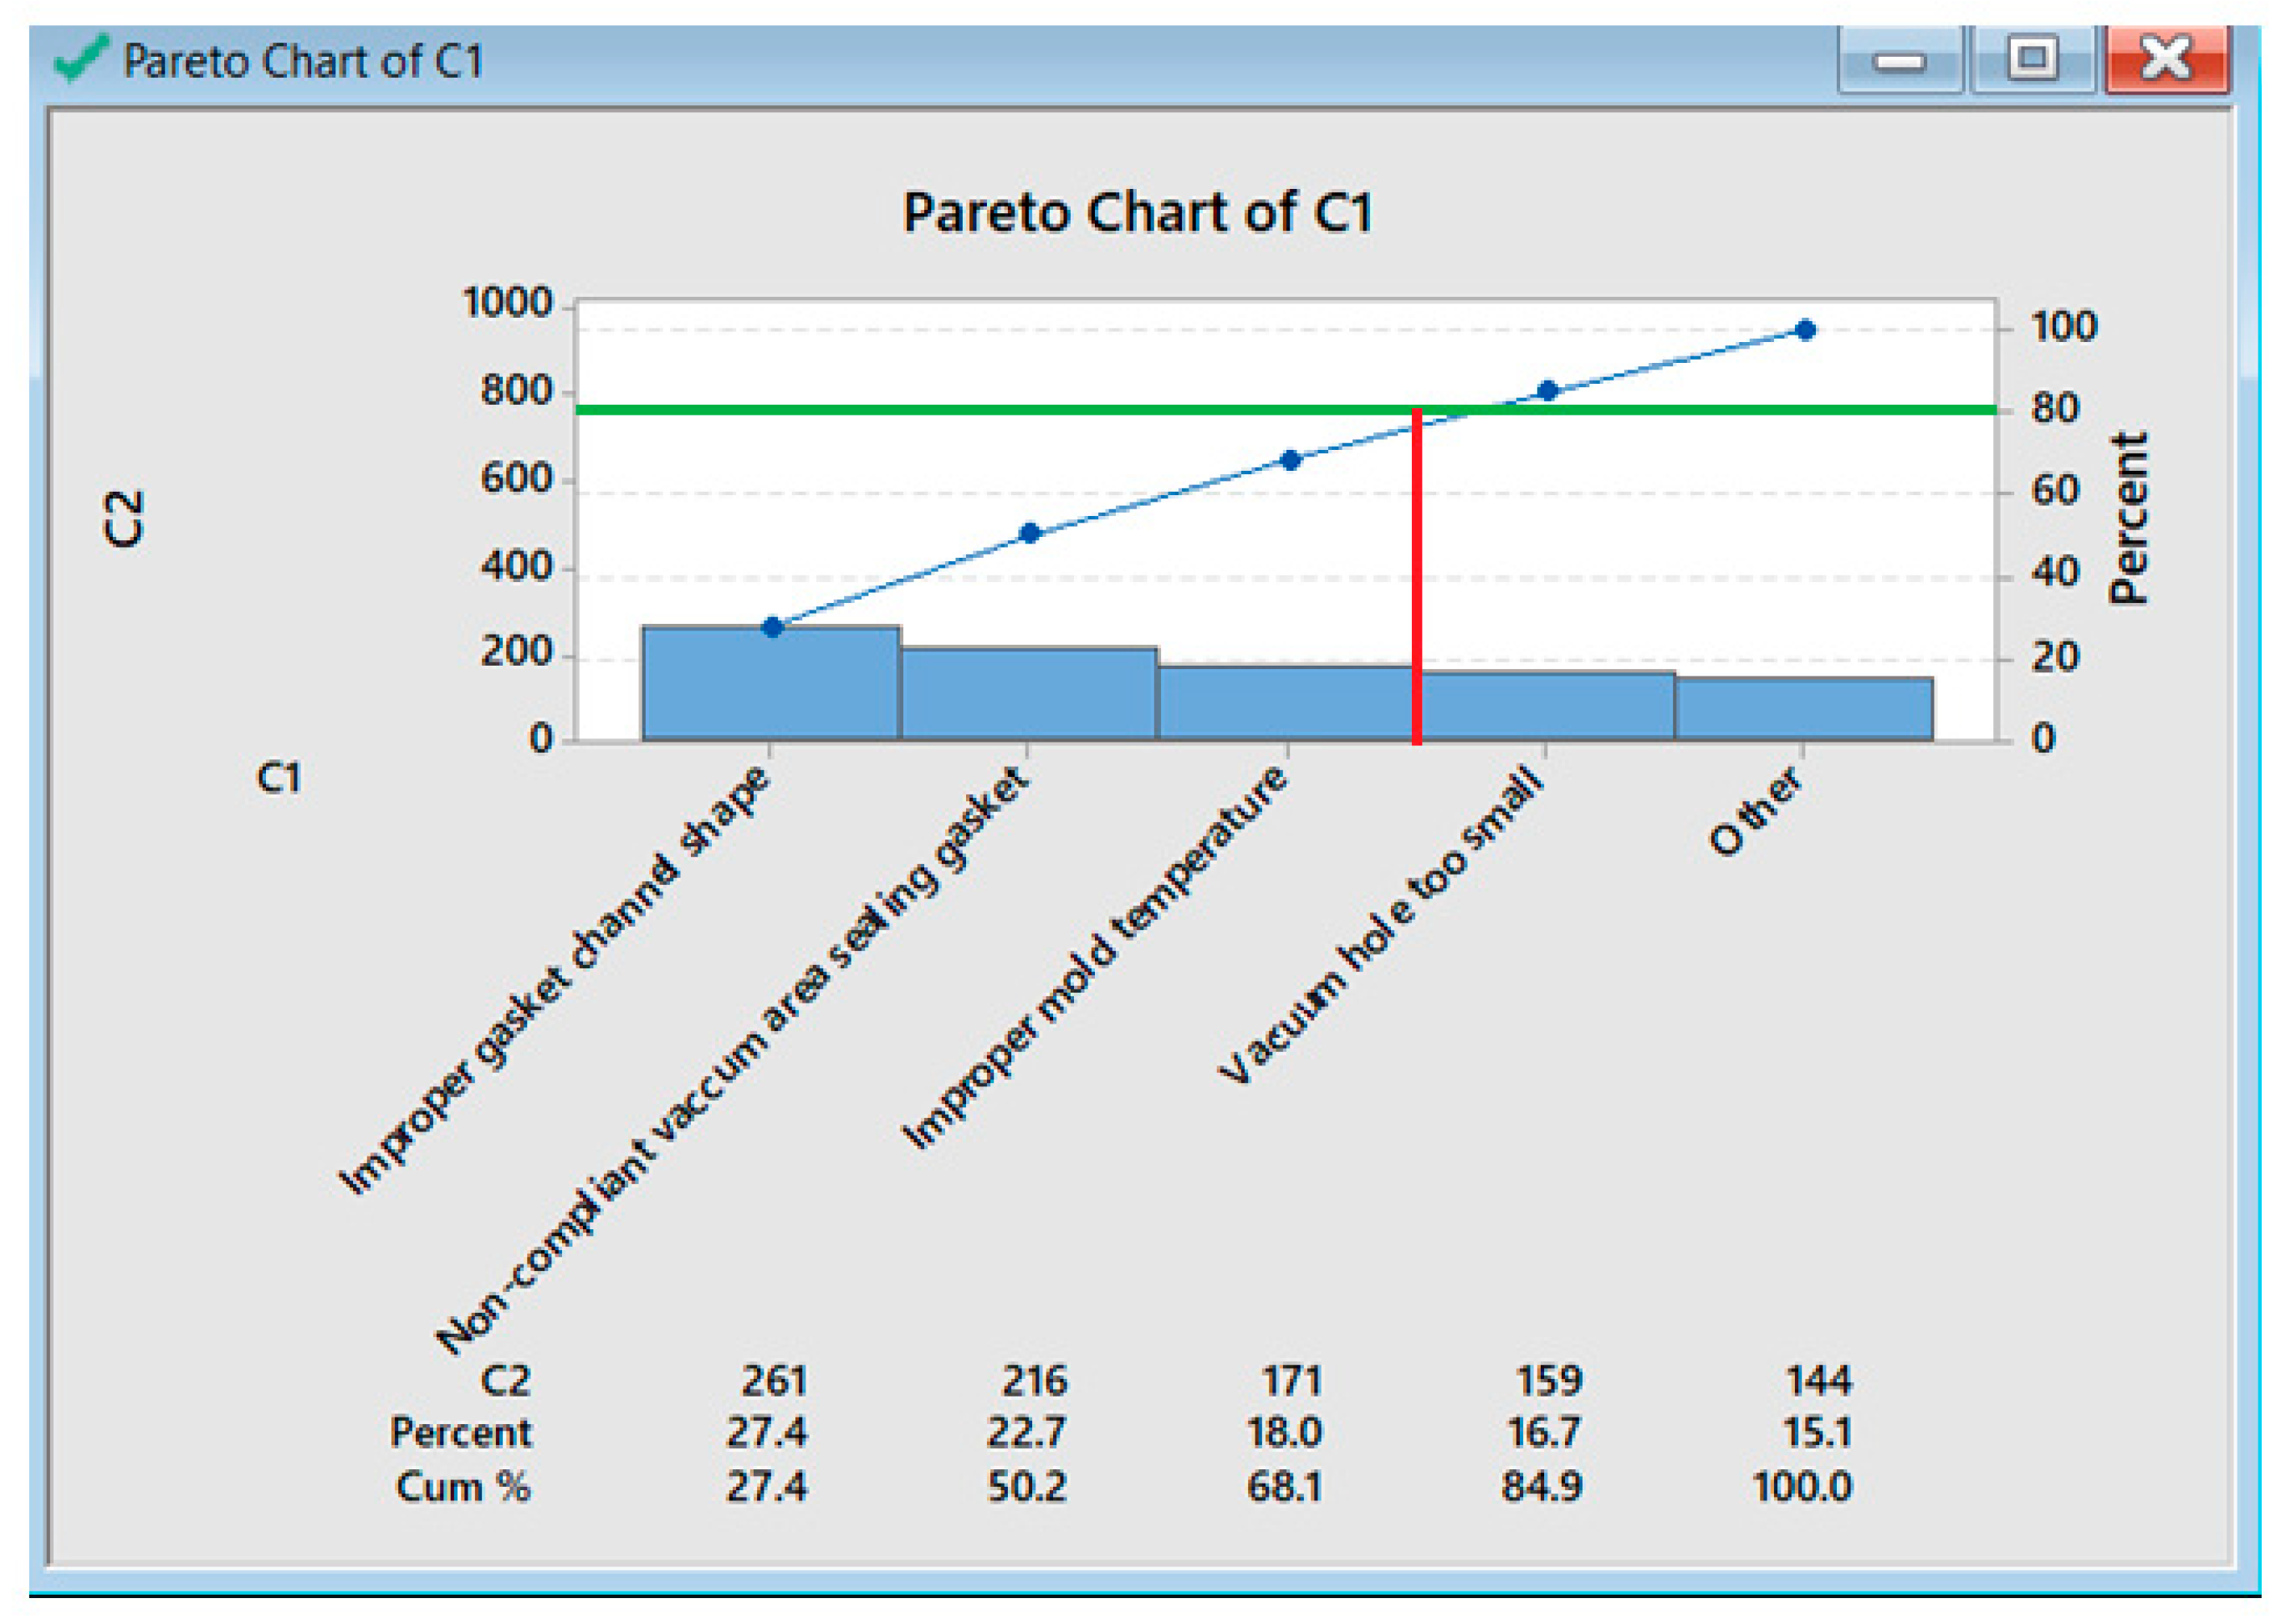
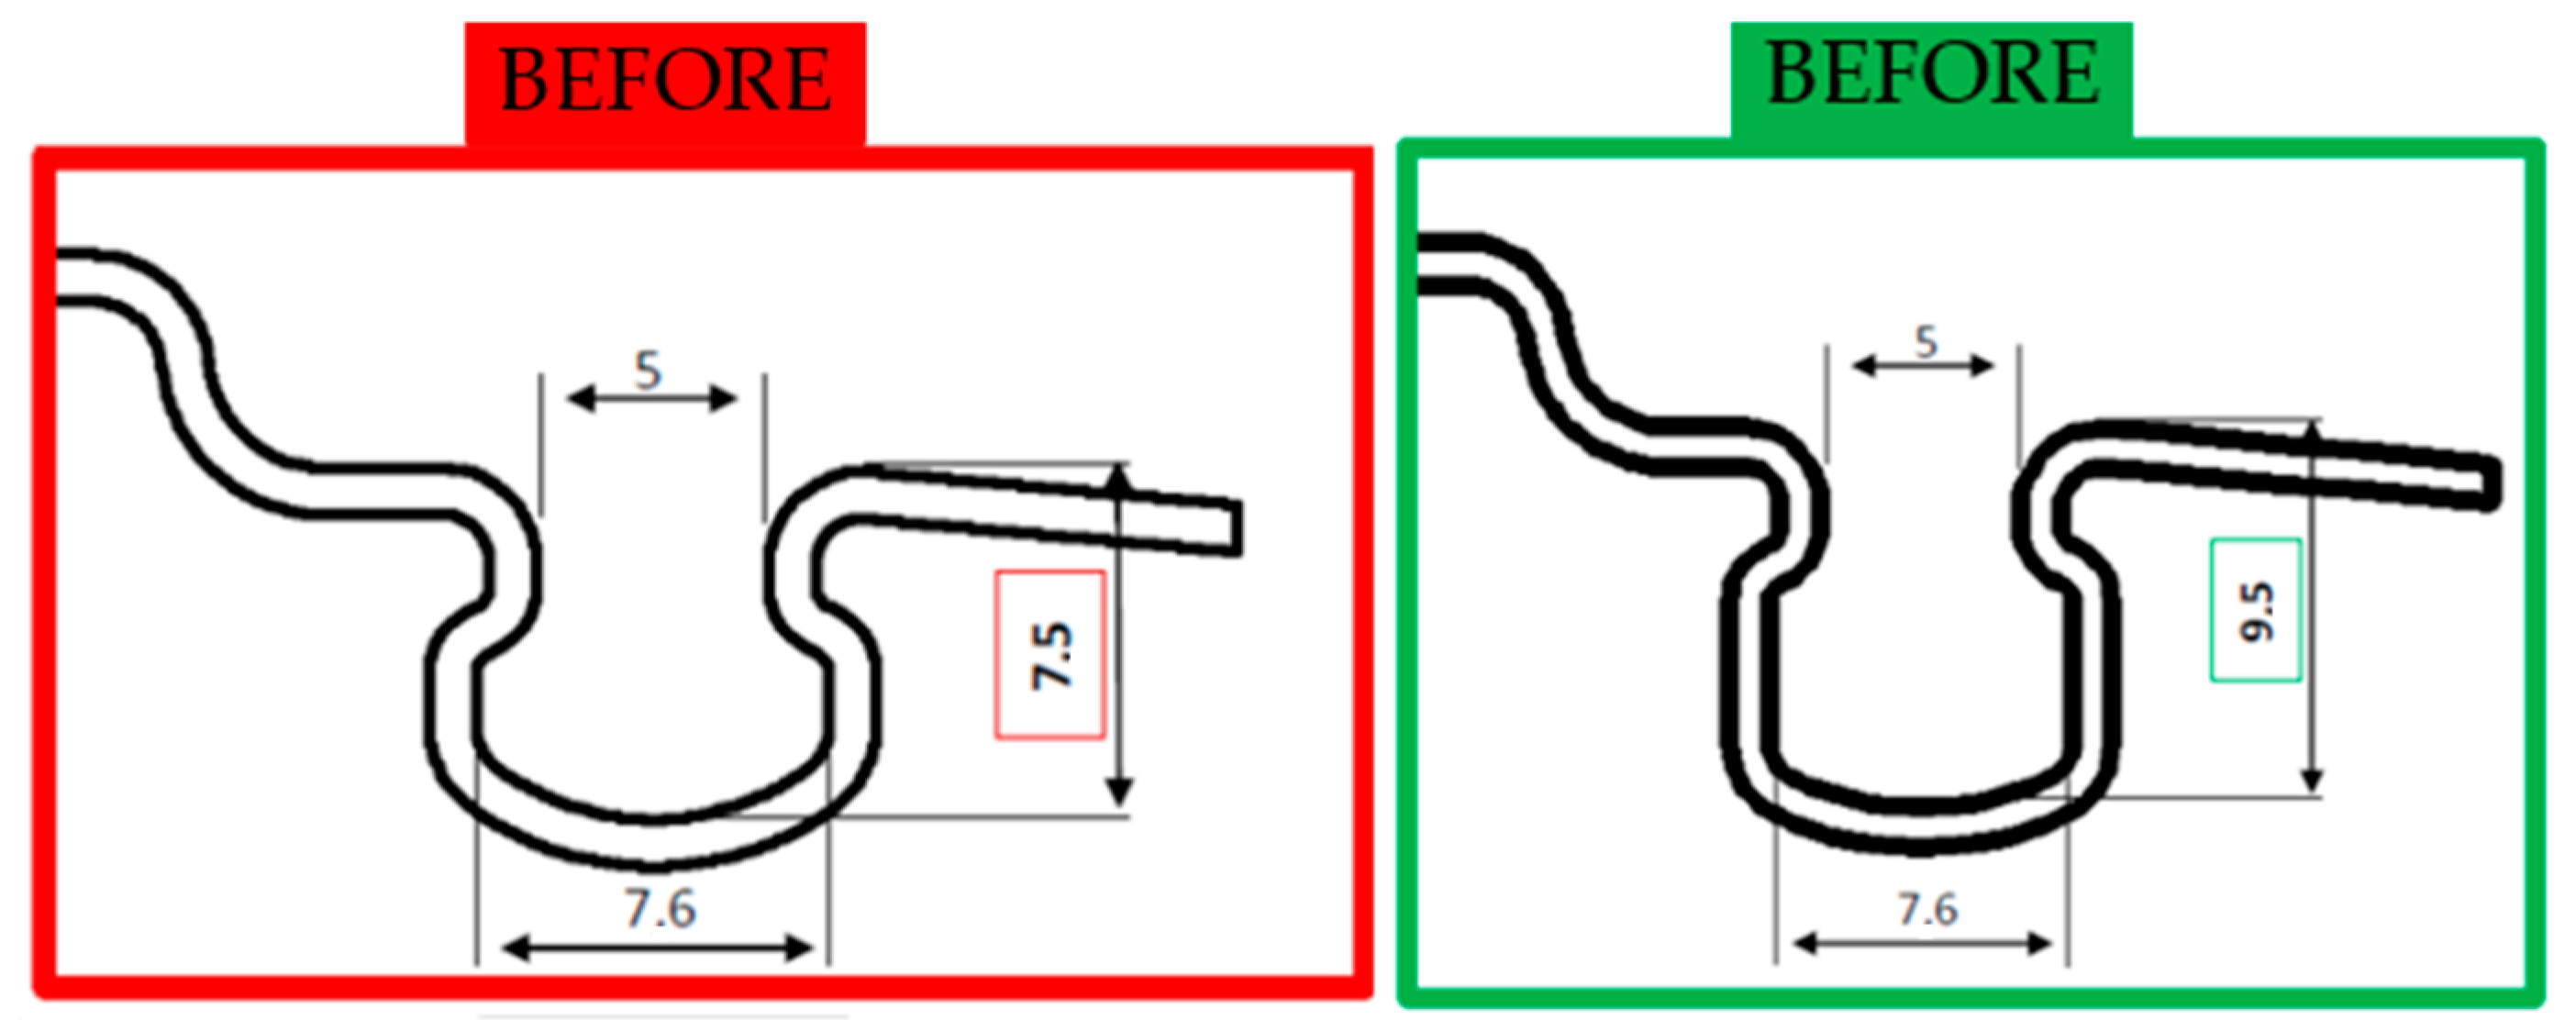
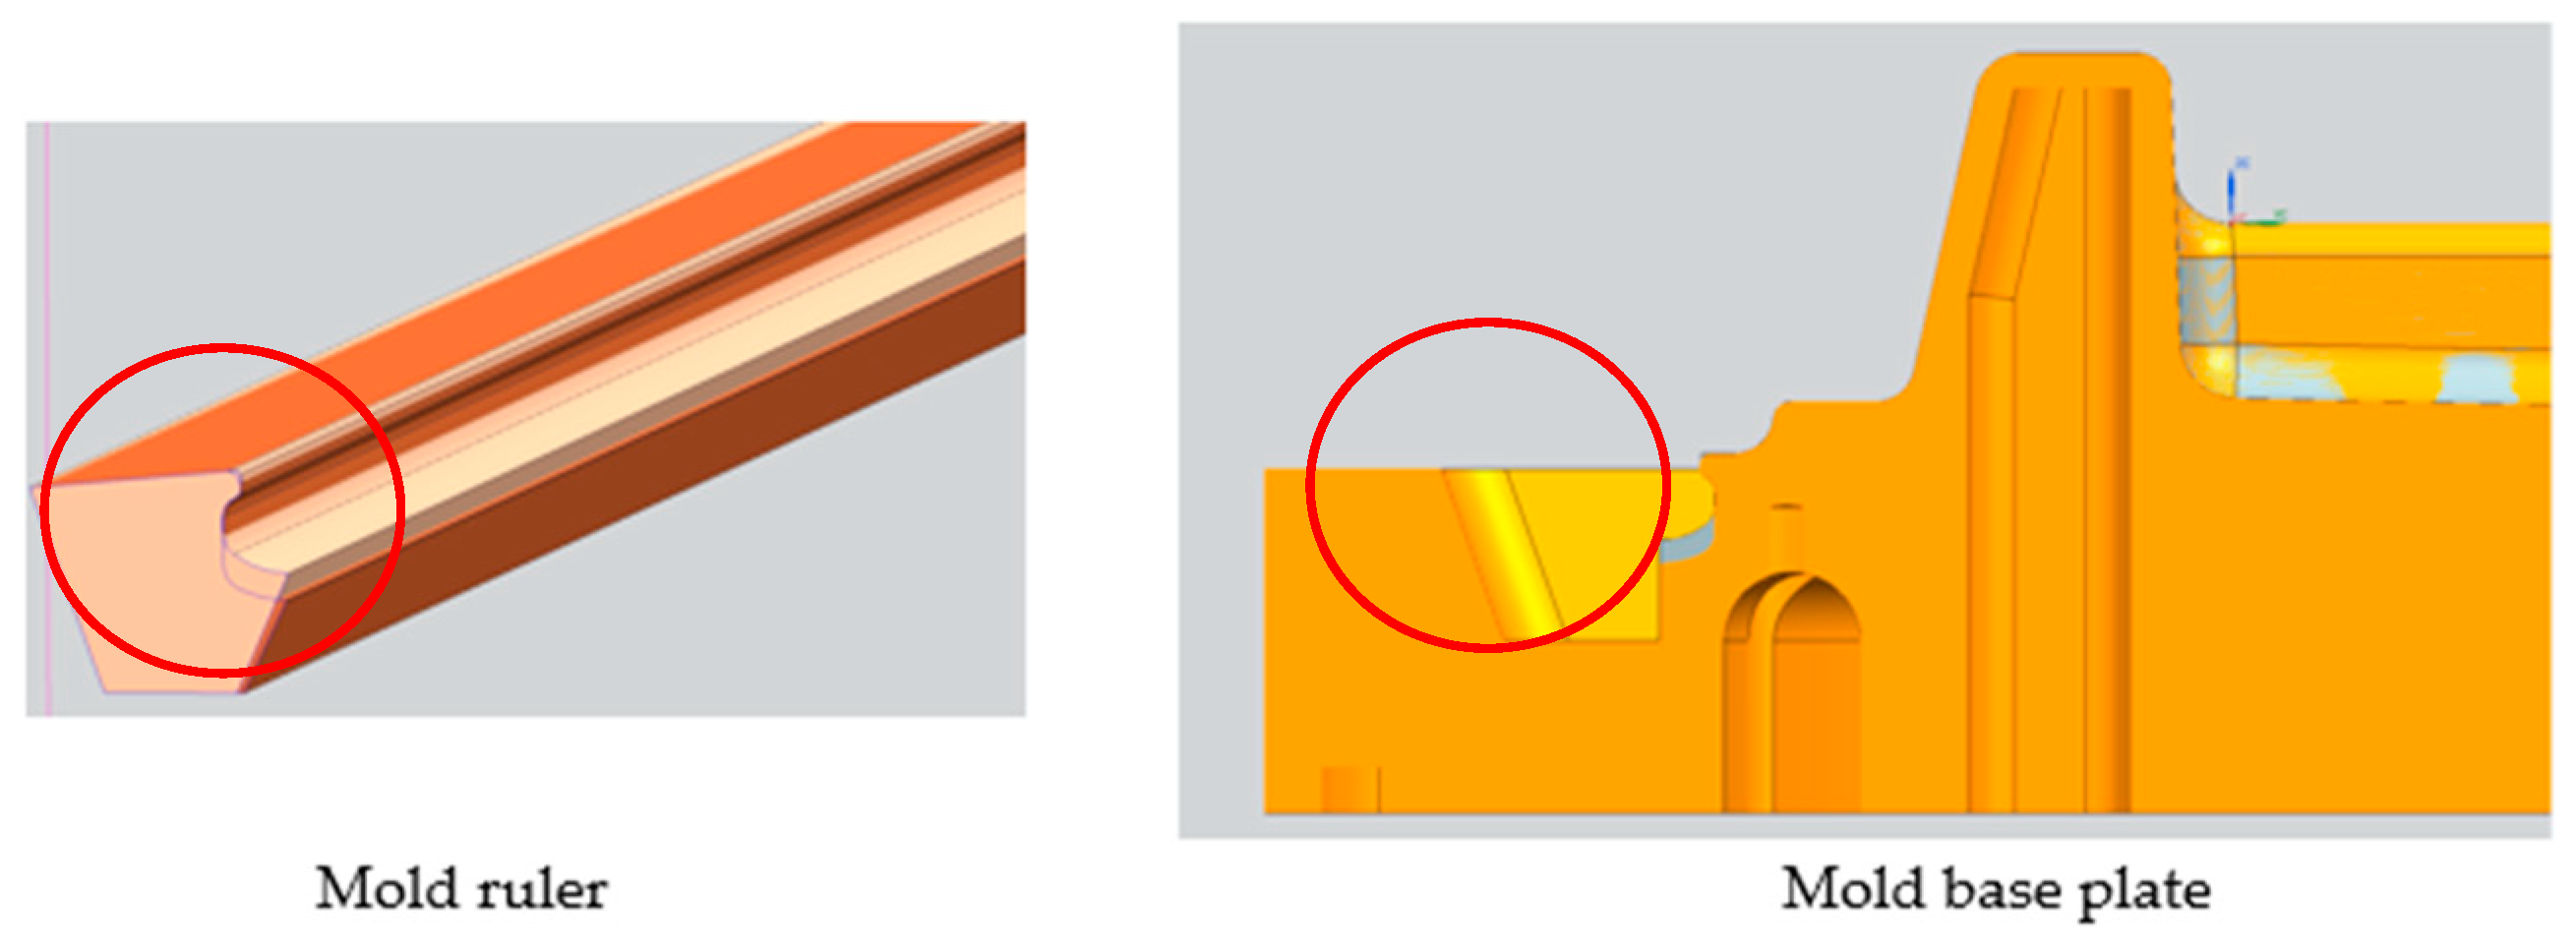
In this phase, the key factors that have a significant impact on the thermoforming process are determined, methods for measuring these factors are established, and data are collected to identify sources of process variation.
Making a map of the steps that the door goes through from the thermoforming process to the assembly line is necessary to identify the sources of scrap, as illustrated in Figure 4.
A cause–effect diagram, also known as the Ishikawa diagram, was produced in order to identify all the sources that can lead to rejects caused by a non-conforming door seal.
Based on the indicators in the Ishikawa diagram, a prioritization matrix (Table 5) was drawn up to see which aspects the team should focus on in order to eliminate rejects. The prioritization matrix is a table in which, for the most important quality indicators identified in the Ishikawa diagram, a score is given for each objective specified at the top of the table.
The cumulative percentage represents a method of expressing the sum of percentages corresponding to each category, aggregated in descending order of their contribution. In a Pareto chart, this cumulative percentage is illustrated by an ascending line, which shows how the contribution of each bar (representing a cause) progressively accumulates to reach a total effect of 100% [39].
The total values obtained from the priority matrix, in which scores were assigned to the most probable causes contributing to the occurrence of defects, were used to create the Pareto chart (Figure 5). An 80% cut-off line is also included to indicate where the 80/20 rule applies, meaning that the critical factors that require the most attention are found below this line. The bars to the left of the green line represent the “vital few” causes, which should be prioritized over those on the right side of the green line, which are less frequent.
From Figure 6, it is evident that improper gasket channel shape contributes 27.4%, a non-compliant vacuum area sealing gasket contributes 22.7%, and improper mold temperature contributes 18.7% to the total effect of 100%, with these being the main causes leading to the occurrence of defects.
The first measurements are to check whether or not the door gasket is easily detached, as illustrated in Figure 7. The method for the testing and analytical evaluation of the detachment of the gasket from the latch is based on the results obtained by pulling the gasket from 15 different points using the dynamometer. The pull should be vertical to the axis of the gasket. A pulling force is applied until the seal is dislocated. The value after seal removal is read on the dynamometer display.
If the value read on the display is above 50 N, then the tensile test is validated as good, and if it is below 50 N, then the tensile test is marked as not good, as also seen in Figure 7.
In order to see if the measurements were correct, a Gage R&R analysis was performed, in which verified measurements were entered at all 14 points twice with 2 operators. Table 6 presents the values measured by the two operators.
The results obtained from the one-way ANOVA analysis indicate that there is no significant difference between the two groups, OP1 and OP2. Given the results of this one-way ANOVA, we can confidently conclude that there is no statistically significant difference in the measurements between the two groups, OP1 and OP2. This finding suggests that the factors being analyzed do not produce varying effects across the groups studied, which may warrant further investigation into the experimental design or the underlying assumptions about the data. It may also be beneficial to consider additional variables or a larger sample size to explore potential subtle differences that may not be detectable in the current analysis.
Figure 8 presents a detailed analysis of the repeatability and reproducibility of the measurements, highlighting that the measurement process produces consistent and accurate results across different operators. This evaluation confirms that both operators perform the measurements reliably, with minimal variation in results.
In the evaluation of the seal channel profile, a set of 20 measurements was collected at various points along the channel to assess dimensional variations. This analysis is crucial in ensuring that the dimensions meet specified criteria and identifying any potential issues in the manufacturing process. The measurements ranged from a minimum of 6.25 mm to a maximum of 7.02 mm, indicating a range of variation that merits further examination. The recorded dimensions varied between 6.25 mm and 7.02 mm. This range indicates a potential variability in the shape of the seal channel, which can influence its performance in applications where precision is critical. Figure 9 illustrates the seal channel’s profile and measurement points, while Figure 10 visually represents the distribution of the measured dimensions.
To analyze whether the recorded values were normally distributed, an appropriate statistical test was employed. This is essential for validating the application of various statistical analyses that assume normality. The analysis (Figure 11) yielded a p-value of 0.249. This value is significantly higher than the typical alpha level of 0.05, indicating that there is insufficient evidence to reject the null hypothesis of normality. The p-value (0.249) is greater than 0.05, which suggests that the distribution of recorded values does not significantly deviate from a normal distribution. This is a positive outcome, as it reinforces the reliability of using parametric statistical methods for the further analysis of the data.
The analysis of the seal channel profile measurements indicates a variation in dimensions ranging from 6.25 mm to 7.02 mm. The subsequent normality test shows a p-value of 0.249, confirming that the recorded values are normally distributed between the specified limits.

4.3. Analysis Phase

The analysis phase is essential in the DMAIC, as the data collected during the measurement phase are used to identify the main causes of the formation of door rejects.
Making a detailed chart (Figure 12 and Figure 13) of the door making process is essential in order to understand the steps in the process and to identify the factors that generate rejects.
After a detailed analysis of the door production process, the following ideas emerged:
-
The modification of the channel shape;
-
Increasing the vacuum holes;
-
The improvement of the sealing of the empty area;
-
Correcting the temperature for the thermoforming mold.

4.4. Improvement Phase

On the basis of the proposed solutions and the measurements carried out, it was concluded that it was necessary to modify the seal groove. This modification involves increasing the size indicated in Figure 14 from 7.5 mm to 9.5 mm. This adjustment contributes to a more effective retention of the gasket in the new channel.
This modification involves changing the door thermoforming mold adapted to the new dimensions, as seen in Figure 15.
Regarding the increase in the vacuum orifices, it was proposed that we increase the diameter from 0.8 mm to 1.2 mm for the better formation of the gasket channel, as seen in Figure 16.
Improved sealing of the hollow area was accomplished by milling that was carried out on the mode plate, where a special sponge gasket was inserted, as illustrated in Figure 17.
The correct measurement of the temperature of the mold is carried out by checking by the operator using a pyrometer (Figure 18).

4.5. Control Phase

After the implementation of the solutions presented in the improvement phase over four months, the rejects were monitored. Table 7 shows the data obtained from monitoring after the implementation of the presented solutions.
The values obtained are entered into Minitab and compared with those recorded before applying the improvements, as seen in Figure 19. From this comparison, p < 0.05, indicates that the proposed improvements had a positive effect on the thermoforming process.
To ensure rigorous quality control for the gasket, a checking device was designed and manufactured, as seen in Figure 20.
This device was designed with the purpose of checking the continuity of the gasket channel, so that operators can ensure that there are no interruptions or defects that could compromise the proper sealing of the refrigeration appliance. By using this device, it can be guaranteed that each door meets the required quality standards before it is fitted.
The door thermoforming process will be optimized if operators follow certain instructions. The operators who work in this station will be trained to perform the operations correctly. The operator must ensure that the mold is coupled (turned on) and set the mold heating–cooling temperature. The operator is required to check, using a pyrometer, that the temperature of the door thermoforming mold is between 50 °C and 60 °C.
Compliance with gasket shape standards and the required thermoforming temperatures is a condition that operators must respect in order to have a product that meets customer requirements.
Considering that the price of a refrigerator door is EUR 75, it can be calculated that the 1951 defective doors (as shown in Table 4) recorded over the 5-month monitoring period resulted in a significant financial loss of EUR 146,325. Eliminating these scraps is crucial for the company, especially given that the number of orders for refrigerators has doubled. This increase in order volume underscores the need to employ the Six Sigma methodology to ensure both the maintenance of profitability and the ability to meet the increased demand by reducing waste.
The adapted Six Sigma methodology presented in this work has not only helped address and eliminate scraps, thereby reducing financial losses, but has also contributed to improving overall production efficiency, thus supporting a company’s capacity to handle a higher volume of orders effectively.

5. Conclusions

In the present work, the implementation of the Six Sigma Strategy was employed to achieve the goal of eliminating refrigeration appliance door scrap. Initially, the average waste rate recorded over the five months of process monitoring was 6.77% of the total products manufactured, resulting in significant losses for the company. Due to the implementation of the methodology, several steps were taken to reduce scrap. The gasket design was improved. A rigorous control device was designed to check gasket quality. The personnel were trained to check certain manufacturing parameters of the gasket and make sure that they adhered to standards. The implementation of these pre-determined solutions had a positive impact on the sealing of refrigeration appliance gaskets, as evidenced by the monitoring conducted after the improvement stage, during the control phase. No more scraps were detected. Furthermore, in improving the process, the implementation of the Six Sigma methodology significantly impacted the company’s production capacity. This enabled the company to increase the number of refrigerators produced, thus meeting the growing customer demands and ensuring market satisfaction.

Author Contributions

Conceptualization, I.-C.E. and O.R.C.; methodology, I.-C.E. and F.-F.R.; software, F.-F.R.; validation, I.-C.E., O.R.C. and F.-F.R.; investigation, F.-F.R.; resources, I.-C.E.; data curation, O.R.C. writing—original draft preparation, I.-C.E.; writing—review and editing, I.-C.E.; visualization, F.-F.R.; supervision, O.R.C.; funding acquisition, I.-C.E. All authors have read and agreed to the published version of the manuscript.

Funding

This work was supported by a grant from the National Program for Research of the National Association of Technical Universities—GNAC ARUT 2023.

Data Availability Statement

The original contributions presented in the study are included in the article, further inquiries can be directed to the corresponding author.

Conflicts of Interest

The authors declare no conflicts of interest.

References

  1. Na, S.; Song, S.; Lee, S.; Lee, J.; Kim, H.; Lee, S.; Choi, G.; Ahn, S. Evaporator Optimization of Refrigerator Systems Using Quality Analysis. Energies 2021, 14, 555. [Google Scholar] [CrossRef]
  2. Razavi-Far, R.; Palade, V.; Sun, J. Optimizing the Performance of a Refrigeration System Using an Invasive Weed Optimization Algorithm. Smart Innov. Syst. Technol. 2013, 23, 79–93. [Google Scholar] [CrossRef]
  3. Ryan, S.; Vincent, K.; Scott, B.; Joel, U. Dynamic acoustic optimization of pulse tube refrigerators for rapid cooldown. Nat. Commun. 2024, 15, 3386. [Google Scholar] [CrossRef]
  4. Clito, A.; Manuel, C. Air infiltration in domestic refrigerators: The influence of the magnetic seals conservation. Int. J. Refrig. 2010, 33, 856–867, ISSN 0140-7007. [Google Scholar] [CrossRef]
  5. Guoqiang, L.; Gang, Y.; Jianlin, Y. A review of refrigerator gasket: Development trend, heat and mass transfer characteristics, structure and material optimization. Renew. Sustain. Energy Rev. 2021, 144, 110975, ISSN 1364-0321. [Google Scholar] [CrossRef]
  6. Bansal, P.; Vineyard, E.; Abdelaziz, O. Advances in household appliances—A review. Appl. Therm. Eng. 2011, 31, 3748–3760. [Google Scholar] [CrossRef]
  7. Yılmaz, D.; Gülmez, M. Design and development of a refrigerator gasket to prevent condensation. Heat Transf. Res. 2020, 51, 1061–1072. [Google Scholar] [CrossRef]
  8. Gaskets for Commercial Refrigeration, Snap-in, Middle-Edge, Bundles and Tailor-Made Gaskets. Available online: https://www.gev-online.com/Media/Default/Kataloge_als_PDF/Refrigeration%202021/Refrigeration%202022/REPA-Refrigeration-Gaskets-CatalogueFINAL.pdf (accessed on 3 July 2024).
  9. High-Tech Profiles Domestic Appliances, Commercial Cooling and Digital Signage. Available online: https://www.rehau.com/downloads/669142/systems-for-life-commercial-cooling-brochure.pdf (accessed on 3 July 2024).
  10. Ankesh, M.; Gupta, P.; Vimal, K.; Owad, A.A.; Singh, S. The performance improvement analysis using Six Sigma DMAIC methodology: A case study on Indian manufacturing company. Heliyon 2023, 9, e14625, ISSN 2405-8440. [Google Scholar] [CrossRef]
  11. Dewi, S.; Widodo, R.; Lukman, M. Reducing defective products using six sigma for production process improvement. AIP Conf. Proc. 2022, 2453, 020045. [Google Scholar] [CrossRef]
  12. Mousli, H.M.; El Sayed, I.; Zaki, A.; Abdelmonem, S. Improving VTE prophylaxis in ward and ICU surgical urology patients: A Six-Sigma DMAIC methodology improvement project. TQM J. 2023, 36, 634–663. [Google Scholar] [CrossRef]
  13. Kumar, C.C.; Naidu, N.V.R.; Ravindranath, K. Performance improvement of manufacturing industry by reducing the defectives using Six Sigma methodologies. IOSR J. Eng. 2011, 1, 1–9. [Google Scholar] [CrossRef]
  14. George, M.L.; Maxey, J.; Rowlands, D.; Price, M. The Lean Six Sigma Pocket Toolbook: A Quick Reference Guide to 100 Tools for Improving Quality and Speed, 1st ed.; McGraw-Hill: New York, NY, USA, 2004. [Google Scholar]
  15. Wang, F.K.; Hsu, C.H.; Tzeng, G.H. Applying a hybrid MCDM model for six sigma project selection. Math. Probl Eng. 2014, 1–13. [Google Scholar] [CrossRef]
  16. Rahman, A.; Shaju, S.; Sarkar, S.; Hashem, M.; Hasan, S.M.K.; Islam, U. Application of Six Sigma using Define Measure Analyze Improve Control (DMAIC) methodology in Garment Sector. Indep. J. Manag. Prod. 2018, 9, 810. [Google Scholar] [CrossRef]
  17. Sallam, M.; Snygg, J. Improving Antimicrobial Stewardship Program Using the Lean Six Sigma Methodology: A Descriptive Study from Mediclinic Welcare Hospital in Dubai, the UAE. Healthcare 2023, 11, 3048. [Google Scholar] [CrossRef]
  18. Tsai, C.-M.; Chiou, K.-C.; Chen, K.-S.; Yu, C.-M. Monitoring, Evaluation, and Improvement Model for Process Precision and Accuracy. Appl. Sci. 2023, 13, 11280. [Google Scholar] [CrossRef]
  19. Trubetskaya, A.; McDermott, O.; Ryan, A. Application of Design for Lean Six Sigma to strategic space management. TQM J. 2023, 35, 42–58. [Google Scholar] [CrossRef]
  20. Rifqi, H.; Ben, S.; Zamma, A.; Badder, O. Lean Six Sigma in agribusiness: A Case Study in a Cookie Production Plant. Int. J. Eng. Trends Technol. 2021, 69, 56–65. [Google Scholar] [CrossRef]
  21. Davidson, J.; Price, O.; Pepper, M. Lean Six Sigma and quality frameworks in higher education—A review of literature. Int. J. Lean Six Sigma, 2020; ahead-of-print. [Google Scholar] [CrossRef]
  22. Gaikwad, L.; Teli, S.; Majali, V.; Bhushi, U. An Application of Six Sigma to Reduce Supplier Quality Cost. J. Inst. Eng. 2015, 97, 93–107. [Google Scholar] [CrossRef]
  23. Singh, J.; Ahuja, I.S.; Singh, H.; Singh, A. Application of Quality 4.0 (Q4.0) and Industrial Internet of Things (IIoT) in Agricultural Manufacturing Industry. AgriEngineering 2023, 5, 537–565. [Google Scholar] [CrossRef]
  24. Tasdemir, C.; Gazo, R. Validation of Sustainability Benchmarking Tool in the Context of Value-Added Wood Products Manufacturing Activities. Sustainability 2019, 11, 2361. [Google Scholar] [CrossRef]
  25. Mareček, K.; Martin, M.; Kučerová, M. Improving Products Quality Applying Six Sigma. Res. Pap. Fac. Mater. Sci. Technol. Slovak Univ. Technol. 2020, 28, 57–64. [Google Scholar] [CrossRef]
  26. Enache, I.C.; Simion, I.; Chiscop, F.; Chiscop, M.A. Injection process improvement using six sigma. UPB Sci. Bull. 2014, 76, 161–170. Available online: https://www.scientificbulletin.upb.ro/rev_docs_arhiva/fullcda_968596.pdf (accessed on 5 July 2024).
  27. Niñerola, A.; Sánchez-Rebull, M.-V.; Hernández-Lara, A.-B. Quality improvement in healthcare: Six Sigma systematic review. Health Policy 2020, 124, 438–445. [Google Scholar] [CrossRef]
  28. Pereira, M.T.; Inês Bento, M.; Ferreira, L.P.; Sá, J.C.; Silva, F.J.G.; Baptista, A. Using Six Sigma to analyze Customer Satisfaction at the product design and development stage. Procedia Manuf. 2019, 38, 1608–1614. [Google Scholar] [CrossRef]
  29. Teeling, S.P.; McGuirk, M.; McNamara, M.; McGroarty, M.; Igoe, A. The Utilization of Lean Six Sigma Methodologies in Enhancing Surgical Pathways and Surgical Rehabilitation. Appl. Sci. 2023, 13, 6920. [Google Scholar] [CrossRef]
  30. Kharub, M.; Ruchitha, B.; Hariharan, S.; Shanmukha Vamsi, N. Profit enhancement for small, medium scale enterprises using lean six sigma. Mater. Today 2022, 56, 2591–2595. [Google Scholar] [CrossRef]
  31. Enache, I.-C.; Chivu, O.R.; Rugescu, A.-M.; Ionita, E.; Radu, I.V. Reducing the Scrap Rate on a Production Process Using Lean Six Sigma Methodology. Processes 2023, 11, 1295. [Google Scholar] [CrossRef]
  32. Six Sigma: A Complete Step-by-Step Guide: A Complete Training & Reference Guide for White Belts, Yellow Belts, Green Belts, and Black Belts; The Council for Six Sigma Certification: Wayne, NJ, USA, 2018; ISBN 1732592659.
  33. Linderman, K.; Schroeder, R.G.; Zaheer, S.; Choo, A.S. Six Sigma: A goal-theoretic perspective. J. Oper. Manag. 2003, 21, 193–203, ISSN 0272-6963. [Google Scholar] [CrossRef]
  34. López Padilla, R.D.; Egúsquiza Rodriguez, M.J.; Molina Vilchez, J.E. Six Sigma for the Improvement of Productivity for Fiber to the Home (FTTH) Installations of an Outsourcing Service Company. Adv. Manuf. IV Manuf. 2024, 14–26. [Google Scholar] [CrossRef]
  35. Daniyan, I.; Adeodu, A.; Mpofu, K.; Maladzhi, R.; Katumba, M.G.K.-K. Application of lean Six Sigma methodology using DMAIC approach for the improvement of bogie assembly process in the railcar industry. Heliyon 2022, 8, e09043, ISSN 2405-8440. [Google Scholar] [CrossRef]
  36. Sari, Y.; Wibisono, E. An empirical study of how the deployment of lean sigma can reduce its enemies: Waste, overburden and defect. Proc. Int. Conf. Inform. Technol. Eng. 2019, 2019, B-14–B-19. [Google Scholar]
  37. Oliveira, D.; Teixeira, L.; Alvelos, H. Integration of Process Modeling and Six Sigma for defect reduction: A case study in a wind blade factory. Procedia Comput. Sci. 2024, 232, 3151–3160, ISSN 1877-0509. [Google Scholar] [CrossRef]
  38. Hidayat, A.A.; Kholil, M.; Haekal, J.; Ayuni, N.A.; Widodo, T. Lean Manufacturing Integration in Reducing the Number of Defects in the Finish Grinding Disk Brake with DMAIC and FMEA Methods in the Automotive Sub Industry Company. Int. J. Sci. Adv. 2021, 2, 713–718. [Google Scholar] [CrossRef]
  39. Widiwati, I.T.B.; Liman, S.D.; Nurprihatin, F. The implementation of Lean Six Sigma approach to minimize waste at a food manufacturing industry. J. Eng. Res. 2024; in press. [Google Scholar] [CrossRef]
  40. Katarzyna Antosz, Małgorzata Jasiulewicz-Kaczmarek, Robert Waszkowski, Jose Machado, Application of Lean Six Sigma for sustainable maintenance: Case study. IFAC-Pap. 2022, 55, 181–186, ISSN 2405-8963. [CrossRef]
  41. Prateek Guleria, Abhilash Pathania, Shubham Sharma, José Carlos Sá, Lean six-sigma implementation in an automobile axle manufacturing industry: A case study. Mater. Today Proc. 2022, 50, 1739–1746, ISSN 2214-7853. [CrossRef]
  42. Hussein, N.A.; Abdelmaguid, T.F.; Tawfik, B.S.; Ahmed, N.G. Mitigating overcrowding in emergency departments using Six Sigma and simulation: A case study in Egypt. Oper. Res. Health Care 2017, 15, 1–12, ISSN 2211-6923. [Google Scholar] [CrossRef]
  43. Xueqing, W.; Xianhui, Y.; Zhen, H.; Zixian, L.; Yuan, G. An intelligent and multi-channel deep feature enhanced framework for predicting difficult-to-measure CTQ. Comput. Ind. Eng. 2022, 169, 108300, ISSN 0360-8352. [Google Scholar] [CrossRef]
Figure 1. Deformations in the channel supporting the seal.
Processes 12 02460 g001
Figure 2. SIPOC diagram for the thermoforming process.
Processes 12 02460 g002
Figure 3. VOC diagram for door sealing.
Processes 12 02460 g003
Figure 4. Process map for the door.
Processes 12 02460 g004
Figure 5. Potential sources that can cause door rejects.
Processes 12 02460 g005
Figure 6. Pareto chart for the most important quality indicators.
Processes 12 02460 g006
Figure 7. Taking tensile measurements with the dynamometer.
Processes 12 02460 g007
Figure 8. Repeatability and reproducibility of measurements.
Processes 12 02460 g008
Figure 9. Variation in channel shape for the gasket.
Processes 12 02460 g009
Figure 10. Measured values for the seal channel.
Processes 12 02460 g010
Figure 11. Distribution of values.
Processes 12 02460 g011
Figure 12. Chart showing the door production process (Steps 1–5).
Processes 12 02460 g012
Figure 13. Chart showing the door production process (Steps 6–10).
Processes 12 02460 g013
Figure 14. Modifying the gasket channel dimensions.
Processes 12 02460 g014
Figure 15. Modifying the seal support groove in the door thermoforming mold.
Processes 12 02460 g015
Figure 16. Vacuum channel modifications.
Processes 12 02460 g016
Figure 17. Sealing the hollow area.
Processes 12 02460 g017
Figure 18. Measuring the temperature of the thermoforming mold.
Processes 12 02460 g018
Figure 19. Analysis of the values recorded before and after the implementation of the improvements.
Processes 12 02460 g019
Figure 20. Device for checking the continuity of the gasket channel.
Processes 12 02460 g020
Table 1. Tools utilized in the application of the Six Sigma methodology.
ReferenceTools
DefineMeasureAnalysisImproveControl
[37]Project Charter,
SIPOC.
Control Charts,
Process Capability Analysis,
DPMO.
Model AS-IS,
Pareto Diagrams,
Cause and Effect Diagram,
Descriptive Data Mining.
Model TO-BE,
Visual Management
POKA—YOKE.
Control Charts,
Process Indicator Analysis.
[38]Critical to Quality (CTQ).Defect Per Million Opportunities (DPMO),
Sigma Query Lavel (SQL),
Yield Calculation.
Paretro Diagrams,
Fishbone Diagram.
Failure Mode and Effects Analysis (FMEA),
5W.
Suggestions.
[39]VSM.Rolled Throughput Yield (RTY),
Control Chart,
Fishbone Diagram,
FMEA,
Defect Per Million Opportunities (DPMO).
Root Cause Analysis (RCA),
5 S, Failure Mode and Effects Analysis (FMEA).
Recommended Improvements,
Future Activity Classification,
Future Value Stream Map,
Before and After.
Control Quality.
[40]CTQ (Critical to Quality),
SIPOC (Suppliers, Inputs, Process, Outputs, Customers).
Data Collected.5S,
CTQ,
Ishikawa Diagram.
Improvement Actions.Periodic Audits.
[41]Project Charter,
SIPOC.
Pareto Chart, Capability Analysis.Fishbone Diagram,
Brainstorming Session.
Improvement Actions.Capability Analysis,
Future State Map,
5S.
[42]Process mapping,
Voice of the customer,
Situational analysis.
Detailed Process Map,
Data Collection,
Measurement System Analysis.
Identifying Potential Causes,
Use of Statistical Methods to Find All Possible Causes.
Creation of Possible Solution,
Simulation,
Design of Experiments (DOE).
Standardization,
Training of Teams,
Performance Monitor,
Future Projects.
Table 2. Sigma levels.
Sigma LevelDPO
Defects Per Million Opportunities
Yield %
1 Sigma690,00031
2 Sigma308,53769.2
3 Sigma66,80793.32
4 Sigma621099.379
5 Sigma23399.977
6 Sigma3.499.9997
Table 3. Monitoring door rejects.
MonthNo. ProductsNo. ScarpsPercentage of Scraps
%
M117431257.17
M243972415.48
M395547217.54
M434542396.92
M592586256.75
Table 4. Sigma level identification.
Production for 5 MonthsScrapsPercentage of ScrapsPPM
28,40619516.7768,682
Table 5. Matrix of priorities for the most important quality indicators.
10987
OUTPUTSQualityTimeMaterials Cost Equipment Cost
STEPINPUTSTOTAL
1Improper gasket channel shape9966261
2Improper mold temperature9900171
3Non-compliant vacuum area sealing gasket9933216
4Vacuum hole too small6633159
5Other9600144
Table 6. The values measured by the two operators.
Measurement Performed [N]Average
1234567891011121314
OP 194.291.494.880.794.282,476.757.359.755.859.473.283.792.378.27
93.990.994.381.293.982.176.357.859.95659.773.883.392.578.26
9491.394.580.99482.776.557.159.455.15973.583.99278.14
Average
OP1
94.091.294.580.994.082.476.557.459.655.659.373.583.692.278.63
OP 298.292.193.881.794.282.577.556.557.555.358.372.182.991.778.93
9892.593.481.49482.777.856.857.855.958.772.482.591.379.03
98.491.893.781.994.182.477.456.957.455.258.272.582.791.578.92
Average
OP2
98.292.193.681.694.182.577.556.757.555.458.472.382.791.578.9
Table 7. Results obtained from monitoring after process improvement.
Month
After Improvement
No. Products
After Improvement
No. Scraps
After Improvement
M189440
M214,8780
M391680
M412,8550
TOTAL45,8450
Disclaimer/Publisher’s Note: The statements, opinions and data contained in all publications are solely those of the individual author(s) and contributor(s) and not of MDPI and/or the editor(s). MDPI and/or the editor(s) disclaim responsibility for any injury to people or property resulting from any ideas, methods, instructions or products referred to in the content.

