Article

Numerical Study of Hydrogen-Rich Fuel Coherent Jet in Blast Furnace Tuyere

Key Laboratory of Green Low-Carbon and Intelligent Metallurgy, School of Materials and Metallurgy, University of Science and Technology Liaoning, Anshan 114000, China
*
Authors to whom correspondence should be addressed.
Processes 2024, 12(11), 2441; https://doi.org/10.3390/pr12112441
Submission received: 9 October 2024 / Revised: 29 October 2024 / Accepted: 2 November 2024 / Published: 5 November 2024
(This article belongs to the Section Chemical Processes and Systems)

Abstract

:
Injecting hydrogen-rich fuel into blast furnaces is an effective strategy to reduce carbon dioxide (CO2) emissions. The present study established a three-dimensional (3D) model based on a coherent jet of hydrogen-rich fuel. The combustion characteristics and the flow, heat, and mass transfer behaviors in the reaction region were simulated by the Computational Fluid Dynamics (CFD) method. The effects of fuel jet velocity on the distributions of gas velocity, temperature, and species in the reaction region were systematically analyzed. The results show that hydrogen-rich fuel burned around the main jet, generating a high-temperature, low-density flame. As flame length increased, the main jet experienced less decay. The outward expansion of the jet caused continuous diffusion of gas temperature and its components. As the fuel jet velocity increased, the temperature along the main jet centerline rose sharply, while the length of the high-concentration gas region extended. Doubling the jet velocity increased its centerline velocity by 11% and raised the average reaction region temperature by 4.12%. The obtained highlighted results are of paramount importance for optimizing hydrogen-rich smelting in blast furnaces.

1. Introduction

With rising environmental pollution and increasing global demand for energy conservation and emission greenhouse gas reduction, optimizing energy efficiency and adopting low-carbon smelting in the iron and steel industry have become critical priorities. In 2023, global crude steel production reached 1888.2 million tons [1], contributing approximately 7% of the world’s total CO2 emissions. Notably, blast furnace ironmaking accounts for approximately 90% of the steel industry’s carbon emissions [2]. The fuel composition used in blast furnace ironmaking plays a crucial role in reducing CO2 emissions. The development of efficient and clean alternative fuels for blast furnaces is a critical area of research. Injecting hydrogen-rich fuels such as recycled top gas, natural gas, and coke oven gas into blast furnaces has proven to be an effective method for reducing CO2 emissions [3], As a result, research on hydrogen-rich fuel injection has gained significant importance. This technology will be a key focus and core area of competition in low-carbon blast furnace ironmaking.
In recent years, hydrogen-rich fuel injection in blast furnaces has undergone industrial testing both domestically and internationally, yielding significant results. Notable examples include Japan’s COURSE50 project [4], Europe’s ULCOS project [5], and China’s Baowu Group’s project on hydrogen-rich top gas recycling in oxygen blast furnaces. These industrial tests have primarily followed two technical approaches: injecting hydrogen-rich gases such as natural gas, ammonia, coke oven gas, etc., or utilizing an oxygen blast furnace with top gas recycling. In experimental studies, Jozwiak et al. investigated the reduction of various iron oxides in hydrogen and carbon monoxide atmospheres [6]. Qie et al. explored the softening and melting reduction behavior of iron oxides in blast furnaces using hydrogen [7]. Park et al. studied the effects of hydrogen on ore reduction rates and coke reactivity [8] These experiments demonstrated that incorporating hydrogen into the reducing gas promotes iron ore reduction and reduces CO2 emissions. While physical experiments can reveal how hydrogen-rich gas affects the metallurgical properties of the charge and coke, they fall short in fully capturing the gas velocity, temperature, and concentration fields during the hydrogen-rich injection in a blast furnace. Computer-based numerical simulations address this limitation. Zhang et al. [9] used simulations to study the effects of single-coal injection and combined injection of pulverized coal and natural gas on combustion in the raceway, revealing that natural gas injection significantly reduces CO2 emissions in blast furnaces. Zhang et al. also examined the effects of natural gas and coke oven gas injection on the raceway conditions and pulverized coal combustion. Their results indicated that hydrogen injection raises the tuyere outlet temperature while lowering the pulverized coal burn-out rate [10]. Shen et al. [11] studied hydrogen-coal co-injection at an industrial scale under blast furnace conditions, analyzing how hydrogen injection rate affects temperature, gas composition, and pulverized coal burn-out rate in the raceway. Yu et al. [12] used a two-fluid blast furnace model to investigate the impact of hydrogen injection on furnace gas flow and smelting performance. Their results showed that increasing hydrogen injection velocity increased the penetration depth of hydrogen, and raised the cohesive zone’s apex, while significantly reducing the fossil fuel ratio. These findings have provided valuable insights into hydrogen-enriched smelting in blast furnaces. However, it is well known that injecting hydrogen-rich fuel at the tuyere reduces the blast’s kinetic energy, which is a growing concern in blast furnace operations. To address this issue, the present study proposed installing a ring nozzle on the tuyere to enable dual-flow coherent injection. Compared with traditional tuyere, the hydrogen-rich fuel, injected through the ring nozzle, combusts to form a high-temperature, low-density flame. This flame protects the blast core area, allowing its length to be adjusted according to the process requirements. Previous studies on coherent jets provide valuable theoretical and data support for practical applications [13,14,15,16,17]. Meanwhile, Ali et al. [18] used simulations to study the mixing behavior of a hydrogen jet released from the 3-lobe annular nozzle behind the strut, and its flow interactions are analyzed. The effect of internal air jet flow on hydrogen mixing was investigated. However, the aforementioned results indicate that an effective hydrogen-rich fuel coherent jet in the blast furnace tuyere has not yet been fully achieved, and that the underlying theories and mechanisms remain unclear. In reality, coherent injection of hydrogen-rich fuel provides an efficient method for hydrogen-enriched smelting in blast furnaces. Therefore, a comprehensive study on this new combustion technology’s application to blast furnaces is needed.
In the present study, a 3D model was developed to simulate the hydrogen-rich fuel coherent jet process. The heat and mass transfer behavior and flow characteristics in the reaction region were simulated with the CFD method for a coherent jet process. The numerical model and simulation conditions were validated by comparing the simulation results with existing literature data. The effects of co-flow velocity on jet morphology and combustion behavior were systematically studied and analyzed. The findings are expected to offer an efficient injection method for hydrogen-enriched blast furnace smelting.

2. Methodology

In the present study, a model was developed to simulate a coherent jet of hydrogen-rich fuel. A 3D steady-state flow and combustion model was constructed to describe the behavior of the coherent jet under industrial-scale blast furnace conditions.

2.1. Gas Flow Model

The Navier–Stokes equations, solved using the Euler method, were applied to calculate the gas’s mass and momentum [19]:
· ρ Y i v = m ˙ i
· ρ v v = P + τ ¯ ¯ + ρ g
where ρ, v , and P represent the density, velocity, and pressure of the gas, respectively; g denotes gravitational acceleration; Yi designates mass fraction of the ith species; m ˙ i stands for net rate of production of species i; and τ ¯ ¯ g signifies corresponding gas stress tensor.
The governing equation for gas turbulence utilizes the realizable k-ε turbulence model. The transport equation for turbulence kinetic energy and dissipation rate were as follows:
· ρ k v = · μ + μ t σ k k + G k + G b ρ ε
· ρ ε v = · μ + μ i σ ε ε + ρ C 1 S ε ρ C 2 ε 2 k + v ε + C 1 ε ε k G 3 ε G b
where Gk represents the turbulence kinetic energy generated by the mean velocity gradient; Gb denotes the turbulence kinetic energy due to buoyancy; S designates the modulus of mean rate-of-strain tensor; and μ stands for the turbulent viscosity. The values of C2, C1ε, σk, and σε, as calculated by the turbulence model, are 1.9, 1.44, 1.0, and 1.2, respectively.
The gas-phase energy conservation equation [20] is
· ρ v H = P t + τ ¯ ¯ v q + Q rad
where H represents the total gas enthalpy; q denotes the heat flux of the gas; and Qrad designates the radiation heat exchange.

2.2. Chemical Reaction Models

The Finite Rate/Eddy Dissipation model [1] was adopted to simulate the gas combustion reaction, with the net reaction rate being determined as the minimum of two rates. The net source of chemical species i from the reaction was computed as the sum of reaction sources across the NR reactions involving that species:
m ˙ i = M w , i i = 1 N r R ^ i , r
where Mw,i represents the molecular weight of species i; and R ^ i , r denotes the molar rate of creation/destruction of species i in reaction r.
For the mixed-is-burned approximation, the simulation employed a turbulence-chemistry interaction model known as the eddy-dissipation model. In this model, the net production rate of species i from reaction r, Ri,r was determined by the smaller (limiting) value of the two expressions:
m ˙ i = v i , r M w , i A ρ ε k min R Y R v R , r M W , R
m ˙ i = v i , r M w , i A B ρ ε k p Y p j N v j , r M W , j
where YR represents the mass fraction of a particular reactant, and YP denotes the mass fraction of any product species. The values of the empirical constants A and B were 4.0 and 0.5, respectively.

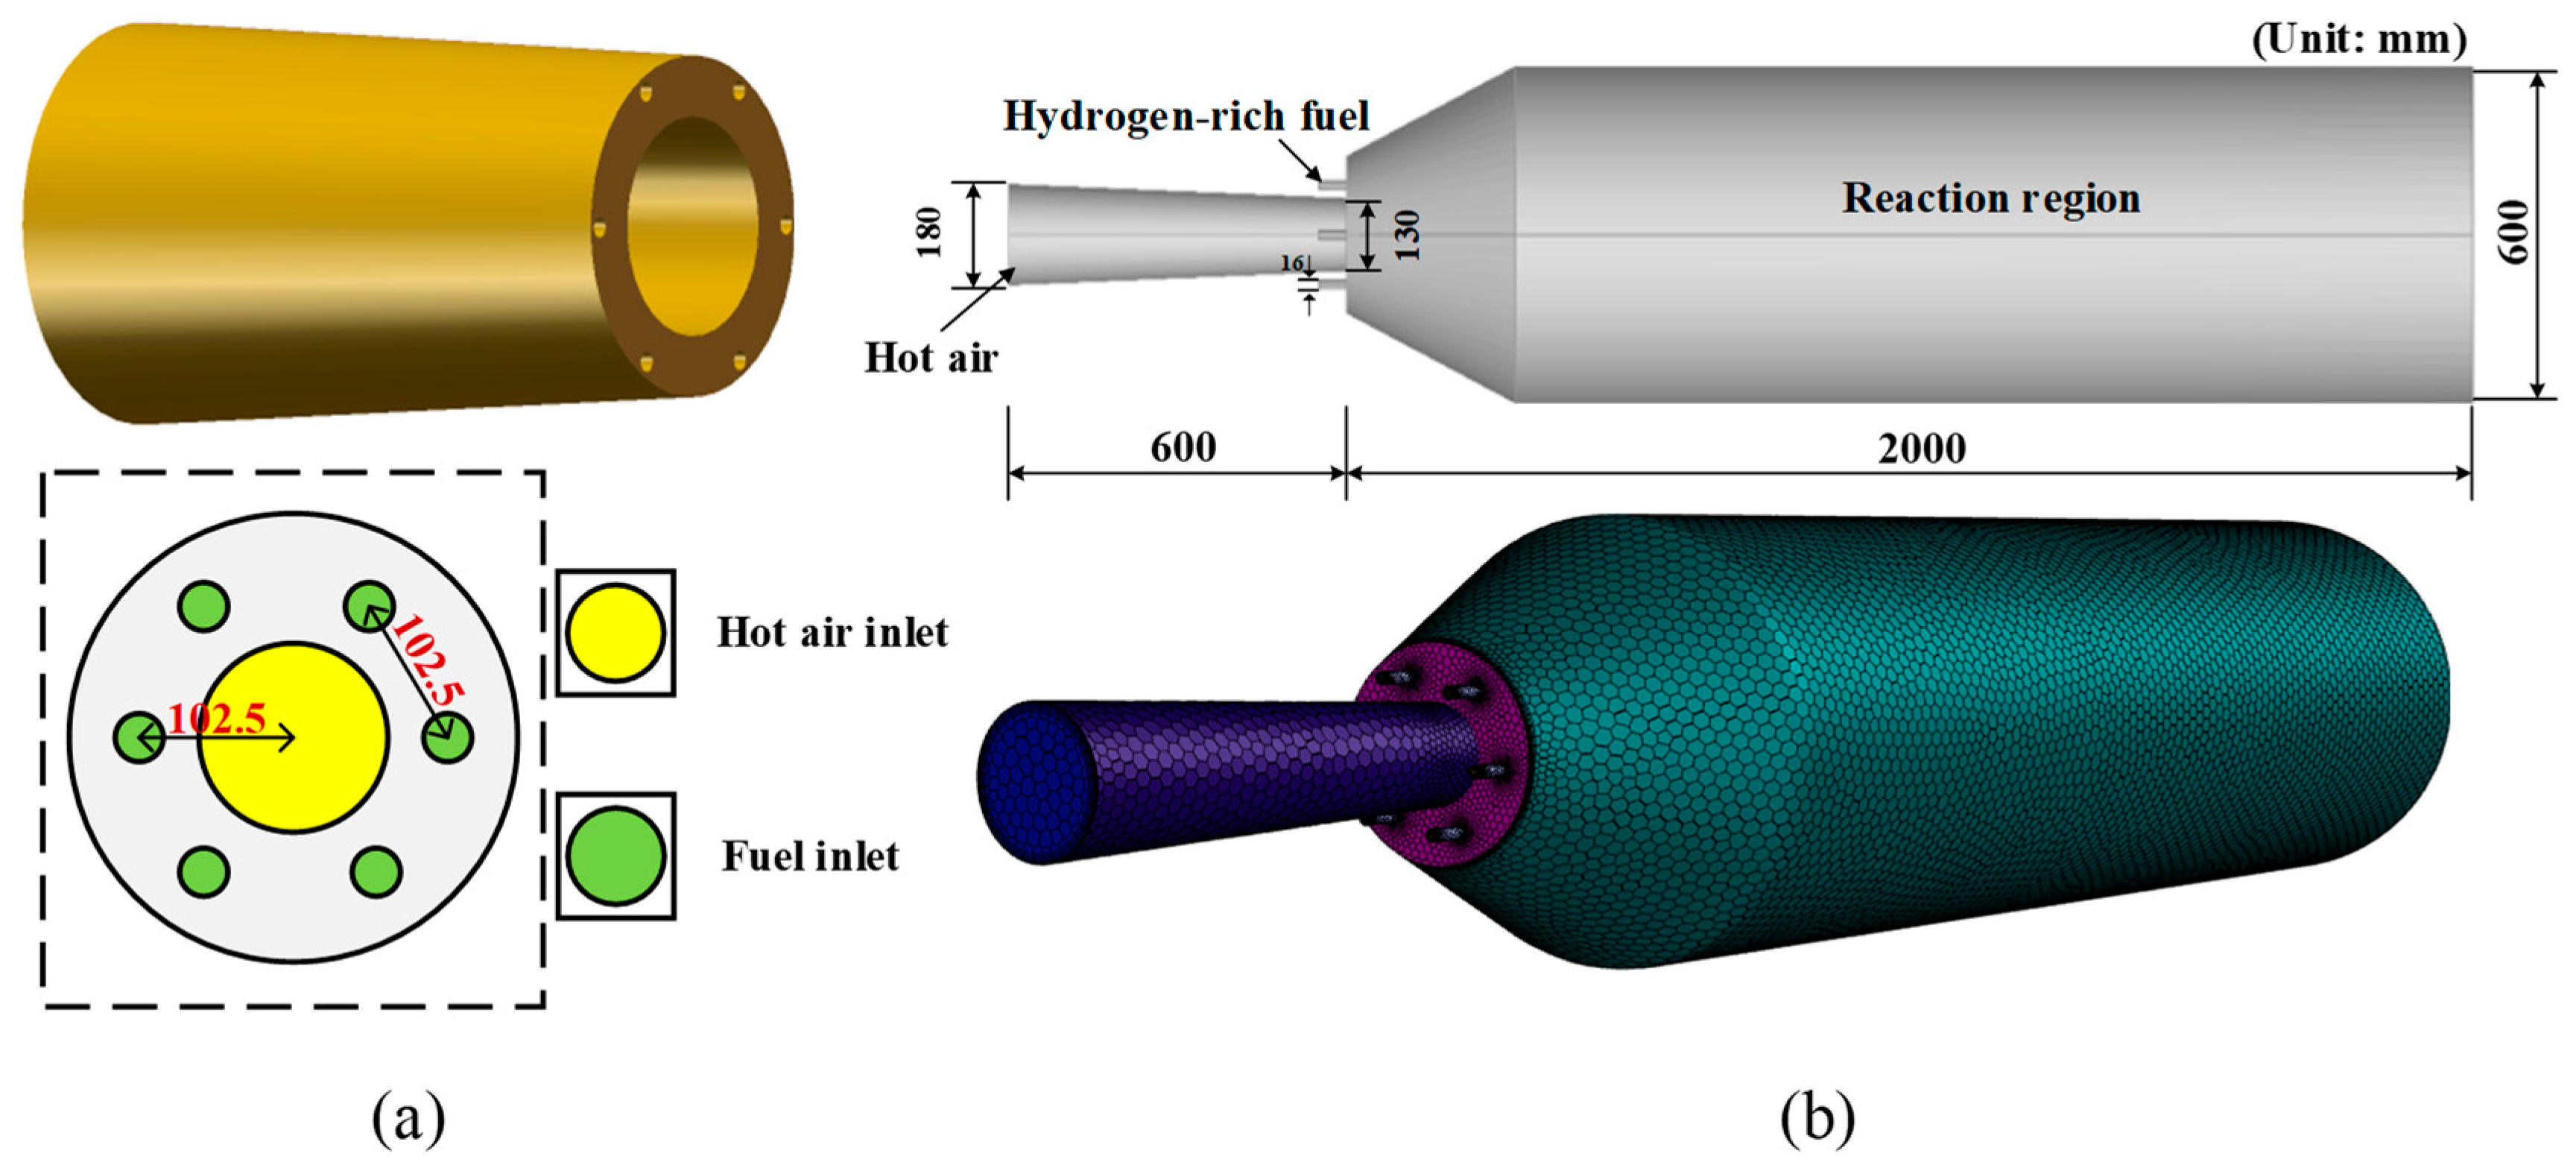
2.3. Simulation Conditions

In the present study, the injection process of hot air and hydrogen-rich gas was simulated with ANSYS-FLUENT. The tuyere structure, designed for a 3200 m3 commercial blast furnace, is shown in Figure 1a. The tuyere had a tapered design, with an inlet diameter of 180 mm and an outlet diameter of 130 mm. Ring nozzles, each with a diameter of 16 mm, were evenly distributed around the core. The geometry and meshes of the tuyere, ring nozzle, and reaction region are presented in Figure 1b, while the operating parameters used in the simulations are presented in Table 1. The accessory foramina around the front of the tuyere were used to inject hydrogen-rich gas, with its composition detailed in Table 2. The outlet pressure of the reaction region was set to 0.3 MPa. The entire calculation domain was divided using polyhedral mesh. Spatial discretization was performed using a cell-based least-squares approach, and the SIMPLE method was employed to solve the coupled pressure-velocity problem. To ensure the accuracy of the simulation results, a second-order upwind scheme was used. When the residual value of the energy and radiation is smaller than 10−6, and the value of other variables is smaller than 10−3, the solution is considered to converge.

3. Results and Discussion

3.1. Model Validation
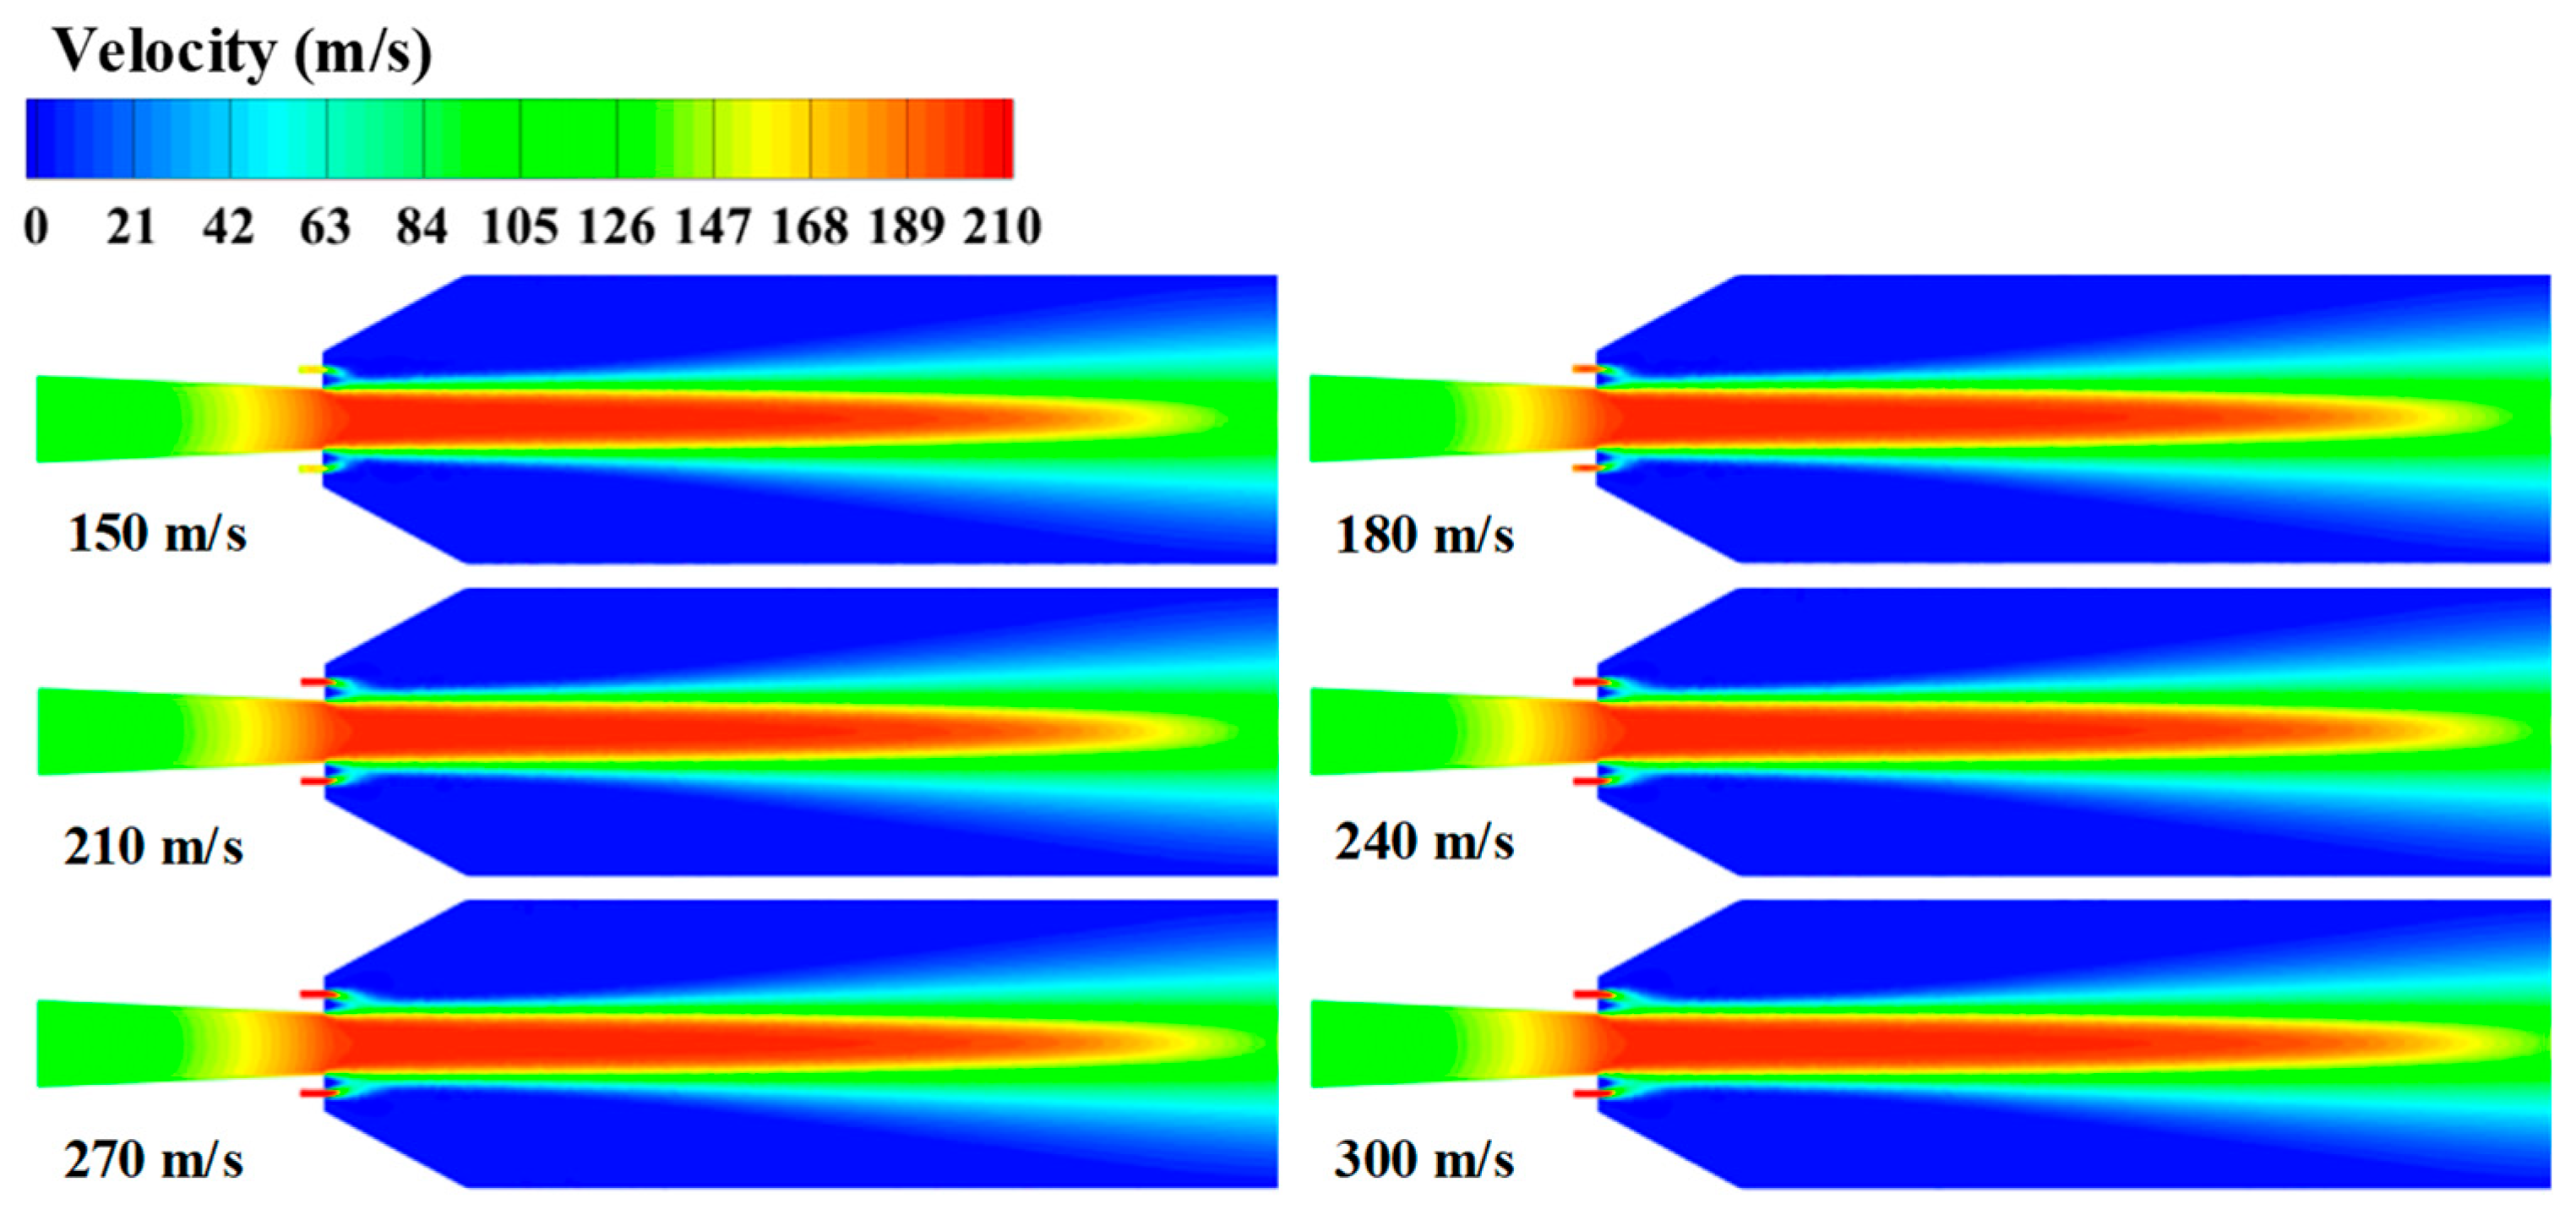
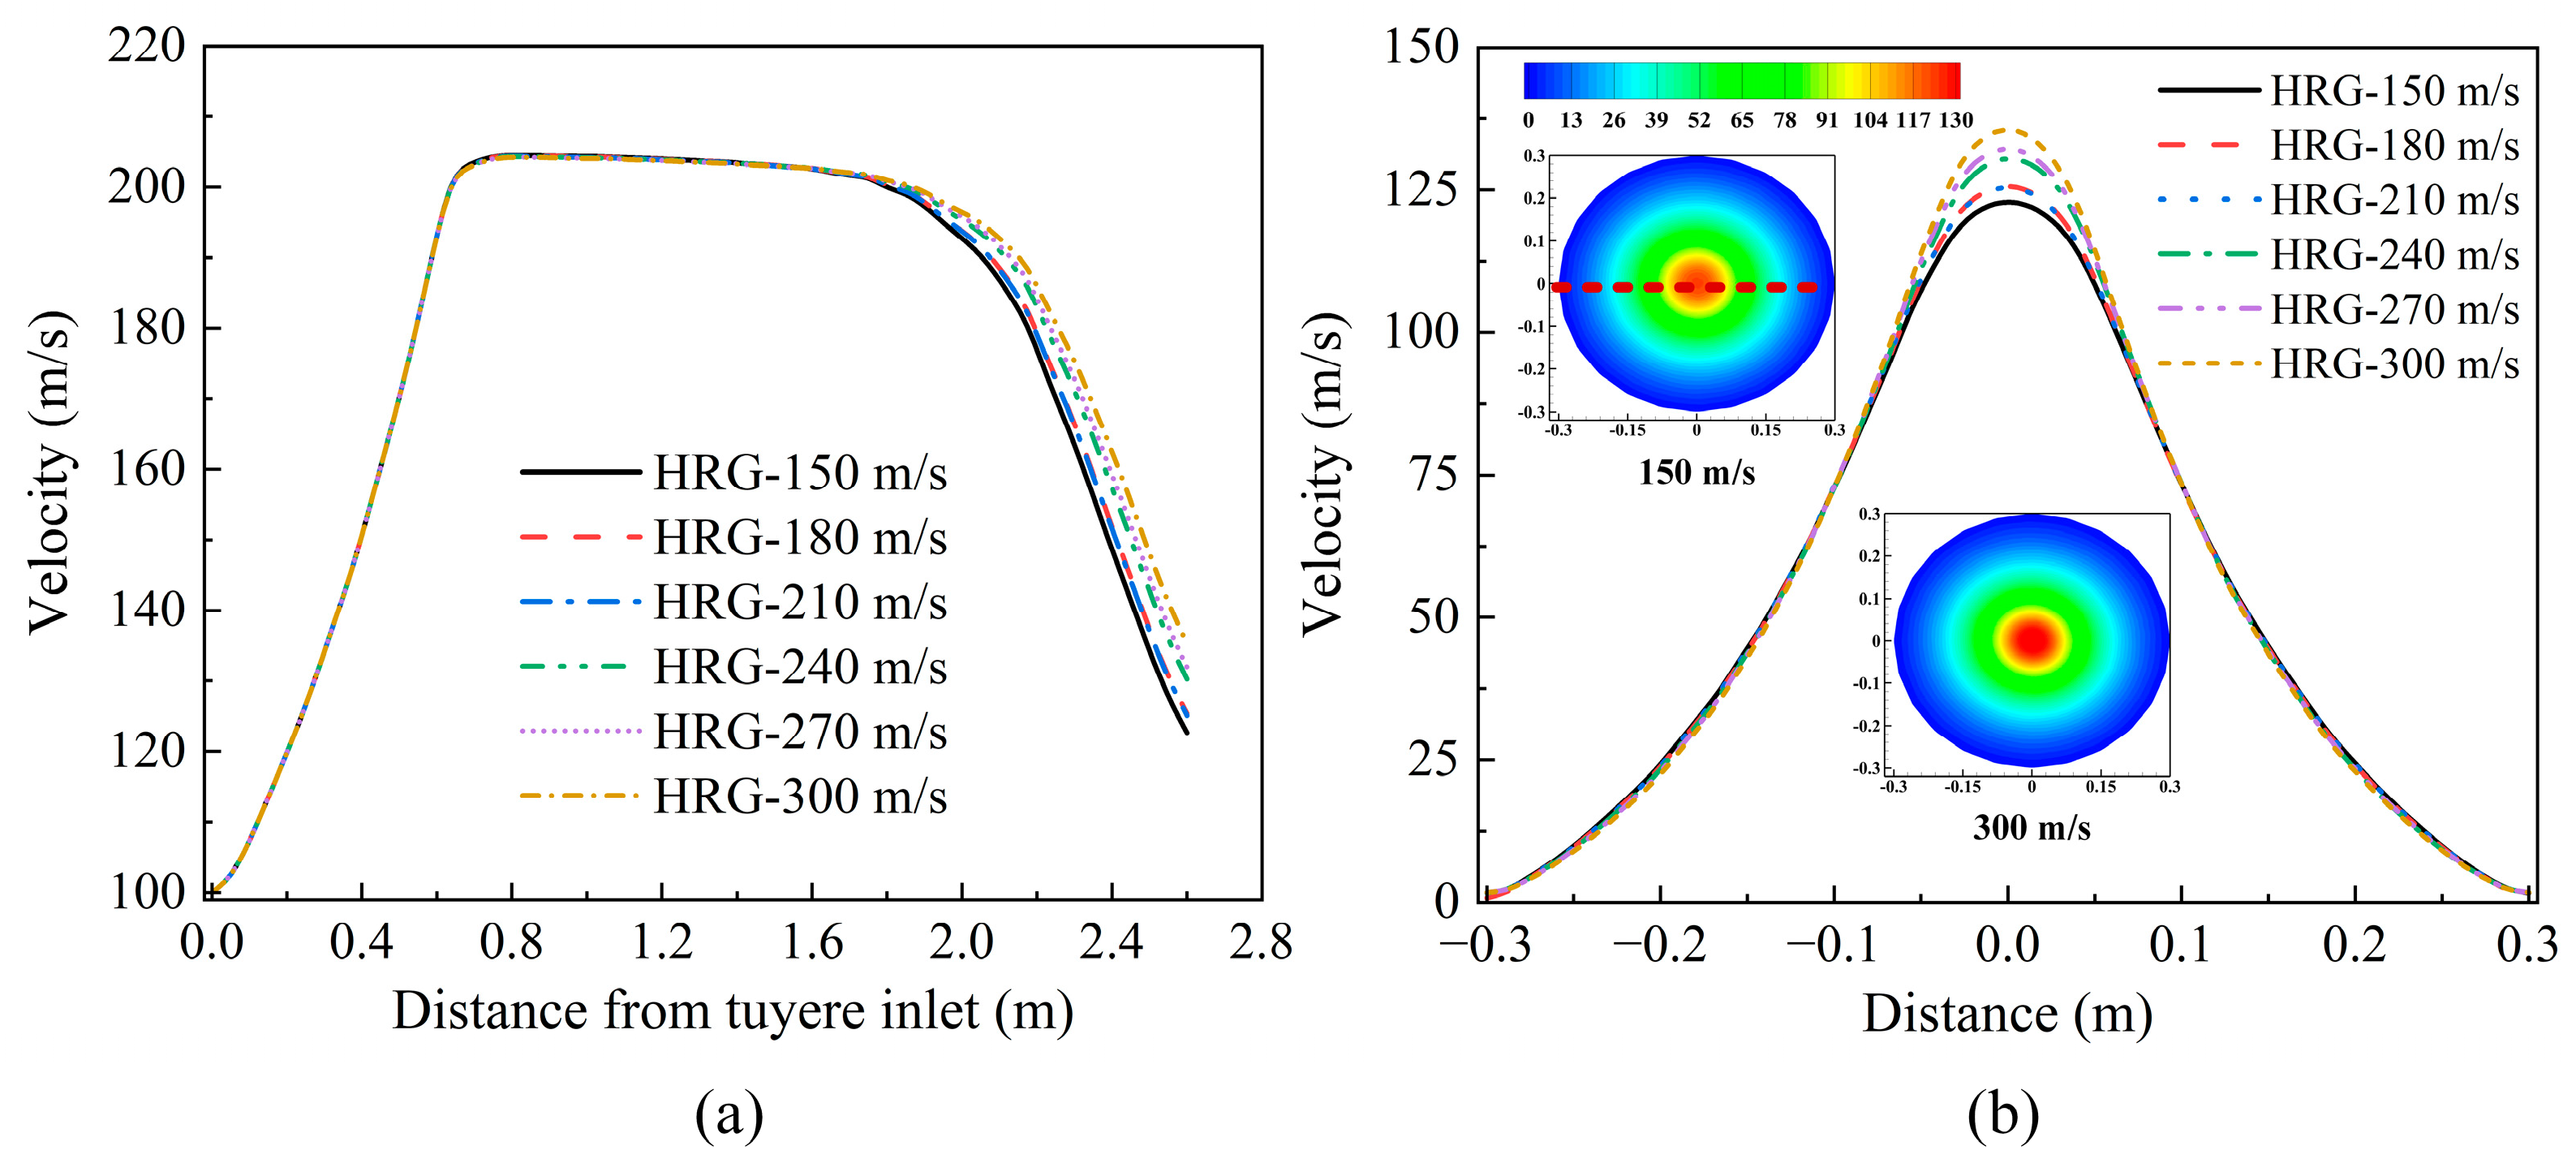
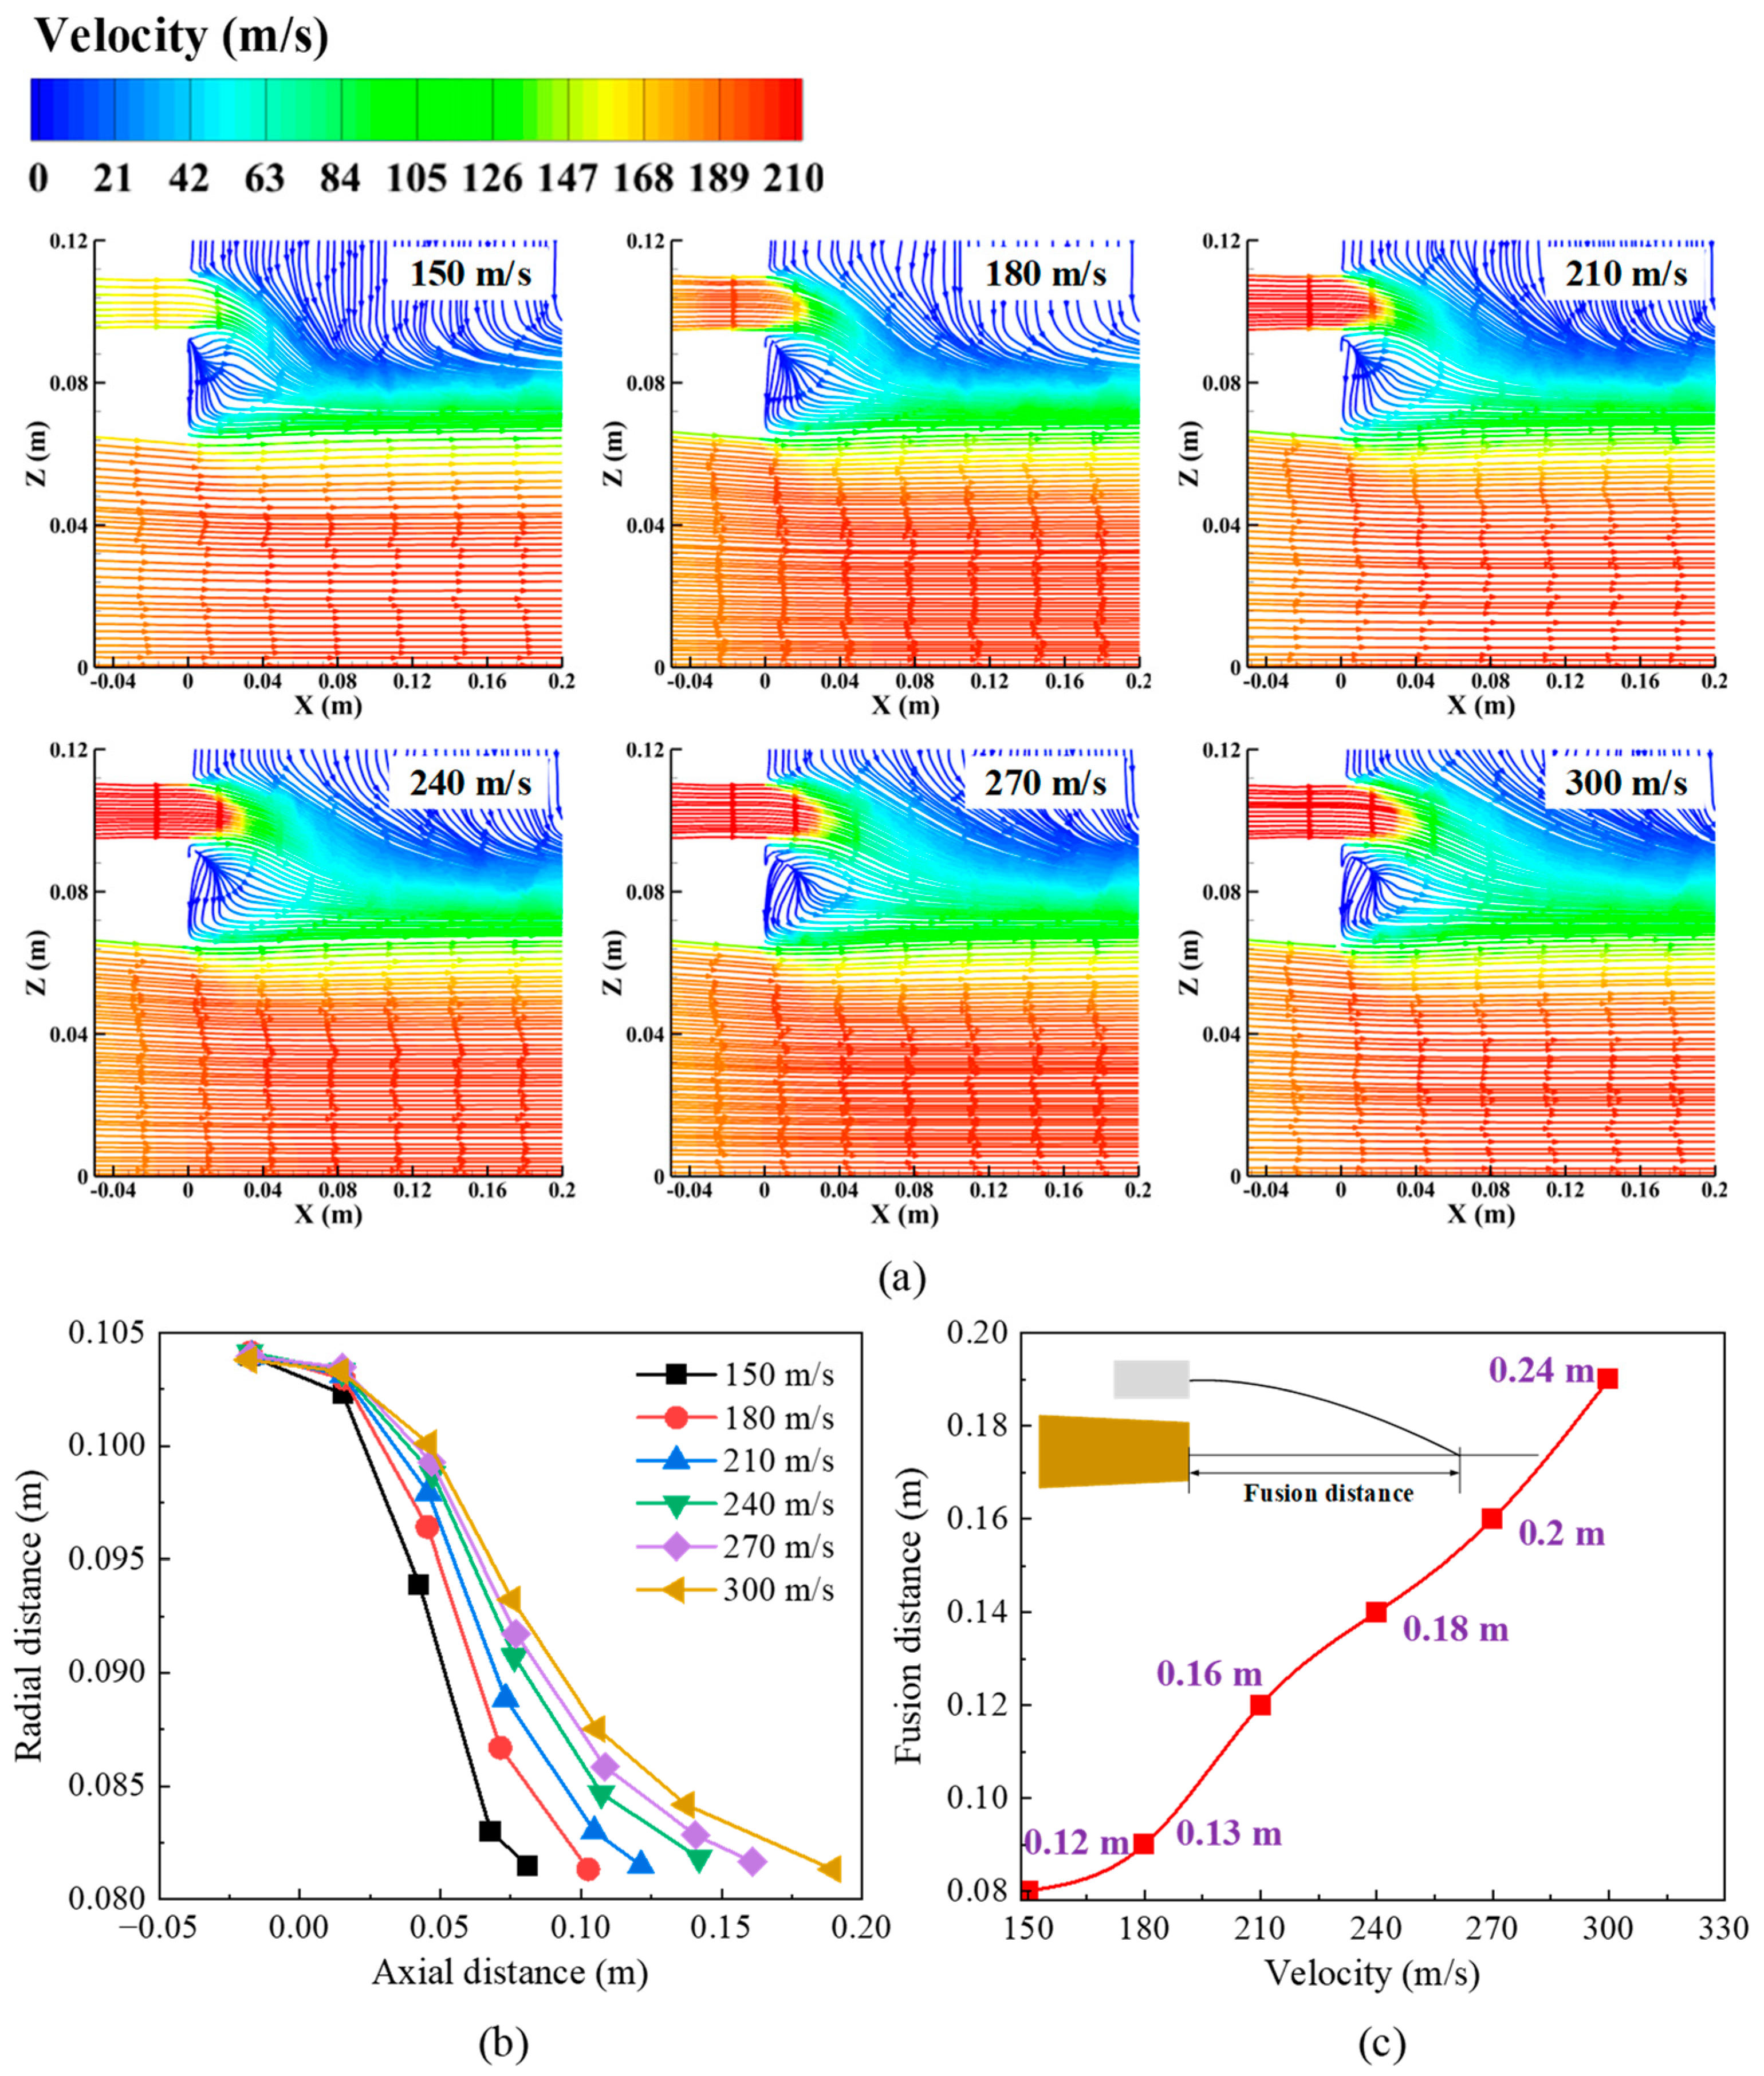
To achieve mesh-independent verification and minimize numerical errors related to the mesh, three different grid levels were utilized in the present study: coarse (200,000 cells), medium (400,000 cells), and fine (600,000 cells). Figure 2a shows the centerline velocity of the tuyere along the blast direction for each grid configuration. The coarse grid calculations exhibited a more pronounced drop in centerline velocity, while the medium grid provided more accurate predictions. Additionally, to verify the model’s validity and accuracy, a jet model was constructed based on the simulations by Tang et al. [17] and the experimental study by Andeson et al. [19]. The model divided the gas orifices into three sections: one primary oxygen inlet, 16 fuel inlets, and 16 secondary oxygen inlets. The boundary conditions were consistent with those used in Tang’s study. The velocity distribution obtained from the simulation results is depicted in Figure 2b. The simulation results closely aligned with the five experimental measurement points from Anderson’s study, and they demonstrated a good agreement with Tang’s simulation results.

3.2. Gas Velocity

During the blast process in the tuyere of a blast furnace, the hot air was obstructed by the surrounding gas and coke particles, leading to a gradual reduction in blast velocity. The coherent injection of hydrogen-rich fuel around the tuyere mitigated the decay of the main jet velocity, the combustion of hydrogen-rich fuel from the ring nozzle outlet around the tuyere generated a high-temperature, low-density flame. To examine the effect of shrouding flame on the blast morphology, Figure 3 presents the velocity distribution within the reaction region at various shrouding gas velocities. As depicted in the figure, the velocity of the hot air entering the tuyere gradually increased, reaching its peak after merging with the shrouding gas. The shrouding gas strands entrained the surrounding gases, and the amount of entrained gas gradually increased along the length of the jet, causing the jet to spread gradually outward until it influenced the jet’s center. Higher shrouding gas velocities resulted in a longer core region of the jet. This observation aligned with findings reported by Feng et al. in their study on a coherent jet [13].
To quantitatively characterize the impact of coherent injection on blast velocity, Figure 4a illustrates the quantitative relationship between the velocity at the tuyere’s centerline and the distance of the jet. The figure shows three distinct stages in the velocity change during the blast process. In the phase of increasing main jet velocity, which occurred between 0 and 0.6 m (corresponding to the length of the tuyere sleeve), the rise in blast velocity was primarily due to the tapered structure of the tuyere sleeve. The stable phase of the main jet velocity core region extended from 0.6 to 2 m. During this phase, the hot air gradually merged with the shrouding gases, resulting in the formation of a high-temperature, low-density flame around the core. This interaction slowed the attenuation of the main jet velocity. In the decay stage of the core region’s main jet velocity, the hot air continued to entrain the surrounding gases, leading to energy attenuation. As a sufficient amount of gas was entrained, it increasingly influenced the core velocity of the jet. The lower the accompanying velocity, the more pronounced the decay of velocity in the core region. Figure 4b quantitatively characterizes the velocity distribution in the cross-section located 2 m from the tuyere, where the most significant velocity attenuation occurred. The inset displays a cloud map illustrating the velocity distribution. The shrouding gas velocity significantly affected the central velocity of the jet, As the shrouding gas velocity increased, the extent of the high-speed region within the jet’s central velocity also rose. When the velocity of the shrouding gas doubled, the maximum velocity at the center of the cross-section increased by 11%.
In addition, gas trajectories could also be used to quantitatively characterize the fusion behavior of the primary and secondary flows. Figure 5a illustrates the flow trajectories for different shrouding gas velocities. As shown in the figure, the shrouding gas was deflected toward the hot air side, ultimately forming a velocity layer of 100 m/s around the hot air. As the gas velocity increased, the thickness of this velocity layer also increased, leading to the development of violent turbulent motions at its outer boundary. The effect of fuel jet velocity on the deflection of the jet is shown in Figure 5b. The concurrent jet stream was short, resulting in premature polymerization. At each velocity, the accompanying jets began to deflect at a distance of 0.025 m from the tuyere outlet and continued until they merged with the main jet. Figure 5c shows the fusion distance for different fuel jet velocities. Notably, when the fuel jet velocity was doubled, the fusion distance also doubled.

3.3. Gas Temperature
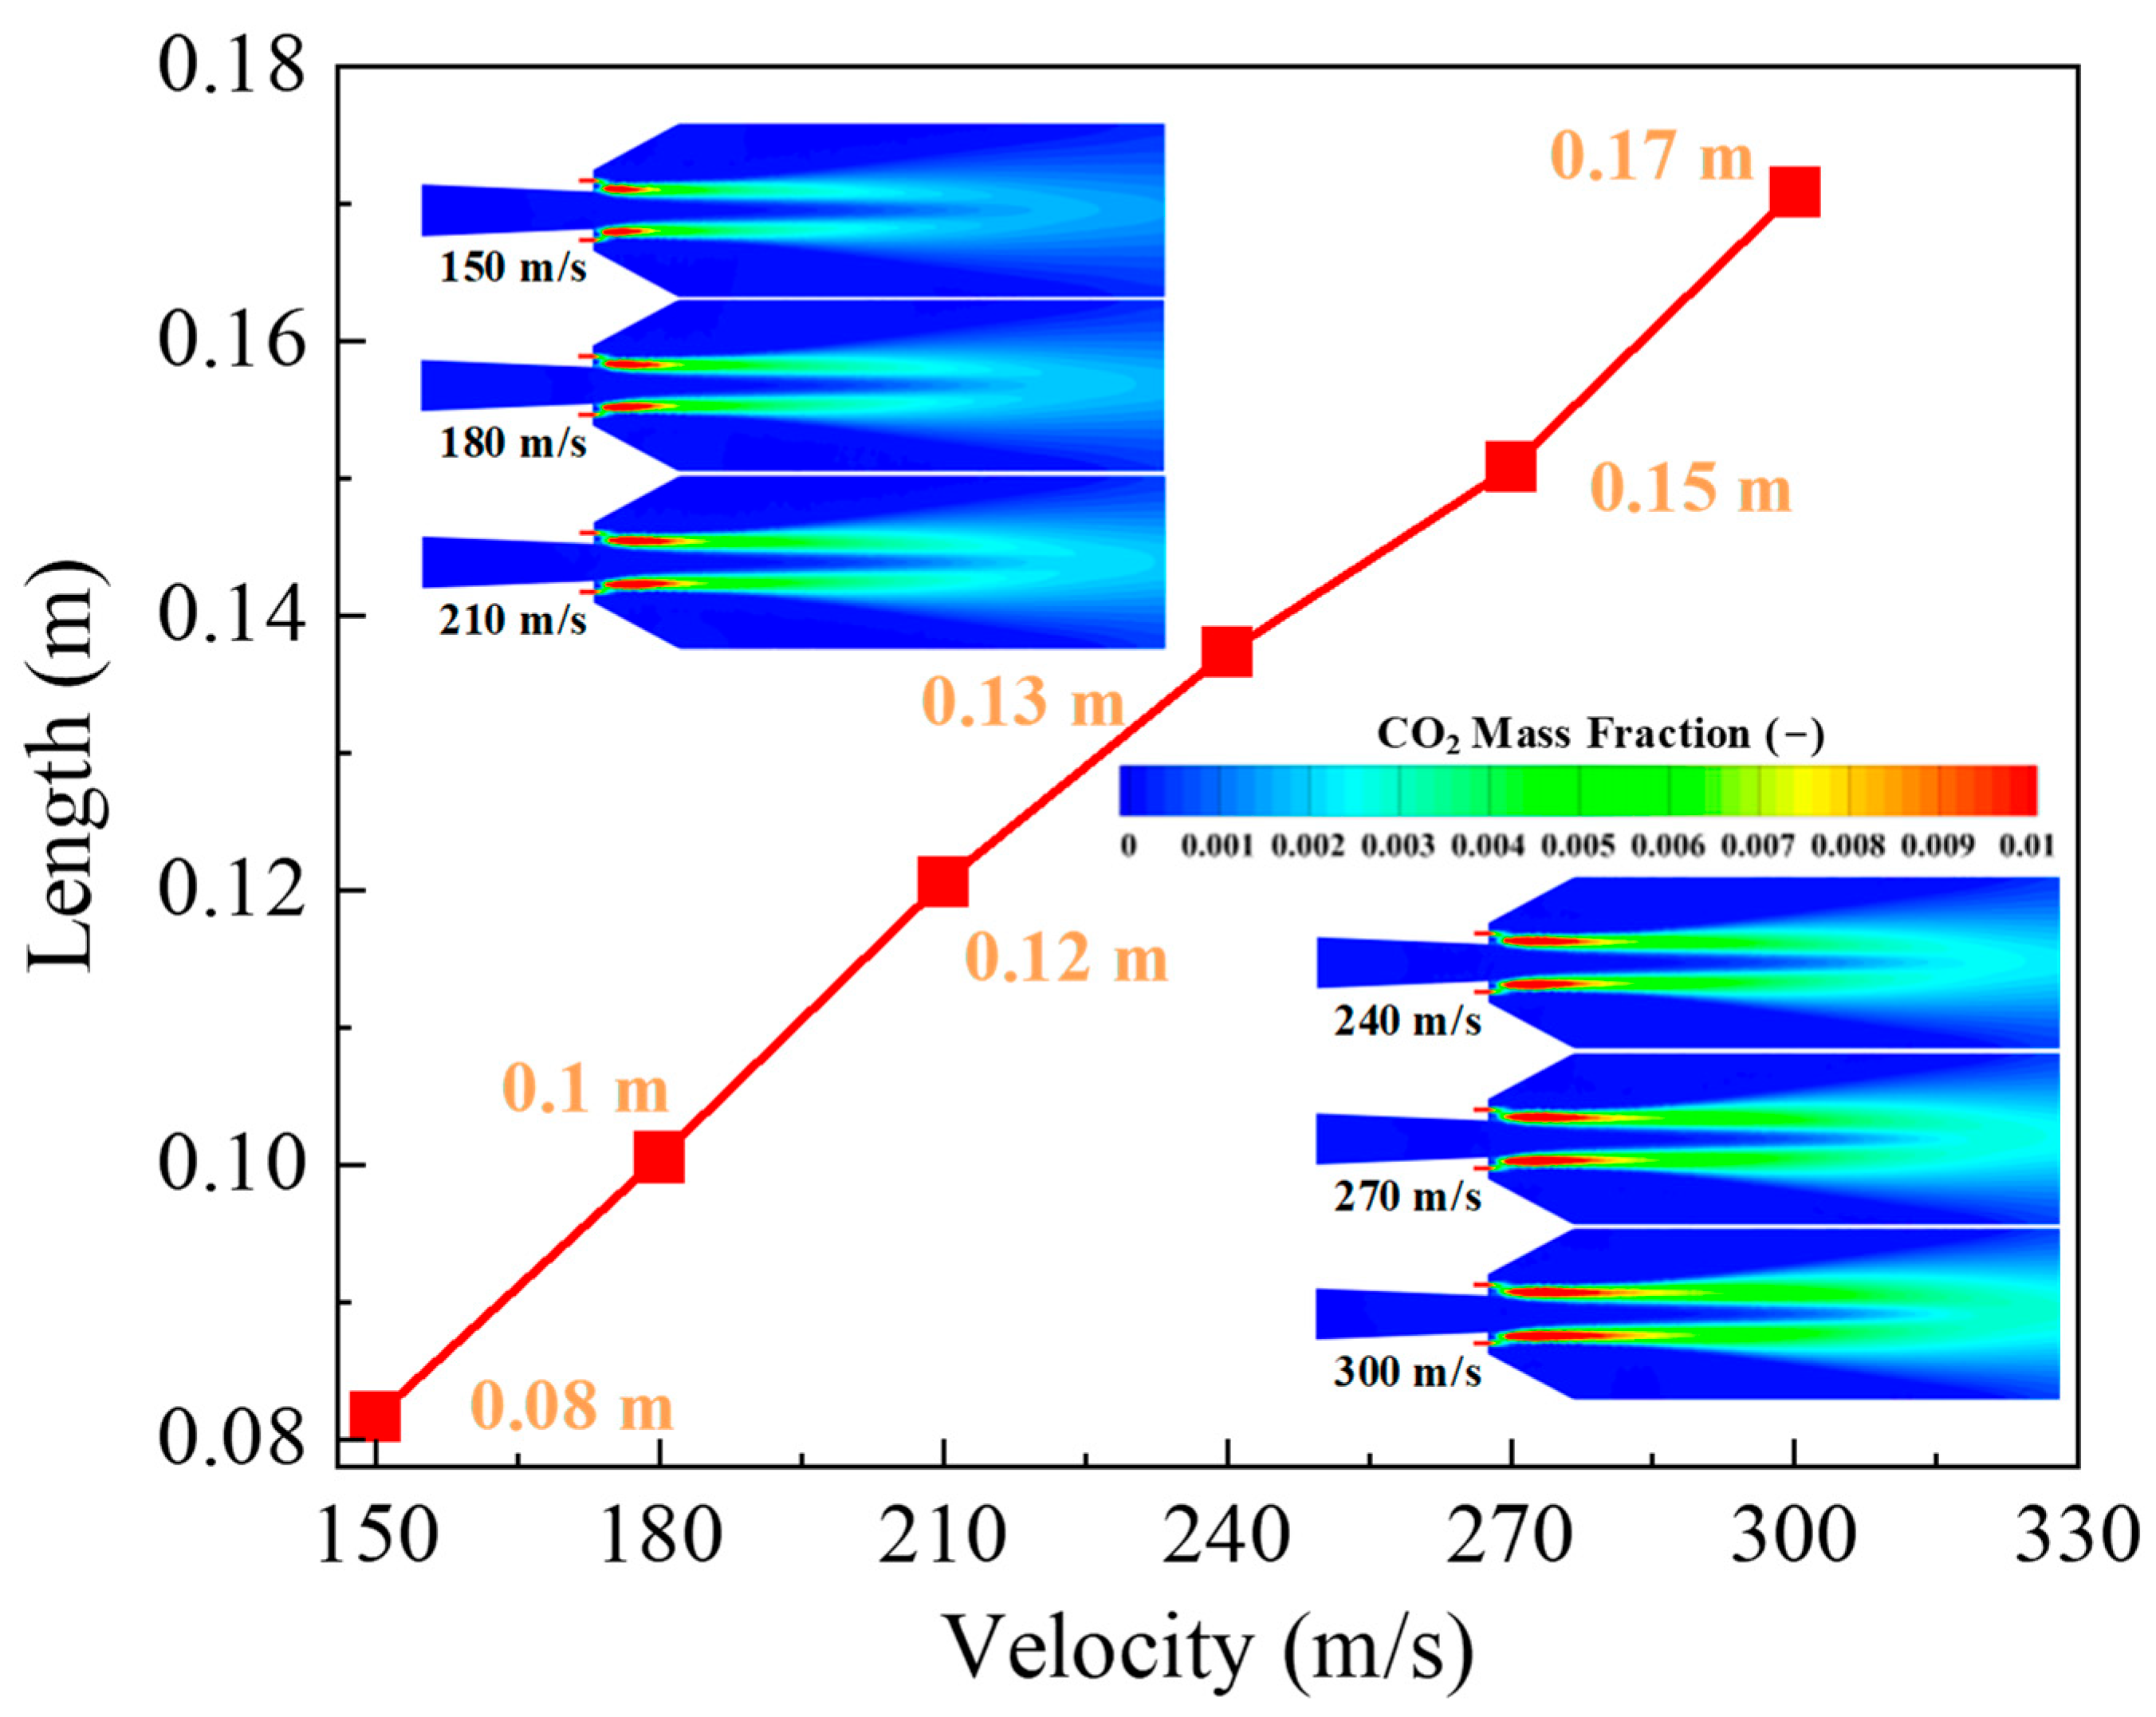
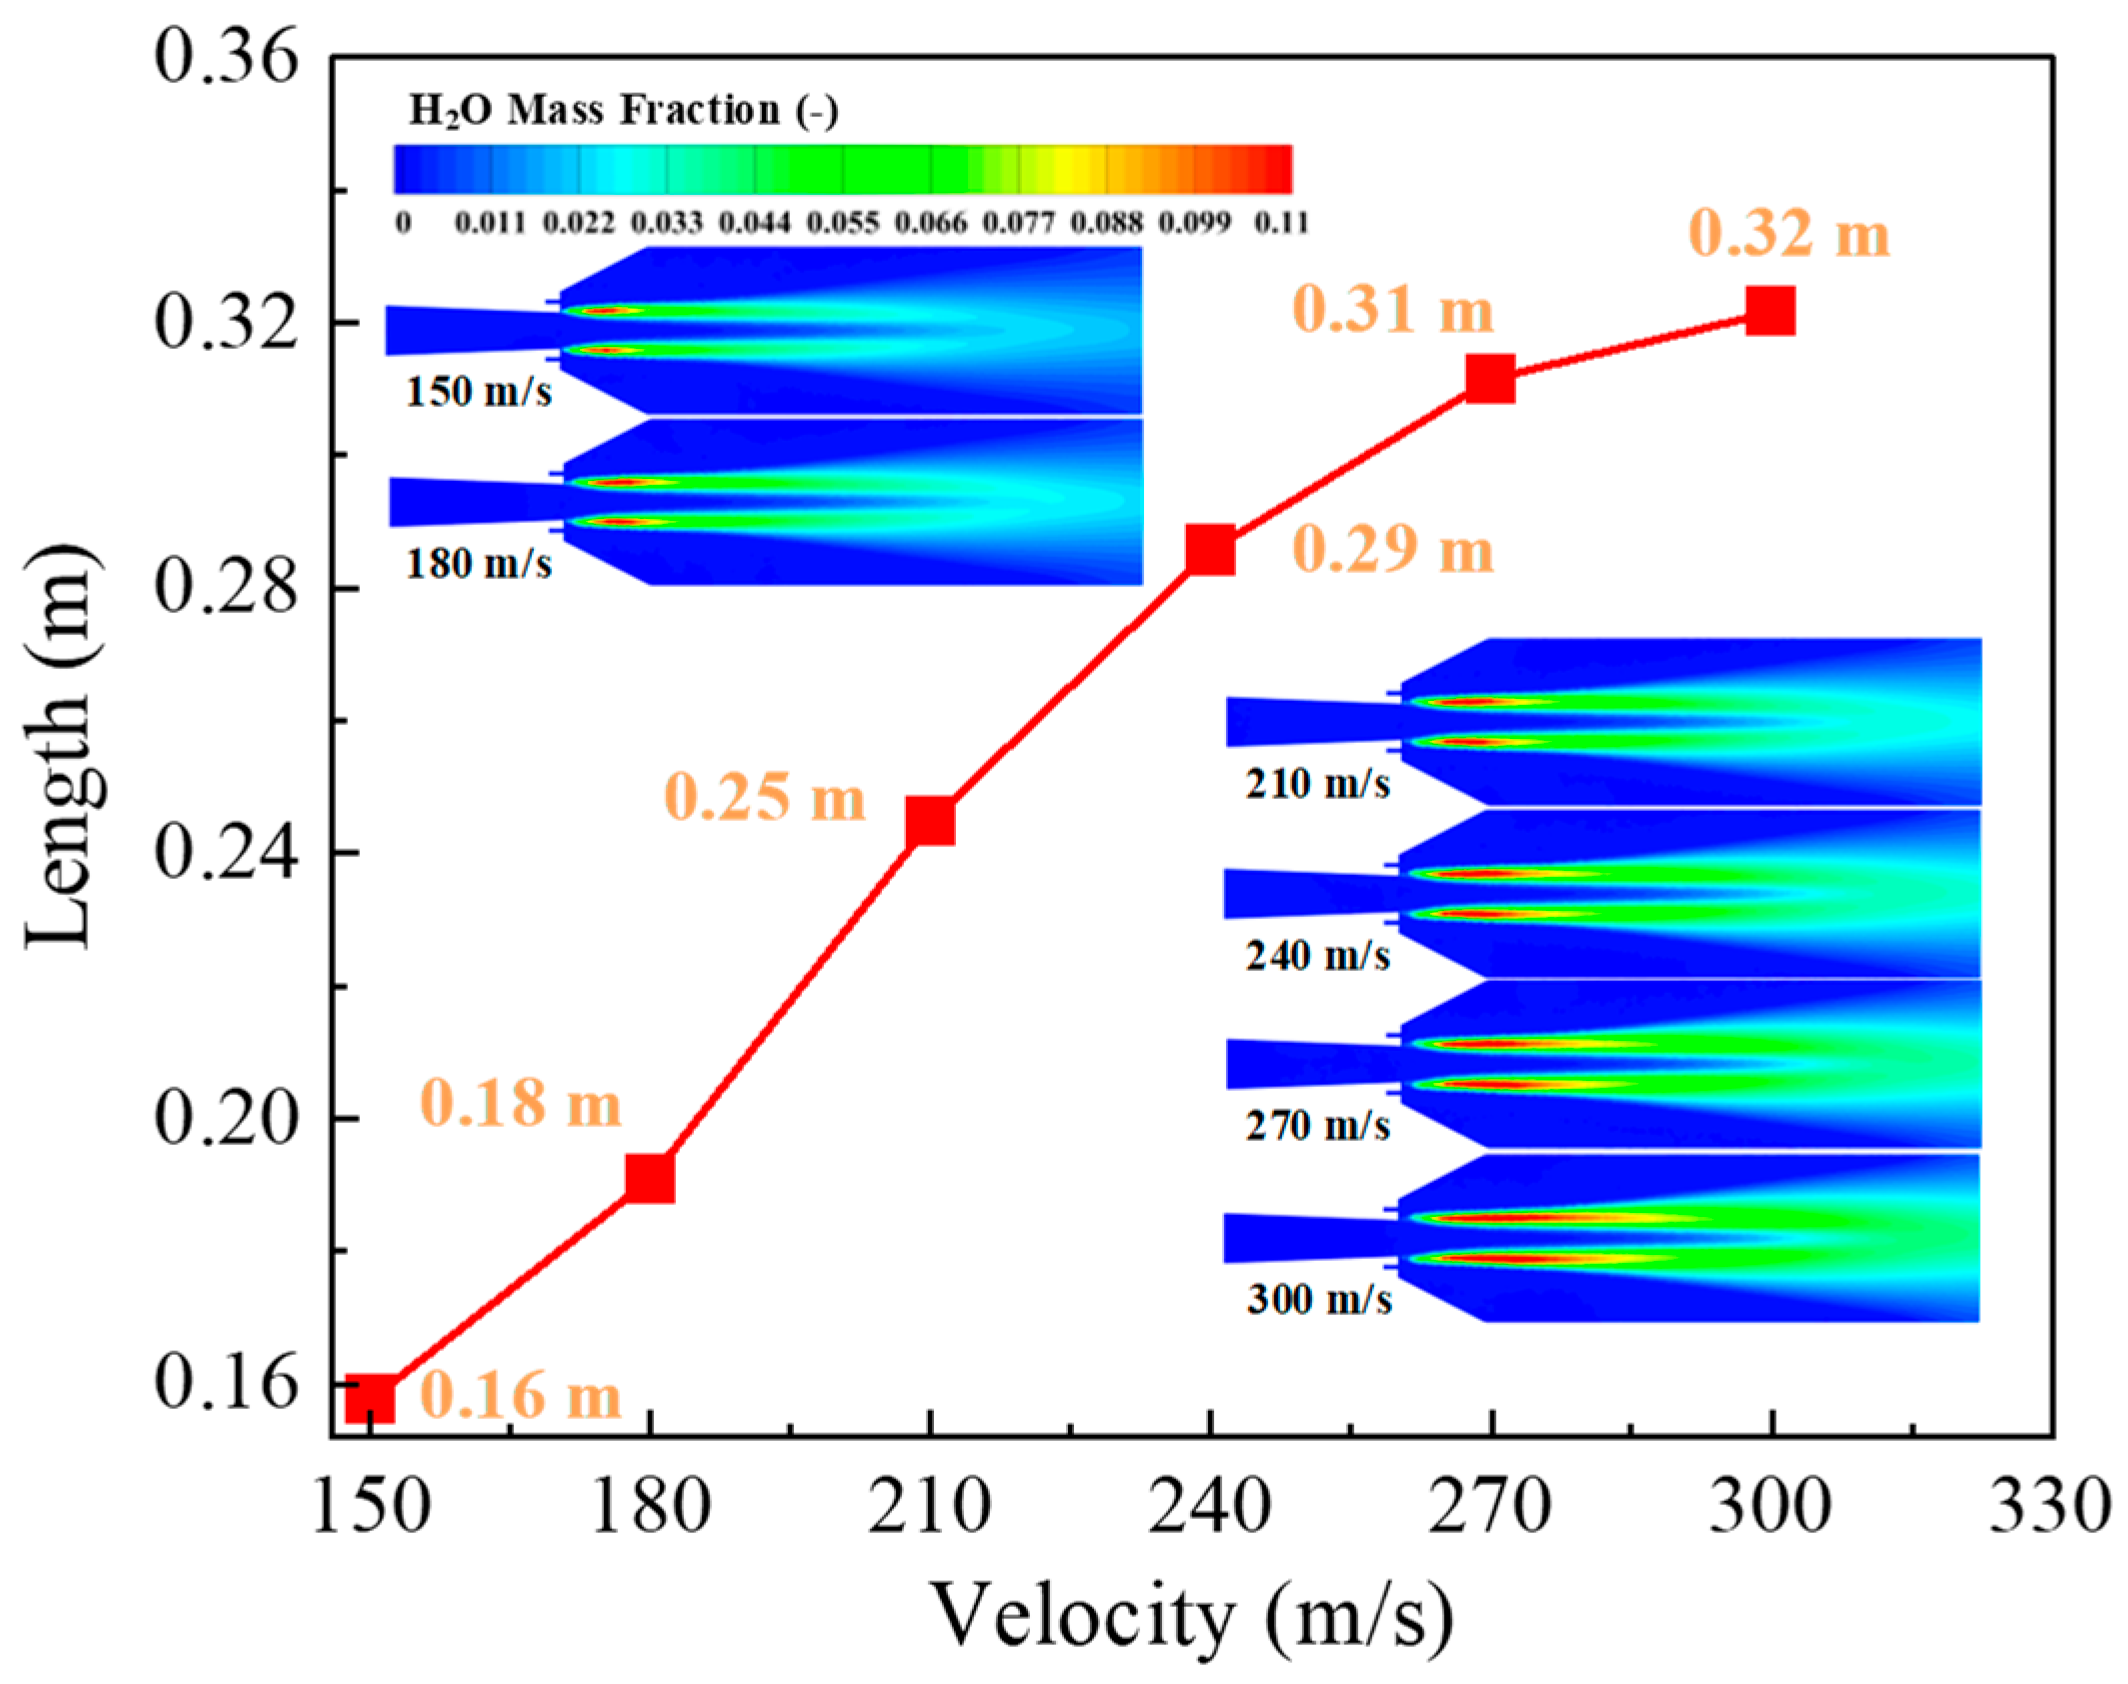
The primary source of energy within the blast furnace is the combustion of fuel. To examine the combustion behavior of coherent injection of hydrogen-rich flue, Figure 6 illustrates the temperature distribution in the reaction region for different fuel jet velocities. The figure shows that hydrogen-rich fuel was injected from the ring nozzle and burned around the main jet, creating a high-temperature zone that expanded outward in the direction of the blast. This occurred because as the distance from the blast increased, low-velocity gas surrounding the jet was drawn in, enhancing convective heat transfer and continuously transferring heat to the surrounding regions. Simultaneously, as the fuel jet velocity increased, the ignition points for hydrogen-rich fuel combustion shifted continuously in the direction of the blast, extending the high-temperature region further into that direction. On one hand, the increase in fuel jet velocity increased the total amount of hydrogen-rich fuel in the reaction region, resulting in a longer flame length. This combustion flame helped disrupt the entrainment vortex, which reduced the ambient gas density and minimized gas entrainment. On the other hand, as a high-temperature shrouding gas, the combustion flue gas lowered turbulent viscosity and prolonged jet flow within the turbulent mixing region.
To investigate the quantitative relationship between the fuel jet velocity and the reaction region temperature, Figure 7a presents the temperature profile along the tuyere centerline as a function of distance from the blast. As shown, the temperature increase accelerated significantly after 1.6 m from the tuyere inlet. Higher fuel jet velocities resulted in a more rapid temperature rise along the tuyere centerline. Doubling the fuel jet velocity increased the temperature by 16% at a distance of 2.6 m from the tuyere inlet. Figure 7b shows the quantitative relationship between fuel jet velocity and the mean temperature within the reaction region. As fuel jet velocity rose, the mean temperature gradually increased. Doubling the gas velocity led to a 4.12% increase in the average temperature within the reaction region.

3.4. Gas Species

The distribution of components during gas combustion is critical for characterizing combustion behavior. Figure 8 shows the quantitative relationship between the length of the high CO2 concentration zone and the velocity of the shrouding gas, with the insets displaying the spatial distribution of CO2 concentration. As indicated, the higher shrouding gas velocities extended the region with high CO2 concentration within the reaction region. Here, a region with a high concentration of a component was defined by its contour at the maximum concentration value. Notably, there was a linear relationship between the shrouding gas velocity and the length of the high CO2 concentration region. For every doubling of the shrouding gas velocity, the length of this region increased by a factor of one. The inset also shows that CO combustion occurred primarily around the jet, with CO2 concentration decreasing along the jet’s path and dispersing in all directions. This was attributed to the jet’s continuous outward velocity expansion, which pushed the flue gas outward.
To further characterize the combustion behavior of hydrogen-rich fuel, Figure 9 shows the quantitative relationship between the length of the high H2O concentration region in the reaction region and the velocity of the shrouding gas stream. The inset in Figure 9 depicts the spatial distribution of H2O concentration. Unlike CO2, the growth rate of the high H2O concentration region decreased as the shrouding gas velocity increased. This occurred because H2 combustion proceeded more rapidly than CO combustion in both axial and radial directions, jet distance increased, and the surface area between the flame and the surrounding gas expanded. Consequently, the influence of shrouding jet velocity on the hydrogen combustion rate was less pronounced compared to CO2. The inset shows that the concentration distribution of H2O mirrored that of CO2, with both converging at the end of the reaction region.

4. Conclusions

The dynamic process of hydrogen-rich fuel coherent injection was modeled using computational fluid dynamics. The effects of fuel jet velocity on the flow and combustion characteristics were studied. The jet pattern, temperature distribution, and component distribution in the reaction region were systematically analyzed and discussed. The following conclusions were drawn:
(1) As the combustion gas merged with the hot air, intense turbulence formed at the edges of the flow strands, transferring kinetic energy to the surrounding static fluid, which leads to a gradual diffusion of the jet velocity outward. Once the jet distance reached 1.8 m, the velocity of the central jet decayed sharply. Shrouding gases have a small effect on the length of the core region of the jet and a larger effect on the jet attenuation region. At the same time, twice the accompanying gas velocity extends the fusion distance of both the primary and secondary nozzles by a factor of one, resulting in an 11% increase in the center jet velocity.
(2) The hydrogen-rich fuel burned around the hot air, creating a high-temperature, low-density flame. A longer flame slowed the jet’s decay. The jet’s center temperature rose rapidly along its path, while heat was transferred radially. As the fuel jet velocity increased, the temperature in the reaction region also rose. Doubling the fuel jet velocity led to a 4.12% increase in the average temperature of the reaction region.
(3) The areas with high concentrations of CO2 and H2O produced by the combustion of hydrogen-rich fuels were primarily located at the outlet. As the jet extended, the concentrations of CO2 and H2O decreased and dispersed. The length of the high H2O concentration region was twice that of the CO2 concentration region, which was linearly related to fuel jet velocity. Furthermore, an increase in fuel jet velocity led to a slower increase in the length of the high H2O concentration region. When the fuel jet velocity doubled, both regions experienced a doubling in their lengths.

Author Contributions

Conceptualization, P.H.; methodology, J.S. and P.X.; validation, J.W.; writing—original draft preparation, P.H. and P.X.; writing—review and editing, P.X.; funding acquisition, Z.H. All authors have read and agreed to the published version of the manuscript.

Funding

The authors acknowledge the National Natural Science Foundation of China (Grant No. 51874171; 52074150; 51974154) and Educational Department of Liaoning Province (Grant No. JYTMS20230954) for the financial support of current work.

Data Availability Statement

Data will be made available on request.

Conflicts of Interest

Authors Peng Xu and Peng Han were employed by the University of Science and Technology, Liaoning, China. The remaining authors declare that the research was conducted in the absence of any commercial or financial relationships that could be construed as a potential conflict of interest.

Nomenclature

g Gravitational acceleration, m/s2
GbTurbulence kinetic energy due to buoyancy, m2/s2
GkTurbulence kinetic energy generated by the mean velocity gradient, m2/s2
HGas total enthalpy, J/kg
kTurbulence kinetic energy, m2/s2
m ˙ i Net rate of production of species i, kg/s
Mw,iMolecular weight of species i, kg/mol
PGas pressure, Pa
q Heat flux of the gas phase, W/m2
QradRadiation heat exchange between gas and particles, W
R ^ i , r Molar rate of creation/destruction of species i in reaction r, mol/s
SModulus of the mean rate of strain tensor, N/m3
v Gas velocity, m/s
YiMass fraction of the ith species
YRMass fraction of a particular reactant
YPMass fraction of any product species
Greek letters
εTurbulence kinetic energy dissipation rate, W/m3
μTurbulent viscosity, Pa·s
ρGas density, kg/m3
τ ¯ ¯ Gas stress tensor, N/m3

References

  1. Zhang, C.L.; Zhang, J.L.; Xu, R.S.; Zheng, A.Y.; Zhu, J.F.; Li, T. Numerical investigation of hydrogen-rich gas and pulverized coal injection in the raceway of a blast furnace with lower carbon emissions. Fuel 2024, 356, 129462. [Google Scholar] [CrossRef]
  2. Wang, K.; Zhang, J.L.; Zhou, H.; Ni, J.; Hu, Y.F.; Huang, J.; Li, S.; Ma, X.D.; Wu, S.L.; Kou, M.Y. Numerical study of natural gas and pulverized coal co-injection into an ironmaking blast furnace. Appl. Therm. Eng. 2023, 230, 120817. [Google Scholar] [CrossRef]
  3. Ye, S.X.; Xie, Z.Y.; Wang, Y.; Wu, W.H.; Wang, R.D.; Zhang, Y.W.; Lu, X.G. New insights into the influence of hydrogen on important parameters of blast furnace. J. Clean. Prod. 2023, 425, 139042. [Google Scholar] [CrossRef]
  4. Nishioka, K.; Ujisawa, Y.; Tonomura, S.; Ishiwata, N.; Sikstrom, P. Sustainable aspects of CO2 ultimate reduction in the steelmaking process (COURSE50 Project), Part1: Hydrogen reduction in the blast furnace. J. Sustain. Metall. 2016, 2, 200–208. [Google Scholar] [CrossRef]
  5. Quader, M.A.; Ahmed, S.; Dawal, S.Z. Present needs, progress and future trends of energy-efficient Ultra-Low Carbon Dioxide (CO2) Steelmaking (ULCOS) program. Renew. Sust. Energ. Rev. 2016, 55, 537–549. [Google Scholar] [CrossRef]
  6. Jozwiak, W.K.; Kaczmarek, E.; Maniecki, T.P.; Ignaczak, W.; Maniukiewicz, W. Reduction behavior of iron oxides in hydrogen and carbon monoxide atmospheres. Appl. Catal. A Gen. 2007, 326, 17–27. [Google Scholar] [CrossRef]
  7. Qie, Y.N.; Lyu, Q.; Liu, X.J.; Li, J.; Lan, C.; Zhang, S.; Yan, C. Effect of hydrogen addition on softening and melting reduction behaviors of ferrous burden in gas-injection blast furnace. Metall. Mater. Trans. B 2018, 49, 2622–2632. [Google Scholar] [CrossRef]
  8. Park, T.J.; Lee, J.H.; Kim, D.G.; Kim, H. Estimation of the H2 gas utilization ratio using a BF shaft inner reaction simulator. Metall. Mater. Trans. B 2020, 51, 417–421. [Google Scholar] [CrossRef]
  9. Zhang, C.L.; Zhang, J.L.; Zheng, A.Y.; Xu, R.S.; Jia, G.L.; Zhu, J.F. Effects of hydrogen-rich fuel injection on the states of the raceway in blast furnace. Energy 2023, 274, 127237. [Google Scholar] [CrossRef]
  10. Zhang, C.L.; Vladislav, L.; Xu, R.S.; Sergey, G.; Jiao, K.X.; Zhang, J.L.; Li, T.; Aleksei, T.; Wang, C.; Wang, G.W. Blast furnace hydrogen-rich metallurgy-research on efficiency injection of natural gas and pulverized coal. Fuel 2022, 311, 122412. [Google Scholar] [CrossRef]
  11. Liu, Y.R.; Hu, Z.J.; Shen, Y.S. CFD study of hydrogen injection in blast furnaces: Tuyere co-injection of hydrogen and coal. Metall. Mater. Trans. B 2021, 52, 2021–2971. [Google Scholar] [CrossRef]
  12. Yu, X.B.; Hu, Z.J.; Shen, Y.S. Modeling of hydrogen shaft injection in ironmaking blast furnaces. Fuel 2021, 302, 121092. [Google Scholar] [CrossRef]
  13. Feng, C.; Liu, F.; Zhu, R.; Dong, K.; Wei, G.; Tao, X. Computational investigation of coherent jet behavior generated by H2 shrouding flow. Metall. Mater. Trans. B 2023, 55, 600–611. [Google Scholar] [CrossRef]
  14. Hnaien, N.; Mondal, T.; Ajmi, M.; Aich, W.; Ayadi, B.; Kolsi, L. A CFD modelling on effects of ejection angle of a co-flow on the thermal characteristics for a combined wall and offset jet flow. Alex. Eng. J. 2023, 68, 83–91. [Google Scholar] [CrossRef]
  15. Chen, Y.C.; Luo, Q.X.; Ryan, S.; Busa, N.; Silaen, A.K.; Zhou, C.Q. Effect of coherent jet burner on scrap melting in electric arc furnace. Appl. Therm. Eng. 2022, 212, 118596. [Google Scholar] [CrossRef]
  16. Hnaien, N.; Mondal, T.; Ajmi, M.; Marzouk, S.; Aich, W.; Kolsi, L. Numerical study on mean flow characteristics for a combined turbulent wall and offset jets with a parallel co-flow. J. Taibah Univ. Sci. 2022, 16, 732–748. [Google Scholar] [CrossRef]
  17. Tang, G.W.; Chen, Y.C.; Silaen, A.K.; Krotov, Y.; Riley, M.F.; Zhou, C.Q. Effects of fuel input on coherent jet length at various ambient temperatures. Appl. Therm. Eng. 2019, 153, 513–523. [Google Scholar] [CrossRef]
  18. Ali, N.B.; Basem, A.; Ghodratallah, P.; Singh, P.K.; Jasim, D.J.; Falih, T.K.; Ahmed, M.; Eladeb, A.; Kolsi, L.; El-Shafay, A.S. Computational study of the coaxial air and fuel jet through a 3-lobe strut injector for efficient fuel mixing in a supersonic combustion chamber. Energy 2024, 311, 133276. [Google Scholar]
  19. Anderson, T.B.; Jackson, R. A fluid mechanical description of fluidized beds, Equations of Motion. Ind. Eng. Chem. Fund. 1967, 6, 527–539. [Google Scholar] [CrossRef]
  20. Gunn, D.J. Transfer of heat or mass to particles in fixed and fluidized beds. Int. J. Heat Mass Transf. 1978, 21, 467–476. [Google Scholar] [CrossRef]
Figure 1. Schematic presentation of (a) coherent tuyere and (b) its geometry details with mesh division.
Processes 12 02441 g001
Figure 2. Comparisons of velocities along the tuyere axial direction (a) for different grid configurations and (b) between the present study and other relevant research [17,19].
Processes 12 02441 g002
Figure 3. Mean velocity distribution in the reaction region with different co-flow velocities.
Processes 12 02441 g003
Figure 4. (a) The comparison of mean velocity along the central line of the tuyere for different fuel jet velocities and (b) radial velocity distribution at a distance of 2 m from the tuyere for different fuel jet velocities.
Processes 12 02441 g004
Figure 5. (a) Streamlines pattern; (b) co-flow offset distance; and (c) fusion distance for different fuel jet velocities.
Processes 12 02441 g005
Figure 6. Temperature distribution with different fuel jet velocities.
Processes 12 02441 g006
Figure 7. (a) The Comparison of temperature along the tuyere central line at different fuel jet velocities and (b) the average velocity of the reaction region at different fuel jet velocities.
Processes 12 02441 g007
Figure 8. The length of high CO2 concentration region at different fuel jet velocities.
Processes 12 02441 g008
Figure 9. The length of high H2O concentration region at different fuel jet velocities.
Processes 12 02441 g009
Table 1. Operating parameters used during simulations in the present study.
ParametersValues
Working volume (m3)3200
Tuyere number32
Productivity (tHM/m3·day)2.5
Blast (m3/min)5100
Blast temperature (K)1473
Oxygen enrichment rate (%)9
Hydrogen-rich fuel (m3/tHM)70, 80, 90, 100, 110, 120
Hydrogen-rich gas temperature (K)1473
Table 2. The average gas composition of the hydrogen-rich fuel.
H2 (%)CO (%)N2 (%)CO2 (%)
7028.530.471
Disclaimer/Publisher’s Note: The statements, opinions and data contained in all publications are solely those of the individual author(s) and contributor(s) and not of MDPI and/or the editor(s). MDPI and/or the editor(s) disclaim responsibility for any injury to people or property resulting from any ideas, methods, instructions or products referred to in the content.

