Abstract
The property changes of low-permeability oil reservoirs after long-term water flooding remain insufficiently understood. This study conducted water flooding experiments on three real core samples and employed scanning electron microscopy (SEM), X-ray diffraction (XRD), and nuclear magnetic resonance (NMR) to analyze how the changes in mineral and pore structure relate to permeability changes before and after water flooding. The results showed that the core permeability decreased significantly after water flooding, with a decrease rate of 69.7%, 19.6%, and 34.4% for the three cores. The well test results of the block also indicate that the reservoir permeability decreases after long-term water injection, with an average decrease of over 60%. The clay mineral content decreased notably, with the largest decrease of 8.6 percentage points in kaolinite and minor decreases in chlorite and illite. SEM results also indicated erosion and damage to the clay mineral structure by the water flow, and kaolinite has a high degree of dissolution. The NMR results showed that after water flooding, the pore size curve shifted to the left, the relaxation time decreased, the number of small pores in the cores increased, and the number of large pores decreased. The median pore radius decreased by 3.4% to 21.53%.
1. Introduction
Water flooding is commonly employed in oilfield development. However, the reservoir property changes during water flooding often hinder the long-term development and stability of oilfields [1,2]. After years of water injection development, many oilfields commonly face serious issues such as rapid production decline, increased water cuts, and ineffective water injection cycles. Water injection can induce physical and chemical changes in reservoir rocks, such as water sensitivity [3]. Tan et al. [4] concluded that increasing flow velocity can cause formation damage due to mineral dissolution and precipitation, swelling and dispersion, fine detachment and migration, and mineral deformation and creep. Zhou et al. [5] performed SEM and XRD experiments on waterflooded cores and reported that illite, chlorite, and illite/smectite mostly decrease and that kaolinite migration will block the pore throats after water flooding. Zhang et al. [6] indicated that water adsorption makes interlaminar swelling of clay particles active, resulting in a decrease in stiffness values. Ahmadi et al. [7] considered that water with different salinities will bring different wetting environments. Li et al. [8] employed core flooding and NMR experiments to quantitatively determine formation damage caused by water sensitivity. Relative permeability is the key parameter for understanding the liquid mobility influenced by water flooding [9]. Ligeiro et al. [10] proposed a methodology to predict the effects of formation damage on relative permeability. Kim et al. [11] showed that the moving range of the relative permeability curve was proportional to the kaolinite content. Combining core flooding experiments with techniques such as nuclear magnetic resonance (NMR) and scanning electron microscopy (SEM) proves effective for studying the reservoir property changes due to water flooding.
Clarifying the underlying patterns of reservoir property changes after water flooding is crucial for developing effective strategies for water-flooded oil reservoirs. From a research standpoint, the mineral composition of rocks and the structure of the pore space are the two primary factors influencing changes in reservoir properties. Over prolonged periods of water flooding, clay minerals that fill the pore spaces or are deposited on the surface of rock particles may be eroded and removed [12]. Additionally, the structural integrity of framework minerals such as quartz and calcite can be compromised. These minerals are then transported by the fluid, with some being carried out of the reservoir along with produced fluids, while others block small pore throats or cause blockages in larger pores through bridging actions. This leads to a redistribution of the pore space, changes in pore size, and, consequently, alterations in reservoir properties.
In terms of research methods, the combination of nuclear magnetic resonance (NMR) [13,14], scanning electron microscopy (SEM) [15,16], and X-ray diffraction (XRD) [17,18] with core displacement experiments offers an effective approach to studying the properties of water-flooded reservoirs. NMR, as a non-destructive analytical method, provides valuable insights into pore size distribution and connectivity in core samples [19]. SEM delivers high-resolution images of rock microstructures, enabling a detailed analysis of pore structure, mineral composition, and pore-filling materials. XRD identifies mineral types and quantifies their content in core samples, facilitating the study of how changes in clay minerals affect core permeability.
As the focus of oil extraction shifts towards low-permeability reservoirs, research on their property changes after water flooding is crucial for ensuring efficient oil recovery. Low-permeability oil reservoirs typically exhibit high heterogeneity in pore structure, permeability, and mineral composition, with complex spatial variation patterns [20,21,22]. This comprehensive experimental study focuses on the property changes of real core samples before and after long-term water flooding. SEM, XRD, and NMR were employed to analyze the mineral composition, microstructure, and pore characteristics of the core samples, and indoor core flooding experiments were conducted to study the changes in oil flow characteristics. Field well test data are also considered to analyze how minerals and core properties change at different positions before and after water flooding, clarifying the reasons for permeability changes after long-term water injection.
2. Experimental
2.1. Equipment and Materials
The core flooding experiment was conducted using a multi-phase, multi-porous medium-flow device. Mineral analysis was conducted using an Ultima IV X-ray diffractometer (Rigaku Corporation, Tokyo, Japan) following the SY/T 5163-2018 standard [23]. SEM was performed using a JSM-5500LV scanning electron microscope (JEOL Ltd., Tokyo, Japan), and NMR testing was conducted using a MesoMR3-060H-I nuclear magnetic resonance instrument from the Newmai Company, Suzhou, China.
Simulated formation water was prepared using NaCl and KCl with a mineralization degree of 31,367.7 mg/L. The core parameters and initial clay content in the experiment are shown in Table 1 and Table 2.

Table 1.
Core parameters.
Table 2.
Initial clay contents of the cores.
2.2. Experimental Methods
2.2.1. Measurement of Porosity and Permeability
The PoroPDP-200 overburden porosity and permeability measuring instrument (Core Lab, Houston, TX, USA) was used to measure porosity and permeability.
In accordance with the core analysis method (GB/T 29172-2012) [24,25,26], nitrogen gas of 99.999% purity was selected as the working medium for the test. Porosity measurements were conducted in accordance with Boyle’s law. The dried standard rock samples were placed within the apparatus, and a pressure of 200 psi was applied, thereby enabling the nitrogen to fill the pore space of the rock samples and the intermediate container. Once the nitrogen had diffused into the pores of the rock samples, the pressure data were recorded before and after equilibrium in order to determine the pore volume of the rock samples.
Permeability measurements were obtained through the utilization of a non-stationary methodology, specifically the pressure pulse decay method. In this method, the control module initiates the application of a pore pressure to the core, which is then subjected to a differential pressure pulse. The pressure is transmitted instantaneously through the core, and the computer data acquisition system records the pressure difference between the two ends of the core, the downstream pressure, and other relevant data. The time-dependent data are then plotted on the computer screen as logarithmic curves of the differential pressure and the average pressure versus time. The software then performs a linear regression of the pressure and time data, thereby calculating the permeability. The resulting measurement results are stored in a data file. The use of a small differential pressure serves to reduce the effect of non-Darcy flow regimes. Furthermore, varying the pore pressure for multi-point measurements allows the calculation of Kjeldahl permeability using conventional methods.
2.2.2. Scanning Electron Microscopy Observation
In accordance with the rock sample scanning electron microscope analysis method (SY/T 5162-2021) [25,27,28], the cleaned and dried rock samples were sliced into small cubes of 1 cm. Following this, the samples were then gradually transitioned from coarse (about 800 mesh) to fine sandpaper (2000 mesh) until the visual surface was smooth. The rock samples were then placed into an argon ion polishing instrument, where the smooth surfaces were further polished with an oil-based polishing fluid. Afterward, the rock samples were baked at 60 °C for 4 h, cooled to room temperature, and gold-plated. The samples were finally observed and analyzed using a JSM-5500LV scanning electron microscope (JEOL, Tokyo, Japan).
2.2.3. X-Ray Diffraction of Whole Rocks and X-Ray Diffraction of Clay Analysis
In accordance with the X-ray diffraction analysis method for clay minerals and non-clay minerals in sedimentary rocks (SY/T 5163-2018) [23,25,29], the rock samples were subjected to a drying process at a temperature of 60 °C for a period of 4 h, after which they were cooled to room temperature. Subsequently, the rock samples were subjected to thorough grinding in an agate mortar until all particles were reduced to a size of less than 40 microns, or until no grains could be discerned when rubbed with the fingers. Subsequently, the ground powder rock samples were positioned within the groove of the glass rock sample holder and uniformly compacted with a glass slide. The surface of the rock sample was observed to be smooth and flat, lying in a horizontal plane that was parallel to that of the edge of the rock sample holder. The mineralogical composition of the entire rock samples was determined using an Ultima IV X-ray diffractometer (Rigaku, Osaka, Japan).
The rock samples were pulverized to a particle size of 1 mm. A 6 g quantity of the powdered rock sample was transferred to a 200 mL beaker, and the rock solution was subjected to processing with an ultrasonic crusher. In the event that clay particles were present in the solution, approximately 50 mL of the clay solution was extracted with a syringe and transferred to a centrifuge tube. The solution was then subjected to centrifugation at a speed of 3000 rpm for a period of 30 min. In the event that clay particles were not present in the solution, an appropriate quantity of hydrogen peroxide was added to remove the carbonate and a small amount of organic matter until the solution ceased to bubble and no oil slicks were formed. The solution was then repeatedly washed until it became suspended, extracted, and centrifuged. Subsequently, the clay particles obtained after centrifugation were smeared onto glass slides with a pipette. After they were allowed to dry naturally, a uniform and smooth sheet of natural clay was produced, and the clay mineral content was tested using an Ultima IV X-ray diffractometer (Rigaku, Osaka, Japan).
2.2.4. NMR T2 Spectrum Test and Pore Size Analysis
During the core flooding experiments, a MesoMR23-060H-I nuclear magnetic resonance instrument (Newmai, Suzhou, China) was used to measure the NMR T2 spectrum. The magnetic field intensity of the permanent magnet was 0.5 ± 0.08 T, with a main frequency of 21.3 MHz, and a CPMG sequence was selected [30]. The echo time was 0.1 ms; the waiting time was 9000 ms; the number of echoes was 5000. Accurate characterization of fluid signals in pores with pore sizes ranging from 2 nm to 1 mm can be achieved.
The value of the T2 spectrum of the hydrogen nucleus signal is dependent upon the relaxation time and was obtained through NMR spectroscopy. The fluid within the larger pores is less affected by the force exerted by the solid surface, the relaxation speed is slower, and the T2 value is larger. Conversely, the force exerted by the solid surface is larger within the smaller pores, the relaxation speed is faster, and the T2 value is smaller. In particular, the correlation between the T2 value and pore size is illustrated by the following equation:
where T2 is the relaxation time (ms), ρ is the surface relaxation rate (μm⋅s−1), S is the surface area of the pore (μm2), and V is the volume of the pore (μm3).
The surface relaxation rate (ρ) can be obtained by combining the core mercury injection experiment with Equation (1), which allows the calculation of the pore size corresponding to a specific T2. The ρ of tight cores with different permeability values is given in Table 3.
Table 3.
The surface relaxation rate of cores with different permeability values.
2.2.5. Core Flooding
(1) Two cores with similar properties were spliced for each experiment. A 2 cm sample of one core was collected for SEM and XRD whole-rock and clay analysis before the experiment.
(2) The core was evacuated and saturated with water. The permeability was measured and recorded.
(3) After water saturation, NMR was performed on the core to determine the T2 spectrum before displacement.
(4) The core was placed in a core holder, the confining pressure was set to 6 MPa, and the outlet pressure was set to atmospheric. If the injection pressure increased, the confining pressure was also increased to remain 2 MPa higher than the former. The displacement water was injected at a constant 0.3 mL/min rate, and the injection pressure of the core at different pore volumes (PVs) was recorded. Water flooding stopped when the pressure stabilized (or after 500 PVs of displacement), and the permeability was calculated using Darcy’s Law.
where K represents the core permeability (mD), Q represents the production rate (mL/min), μ represents the viscosity of water (mPa·s), L represents the core length (cm), and Δp represents the pressure difference (MPa).
(5) After displacement, the core was subjected to NMR, SEM, and XRD whole-rock and clay analysis, and the results were compared with those from before the experiment.
3. Results and Discussion
3.1. Characteristics of Permeability Changes During Long-Term Water Injection
Permeability is a key parameter that characterizes the pore structure and fluid flow capacity of a reservoir. Figure 1 shows the pressure difference of the three experiments during water flooding. The differential pressure demonstrates a gradual increase in concert with the injection volume. The injection rate was maintained at a constant level throughout the experimental procedure; thus, the observed pressure rise can be attributed to a reduction in permeability. The experimental results indicate that the pressure rise in core 1# is the most pronounced, followed by cores 2# and 3#. Figure 2 shows the permeability changes of the three cores during water flooding. After long-term water flooding, the permeability of the three cores generally decreased. However, the permeability increases were temporary after the first few PVs. After four PVs, that of core 1# increased to 1.3 times the initial value, eventually decreasing by 69.7% with more PVs. After 24 PVs, the permeability of core 2# increased to 2.8 times the initial value, eventually decreasing by 19.6% with more PVs. After 12 PVs, that of core 3# increased to 1.3 times the initial permeability, eventually decreasing by 34.4% with more PVs. In the early stages of water flooding, permeability may initially increase due to pressure and flushing effects creating favorable flow channels [31]. However, as water injection continues, the impact of mineral changes becomes significant, leading to a decrease in permeability. Over time, changes in pore structure stabilize, as indicated by the reduced slope of the permeability decline curve.
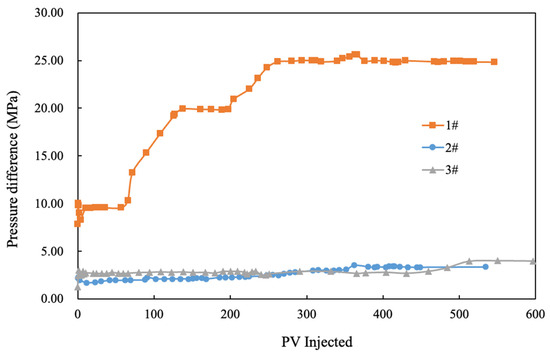
Figure 1.
Pressure difference during water flooding.
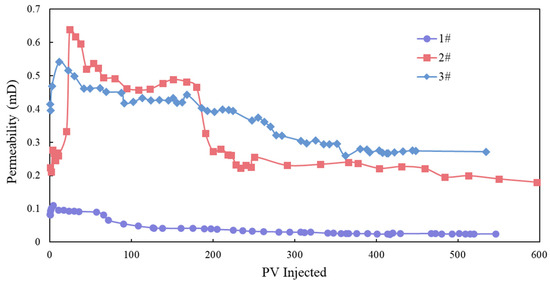
Figure 2.
Core permeability changes during water flooding.
The block was re-evaluated through well testing, revealing significant reductions in permeability after prolonged water injection, consistent with previous experimental results. Figure 3 illustrates the permeability interpretation results for each test well over time. As the duration of water injection increased, a general decline in reservoir permeability was observed. Specifically, permeability decreased by 85%, 66.1%, 63.1%, and 31.7% in wells bT14007, 1444, T82043, and T82079, respectively. Following extended water injection, multiple areas within the block have experienced significant deterioration in reservoir properties, with severe reductions in permeability. Future development adjustments must take into account the historical impact of water flooding.
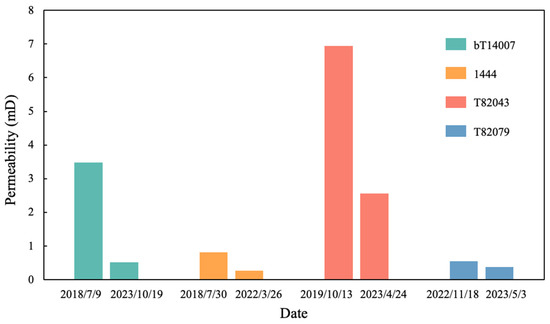
Figure 3.
The interpreted permeability of each test well at different times.
3.2. Characteristics of Clay Mineral Content Changes During Long-Term Water Injection
Clay mineral changes are a significant factor contributing to alterations in the pore structure and properties of rocks. Figure 4 shows the clay contents of the three cores before and after water flooding based on X-ray diffraction (XRD). The total amount of clay minerals in the core decreased after long-term water flooding. The long-term water flooding continuously eroded various clays and destroyed their original structures. As a result, the clays detached and migrated, leading to decreased contents. Therefore, the permeability increased in the early water flooding stage, which was temporary. As water flooding continued, the clays migrated further, absorbing water and swelling during migration [32]. As a result, pore throats were blocked, leading to degraded rock properties. Kaolinite, chlorite, and illite easily detached and migrated under the shear action of the flow, with kaolinite exhibiting the largest content decrease. As shown in Figure 4c,d, the kaolinite contents in cores 2# and 3# decrease by 8.6 and 6.6 percentage points on average, respectively. In addition to erosion by the flow, illite is prone to degradation during water injection, further decreasing the illite content. Specifically, the illite content in cores 1#, 2#, and 3# decreased by 0.4, 0.3, and 0.2 percentage points on average, respectively. Due to strong water sensitivity, degraded illite absorbs water and expands [33]. As it breaks under the shear action of the flow, the particles migrate and block the pore throats.
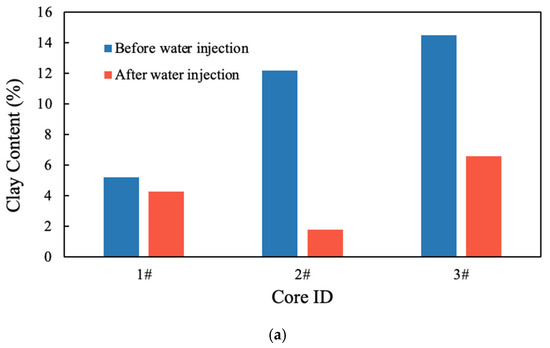
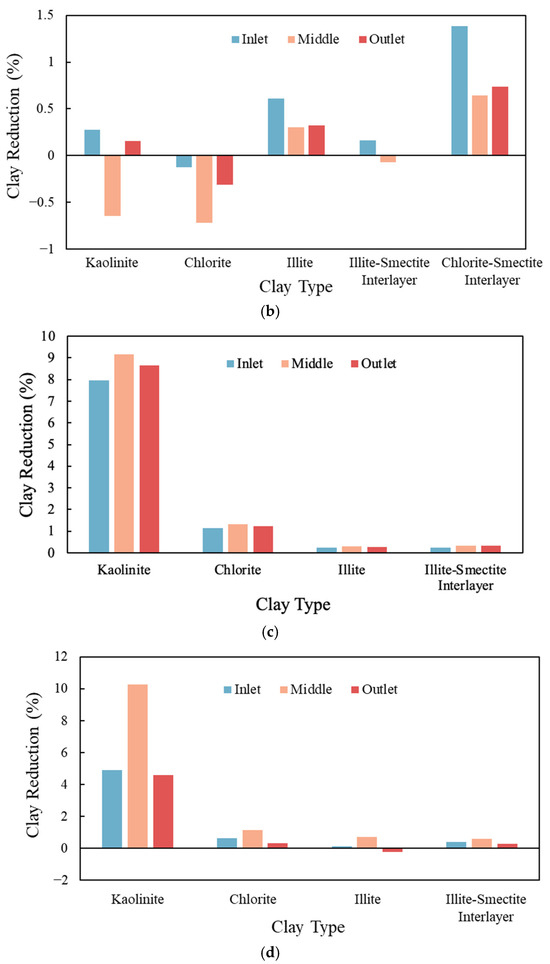
Figure 4.
Clay contents of the rock cores based on XRD. (a) Total clay of the core before and after water flooding; (b) inlet, middle, and outlet clay changes in core 1#; (c) inlet, middle, and outlet clay changes in core 2#; (d) inlet, middle, and outlet clay changes of core 3#.
Figure 5 illustrates the electron microscope scanning results of the core before and after water injection. Under the scanning electron microscope, kaolinite filled the pores in a book-page-like structure, while illite appeared filamentous and soda feldspar had the appearance of plate columns (Figure 5). This demonstrates a change in the clay cover on the surface of the borehole, indicating that the clay on the surface of the borehole is subjected to prolonged water flooding, resulting in the dissolution and erosion of kaolinite to a greater extent. Prior to water injection in core 1#, flaky kaolinite aggregates form clumps, exhibiting inter-crystalline and dissolution micropores. Following the injection of water, the clay crystals are filled with residual dissolution pores and intergranular pores. Prior to the injection of water in core 2#, lamellar kaolinite aggregates were observed to be filled between clastic particles and in intergranular pores, with visible intergranular pore seams. Following the injection of water, the worm-like kaolinite aggregate is filled in intergranular pores, the flake-like kaolinite is filled in quartz secondary intergranular pores, and the kaolinite aggregate is dissolved. Prior to the injection of water in core 3#, the flake-like kaolinite aggregate is filled in the intergranular pores between the clastic particles and intergranular pores, which are interspersed with secondary sodium feldspar crystals. Following the injection of water, the worm-like kaolinite aggregate is observed to be filled in the intergranular pore space, while the lamellar kaolinite aggregate is also filled in this space. Additionally, the kaolinite aggregate is seen to be partially dissolved.
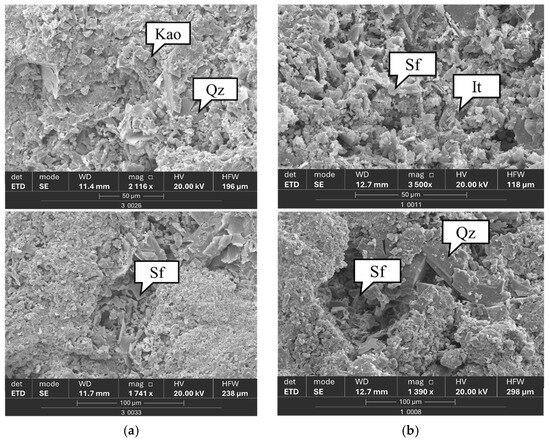
Figure 5.
SEM images of rock cores before and after water flooding. Kaolinite (Kao), quartz enlargement (Qz), sodium feldspar (Sf), illite (It). (a) Before water injection (1#), (b) after water injection (1#), (c) before water injection (2#), (d) after water injection (2#), (e) before water injection (3#), (f) after water injection (3#).
3.3. Characteristics of Pore Structure Changes During Long-Term Water Injection
The changes in the pore size distribution of the core before and after water flooding are analyzed based on NMR data, as shown in Figure 6.
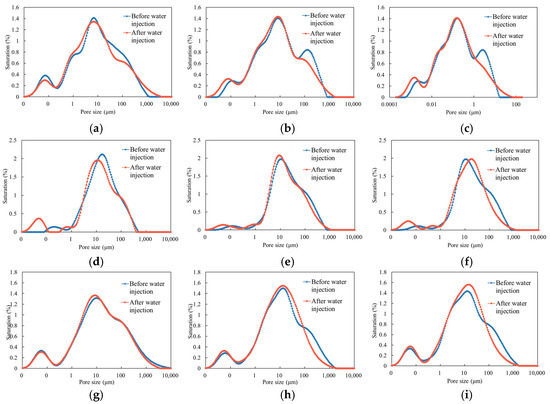
Figure 6.
Pore size of the cores before and after water flooding. (a) Core 1# inlet, (b) core 1# middle, (c) core 1# outlet, (d) core 2# inlet (e) core 2# middle (f) core 3# outlet, (g) core 3# inlet (h) core 3# middle (i) core 3# outlet.
Figure 6a–c show that the pore size curves of the core inlet, middle, and outlet shift to the left, and the main peak decreases. The pore size curves of the middle and outlet were in a three-peak state before water flooding. After water flooding, the left peak shifted to the left and increased, and the right peak significantly decreased. Therefore, the number of small pores increased after water flooding while large pores decreased. Figure 6d–f illustrate that the pore size curve of core 2# is single-peaked before water flooding. After water flooding, the left peak of the curve rose, with an increase in pores below 0.3 μm, and the right side of the main peak decreased. The main peak on the right side of the pore size curve of core 3# significantly decreased after water flooding, and the main peak slightly increased.
These results indicate that long-term water flooding caused pore size redistribution in the core, with an overall decreasing trend. From the observed changes, it is evident that all three core samples exhibit a left shift and increased height of the pore size curve peak, indicating an increase in small pores. Additionally, the reduction in the curve on the right side of the main peak suggests a decrease in large pores. The broadening of the pore size curve and the increase in maximum relaxation time reflect an increased heterogeneity in pore size distribution. As shown in Table 4, the median pore sizes of cores 1#, 2#, and 3# decreased by 9.94% to 18.81%, 12.96% to 21.53%, and 3.4% to 13.0%, respectively.
Table 4.
Median pore sizes of the cores.
4. Conclusions
This study employed a comprehensive approach using core water flooding experiments, nuclear magnetic resonance (NMR), X-ray diffraction (XRD), and scanning electron microscopy (SEM) to analyze the relationship between core permeability changes, mineral content, and pore structure before and after long-term water flooding. This research clarifies the reasons for permeability changes induced by water flooding. Based on the experimental results, the following conclusions have been drawn: (1) The water flooding experiments indicate that the core permeability significantly decreased by up to 69.7% after long-term water injection. The permeability of the three core samples decreased by 69.7%, 19.6%, and 34.4%, respectively. The field well test data also suggest that with long-term water injection, the reservoir permeability presents a decreasing trend, with an average decrease of over 60%. (2) Clay mineral analysis shows that the total amount of clay minerals in the core decreased after long-term water flooding. Specifically, the kaolinite content decreased the most, by 8.6 percentage points, with slight decreases in chlorite and illite. The SEM results indicate that the water flow eroded and washed away the clay minerals, causing severe structural damage to kaolinite. (3) The NMR results show that the pore size curve of the core shifts to the left, and the left peak increases after water flooding; the relaxation time decreases, the number of small pores increases, and the median pore radius decreases by 3.4% to 21.53%. The width of pore distribution increases, and the non-uniformity of pores is enhanced.
The results of each method are mutually consistent and can provide a comprehensive explanation of the changes in core physical properties. However, the research object of this study is low-permeability rock cores, and its results may not explain the physical property changes of all types of rock cores. In the future, the types of reservoirs studied will be expanded.
Author Contributions
Conceptualization, L.L.; Methodology, C.X.; Validation, S.C. and W.B.; Investigation, X.Y.; Writing—original draft, H.L.; Writing—review & editing, Y.C. All authors have read and agreed to the published version of the manuscript.
Funding
This research received no external funding.
Data Availability Statement
Data are contained within the article.
Conflicts of Interest
Authors Lili Lin, Chongjun Xu, Haifeng Lyu, Yuping Chen and Shuping Cong were employed by the company PetroChina Xinjiang Oilfield Company. The remaining authors declare that the research was conducted in the absence of any commercial or financial relationships that could be construed as a potential conflict of interest. All authors have read and agreed to the published version of the manuscript.
References
- Mokhtari, R.; Anabaraonye, B.U.; Afrough, A.; Mohammadkhani, S.; Feilberg, K.L. Experimental investigation of low salinity water-flooding in tight chalk oil reservoirs. J. Pet. Sci. Eng. 2022, 208, 109282. [Google Scholar] [CrossRef]
- Yang, R.; Zhang, J.; Chen, H.; Jiang, R.; Sun, Z.; Rui, Z. The injectivity variation prediction model for water flooding oilfields sustainable development. Energy 2019, 189, 116317. [Google Scholar] [CrossRef]
- Jin, L.; Liu, Y.; Gao, J.; Hao, Z. Quantitative Interpretation of Water Sensitivity Based on Well Log Data: A Case of a Conglomerate Reservoir in the Karamay Oil Field. Lithosphere 2021, 2021, 5992165. [Google Scholar] [CrossRef]
- Tan, Q.; You, L.; Kang, Y.; Xu, C. Formation damage mechanisms in tight carbonate reservoirs: The typical illustrations in Qaidam Basin and Sichuan Basin, China. J. Nat. Gas Sci. Eng. 2021, 95, 104193. [Google Scholar] [CrossRef]
- Zhou, Y.; Yang, W.; Yin, D. Experimental investigation on reservoir damage caused by clay minerals after water injection in low permeability sandstone reservoirs. J. Pet. Explor. Prod. Technol. 2022, 12, 915–924. [Google Scholar] [CrossRef]
- Zhang, W.; Zhang, D.; Zhao, J. Experimental investigation of water sensitivity effects on microscale mechanical behavior of shale. Int. J. Rock Mech. Min. Sci. 2021, 145, 104837. [Google Scholar] [CrossRef]
- Ahmadi, Y.; Malekpour, M.; Kikhavani, T.; Bayati, B. The study of the spontaneous oil imbibition in the presence of new polymer-coated nanocomposites compatible with reservoir conditions. Pet. Sci. Technol. 2024, 42, 974–992. [Google Scholar] [CrossRef]
- Li, Y.; Jiang, G.; Li, X.; Yang, L. Quantitative investigation of water sensitivity and water locking damages on a low-permeability reservoir using the core flooding experiment and NMR test. ACS Omega 2022, 7, 4444–4456. [Google Scholar] [CrossRef]
- Hosseinzadehsadati, S.; Eftekhari, A.A.; Nick, H.M. Role of relative permeability hysteresis in modified salinity water flooding. Fuel 2022, 321, 124085. [Google Scholar] [CrossRef]
- Ligeiro, T.S.; Vaz, A.; Chequer, L. Forecasting the impact of formation damage on relative permeability during low-salinity waterflooding. J. Pet. Sci. Eng. 2022, 208, 109500. [Google Scholar] [CrossRef]
- Kim, C.; Lee, J. Experimental study on the variation of relative permeability due to clay minerals in low salinity water-flooding. J. Pet. Sci. Eng. 2017, 151, 292–304. [Google Scholar] [CrossRef]
- Si, L.; Wei, J.; Xi, Y.; Wang, H.; Wen, Z.; Li, B.; Zhang, H. The influence of long-time water intrusion on the mineral and pore structure of coal. Fuel 2021, 290, 119848. [Google Scholar] [CrossRef]
- Xie, W.; Yin, Q.; Zeng, J.; Wang, G.; Feng, C.; Zhang, P. Fractal-based approaches to pore structure investigation and water saturation prediction from NMR measurements: A case study of the gas-bearing tight sandstone reservoir in Nanpu Sag. Fractal Fract. 2023, 7, 273. [Google Scholar] [CrossRef]
- Wei, J.; Zhang, D.; Zhang, X.; Zhao, X.; Zhou, R. Experimental study on water flooding mechanism in low permeability oil reservoirs based on nuclear magnetic resonance technology. Energy 2023, 278, 127960. [Google Scholar] [CrossRef]
- Zhang, P.; Lu, S.; Li, J.; Wang, J.; Zhang, J.; Chen, G.; Huang, H.; Zhi, Q.; Yin, Y. Microscopic characteristics of pore-fracture system in lacustrine shale from Dongying Sag, Bohai Bay Basin, China: Evidence from scanning electron microscopy. Mar. Pet. Geol. 2023, 150, 106156. [Google Scholar] [CrossRef]
- Mu, C.; Hua, H.; Wang, X. Characterization of pore structure and reservoir properties of tight sandstone with CTS, SEM, and HPMI: A case study of the tight oil reservoir in fuyu oil layers of Sanzhao Sag, Songliao basin, NE China. Front. Energy Res. 2023, 10, 1053919. [Google Scholar] [CrossRef]
- Sato, A.; Obara, Y. Analysis of pore structure and water permeation property of a shale rock by means of X-ray CT. Procedia Eng. 2017, 191, 666–673. [Google Scholar] [CrossRef]
- Mukunoki, T.; Miyata, Y.; Mikami, K.; Shiota, E. X-ray CT analysis of pore structure in sand. Solid Earth 2016, 7, 929–942. [Google Scholar] [CrossRef]
- Zhao, Y.; Sun, Y.; Liu, S.; Wang, K.; Jiang, Y. Pore structure characterization of coal by NMR cryoporometry. Fuel 2017, 190, 359–369. [Google Scholar] [CrossRef]
- Li, T.; Li, M.; Jing, X.; Xiao, W.; Cui, Q. Influence mechanism of pore-scale anisotropy and pore distribution heterogeneity on permeability of porous media. Pet. Explor. Dev. 2019, 46, 594–604. [Google Scholar] [CrossRef]
- Li, L.; Shi, G.; Zhang, Y.; Liu, X. Relationship between the heterogeneity of low-permeability reservoirs and the dynamic evolution of fractures under uniaxial compression conditions by CT scanning: A case study in the jiyang depression of Bohai Bay Basin, China. Front. Earth Sci. 2023, 10, 1018561. [Google Scholar] [CrossRef]
- Ling, C.; Zhang, X.; Fu, M.; Huang, T.; Duan, G.; Gao, S. The geological controlling factors of the heterogeneity of a bioclastic limestone reservoir—A case study of the Cretaceous Kh2 layer in A oilfield, Iraq. Front. Energy Res. 2024, 11, 1296584. [Google Scholar] [CrossRef]
- SY/T 5163-2018; Oil and Gas Industry Standard of the P.R.China: Analysis Method for Clay Minerals and Ordinary Non-Clay Minerals in Sedimentary Rocks by the X-Ray Diffraction. National Energy Administration: Beijing, China, 2019.
- GB/T 29172-2012; Practices for Core Analysis. SAC: Beijing, China, 2012; (In Chinese with an English Abstract).
- Li, M.; Qu, Z.; Wang, M.; Ran, W. The influence of micro-heterogeneity on water injection development in low-permeability sandstone oil reservoirs. Minerals 2023, 13, 1533. [Google Scholar] [CrossRef]
- Pu, Y.; Li, S.; Tang, D.; Chen, S. Effect of Magmatic Intrusion on In Situ Stress Distribution in Deep Coal Measure Strata: A Case Study in Linxing Block, Eastern Margin of Ordos Basin, China. Nat. Resour. Res. 2022, 31, 2919–2942. [Google Scholar] [CrossRef]
- SY/T 5162-2021; The Petroleum Industry Standard of China—Analytical Method for Rock Samples by Scanning Electron Microscope. Petroleum Industry Press: Beijing, China, 2022; pp. 1–8.
- Wang, Y.; Zhou, S.; Liang, F.; Huang, Z.; Li, W.; Yan, W.; Guo, W. Reservoir Space Characterization of Ordovician Wulalike Formation in Northwestern Ordos Basin, China. Processes 2023, 11, 2791. [Google Scholar] [CrossRef]
- Zhang, S.; Zhao, F.; Liu, D.; Zhao, L.; Zhang, X.; Lin, J.; Dong, H.; Zhao, S.; Liu, X.; Zan, M. Modes of occurrence of critical metal elements (Li, REEs and other critical elements) in low-grade bauxite from southern shanxi province, China. Minerals 2022, 12, 990. [Google Scholar] [CrossRef]
- Zhang, R.; Jia, H. Method to Generate Random Element Equivalent Core Models Based on the NMR T2 Spectrum for Waterflooding in Tight Sandstone. ACS Omega 2021, 6, 34783–34795. [Google Scholar] [CrossRef]
- Mwakipunda, G.C.; Jia, R.; Mgimba, M.M.; Ngata, M.R.; Mmbuji, A.O.; Said, A.A.; Yu, L. A critical review on low salinity waterflooding for enhanced oil recovery: Experimental studies, simulations, and field applications. Geoenergy Sci. Eng. 2023, 227, 211936. [Google Scholar] [CrossRef]
- Mehdizad, A.; Sedaee, B.; Pourafshary, P. Visual investigation of the effect of clay-induced fluid flow diversion on oil recovery, as a low-salinity water flooding mechanism. J. Pet. Sci. Eng. 2022, 209, 109959. [Google Scholar] [CrossRef]
- Xiong, Y. Study of Reservoir Change Law After Waterflood in Glutenite Reservoir and Its Application. Master’s Thesis, Chengdu University of Technology, Chengdu, China, 2020. [Google Scholar]
Disclaimer/Publisher’s Note: The statements, opinions and data contained in all publications are solely those of the individual author(s) and contributor(s) and not of MDPI and/or the editor(s). MDPI and/or the editor(s) disclaim responsibility for any injury to people or property resulting from any ideas, methods, instructions or products referred to in the content. |
© 2024 by the authors. Licensee MDPI, Basel, Switzerland. This article is an open access article distributed under the terms and conditions of the Creative Commons Attribution (CC BY) license (https://creativecommons.org/licenses/by/4.0/).