1. Introduction
The textile and clothing industries are significant contributors to environmental degradation, consuming vast amounts of energy, water, and chemicals. These sectors surpass the combined carbon emissions of the aviation and shipping industries, highlighting their substantial environmental footprint [
1,
2]. The dyeing and finishing processes alone contribute up to 20% of industrial wastewater pollution, which severely impacts water resources [
3]. The environmental impact of textile production extends throughout the entire lifecycle of products, from raw material extraction, such as wool, which contributes significantly to greenhouse gas emissions, to the disposal stage [
4]. Given that the textile industry accounts for approximately 8–10% of global carbon emissions—exceeding those from aviation and shipping combined—the need for sustainable practices is urgent [
5,
6]. The industry’s annual water consumption is also staggering, with three trillion gallons used each year, and cotton production alone requiring 8500 L per kilogram [
7]. Addressing these impacts is crucial in the context of climate change and resource depletion.
Efforts are underway to improve sustainability in the textile industry by focusing on better water management, waste reduction, and energy efficiency [
8,
9,
10,
11,
12,
13,
14]. The growing attention within the textile, apparel, and fashion (TAF) industries toward sustainability is driven by the increasing awareness of environmental issues and alignment with the United Nations’ Sustainable Development Goals (SDGs) [
5,
6]. These industries are adopting eco-efficiency concepts and environmental practices, including sustainability reporting, to enhance resource efficiency and reduce their environmental impact. Initiatives like extending product lifecycles and embracing circular economy models are being implemented [
5,
6]. In this context, “Industry 4.0” represents a significant evolution in industrial capabilities by enhancing productivity, efficiency, artificial intelligence, and connectivity in manufacturing. This fourth industrial revolution offers transformative potential for the textile and clothing industries by integrating advanced technologies with sustainable practices. For instance, smart manufacturing processes, enabled by the Internet of Things (IoT), can monitor and optimize water and energy usage in real-time, minimizing waste and enhancing overall efficiency. Additionally, advancements in artificial intelligence can improve the accuracy of fashion trend predictions, potentially reducing garment overproduction and associated waste [
15]. Industry 4.0 is the fourth industrial revolution, marked by the integration of digital technologies into manufacturing and industrial processes. It features smart interconnected systems that can autonomously communicate and make decisions. Key components include the Internet of Things (IoT), cyber–physical systems (CPS), and big data analytics, all of which work together to enable real-time monitoring, control, and data-driven decision-making in industrial environments. Several carbon emission cost models are explored in this paper, including continuous and discontinuous carbon tax models. These models were chosen because they can adapt to different market conditions and policy environments, particularly in the textile industry, where production processes are often energy-intensive and generate high emissions. We further discussed how these models are applied in the context of the textile industry, considering the variations in carbon emission policies across different regions to ensure their applicability and validity.
2. Research Background
2.1. Introduction to Industry 4.0
Industry 4.0 represents the fourth industrial revolution, focusing on enhancing productivity, efficiency, artificial intelligence, and connectivity in manufacturing [
16,
17,
18,
19,
20]. Originating in Germany, the concept has become a global standard for industrial innovation [
21,
22]. This section will provide a concise overview of Industry 4.0, emphasizing its relevance to the textile and footwear industries without redundant historical details. The connection between Industry 4.0 and modern technological advancements is well-presented, but its historical development can be simplified to maintain conciseness.
2.2. The Relationship Between ERP, TOC, ABC, and Industry 4.0
Activity-based costing (ABC) and the theory of constraints (TOC) are critical methodologies that complement each other within the Industry 4.0 framework. ABC, introduced by Johnson and Kaplan in 1987, focuses on calculating production costs by evaluating activities, products, and services, offering more precise cost allocation than traditional methods [
21,
22]. By allocating resources to activities and assigning them to products through cost drivers, ABC improves cost management accuracy. When integrated with ERP systems and the TOC, ABC further enhances cost accuracy and operational efficiency, leading to better decision-making and resource allocation [
23,
24,
25,
26]. Research has explored how these methodologies, combined with Industry 4.0 technologies, help balance profitability and sustainability. This integration focuses on optimizing production processes, managing carbon emissions, and advancing management accounting practices to improve operational efficiency and reduce environmental impacts [
27,
28,
29]. These approaches enable businesses to achieve both financial growth and sustainability. Additionally, the TOC focuses on identifying and resolving bottlenecks in production processes to enhance overall system efficiency [
30]. The combined use of ABC and the TOC allows businesses to optimize costs and production processes, improving both financial and operational performance.
These references discuss how Industry 4.0 technologies can enhance sustainable manufacturing in relation to ERP systems, the TOC, and ABC. Blunck and Werthmann examine Industry 4.0’s role in promoting sustainability and the circular economy. De Man and Strandhagen explore how it shapes sustainable business models, while De Sousa Jabbour et al. focus on its potential to revolutionize environmentally sustainable practices. Waibel et al. highlight the positive effects of smart production systems on sustainability. When combined with ERP, the TOC, and ABC, these technologies improve resource management, cost accuracy, and operational efficiency [
31,
32,
33,
34]. However, existing studies integrating ERP, the TOC, ABC, and Industry 4.0 generally lack an in-depth exploration of real-time data analysis and a dynamic optimization of resource allocation. Moreover, many articles evaluating the impact of these systems on long-term carbon emissions management fail to adequately consider data accuracy and the complexity of system integration in practical applications. This study addresses these gaps by employing improved real-time data monitoring and optimization algorithms, offering a deeper examination of the dynamic responsiveness of these integrated systems and providing more practical solutions for application in the textile industry.
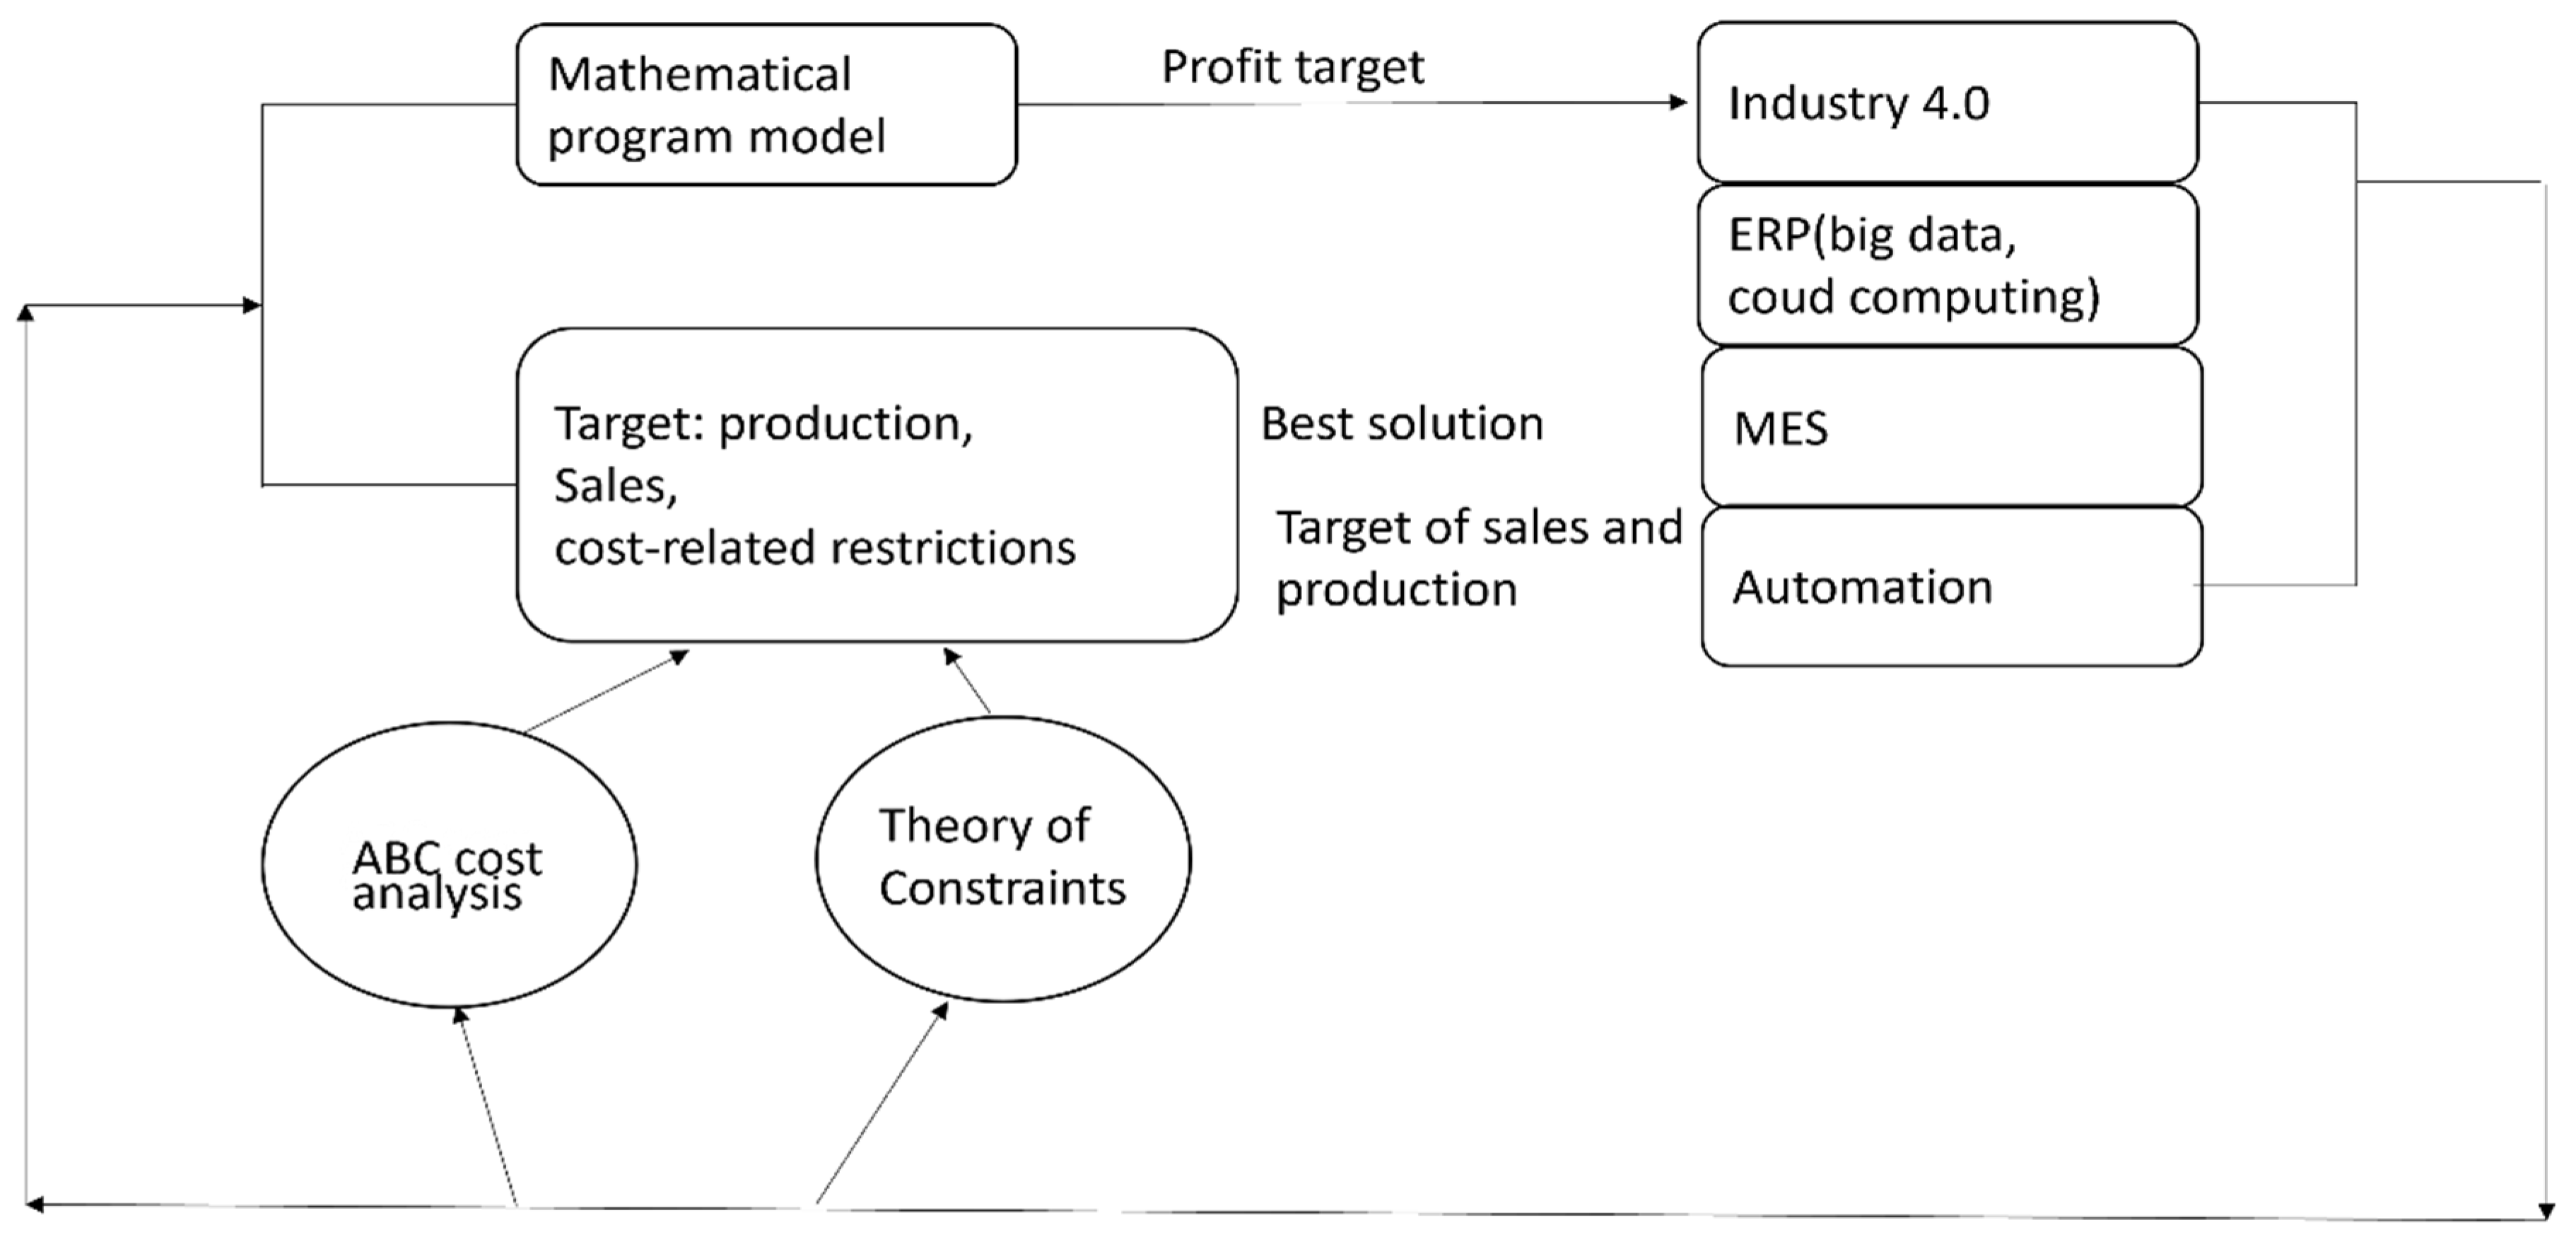
In this study, the integration of ABC and the TOC within an ERP system enables the optimization of production processes in the textile industry. Specifically, the TOC identifies constraints that hinder production efficiency, while ABC provides detailed cost information that helps allocate resources more effectively. ERP systems act as the backbone, collecting real-time data on production activities, costs, and resource utilization, facilitating continuous monitoring and adjustments [
35,
36].
Figure 1 outlines the workflow of integrating ERP, the TOC, and ABC within an Industry 4.0 framework. The diagram shows how data collected through ERP systems are used to identify production bottlenecks via the TOC and to calculate detailed costs through ABC. Industry 4.0 technologies enhance this process by enabling real-time monitoring and adjustments, ensuring the production process is both efficient and cost-effective.
2.3. Carbon Emissions, Carbon Taxes, and Carbon Rights
The discussion on carbon trading includes practical examples from China and Taiwan, adding valuable context. However, incorporating comparative studies from other industries where carbon trading has been successfully implemented would provide additional insights and strengthen the argument. Despite the absence of an established energy or carbon tax in Taiwan, the country’s energy transition policies have been actively exploring such proposals [
37,
38,
39]. The integration of the footwear industry into carbon trading schemes presents both challenges and opportunities to mitigate environmental impacts through incentivized sustainable practices [
40,
41,
42,
43,
44,
45,
46].
The implementation of carbon trading schemes in Taiwan, particularly within the footwear industry, shows significant promise. By leveraging lessons learned from other countries and industries, Taiwan can develop a robust framework for carbon trading that aligns with international standards [
38,
39]. Future research should focus on tailored strategies that address the specific challenges and opportunities within the footwear sector, fostering innovation and sustainable development.
In summary, the implementation of carbon trading schemes in Taiwan, especially within the footwear industry, holds significant potential. By drawing on the experiences of other countries and industries, Taiwan can establish a strong framework for carbon trading that meets international standards. This approach would not only enhance environmental sustainability but also position Taiwan as a leader in carbon trading in Asia. Future research should focus on developing strategies that address the unique challenges and opportunities within the footwear sector, creating an environment conducive to innovation and sustainable development.
3. Research Design and Methods
3.1. The Production Process of a Typical Textile Company
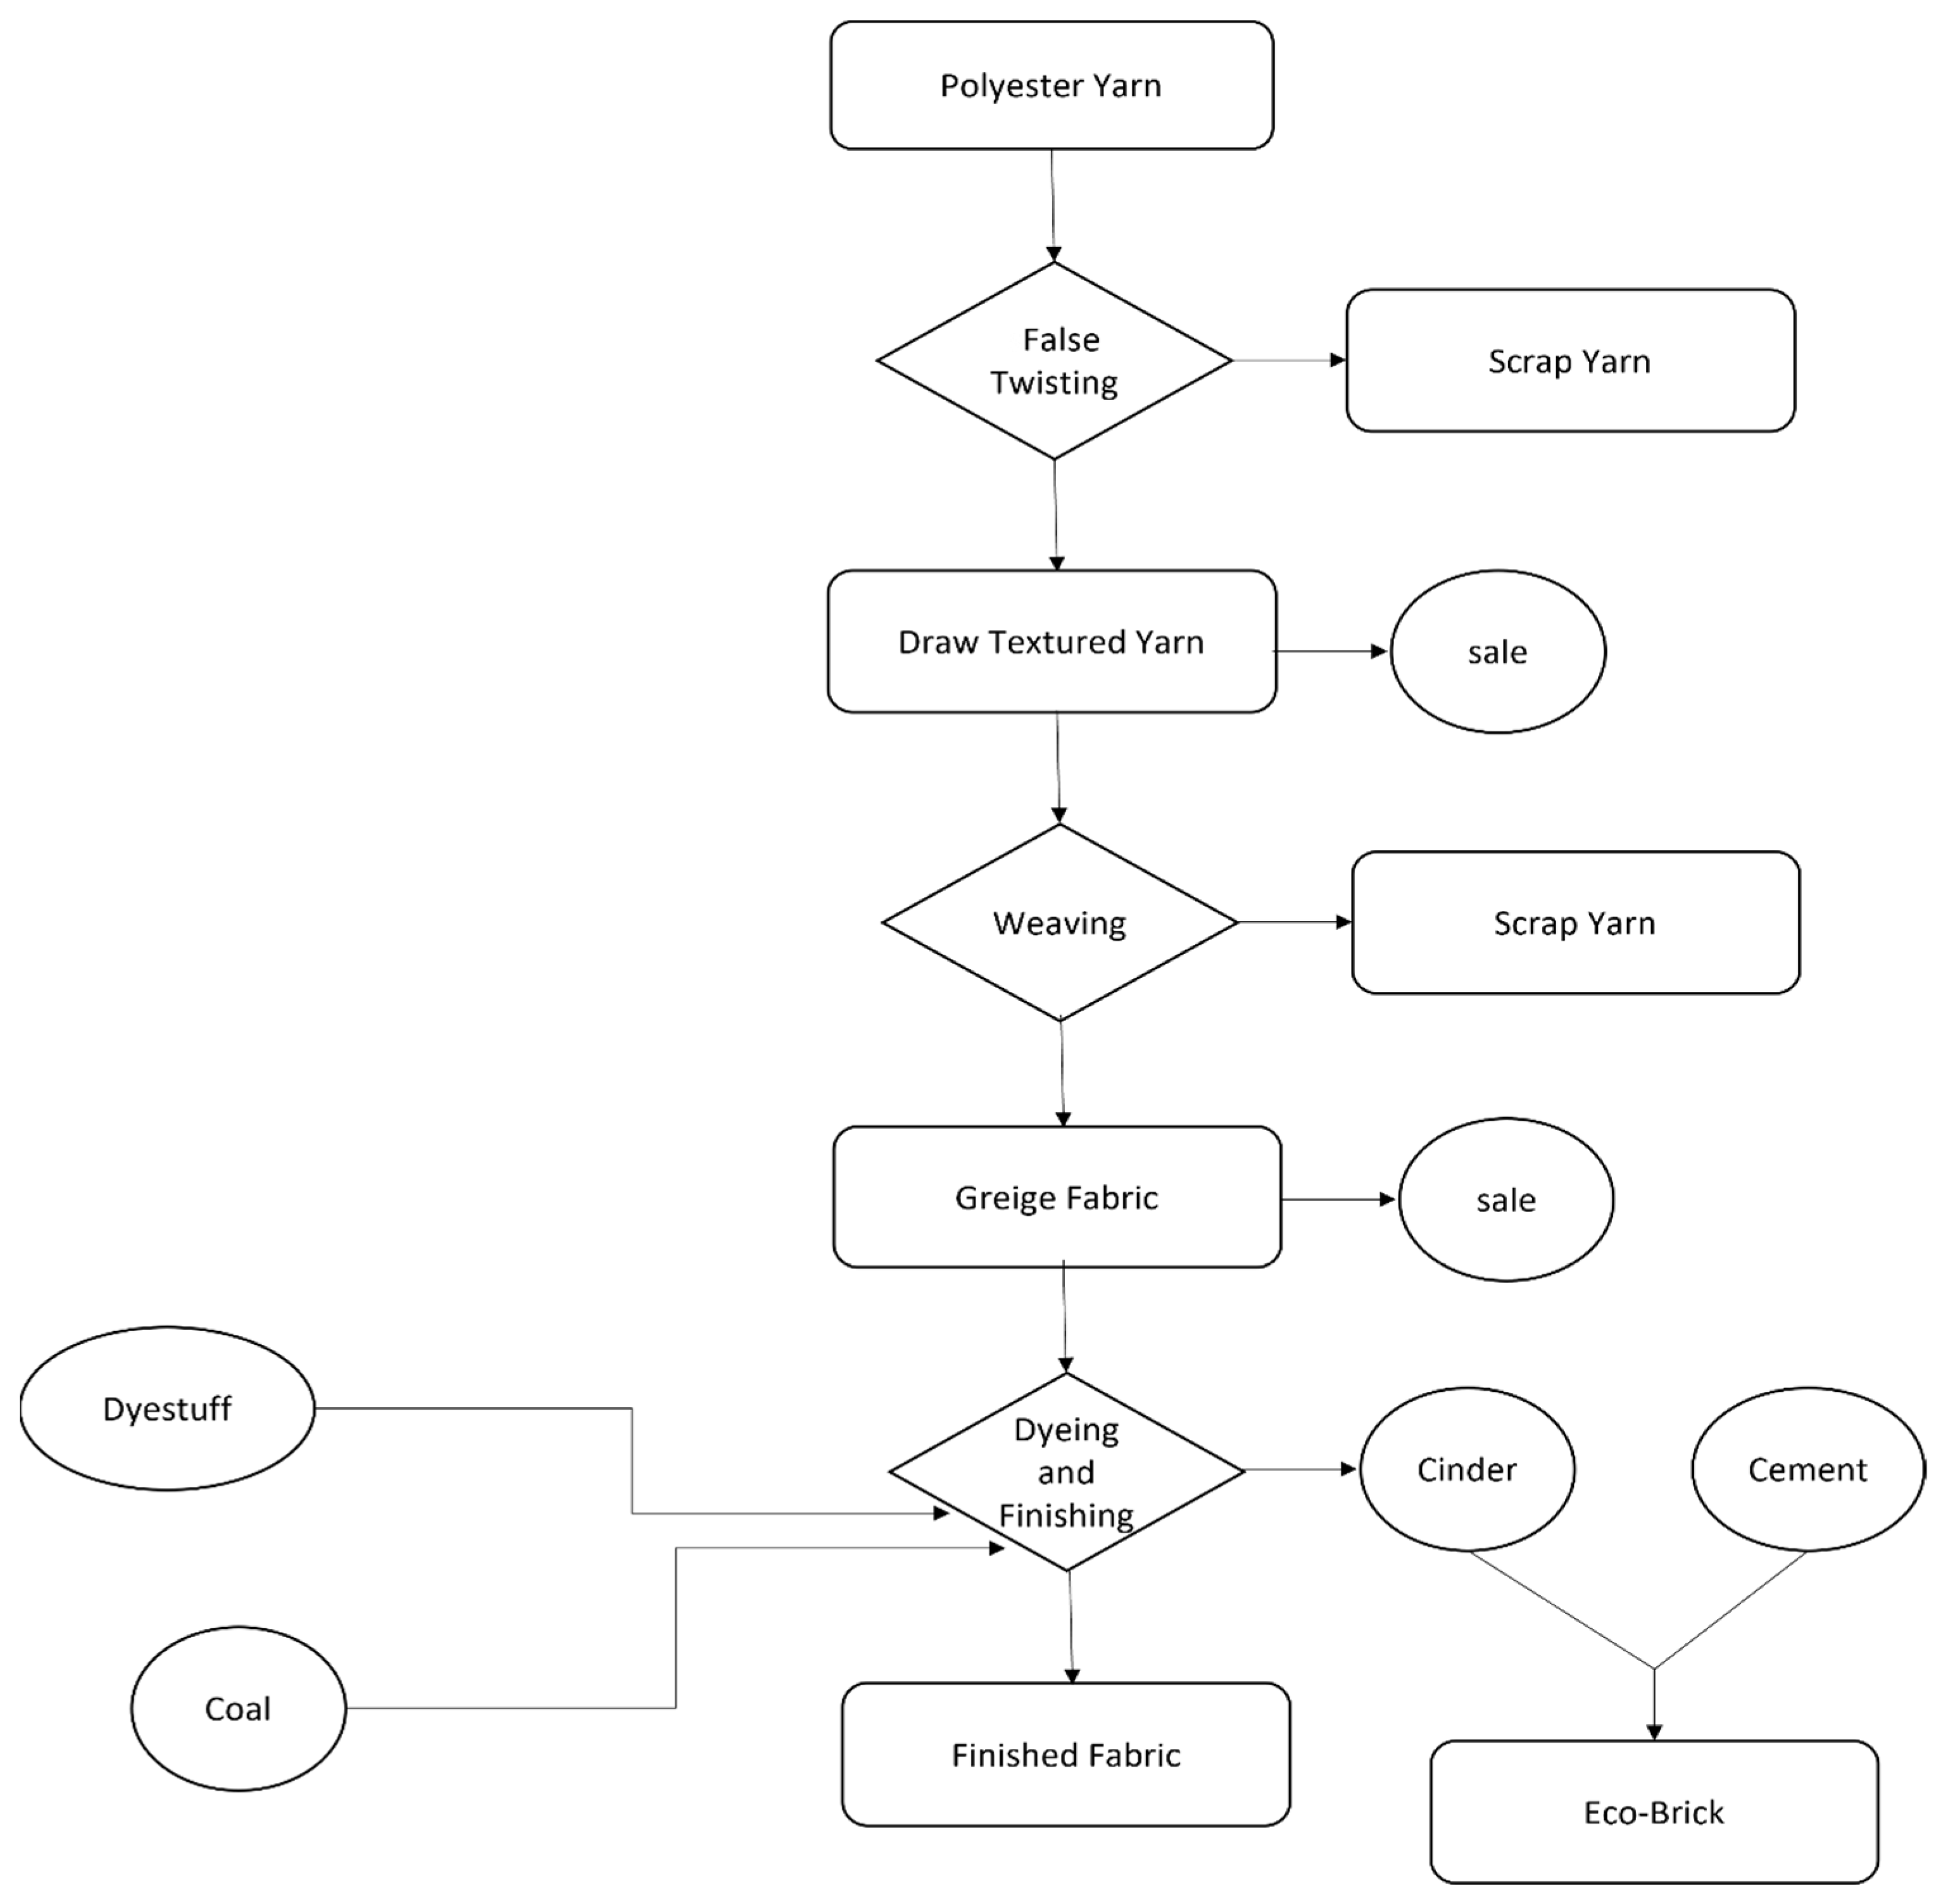
The traditional textile industry is highly labor-intensive, with each stage of production requiring significant manual effort. The manufacturing process involves several key steps, including false twisting, weaving, dyeing, and finishing. As illustrated in
Figure 2, the creation of a finished textile product consists of three primary stages.
The first stage is false twisting, where raw polyester fibers are stretched and twisted to produce draw textured yarn. The second stage is weaving, where the draw textured yarn is interlaced using two sets of yarn—warp and weft—on a weaving machine to create fabric. This fabric, known as greige fabric, is an undyed material at this point. The third stage is dyeing and finishing, where the greige fabric is dyed to produce the final finished product.
During the dyeing and finishing stage, high heat is required, typically generated by burning coal. However, this process results in the production of cinders, which can be harmful to the environment. To mitigate this issue, this paper proposes an innovative solution where these cinders are mixed with cement to create environmentally friendly bricks. These bricks are characterized by their light weight and good permeability. The production of these eco-friendly bricks not only benefits the environment but also creates a new product that can be sold, thereby reducing the cost of raw materials.
In the textile production process, the consumption of raw materials has a direct impact on overall costs. By accurately calculating raw material input, production efficiency can be optimized, reducing production costs. Additionally, the handling of scrap materials (such as waste yarn and fabric) generated during production has a significant influence on the economic outcomes for the company.
3.2. Process Assumptions
The green production decision model in this study optimizes resource use and reduces environmental impact in the textile industry. It considers labor costs, material usage, carbon credits, and energy recovery, providing a framework to analyze the effects of green production practices under typical industry conditions and market fluctuations.
In the initial stage of polyester fiber production, the raw material undergoes false twisting, resulting in draw textured yarn. This process also generates a small amount of scrap yarn as a by-product. Both the draw textured yarn and scrap yarn can be marketed or used in subsequent weaving processes, with the scrap yarn typically sold at a discounted price. The second phase involves weaving, where a unit of draw textured yarn is transformed into multiple units of greige fabric. This process also produces a certain amount of scrap fabric. The greige fabric can be sold as-is or is further processed through dyeing and finishing to create the final fabric product (as shown in
Figure 2). The green production decision model for Industry 4.0 operates under several key assumptions as follows:
In this model, all handling activities are categorized as either individual or batch processes. The model does not consider expansion or outsourcing options. To comply with government-mandated higher wage rates, the model allows for increased worker hours through overtime. Carbon dioxide emission costs are calculated based on actual emissions and are subject to varying tax rates. Some versions of the model also factor in carbon credits. The handling of scrap is a critical economic issue in the textile industry. In the current production processes, scrap primarily includes waste yarn and fabric, which can be either sold at a discount or converted into by-products. For example, mixing coal ash with cement to produce eco-friendly bricks not only reduces environmental pollution but also generates additional income through sales, thereby lowering overall production costs.
A detailed analysis reveals that the handling of scrap has a significant impact on company profitability. By quantifying the costs associated with processing these materials and comparing them with the revenues from by-product sales, companies can better assess their financial contributions. Furthermore, optimizing production processes to reduce the generation of scrap—such as through more precise cutting techniques or the use of smart manufacturing equipment—can be an effective cost reduction measure. Additionally, exploring market demand and sales strategies for by-products can enhance their market value, thus increasing the company’s profitability.
3.3. Objective Function
The core structure of the green production planning model, which operates under activity-based costing (ABC) and Industry 4.0 technologies, is detailed as follows: This study will evaluate the impact of the carbon tax by dividing it into four distinct scenarios for analysis. Other significant factors, including primary product benefits, by-product benefits, raw material costs, direct labor costs, heat and water recovery, and fixed costs, will remain constant. The coefficients for these factors will be presented in this section. Activity-based costing (ABC) and the theory of constraints (TOC) are widely used tools for cost management and production optimization in the modern textile industry. In the context of Industry 4.0, ABC, when integrated with Internet of Things (IoT) technologies, enables real-time monitoring and an analysis of costs associated with various production activities. This approach allows companies to allocate resources more accurately, identify high-cost activities, and optimize their cost structures. For example, in weaving and dyeing processes, real-time cost data analysis can help management make timely adjustments to reduce production costs.
On the other hand, the TOC is instrumental in identifying and managing bottlenecks within the production process. When combined with smart manufacturing technologies, companies can monitor production lines in real-time, quickly identify issues, and make adjustments accordingly. For instance, data analysis might reveal bottlenecks in the weaving or dyeing stages, allowing for immediate corrective actions to enhance overall production efficiency.
To further illustrate the practical applications of ABC and the TOC, this chapter will include case studies demonstrating how these techniques have successfully helped textile companies achieve significant cost savings and production optimization.
- (1)
Objective function:
Profit maximum = main product revenue + by-product revenue − raw material cost − direct labor cost − carbon tax + heat and water recovery − fixed cost.
- (2)
Variable definitions:
| Selling price per unit of the product |
| Quantity of draw textured yarn sold |
| Draw textured yarn entering weaving process |
| Sales volume of greige fabric |
| Sales volume of finished fabric |
| Sales of by-products |
| Input–output coefficient for false twisting |
| Input–output coefficient for weaving |
| Input–output coefficient for eco–bricks |
| of unit material cost savings from recovered heat and Water per unit |
| Quantity of raw polyester fiber |
| Quantity of the dye fiber |
| Amount of cinder produced |
| Amount of cement |
| Direct labor cost of normal work |
| Dummy variable of 0 and 1 |
| Wage rate for direct labor in the case of overtime |
| Overtime |
| Hour limit for normal work |
| Amount of heat and water recovered in green energy |
| Fixed cost |
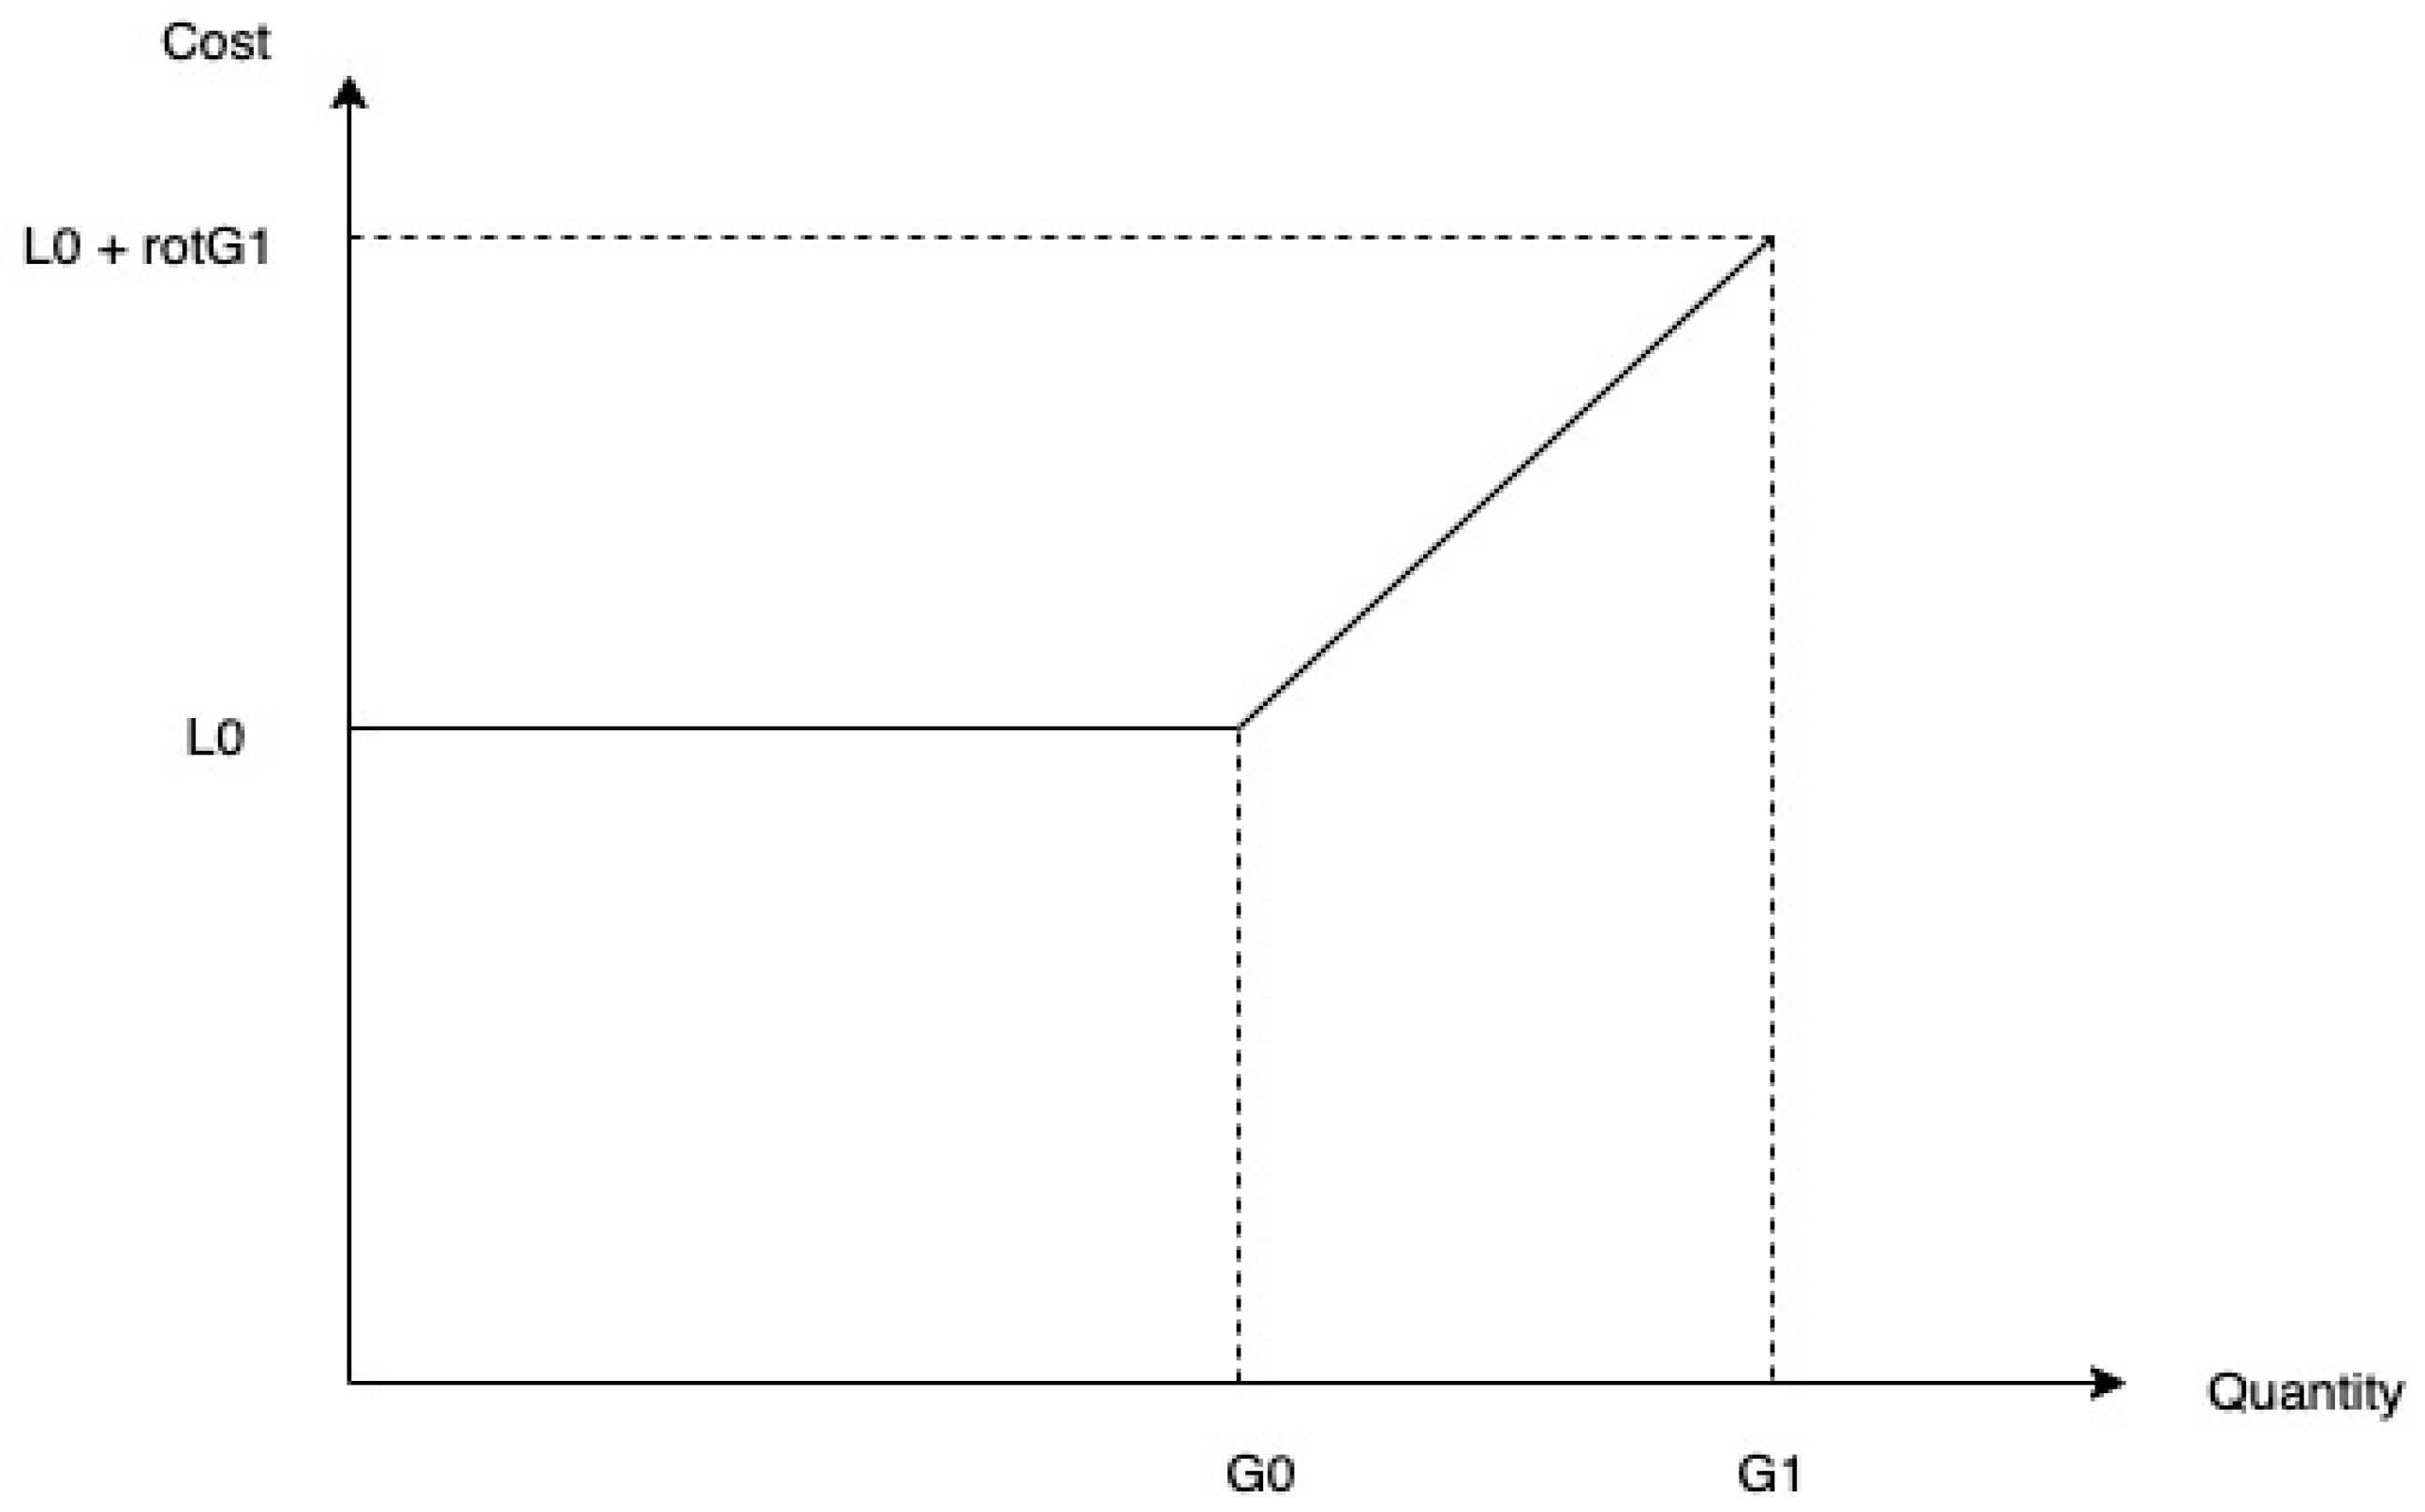
3.3.1. Unit Direct Labor Cost Function
It is assumed that overtime expands the labor force of laborers and that labor is used to handle materials and products. The total cost function of direct labor is a segmented linear function. As shown in
Figure 3, the available normal direct work is
and the work can be extended to
, while the total labor cost of
is L_0 and
, respectively. Direct labor also includes changing materials and resetting the time of each batch in the dyeing process, and after each processing procedure, the product is also directly transferred to the next processing step. The formula for direct labor and the associated restrictions are as follows:
- (2)
Variable definitions:
| Direct labor time required to handle M |
| Direct labor time required to handle |
| Direct labor time required to handle |
| Batch activity labor time |
| Shipments per batch |
| Direct labor setup time |
| Product quantity per batch |
| Normal labor hours |
| Overtime hours |
| Normal labor hour limit |
| Overtime labor hour limit |
| 0/1 dummy variable |
3.3.2. Batch Cost Handling Function
Batch activities involve handling materials and products from start to finish, including dyestuff settings during dyeing and finishing and shipping processed products back to the factory for sale. These activities ensure that products meet quality standards and adhere to regulatory requirements. Additionally, the process involves a precise formulation and adherence to specific limits to guarantee consistency and efficiency. The effective management of these batch activities is essential for optimizing production workflows, minimizing waste, and enhancing overall productivity. Furthermore, implementing advanced tracking systems can improve traceability and compliance, ensuring that all products are processed correctly and returned to the factory in a timely manner. This comprehensive approach not only streamlines operations but also supports sustainable manufacturing practices, aligning with broader industry goals of reducing environmental impacts and improving resource utilization.
- (1)
Restrictive:
- (2)
Definition of variables:
| The number of moves from start to finish for each batch activity |
| The number of settings for batch activities |
3.3.3. Heat and Water Energy Recovery Functions
The textile industry consumes significant amounts of heat and water, especially during the dyeing and finishing processes. Typically, coal is used to heat steam boilers and high-temperature air is employed for heat transfer, which also helps recover remaining heat by reducing exhaust gas temperature. Water recycling is a crucial aspect given the industry’s extensive water usage. Efficient heat and water management, focused primarily on the dyeing and finishing stages, is essential for improving sustainability in textile production. The resource recovery rate of heat and water will also be different; the recovery cost of heat and water is , respectively, and their related limiting formulas are as follows:
- (2)
Definition of variables:
| Correlation coefficient between heat recovery and |
| Correlation coefficient between water energy recovery and |
3.3.4. Input–Output Relationship Function
The textile manufacturing process is shown in
Figure 4. For example, in the weaving process, the greige fabric is woven from the draw textured yarn, and some will form scrap yarn, that is, in the input–output relationship,
is the amount of draw textured yarn input,
is the amount of greige fabric, and
is scrap yarn. The relevant restriction formula is as follows:
- (2)
Definition of variables:
| Number of by-products |
| coefficient of relationship to |
| coefficient of relationship to |
| coefficient of relationship to |
| coefficient of relationship to |
3.3.5. Other Sales and Production Functions
This production process, from beginning to end, ensures that the material passes through three key machines. The first is a false twist crimping machine, responsible for processing the polyester fiber into draw textured yarn. The second is a loom machine, which weaves this yarn into greige fabric. Finally, the dyeing and finishing machine dyes the greige fabric to produce the finished textile product. Proper maintenance by the operator and efficient operation of these machines are critical for maintaining product quality and production efficiency. Regular maintenance checks and timely interventions are necessary to prevent breakdowns and ensure consistent performance. This includes routine inspections, lubrication, calibration, and the replacement of worn-out parts. Implementing predictive maintenance strategies using the IoT and sensors can further enhance machine efficiency by predicting potential failures and scheduling maintenance activities before issues arise. Such proactive measures not only extend the lifespan of the machines but also reduce downtime and improve overall productivity. The efficiency and maintenance limits for these machines are defined as follows:
- (2)
Definition of variables:
| Machine hours utilized for false twisting |
| Machine hours utilized for weaving |
| Machine hours utilized for dyeing and finishing |
| Maximum machine hours allocated for false twisting |
| Maximum machine hours allocated for weaving |
| Maximum machine hours allocated for dyeing and finishing |
3.4. Carbon Tax Cost Model
Global warming is an important topic, and reducing the impact of the greenhouse effect is the main issue. One of the main factors affecting the greenhouse effect is that human beings emit a lot of carbon dioxide, and the textile industry is one of the industries with high carbon dioxide emissions in the world, especially in the process of dyeing and finishing. Therefore, this paper will use four different carbon tax cost models to discuss the issue of carbon emissions.
3.4.1. Carbon Tax Cost Function with Continuous Progressive Tax Rate
Figure 5 shows the carbon tax cost function of continuous progressive tax rates. Different emissions correspond to different carbon tax rates. The total carbon cost of this function is
, shown in function (30), and functions (31)–(42) are constraints related to carbon tax costs.
- (1)
Objective function:
- (2)
Carbon tax restriction formula:
- (3)
Variable definitions:
| Carbon emissions from dyeing and finishing |
| Initial-stage carbon tax cost |
| Second-stage carbon tax cost |
| Third-stage carbon tax cost |
| First-stage carbon emissions |
| Second-stage carbon emissions |
| Third-stage carbon emissions |
| Binary variable (0 or 1) |
| National carbon emissions cap |
| Special set of non-negative variable types; at most, two adjacent variables can be non-zero |
3.4.2. Continuous Progressive Tax Rate Carbon Tax Cost Function (Including Carbon Rights Trading)
This section considers the carbon tax cost function of continuous progressive tax rates and considers the purchase cost or sales income of carbon rights trading, where different emissions correspond to different carbon tax rates. It considers the carbon tax cost function of continuous progressive tax rates, much like in
Section 3.4.1. The total carbon cost of this function is
, which is shown in function (43), while functions (44)–(58) are constraints related to carbon tax costs.
- (1)
Objective function:
- (2)
Carbon tax restriction formula:
- (3)
Variable definitions:
| Carbon emissions from dyeing and finishing |
| Initial carbon tax cost |
| Secondary carbon tax cost |
| Tertiary carbon tax cost |
| Initial carbon emissions |
| Secondary carbon emissions |
| Tertiary carbon emissions |
| 0/1 dummy variable |
| National carbon cap |
| Purchasable carbon cap |
| Carbon right cost rate |
| Company’s total carbon emissions when |
| Company’s total carbon emissions when |
| 0, 1 dummy variable |
| Special set of non-negative variable types; at most, two adjacent variables can be non-zero |
<Note> is represented as (55)–(59) in Mathematical Programming.
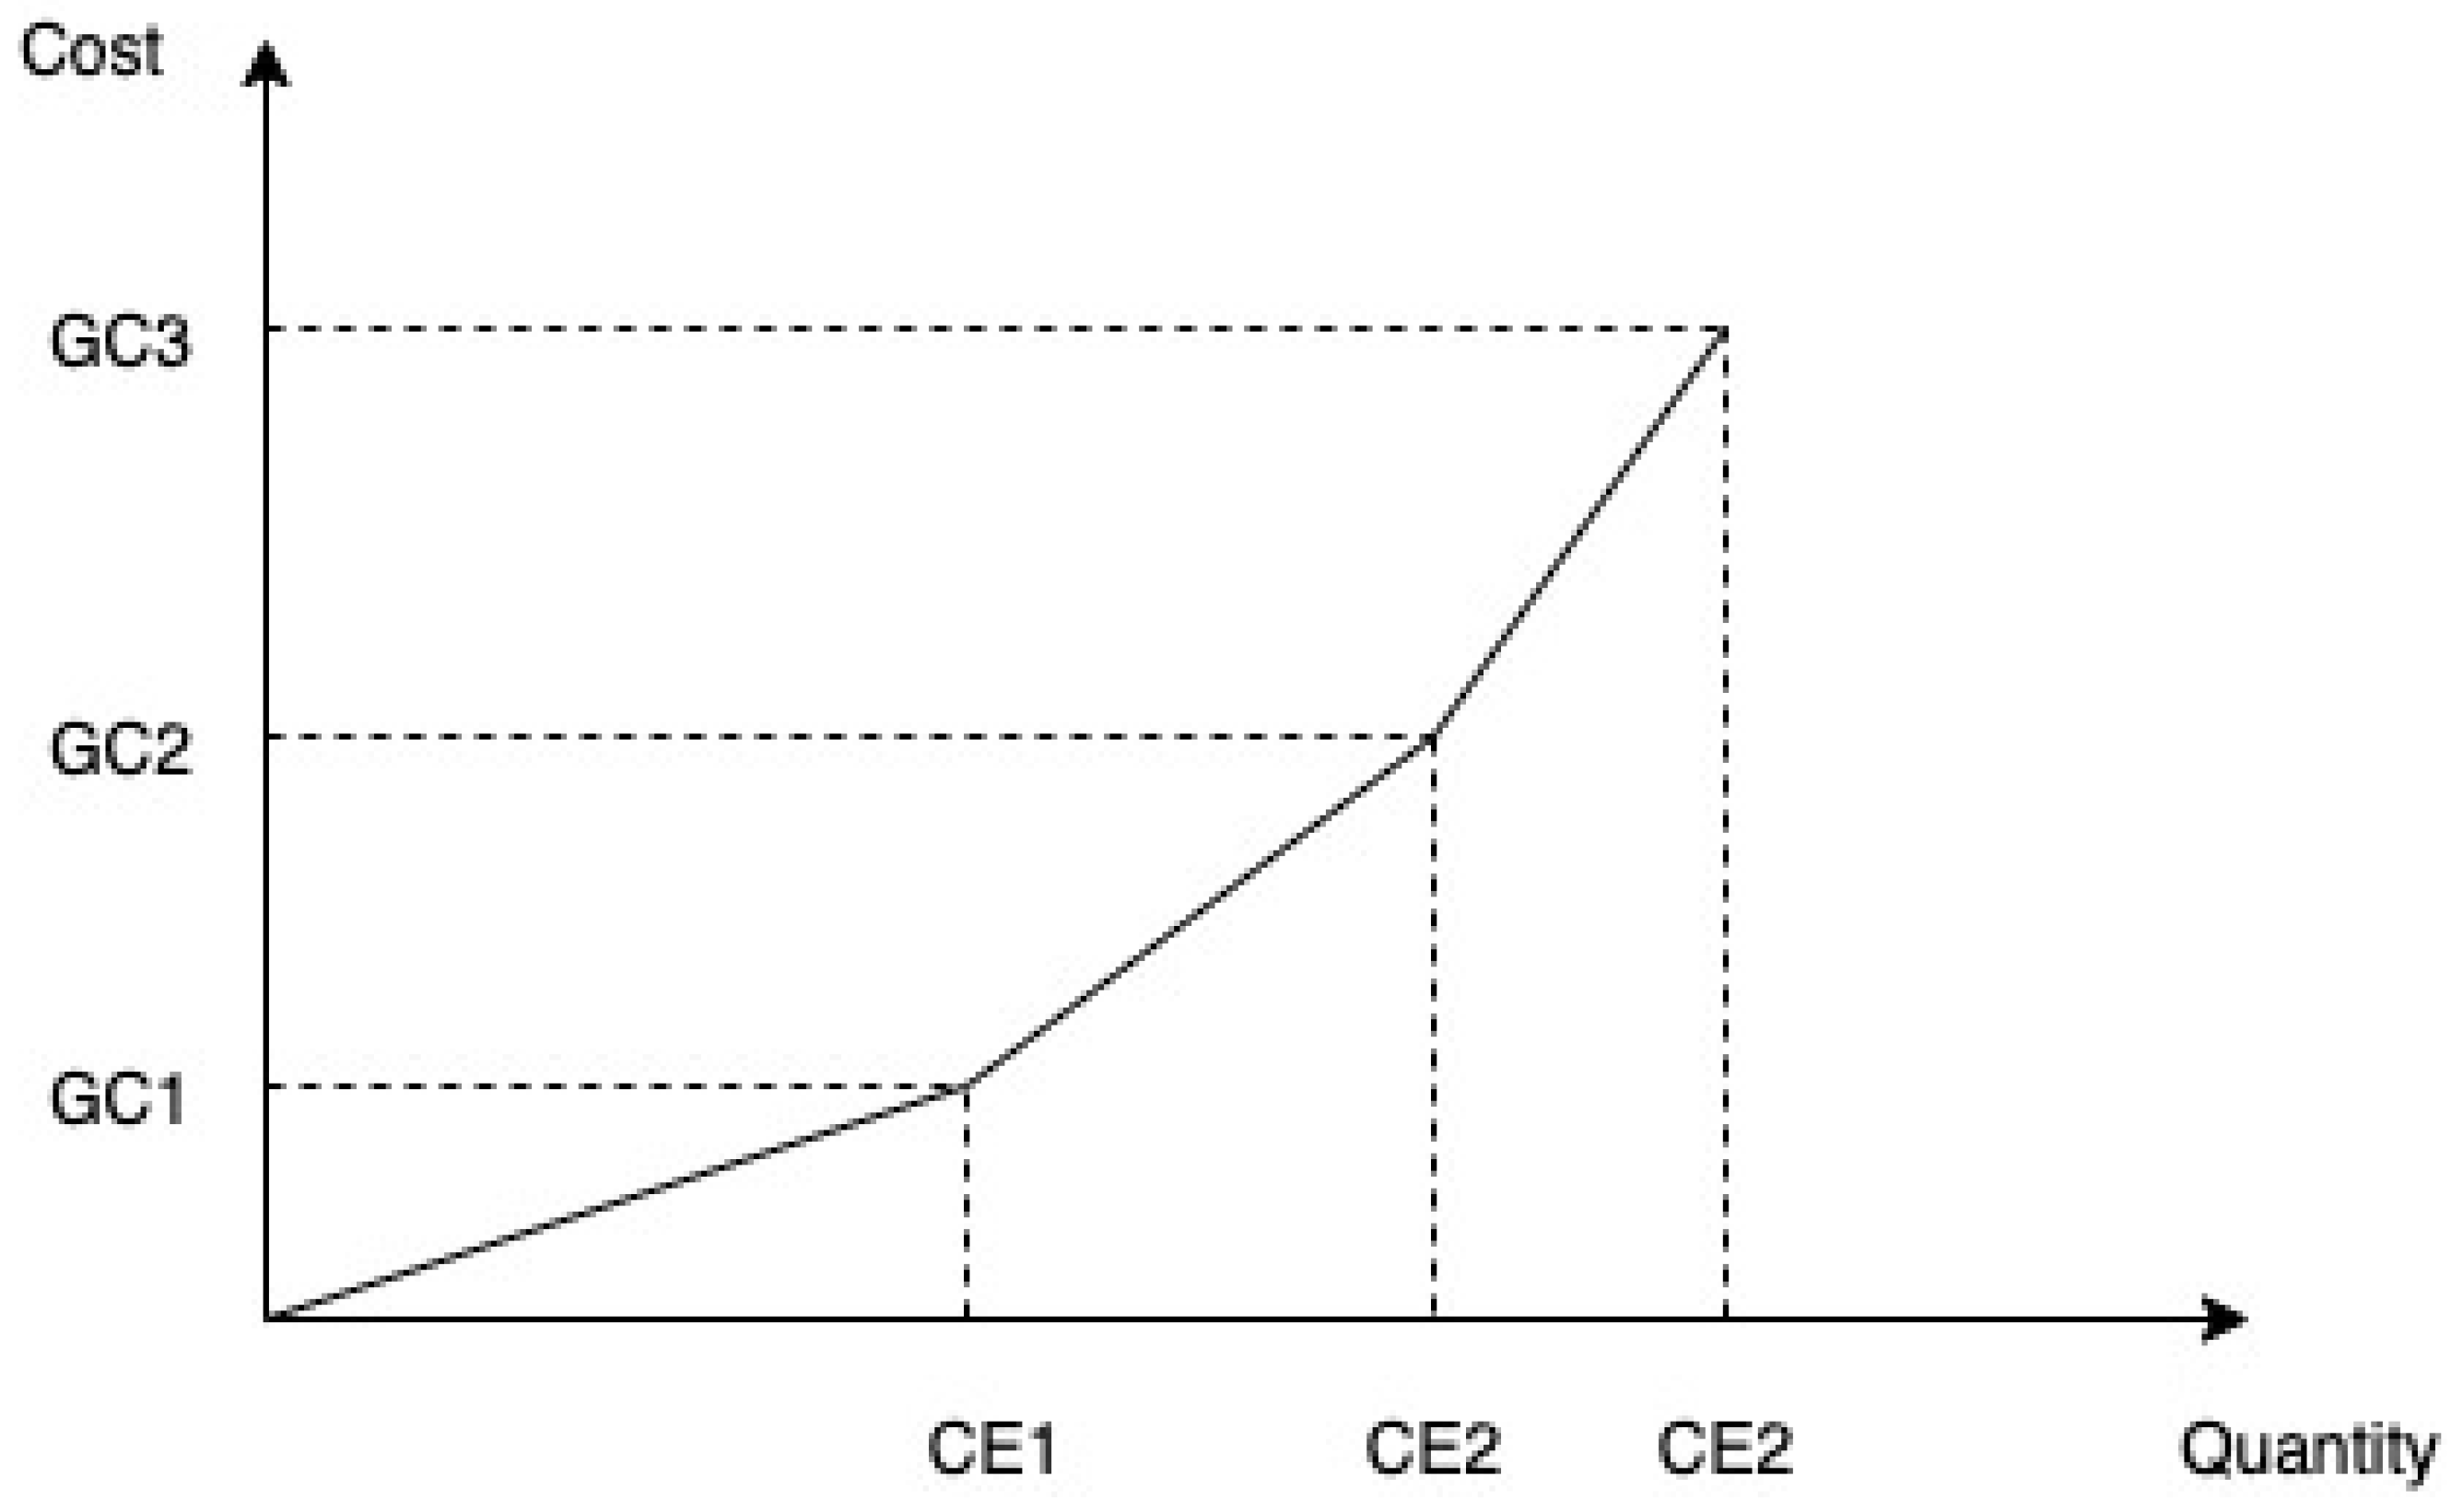
3.4.3. Carbon Tax Cost Function with Discontinuous Progressive Tax Rate
Figure 6 illustrates a carbon tax cost function that employs discontinuous progressive tax rates. This function is composed of three distinct segments, each with its own progressive tax rate.
- (1)
Objective function:
- (2)
Carbon tax restriction formula:
- (3)
Variable definitions:
| Dyeing and finishing carbon emissions |
| First-stage carbon tax |
| Second-stage carbon tax |
| Third-stage carbon tax |
| First-stage carbon emissions |
| Second-stage carbon emissions |
| Third-stage carbon emissions |
| 0/1 dummy variable |
| National carbon cap |
3.4.4. Discontinuous Progressive Tax Rate Carbon Tax Cost Function (Including Carbon Rights Trading)
In this case, the carbon tax cost function is the same as shown in
Figure 6, i.e., the carbon tax cost function that employs discontinuous progressive tax rates. Additionally, the function takes into account carbon trading rights. The overall carbon cost of this function is
, shown in function (66), while functions (67)–(75) are constraints related to carbon tax costs.
- (1)
Objective function:
- (2)
Carbon tax restriction formula:
- (3)
Variable definitions:
| Overall carbon emissions during dyeing and finishing |
| First-stage total carbon tax cost |
| Second-stage total carbon tax cost |
| Third-stage total carbon tax cost |
| Total carbon emissions of first stage |
| Total carbon emissions of second stage |
| Total carbon emissions of third stage |
| Total national carbon emissions cap |
| Carbon emissions cap that can be purchased |
| Carbon rights cost rate |
| Company’s total carbon emissions when |
| Company’s total carbon emissions when |
| 0, 1 dummy variable |
| 0, 1 dummy variable |
4. Model Analysis
4.1. Data Interpretation and Optimal Decision Analysis
The textile factory operates as a vertically integrated facility starting with polyester fiber to produce draw textured yarn, which is then woven into greige fabric and finally dyed and finished into various fabric products. This integrated approach allows for greater control over quality and production efficiency across all stages. Costs considered in the model include unit-level operations such as machine hours and labor for each production stage and batch-level processes like dyeing, which incur additional costs for materials and energy usage. Environmental costs, including carbon taxes and energy recovery initiatives, are also factored into the model to ensure compliance with sustainability standards and to mitigate environmental impacts.
Fixed costs encompass the depreciation of machinery and infrastructure maintenance, ensuring that all equipment remains in optimal condition. By incorporating these diverse cost elements, the model aims to optimize the product mix, striking a balance between minimizing production costs and maximizing output quality. This involves determining the most cost-effective combination of products to produce, taking into account demand forecasts and resource availability. Advanced analytics and real-time data monitoring enable dynamic adjustments to production plans, enhancing responsiveness to market changes and improving overall profitability. Additionally, the model considers potential savings from energy recovery and waste reduction initiatives, further supporting the factory’s commitment to sustainable manufacturing practices.
Additionally, this section now includes comparative data that clearly demonstrate the differences in profitability and environmental impacts between the optimal product mix and traditional production methods. The analysis shows that the optimal product mix significantly enhances profitability by maximizing resource utilization and reduces environmental impacts, particularly in terms of carbon emissions and resource consumption.
Table 1 lists the sample data used in this paper and
Table 2 lists the sample data of batch handling.
Table 3 demonstrates how Industry 4.0 technologies are integrated into various production stages, improving efficiency, quality, and reducing costs. For example, the IoT in raw material preparation enhances monitoring and reduces waste, while automation in processing increases speed and consistency. Machine vision in quality inspection lowers defect rates, and AR in assembly reduces errors. Smart sensors optimize packaging and autonomous vehicles streamline logistics, all contributing to a more efficient and cost-effective production process.
4.2. The Optimal Solution of the Model
Table 4 displays the sample data for Model 1, an integer programming model (MIP). The optimal solution obtained using Lingo16.0 is detailed in
Table 5. In
Table 6, the optimal product mix is highlighted, yielding a total profit of NT 3,150,930,000 from three products and three by-products. The production quantities are 13,684.21 tons, 3571.429 tons, and 21,428.57 tons, respectively. The required raw material amounts are 41,666.67 tons, 13,928.57 tons, and 2142.857 tons. The saved costs for heat recovery are NT 1,221,428 and for water recovery, NT 21,85715. The final carbon tax cost is NT 1,499,956,000 with total carbon emissions of 150,000 tons.
Additionally, this section has been expanded with a detailed economic analysis of the by-products generated during the production process. By-products, often considered waste in traditional models, can be repurposed or sold to generate additional revenue. The analysis examines the costs associated with the production and processing of by-products and compares them with the potential revenue they can generate, offering insights into how by-products can reduce overall production costs and increase profitability.
Table 4.
Model data of Model 1 green production model.
Table 4.
Model data of Model 1 green production model.
|
|
|
|
|
| Input–output relationship: | Machine hour objective function: |
| |
| |
| |
| Batch handling objective function: |
| |
| |
| |
| |
| |
| |
| |
| Target carbon tax function: | Direct artificial objective function: |
| |
| |
| |
| |
| |
| |
| |
| |
| |
| |
| |
| |
| |
| |
Table 5.
Model 1 best solution.
Table 5.
Model 1 best solution.
| | | |
| | | |
| | | |
| | | |
| | | |
| | | |
| | | |
| | | |
| | | |
4.3. The Best Solution of the Second Model
Table 6 presents sample data for an integer programming model (MIP) and
Table 7 shows the optimal solution obtained using Lingo16.0. The solution indicates the best product mix, achieving a total profit of NT 3,461,837,000. It includes specific quantities of products and by-products, raw material usage, and savings in heat and water recovery costs. Additionally, it calculates carbon tax expenses and carbon emissions reduction.
Table 6.
Sample data of Model 2 green production model.
Table 6.
Sample data of Model 2 green production model.
|
|
|
|
|
|
|
| Input–output relationship: | Machine hour objective function: |
| |
| |
| |
| Batch handling objective function: |
| |
| |
| |
| |
| |
| |
| |
| Target carbon tax function: | Direct artificial objective function: |
| |
| |
| |
| |
| |
| |
| |
| |
| |
| |
| |
| |
| |
| |
| |
| |
| |
| |
| |
Table 7.
Model 2 best solution.
Table 7.
Model 2 best solution.
| | | |
| | | |
| | | |
| | | |
| | | |
| | | |
| | | |
| | | |
| | | |
To ensure a balanced perspective, this section now includes a discussion on the limitations and underlying assumptions of the model used for the analysis. Key assumptions, such as market stability, resource availability, and technology adoption rates, are critically evaluated. Additionally, potential limitations in the model, such as its applicability to different industry segments and varying scales of operation, are discussed. This provides a more nuanced view of the model’s applicability and highlights areas where future research could improve its accuracy and relevance.
Additionally, this section is newly added to critically evaluate the model, offering a more balanced and thorough understanding of its potential applications and limitations. It discusses the assumptions underlying the model, including market conditions, resource availability, and the impact of future technological changes on the model’s predictions.
4.4. The Best Solution of the Third Model
Table 8 provides sample data for an integer programming model (MIP) and
Table 9 shows the optimal solution derived using Lingo16.0. The solution indicates the best product mix, resulting in a total profit of NT 3,047,768,000. It specifies the quantities of products and by-products produced, raw material consumption, and savings in heat and water recovery costs. Additionally, it includes calculations for carbon tax expenses and reductions in carbon emissions.
Table 8.
Sample data of Model 3 green production model.
Table 8.
Sample data of Model 3 green production model.
|
|
|
|
| Input–output relationship: | Machine hour objective function: |
| |
| |
| |
| Batch handling objective function: |
| |
| |
| |
| |
| |
| |
| |
| Target carbon tax function: | Direct artificial objective function: |
| |
| |
| |
| |
| |
| |
| |
| |
| |
Table 9.
Model 3 best solution.
Table 9.
Model 3 best solution.
| | | |
| | | |
| | | |
| | | |
| | | |
| | | |
| | | |
| | | |
| | | |
4.5. The Best Solution of the Fourth Model
Table 10 presents the sample data for Model 4, which is an integer programming model (MIP). The optimal solution, obtained using Lingo16.0, is shown in
Table 11. According to the optimal solution of the model, the most profitable product mix includes three products and three by-products, yielding a profit of NT 3,115,387,000. The quantities of the products are 13,400 tons, 1000 tons, and 22,750 tons, respectively. The required raw materials are 40,000 tons, 14,787.5 tons, and 2275 tons. The saved heat recovery cost is NT 1,296,750, and the saved water recovery cost is NT 2,320,500. The final carbon tax cost amounts to NT 180,725,000, with total carbon emissions of 159,250 tons.
Table 10.
Sample data of Model 4 green production model.
Table 10.
Sample data of Model 4 green production model.
|
|
|
|
|
|
| Input–output relationship: | Machine hour objective function: |
| |
| |
| |
| Batch handling objective function: |
| |
| |
| |
| |
| |
| |
| |
| Target carbon tax function: | Direct artificial objective function: |
| |
| |
| |
| |
| |
| |
| |
| |
| |
| |
| |
| |
| |
| |
Table 11.
Model 4 best solution.
Table 11.
Model 4 best solution.
| | | |
| | | |
| | | |
| | | |
| | | |
| | | |
| | | |
| | | |
| | | |
| | | |
4.6. Model Comparison
Table 12 is a comparison table of the important parameters of each model. In the table, you can see the profit, carbon emissions, carbon tax cost, the quantity of three main products, and the recovery income of heat energy and water energy of each model. Among them, we can see that Model 2 and Model 4 are models that take carbon rights trading into consideration. Although the models used in this study show potential for optimizing production efficiency and reducing carbon emissions, they also have certain limitations. For example, these models assume market conditions are stable and the policy environment is predictable, which may not always hold true in practice. Additionally, the models rely on high-quality data input but in reality, data completeness and accuracy may be limited, affecting the reliability of the model outputs. Future research should consider these limitations and explore how to optimize the application of these models in more uncertain environments. In the production process, the generation and disposal of by-products have a significant impact on overall production costs and profitability. While by-products may initially be considered waste, with proper management and utilization, they can create an additional revenue stream for businesses. For example, by reusing or selling by-products, businesses can reduce the cost of disposing waste and turn it into valuable products, increasing overall profitability.
However, the economic benefits of by-products depend on several factors, such as market demand, disposal costs, and product quality. If there is not a high demand for by-products, businesses may need to incur additional storage or disposal costs, which in turn can reduce profitability. In addition, the quality of the by-product also has a direct impact on its market value, and low-quality by-products may only be sold at a lower price and may even result in processing costs outweighing their benefits. Therefore, when formulating production strategies, companies should comprehensively assess the economic impact of by-products and flexibly adjust strategies according to market dynamics to maximize overall profitability.
5. Discussion
This study integrates Industry 4.0 technologies, activity-based costing (ABC), and the theory of constraints (TOC) to explore how to enhance sustainability and profitability in the textile industry. Industry 4.0 technologies, such as the Internet of Things (IoT) and real-time data analysis, not only improve production efficiency but also monitor and reduce energy consumption. ABC provides an accurate cost allocation method, helping to identify energy-intensive areas and develop improvement strategies, while the TOC optimizes production bottlenecks to enhance overall efficiency. The combined application of these methods not only increases resource utilization efficiency but also reduces carbon emissions, achieving sustainability goals while maintaining profitability.
In the traditional textile industry, especially among SMEs, the adoption of Industry 4.0 technologies (e.g., the IoT and ERP systems) is influenced by factors like limited funding, lack of technical personnel, and insufficient digital infrastructure. SMEs often face high costs and training demands, making transformation challenging. However, this study suggests that with government policies, industry subsidies, and technical assistance, SMEs can gradually upgrade their technology. We recommend small-scale pilot projects to assess the applicability and benefits of these technologies, minimizing implementation risks.
This study focuses on the production and operational phases of textile manufacturing, but we acknowledge the need to address the entire product lifecycle, including disposal and recycling. Future research should integrate these aspects to fully capture environmental impacts and explore strategies for enhancing recyclability and promoting circular economy practices for optimized sustainability.
Converting waste materials from textile production, like waste yarn and cinder, into marketable by-products (e.g., eco-bricks) is innovative but depends on market demand and the quantity of cinder waste. In emerging markets, the demand for eco-friendly building materials presents a large opportunity, helping reduce disposal costs and improve business performance. In mature markets, despite higher competition, there is greater acceptance of sustainable products, which can enhance market value. Therefore, companies should adapt strategies to local needs, such as promoting eco-bricks’ environmental benefits in mature markets and leveraging demand growth in emerging markets.
We based the green production decision model on the general characteristics of the textile industry, including labor, material costs, and carbon credits, to reflect typical cost structures while considering policy and market fluctuations. However, differences exist across sub-sectors like cotton spinning, synthetic fibers, and garment manufacturing. Future research should adjust and validate the model for these sub-sectors to enhance its accuracy and effectiveness.
We also analyzed the market demand and economic value of by-products, considering factors like policy support, cost control, and product quality across different markets. Results show that effective resource management and quality enhancement can turn by-products into revenue sources, reducing disposal costs. The study highlights flexible strategies to maximize economic benefits and promote business sustainability.
Model 2 generates the highest profit (NT 3.46 billion), followed by Model 1, while Model 3 has the lowest profit. Models 2 and 4, although they have higher carbon emissions, benefit from enhanced production efficiency and recycling, unlike traditional methods. Model 1 achieves the lowest carbon tax cost, while Model 4, despite its higher emissions, demonstrates strong environmental management. Overall, the proposed models outperform traditional methods in profitability, production efficiency, and environmental impacts through the integration of smart technologies and recycling systems, promoting sustainable production.
Industry 4.0 technologies such as the IoT, CPS, and big data offer significant improvements in energy efficiency, cost reduction, and sustainability. Real-time monitoring optimizes production processes, while smart energy management and recycling reduce resource consumption and emissions. Advanced treatments and carbon capture minimize environmental impacts, and ABC/TOC integration enhances cost management and production efficiency. Industry 4.0 also improves supply chain transparency and enables new business models like mass customization, minimizing waste.
Challenges remain, including the need for infrastructure investment and skilled personnel. Adoption varies across sectors, with a slower uptake in textiles compared to others. Future research should focus on developing scalable and adaptable solutions for SMEs and fostering collaboration among stakeholders to drive widespread adoption and maximize sustainability. This article analyzes how the ABC system overcomes the limitations of traditional cost systems within the context of modern economic and technological developments. Through a systematic review of the relevant literature published internationally in recent years, it illustrates how the ABC system can be effectively applied in various organizations, particularly for resource management and cost control, providing a solid theoretical basis for research [
47]. Furthermore, the article examines the detailed application of the ABC system in the manufacturing industry, with a specific focus on resource allocation and cost decision-making. It includes specific application cases of ABC in different manufacturing enterprises, demonstrating how these applications can improve cost structure and decision-making efficiency [
48]. The article also reviews the impact of Industry 4.0 technologies on sustainability in manufacturing, discussing future research directions. It explores how key technologies such as the Internet of Things, artificial intelligence, and big data analytics can improve resource efficiency and reduce environmental impacts, thereby showcasing the wide range of applications of Industry 4.0 technologies in manufacturing [
49]. Additionally, this report addresses the growing trend in sustainable practices within the footwear industry, including the use of eco-friendly materials and the impact of regulatory pressures. This information is crucial for understanding the current landscape of sustainable manufacturing in the footwear sector and the potential benefits of integrating carbon trading mechanisms [
50]. This paper provides key advantages. It integrates real-time data monitoring and optimization, offering deeper insights into ERP, the TOC, ABC, and Industry 4.0 systems, enhancing data accuracy and system efficiency. Additionally, it introduces innovative carbon management strategies, balancing environmental and economic goals more effectively than previous studies. Unlike earlier theoretical work, this study applies these models directly to the textile industry, demonstrating a practical real-world impact.
6. Conclusions
By implementing the proposed green production planning model, significant cost savings and economic returns have been achieved. For example, in Model 2, the optimization of heat recovery and water recycling brought additional gains of NT 1,296,750 and NT 2,320,500, respectively. These recovery benefits not only reduced resource waste during the production process but also directly increased overall profits. Additionally, due to more efficient resource allocation and improved production efficiency, the overall production costs in Model 2 were reduced by approximately 15% compared to traditional methods, further increasing profit margins. Although carbon tax costs have increased, the overall economic returns still surpass traditional methods through optimized product mix and improved resource utilization. This paper examines how integrating ERP systems, Industry 4.0 technologies, activity-based costing (ABC), and the theory of constraints (TOC) can maximize profits. The proposed green production planning model effectively addresses key challenges in the textile industry, which is known for its significant environmental impact. Therefore, this paper focuses on carbon emissions, energy recovery, and waste recycling. Industry 4.0’s automated monitoring systems ensure that all production processes are efficiently maintained and managed with real-time data collection, which are then analyzed by the ERP system. Additionally, implementing a carbon tax is recommended to motivate businesses to reduce their carbon emissions.
The paper also explores the potential of renewable energy sources, including the recovery and treatment of water and heat energy to enable recycling and reuse, thereby achieving energy savings. This approach not only conserves energy but also reduces costs. The reuse of cinders, a by-product of coal burning in boilers, is also discussed. Usually considered waste due to high disposal costs, cinders can cause significant environmental pollution. However, by mixing cinders with cement to create lightweight and breathable carbon bricks, this method proves to be environmentally friendly and avoids high transportation costs, facilitating green manufacturing.
Industry 4.0 can also drive innovation in production methods such as mass customization and on-demand production. These approaches allow textile manufacturers to produce customized products in response to individual customer demands, reducing overproduction and waste. Advanced manufacturing technologies like 3D knitting and digital printing facilitate this shift toward more flexible and sustainable production practices.
In conclusion, integrating Industry 4.0 technologies with advanced cost management techniques like ABC and the TOC offers a feasible path for the textile industry to achieve both economic and environmental sustainability. However, overcoming the challenges of technological adoption, particularly among SMEs, requires targeted efforts and collaboration across industries, governments, and academia. Future research should continue to explore scalable innovative solutions that promote widespread adoption and maximize the synergies of Industry 4.0 technologies.
Additionally, adopting Industry 4.0 technologies in the textile industry can significantly enhance operational agility. By utilizing real-time data and analytics, manufacturers can quickly adapt to market changes, optimize production schedules, and improve decision-making processes. This agility is essential for maintaining competitiveness in a rapidly changing market landscape.
Integrating sustainable practices within Industry 4.0 frameworks can foster a circular economy in the textile sector. By focusing on recycling, reuse, and resource efficiency, the industry can reduce its environmental footprint and create a more sustainable value chain. This shift toward a circular economy not only addresses environmental concerns but also opens up new business opportunities and revenue streams through innovative recycling and upcycling processes.
Overall, the combination of Industry 4.0 technologies, advanced cost management methods, and sustainability initiatives presents a comprehensive approach to transforming the textile industry. By addressing environmental challenges and leveraging technological advancements, the industry can achieve significant improvements in efficiency, profitability, and sustainability. Future research should aim to develop scalable solutions that can be widely adopted across the industry, promoting a sustainable and innovative textile sector. Despite the promising results presented in this study, there are several limitations that should be acknowledged. First, the model’s application is primarily theoretical and may require adaptation when implemented in real-world scenarios, particularly in different geographic regions or industry sectors. The complexity of integrating multiple technologies and cost management systems also presents a challenge, particularly for SMEs with limited resources. Additionally, the study does not fully explore the long-term impacts of Industry 4.0 adoption on workforce dynamics, such as the need for reskilling and potential job displacement.
Future research should address these limitations by focusing on empirical studies that test the proposed model in various real-world settings. Investigating the scalability of the model for SMEs and its adaptability to different sectors within the textile industry will also be crucial. Furthermore, research should explore the socio-economic implications of Industry 4.0, including the effects on employment and skill development. Finally, interdisciplinary collaboration will be essential to develop comprehensive strategies that ensure the successful integration of Industry 4.0 technologies, balancing economic, environmental, and social goals.
In conclusion, the application of activity-based costing (ABC) and the theory of constraints (TOC) within the Industry 4.0 framework has proven effective in optimizing production processes and enhancing profitability, as demonstrated by previous successful case studies [
21,
22,
30,
35,
36]. These methodologies allow for the precise cost allocation and efficient management of production bottlenecks, contributing to overall operational efficiency and sustainability. Additionally, the integration of ABC and the TOC with smart technologies has facilitated real-time decision-making and resource management, as highlighted in the examples provided earlier [
26,
37,
38]. The empirical evidence supports the effectiveness of these approaches in driving economic and environmental improvements in industrial settings. While the model demonstrates a 10% profitability increase based on optimized resource utilization, these results are derived from theoretical simulations using assumed data to establish a controlled environment for analysis. This approach allows for isolating variables and understanding potential impacts clearly. However, to ensure its effectiveness and adaptability in diverse real-world settings, future validations with empirical data are recommended, considering the variability in data quality, market conditions, and industry-specific factors.


