Article

Deep Learning-Based Fatigue Strength Prediction for Ferrous Alloy

1
China Oil & Gas Pipeline Network Corporation Central China Branch, Wuhan 430000, China
2
College of Chemical Engineering, Fuzhou University, Fuzhou 350116, China
*
Authors to whom correspondence should be addressed.
Processes 2024, 12(10), 2214; https://doi.org/10.3390/pr12102214
Submission received: 31 August 2024 / Revised: 5 October 2024 / Accepted: 8 October 2024 / Published: 11 October 2024

Abstract

:
As industrial development drives the increasing demand for steel, accurate estimation of the material’s fatigue strength has become crucial. Fatigue strength, a critical mechanical property of steel, is a primary factor in component failure within engineering applications. Traditional fatigue testing is both costly and time-consuming, and fatigue failure can lead to severe consequences. Therefore, the need to develop faster and more efficient methods for predicting fatigue strength is evident. In this paper, a fatigue strength dataset was established, incorporating data on material element composition, physical properties, and mechanical performance parameters that influence fatigue strength. A machine learning regression model was then applied to facilitate rapid and efficient fatigue strength prediction of ferrous alloys. Twenty characteristic parameters, selected for their practical relevance in engineering applications, were used as input variables, with fatigue strength as the output. Multiple algorithms were trained on the dataset, and a deep learning regression model was employed for the prediction of fatigue strength. The performance of the models was evaluated using metrics such as MAE, RMSE, R2, and MAPE. The results demonstrated the superiority of the proposed models and the effectiveness of the applied methodologies.

1. Introduction

With the continuous advancement of industrial technology, modern metal materials, mechanical equipment, and components are increasingly becoming more intelligent and multifunctional. The operational environments of these systems have also grown more complex. In practical engineering, mechanical equipment made of metal materials frequently experiences failures, leading to significant economic and safety impacts. Thus, the service life and reliability of engineering components are critical considerations. Fatigue failure is one of the most common types of engineering failure. Conducting in-depth research on the fatigue performance of metal materials and predicting the fatigue failure of vulnerable components is essential to ensuring the safe and reliable operation of mechanical parts throughout their service life. Accurate fatigue strength prediction is crucial for enhancing the safety and reliability of engineering components, allowing for maintenance or repair before fatigue failure occurs. Although the stress–life relationship is widely used as a material property in design, fatigue strength is influenced by a range of complex physical and chemical factors, not just stress. To identify the internal and external factors affecting fatigue strength, data mining techniques are employed [1,2,3,4,5]. Moreover, by utilizing existing characteristic parameter data and fatigue test data, the integration of intelligent algorithms for data-driven prediction can achieve more efficient, rapid, and precise forecasts of metal material fatigue performance. This approach addresses the limitations of traditional fatigue prediction methods [6,7,8,9,10].
In recent years, the accurate prediction of fatigue strength has gained significant attention. Zou et al. [11] studied the high-cycle fatigue properties of compacted graphite iron (CGI) and observed that fatigue strength decreases with increasing temperature and micro-structural changes. At low temperatures, fatigue cracks initiate from ferrite and vermicular graphite, while at higher temperatures, cracks are influenced by grain boundary softening and oxidation. They developed a predictive model based on tensile strength, yield strength, and microstructure percentage, which effectively predicts CGI’s fatigue strength across various temperatures. Liu et al. [12] proposed a model reflecting the relationship between yield strength, tensile strength and fatigue strength, and the model was validated by the fatigue strength data under loading conditions of various metallic materials, which can reduce the cost of fatigue tests and improve the efficiency of fatigue-resistant design of metallic materials. Yuan et al. [13] investigated the main parameters affecting the fatigue performance of sintered parts through dimensional analysis methods, introduced the influence factors of stress gradient and microhardness gradient, and established a fatigue strength prediction model, which was found to be very effective in the prediction of high-cycle fatigue strength of low-plasticity sintered samples. Marsavina et al. [14] investigated the fatigue strength of AM50 magnesium alloy, commonly used in automotive steering wheels, by comparing un-notched, R-radius, and V-notch specimens under rotating bending tests. They identified significant differences in fatigue strength due to stress concentration and surface finishing. The study proposes correlations between fatigue strength, tensile strength, and hardness to aid in designing durable magnesium alloy components, with SEM analysis revealing the mechanisms of fatigue damage.
Many scholars have dedicated significant research efforts to integrating traditional fatigue domain knowledge with data-driven algorithms to achieve rapid and efficient predictions of fatigue performance parameters and to address fatigue-related challenges [15,16,17,18]. Yan et al. [19] employed machine learning (ML) to predict the fatigue strength of steel and to elucidate its complex formation mechanisms. They proposed a hybrid model combining XGBoost and LightGBM, optimized using a grey wolf algorithm, and used Shapley additive explanations (SHAP) to interpret the predictions and identify key factors. The results demonstrate that SHAP effectively explains the fatigue strength predictions, offering valuable insights for the development of anti-fatigue steel materials in the future. Zhao et al. [20] investigated the high-cycle fatigue (HCF) strength of Ti-17 alloy blades following foreign object damage (FOD), finding that deflection-type notches exhibit lower fatigue strength than semicircular-type notches due to inclined extrusion and material folding. They developed a back-propagation neural network model that accurately predicts HCF strength, outperforming the Peterson formula, with prediction errors for most notches ranging from −40% to 50%. Wang et al. [21] reviewed ML methods for predicting metal fatigue life, emphasizing the use of hybrid physics-informed and data-driven models (HPDM) to enhance physical consistency and interpretability. They highlighted the effectiveness of data-driven methods and the benefits of combining these approaches with physical theory. The paper also discusses challenges such as insufficient training data and explores the potential of integrating HPDM with digital twin technology for more accurate fatigue life prediction. Liu et al. [22] utilized machine learning models, including gradient boosting regression trees (GBRT), long short-term memory (LSTM), and partial rank regression ridge (PRRR), to predict the fatigue strength of nickel-based superalloy GH4169 under various temperatures, stress ratios, and fatigue lives. Their findings indicate that machine learning can effectively predict fatigue strength from limited data, with accuracy heavily dependent on the composition of the training set. Among the models tested, PRRR performed the best. The research suggests that incorporating more data and physical parameters could further enhance prediction reliability and practicality.
Guo et al. [23] presented a method for predicting the fatigue strength of ferrous alloys using a random forest regression (RFR) model optimized with Bayesian algorithms. This approach improves prediction accuracy and efficiency compared to traditional methods and other models such as linear regression, artificial neural networks (ANN), and support vector regression (SVR). By optimizing the RFR model parameters, the study achieves high prediction accuracy, reducing the need for extensive fatigue testing and thereby saving time and costs. Utpat et al. [24] evaluated machine learning algorithms for predicting the fatigue strength of cast aluminum alloys using a dataset of 39 alloys. They developed models using Linear Regression, Support Vector Machine, Artificial Neural Network (ANN), and Random Forest. The ANN model performed best, showing the lowest mean absolute percentage error (MAPE) and high accuracy. The study concludes that ANN, with a MAPE of 10.83% and a correlation coefficient of 0.91, is the most suitable model for predicting fatigue strength among the evaluated algorithms. Kashyzadehr et al. [25] developed a neural network algorithm to predict the fatigue life of aluminum alloys based on machining parameters. Using data from turning operations, the ANN accurately predicts surface roughness and fatigue life, highlighting the significant impact of machining parameters on these properties. These methods provide important support and extensions to traditional methods, and they can improve the accuracy and efficiency of fatigue analysis. Yin et al. [26] proposed a novel research approach by establishing a random forest regression (RFR) model that incorporates experimental property conditions for predicting fatigue fracture. This research direction offers a fresh perspective on addressing traditional problems through the mining of experimental data. Zhou et al. [27] introduced a composite ML approach to enhance the framework for fatigue life prediction. This approach aims to identify genetic features and minimize the need for extensive experimental testing, thereby reducing both time and cost associated with the prediction process. Gan et al. [28] put forward the use of random forests and kernel extreme learning machines as an alternative approach to semi-empirical prediction models for predicting fatigue life under mean stress conditions. This novel method offers a different perspective and presents potential improvements in predicting fatigue life. Shiraiwa et al. [29] utilized an existing database and machine learning methods to achieve a high level of accuracy in predicting fatigue strength. Their study resulted in the development of a linear regression (LR) model that outperformed existing empirical rules, providing more precise predictions. Agrawal et al. [30] and other researchers employed data analysis tools to establish correlations between different properties of alloys, their compositions, and manufacturing process parameters. They explored various data analysis techniques to successfully predict the fatigue strength of steels. Gebhard et al. [31] adopted a data-driven machine learning approach to predict the fatigue strength of ductile iron microstructures. They utilized stability analysis techniques on metallographic data to derive accurate predictions. Malinov et al. [32] developed a model utilizing ANN to analyze and predict the relationship between machining parameters and mechanical properties of titanium alloys. This model offers insights for optimizing machining and heat treatment parameters, enabling enhanced performance in the manufacturing process. Duan et al. [33] suggested new fatigue strength prediction model based on tensile strength is pro-posed by exploring the relationship between tensile strength and hardened strength, which not only reduces the experimental cost but also improves the prediction efficiency. Methods for automatically learning complex feature relationships from data to predict fatigue strength are currently being explored. Therefore, there is a need to investigate efficient and accurate deep learning methods for fatigue strength prediction.
Among various artificial intelligence techniques, deep learning is currently the most widely employed method, facilitating rapid parameter acquisition for fatigue analysis and design, thereby accelerating material application processes [34,35,36,37]. This paper presents a deep learning regression model designed to efficiently and accurately predict fatigue strength. The model leverages deep learning techniques to estimate the durability of materials subjected to long-term cyclic stress loading by automatically learning complex feature relationships from the data, thereby enhancing predictive capabilities. The integration of appropriate loss functions, optimization algorithms, and regularization techniques further improves the model’s accuracy and generalization ability. This study aims to explore the intricate relationships between input features and fatigue strength, with the goal of improving predictive performance using additional fatigue strength test data for future applications. A new fatigue strength prediction method is proposed by combining the prediction capabilities of convolutional neural networks (CNN) and LSTM networks. Through the training, optimization, and performance evaluation of an established fatigue strength dataset, the CNN-LSTM model demonstrates enhanced accuracy and application performance in predicting fatigue strength. The novel contributions of this paper are as follows:
In this paper, the advantages of CNN network for extracting local features and LSTM for handling time series data processing are utilized to combine the advantages of CNN and LSTM models. The proposed model is applied to the prediction of metal fatigue strength, which provides an important support and extension to the traditional methods, and the model will improve the accuracy and efficiency of fatigue strength prediction; Bayesian optimization algorithm is used to optimize the hyperparameters of deep learning, conventional deep learning models are very time-consuming to manually adjust the parameters, the use of Bayesian optimization can greatly save the search time and improve the efficiency of optimization.
The remaining sections are organized as follows: Section 2 provides an overview of the deep learning regression model used in this study and discusses the evaluation metrics employed. Section 3 details the fatigue strength prediction method, including the model evaluation on a test set and an assessment of the model’s performance. Section 4 offers a comprehensive discussion of the results and provides recommendations for future research.

2. Models and Methodology

2.1. Data Processing

Data were collected from MakeItFrom [38] for a total of 1757 ferrous alloys, with 20 input features and one output feature, as detailed in Table 1.
To ensure data quality, the dataset underwent preprocessing steps, including filtering to remove outliers and anomalous entries. Missing values in alloy components were replaced with zeros, while missing values in other performance characteristics were imputed using overall averages.
Before training and predicting with the deep learning model, data standardization was employed to enhance the model’s performance, generalization ability, and interpretability. Standardization is crucial for avoiding errors and biases caused by differing feature scales, making features comparable, and accelerating model training. In data analysis and deep learning, standardization contributes to model accuracy and robustness by converting data from different units or scales into a comparable form. Common standardization methods include min-max scaling, standard deviation standardization (Z-score normalization), and decimal scaling.
Given that Z-score normalization effectively mitigates the issues of gradient explosion or vanishing gradients, this method was chosen for normalizing the fatigue feature dataset. This approach reduces the magnitude differences between features, making the data easier to compare and analyze, thereby improving the precision of data analysis and model accuracy. The formula for Z-score standardization is provided in the following equation:
Z = x μ σ
where x is the original sample data, μ is the sample mean, σ is the sample standard deviation, Z is the standardized sample data.
Before training the predictive model and making fatigue strength predictions, the dataset was randomly divided into two subsets: a training set and a test set. In this paper, an 80% random selection of samples was assigned to the training dataset, while the remaining 20% was allocated to the test dataset. This partitioning strategy ensures a fair evaluation of the model’s performance on unseen data.

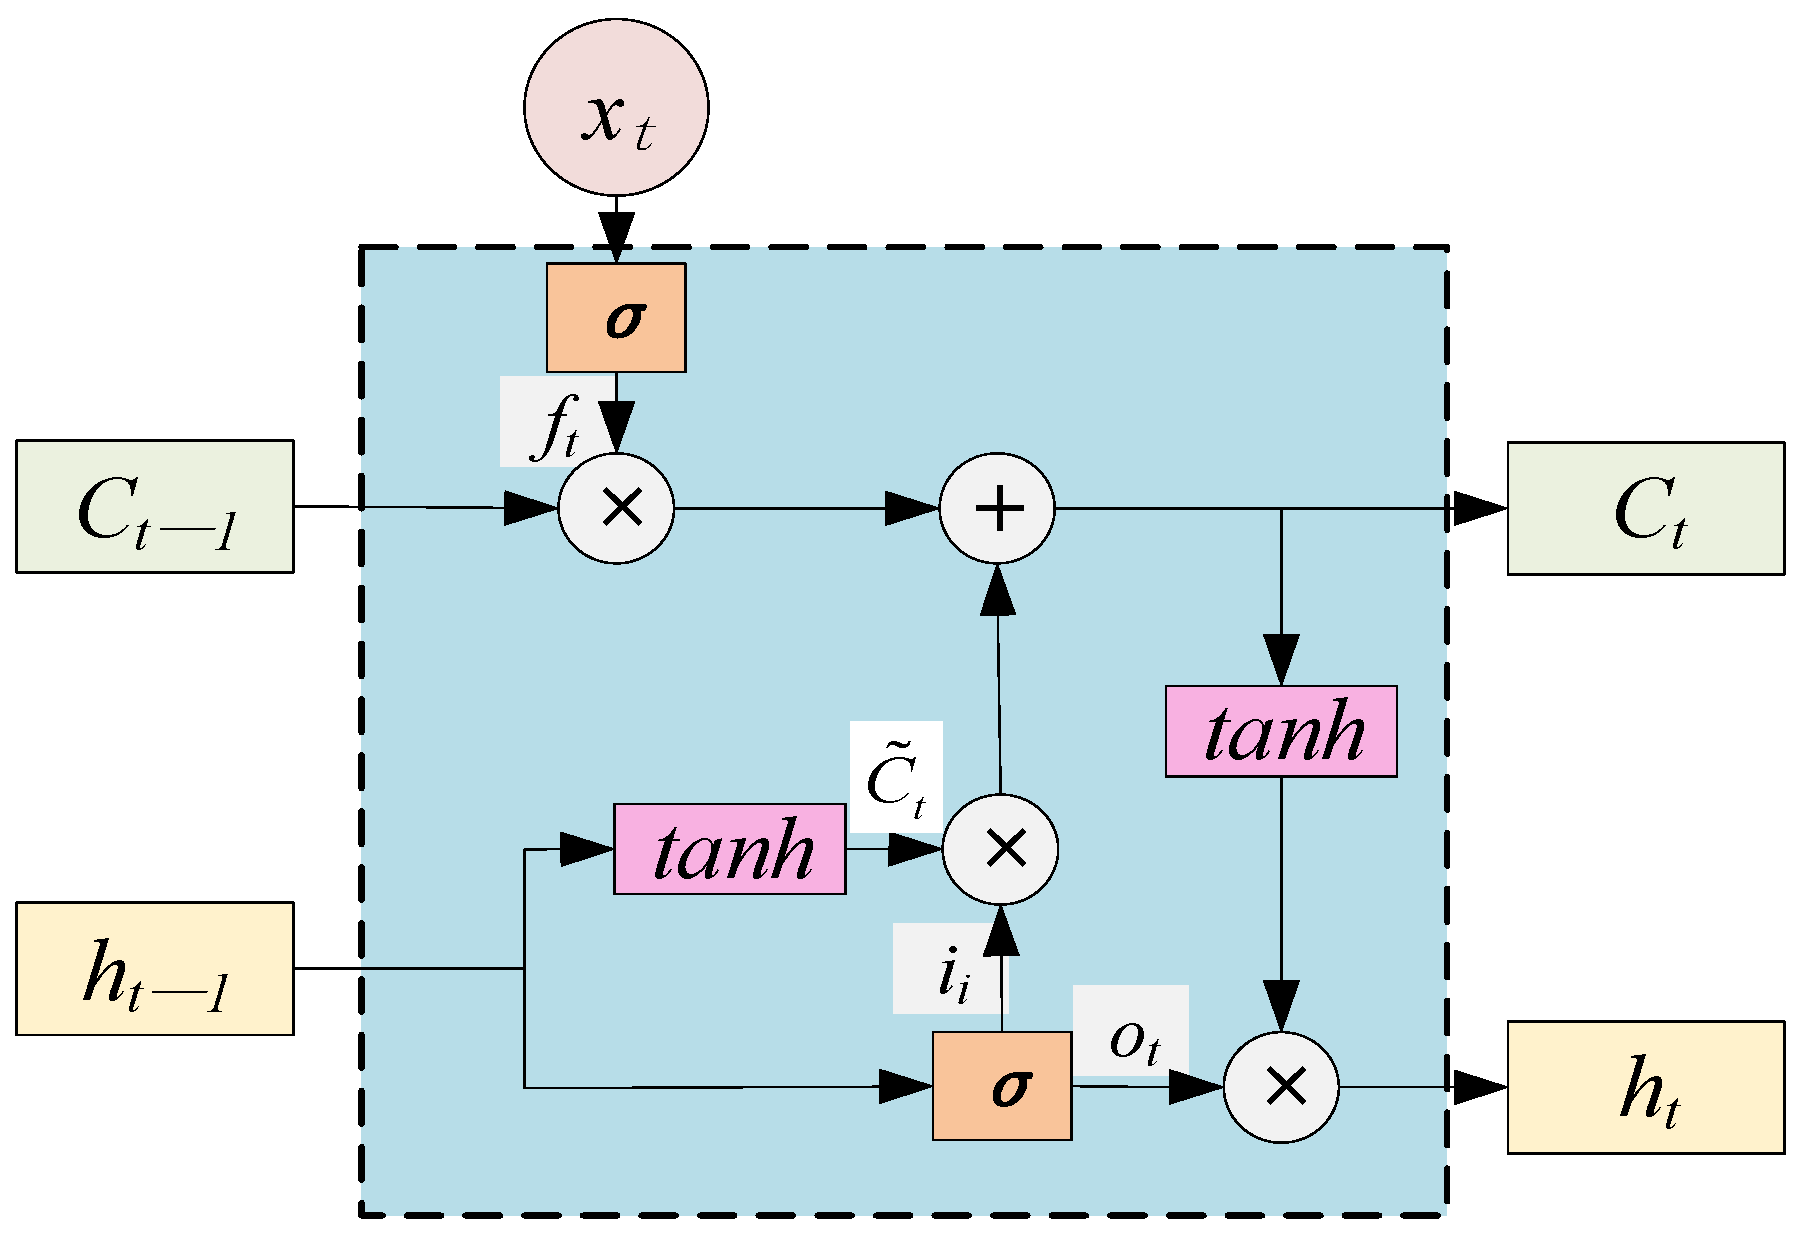
2.2. Deep Learning Regression Predictive Models

Deep learning algorithms can be broadly categorized into four main types: unsupervised learning algorithms, such as clustering and dimensionality reduction techniques, and supervised learning algorithms, which include classification and regression methods. Regression algorithms are specifically designed to model and describe continuous relationships between variables. The research presented in this paper addresses the prediction problem involving multiple input variables and a single output variable, classifying it as a regression problem.
In this paper, an CNN-LSTM model is proposed to analyze and predict the relationship between input variables and fatigue strength output. In order to evaluate the contribution and effect of different components in the model, as well as to further assess the effectiveness of the proposed model, a series of comparative experiments including CNN [39], RNN [40], GRU [41], LSTM [42], Transformer [15] and LeNet5 [43] models are conducted. The proposed model methodology is as follows:
CNN is a type of neural network; it is a feed forward neural network with a convolutional structure. Convolutional neural networks mainly include: an input layer, convolutional layer, activation layer, pooling layer, fully connected layer, output layer and other structures, in which the convolutional layer, activation layer, and pooling layer can be used repeatedly on top of each other—a structural feature that differentiates convolutional neural networks from other neural networks. The formula for the convolutional layer is shown in the following:
x ( t ) h ( t ) ( τ ) = + x ( τ ) h ( τ t ) d t
First proposed by Hochreiter and Schmidhuber in 1997, LSTM is a special kind of recurrent neural network designed to solve long-term dependency problems. The core of LSTM is the cell state. LSTM networks add and remove cell states through a gate structure. Three gates are included in an LSTM, namely: the forget gate, input gate, and output gate. A standard LSTM module is shown in Figure 1.
The first step of LSTM is to decide the cell state information that needs to be discarded, and this process is realized through the forget gate f t . This is achieved by looking at the information in h t 1 and x t to output a vector between 0 and 1, and the output of the vector determines the information that needs to be discarded and retained in the cell state C t 1 , with 0 indicating the discarding and 1 indicating the retention:
f t = σ ( W f h t 1 , x t + b f )
The second step is to decide on the added information for the cell state, which is divided into two main steps: first, deciding which information to update through the input gate it, and then h t 1 and x t getting the new candidate cell information through the tanh layer C ˜ t :
i t = σ ( W i h t 1 , x t + b i )
C ˜ t = tanh ( W c h t 1 , x t + b c )
Update old cell info state C t 1 to new cell info C t :
C t = f t C t 1 + i t C ˜ t
After updating the new cell information it is necessary to judge the state characteristics of the output cell, the input through the output gate o t to get the judgment condition, the cell state through the tanh layer to get a vector between −1 to 1, the judgment condition of the output gate, and the output of the tanh multiply to get the final output:
o t = σ ( W o h t 1 , x t + b o )
h t = o t tanh ( C t )
The CNN is combined with the LSTM model to form a CNN-LSTM integrated model, the structure of which is shown in Figure 2.

2.3. Model Evaluation

These metrics include the coefficient of determination (R2), root mean square error (RMSE), mean absolute error (MAE), and mean absolute percentage error (MAPE). The equations for Model evaluation metrics are as follows:
R 2 = 1 i = 1 n ( y i y i ^ ) 2 i = 1 n ( y i y ¯ ) 2
R M S E = 1 n i = 1 n ( y i y i ^ ) 2
M A E = 1 n i = 1 n y i ^ y i
M A P E = 1 n i = 1 n y i ^ y i y i

2.4. Fatigue Strength Prediction Method

The fatigue strength prediction method is outlined as follows. It primarily involves the following steps:
  • Data Collection: Gathering data on key features that influence the fatigue strength of ferrous alloys to construct a comprehensive dataset.
  • Data Preprocessing: Addressing missing and anomalous data within the dataset and conducting an inter-feature importance analysis to ensure data quality.
  • Dataset Splitting: Randomly dividing the complete dataset into a training set and a testing set, typically following an 80:20 ratio.
  • Model Training and Prediction: Applying deep learning regression models to train on the dataset and predict fatigue strength values.
  • Model Evaluation and Comparative Analysis: Evaluating the performance of various prediction models, including CNN, RNN, GRU, LSTM, and CNN-LSTM, and conducting a comparative analysis to assess their predictive accuracy.
By following this framework, this paper aims to efficiently predict fatigue strength and compare the performance of different regression models.

3. Results Analysis

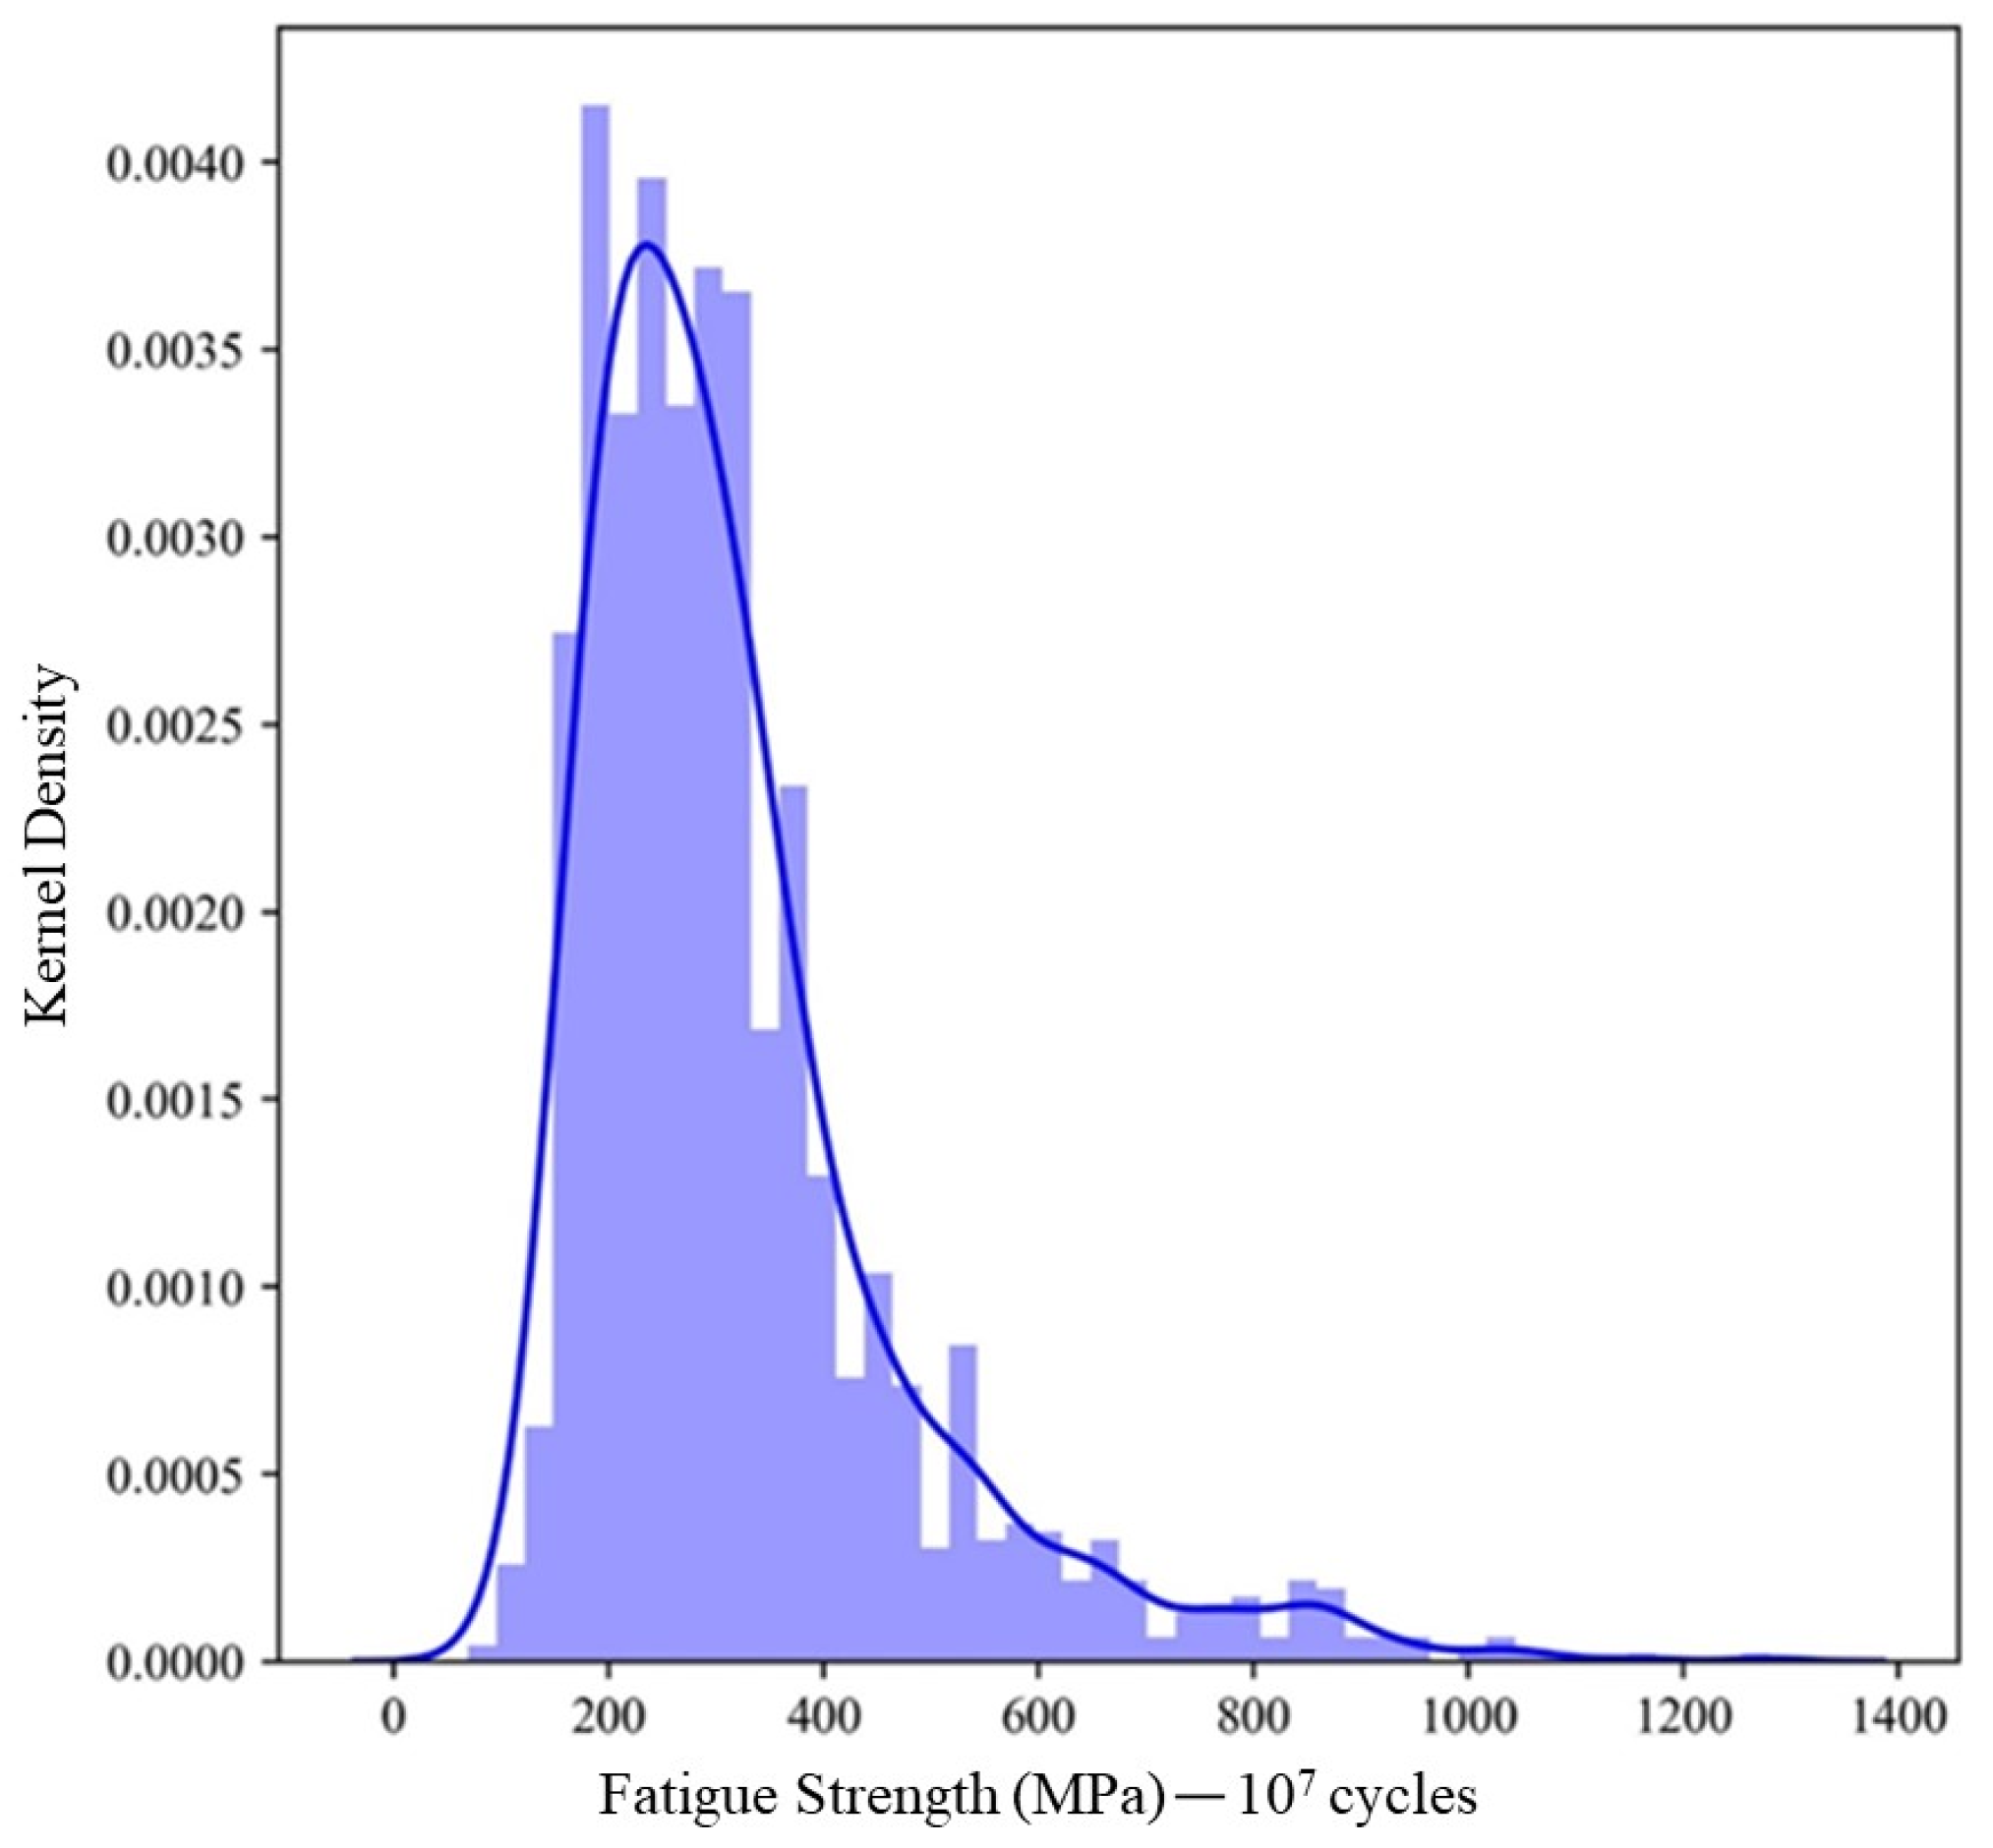
3.1. Fatigue Strength Distribution

The distribution of the predicted output fatigue strength in the dataset was thoroughly analyzed and visualized by plotting its kernel density line and histogram, as illustrated in Figure 3. This analysis offers valuable insights into the overall distribution pattern of the predicted fatigue strength values, providing a clear understanding of their range and variability.
Based on the graph, it is evident that the fatigue strength values in the dataset span a wide range from 70 MPa to 1200 MPa. However, most of the fatigue strength data appear to be concentrated between 150 and 600 MPa. This observation suggests that a significant portion of the samples in the dataset exhibit fatigue strengths within this range.

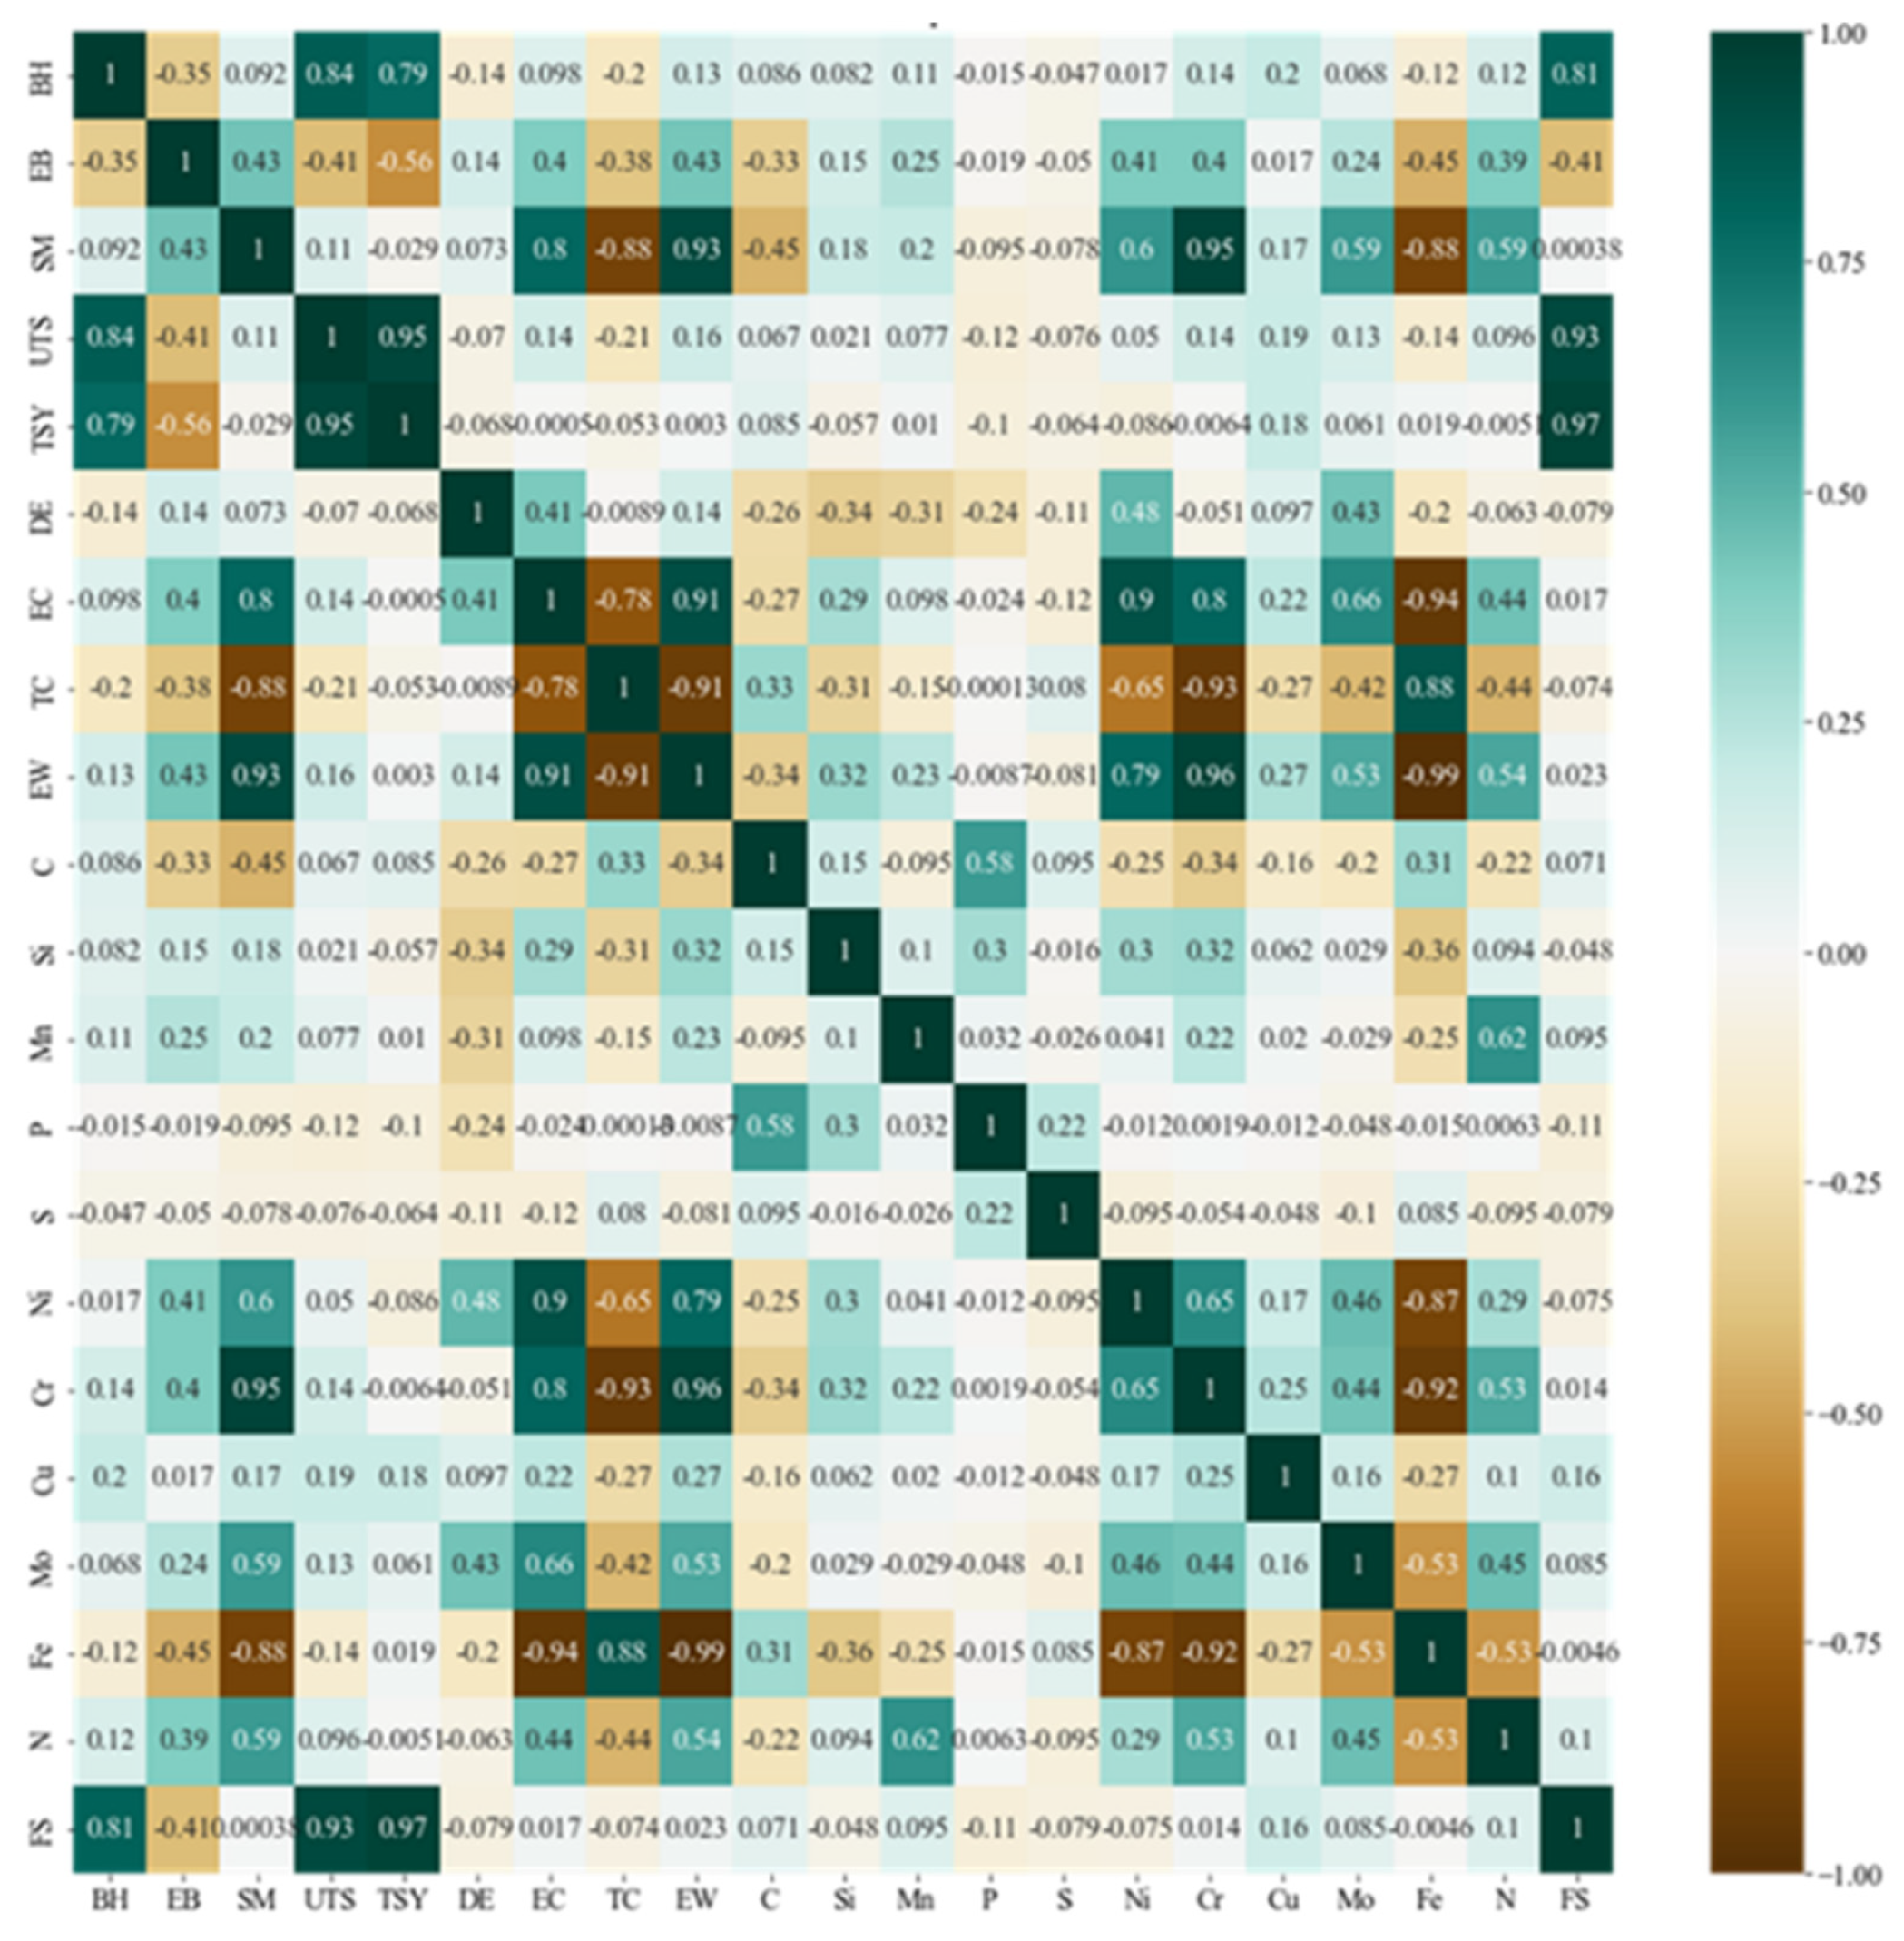
3.2. Feature Analysis

Feature analysis is a crucial procedure for assessing the influence of each feature in a dataset on the target variable. It is widely applied in deep learning and data mining to understand the relationship between individual features and the target variable. This process helps identify the most significant features for model training and optimization. Various techniques for feature importance analysis include the correlation coefficient method [44], analysis of variance, and decision tree algorithms. In this paper, we specifically utilize the Pearson correlation coefficient method. To gain an initial understanding of the relationships among the features, we conducted a feature importance analysis using the Pearson correlation coefficient. This analysis involved calculating the correlation coefficients for the 20 input features and their relationship with fatigue strength. The resulting coefficients were then plotted, as shown in Figure 4, providing insights into the strength and direction of the correlations between the input features and fatigue strength.
PC ( x , y ) = i = 1 n ( x i x ¯ ) ( y i y ¯ ) i = 1 n x i x ¯ 2 y i y ¯ 2
where x ¯ and y ¯ is the mean of and n is the number of samples in the dataset.
Figure 4 reveals strong correlations between fatigue strength and certain mechanical properties, such as ultimate tensile strength, Brinell hardness, and yield strength. The correlation coefficients for these parameters exceed 0.8, indicating a robust relationship. Additionally, the Fe, Ni, and Cr contents in the alloy show strong correlations with other variables such as electrical conductivity (EC), thermal conductivity (TC), and elastic modulus (EW). Moreover, Fe content exhibits a negative correlation with the content of rare elements. To comprehensively investigate the factors influencing the fatigue strength of ferrous alloys, all 20 collected features were used as inputs for the prediction model, ensuring that the model captures the complex relationships between the features and the target variable.

3.3. Network Hyperparameter Settings

Hyper-parameter tuning is crucial in deep learning model construction, and Bayesian optimization becomes an ideal choice for hyper-parameter optimization by virtue of the a priori updating of Gaussian process, fewer iterations, faster convergence, good ro-bustness, and the ability to effectively avoid local optimum.
The CNN-LSTM network fatigue strength prediction model is constructed. Then, the CNN-LSTM model is trained using the training set. Bayesian parameter optimization is carried out by combining the model evaluation indexes and the minimization objective function. The optimization intervals of the main parameters of the convolutional layer, the random discarding layer, the LSTM layer, and the fully-connected layer are set, and optimization is carried out for the six main parameters of the constructed CNN-LSTM network model. All parameter optimization results are recorded after several rounds of training and optimization. After training and optimization, all the parameter optimization results are recorded, and the best model parameters of the integrated CNN-LSTM network fatigue strength prediction model and its final setting results are shown in Table 2.

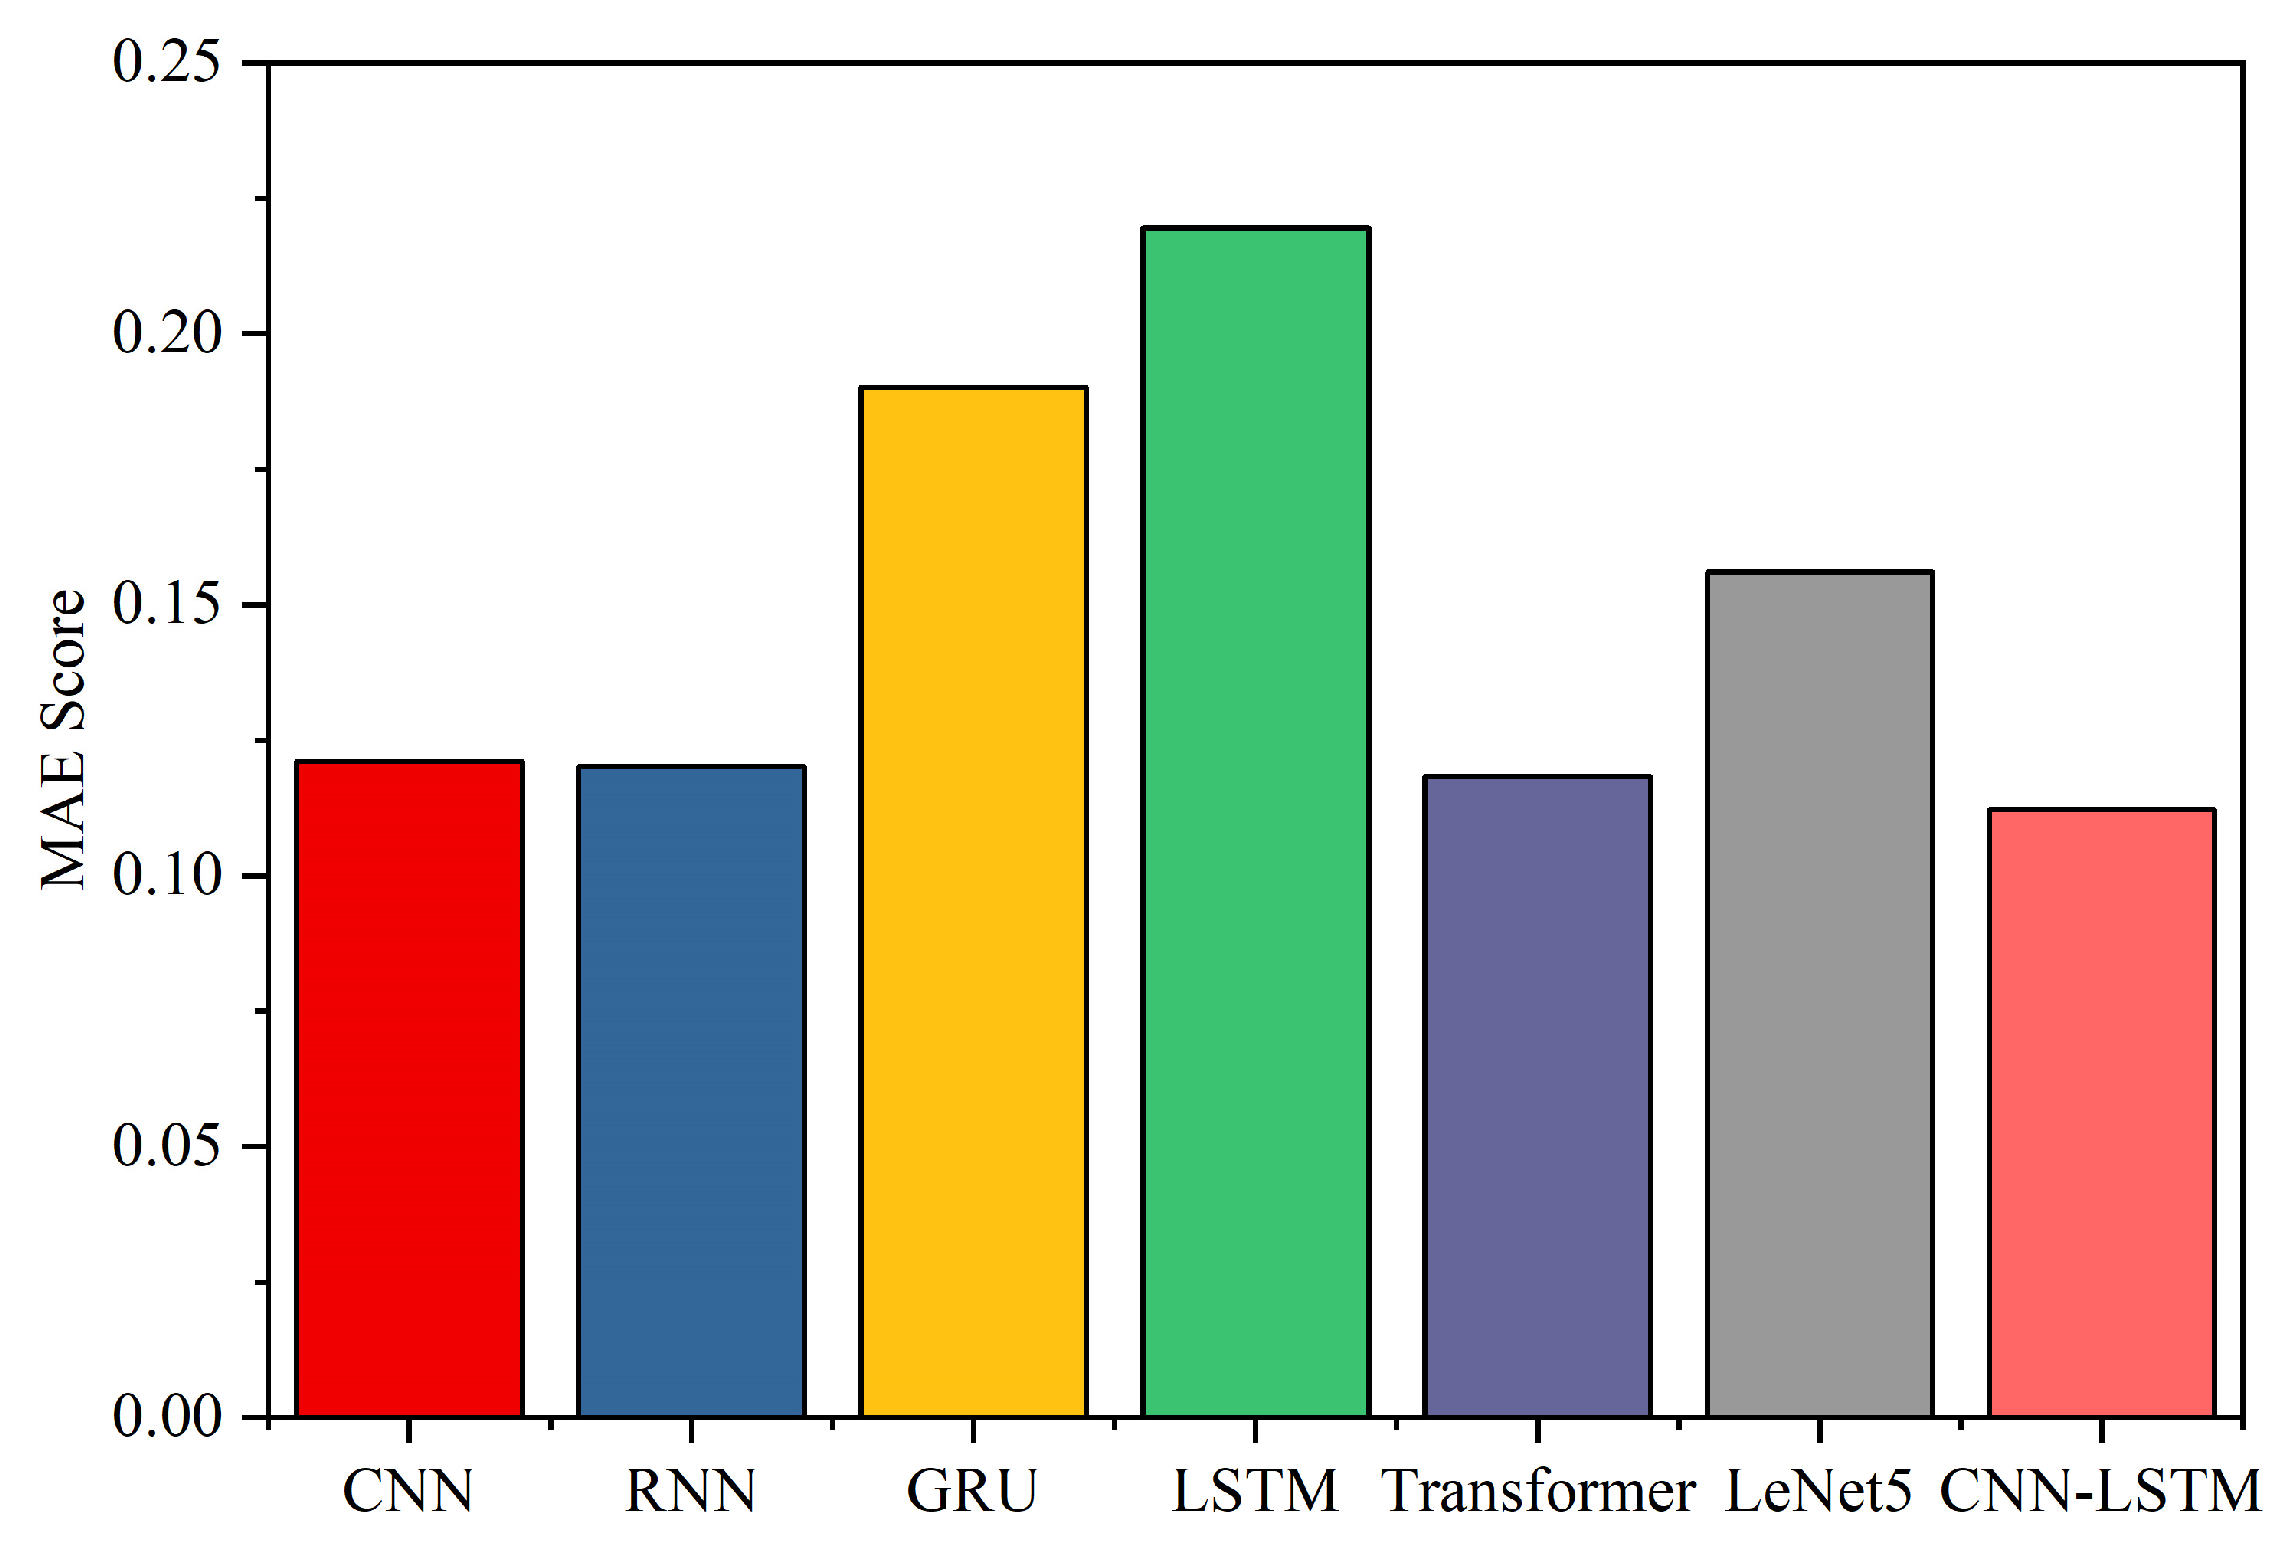
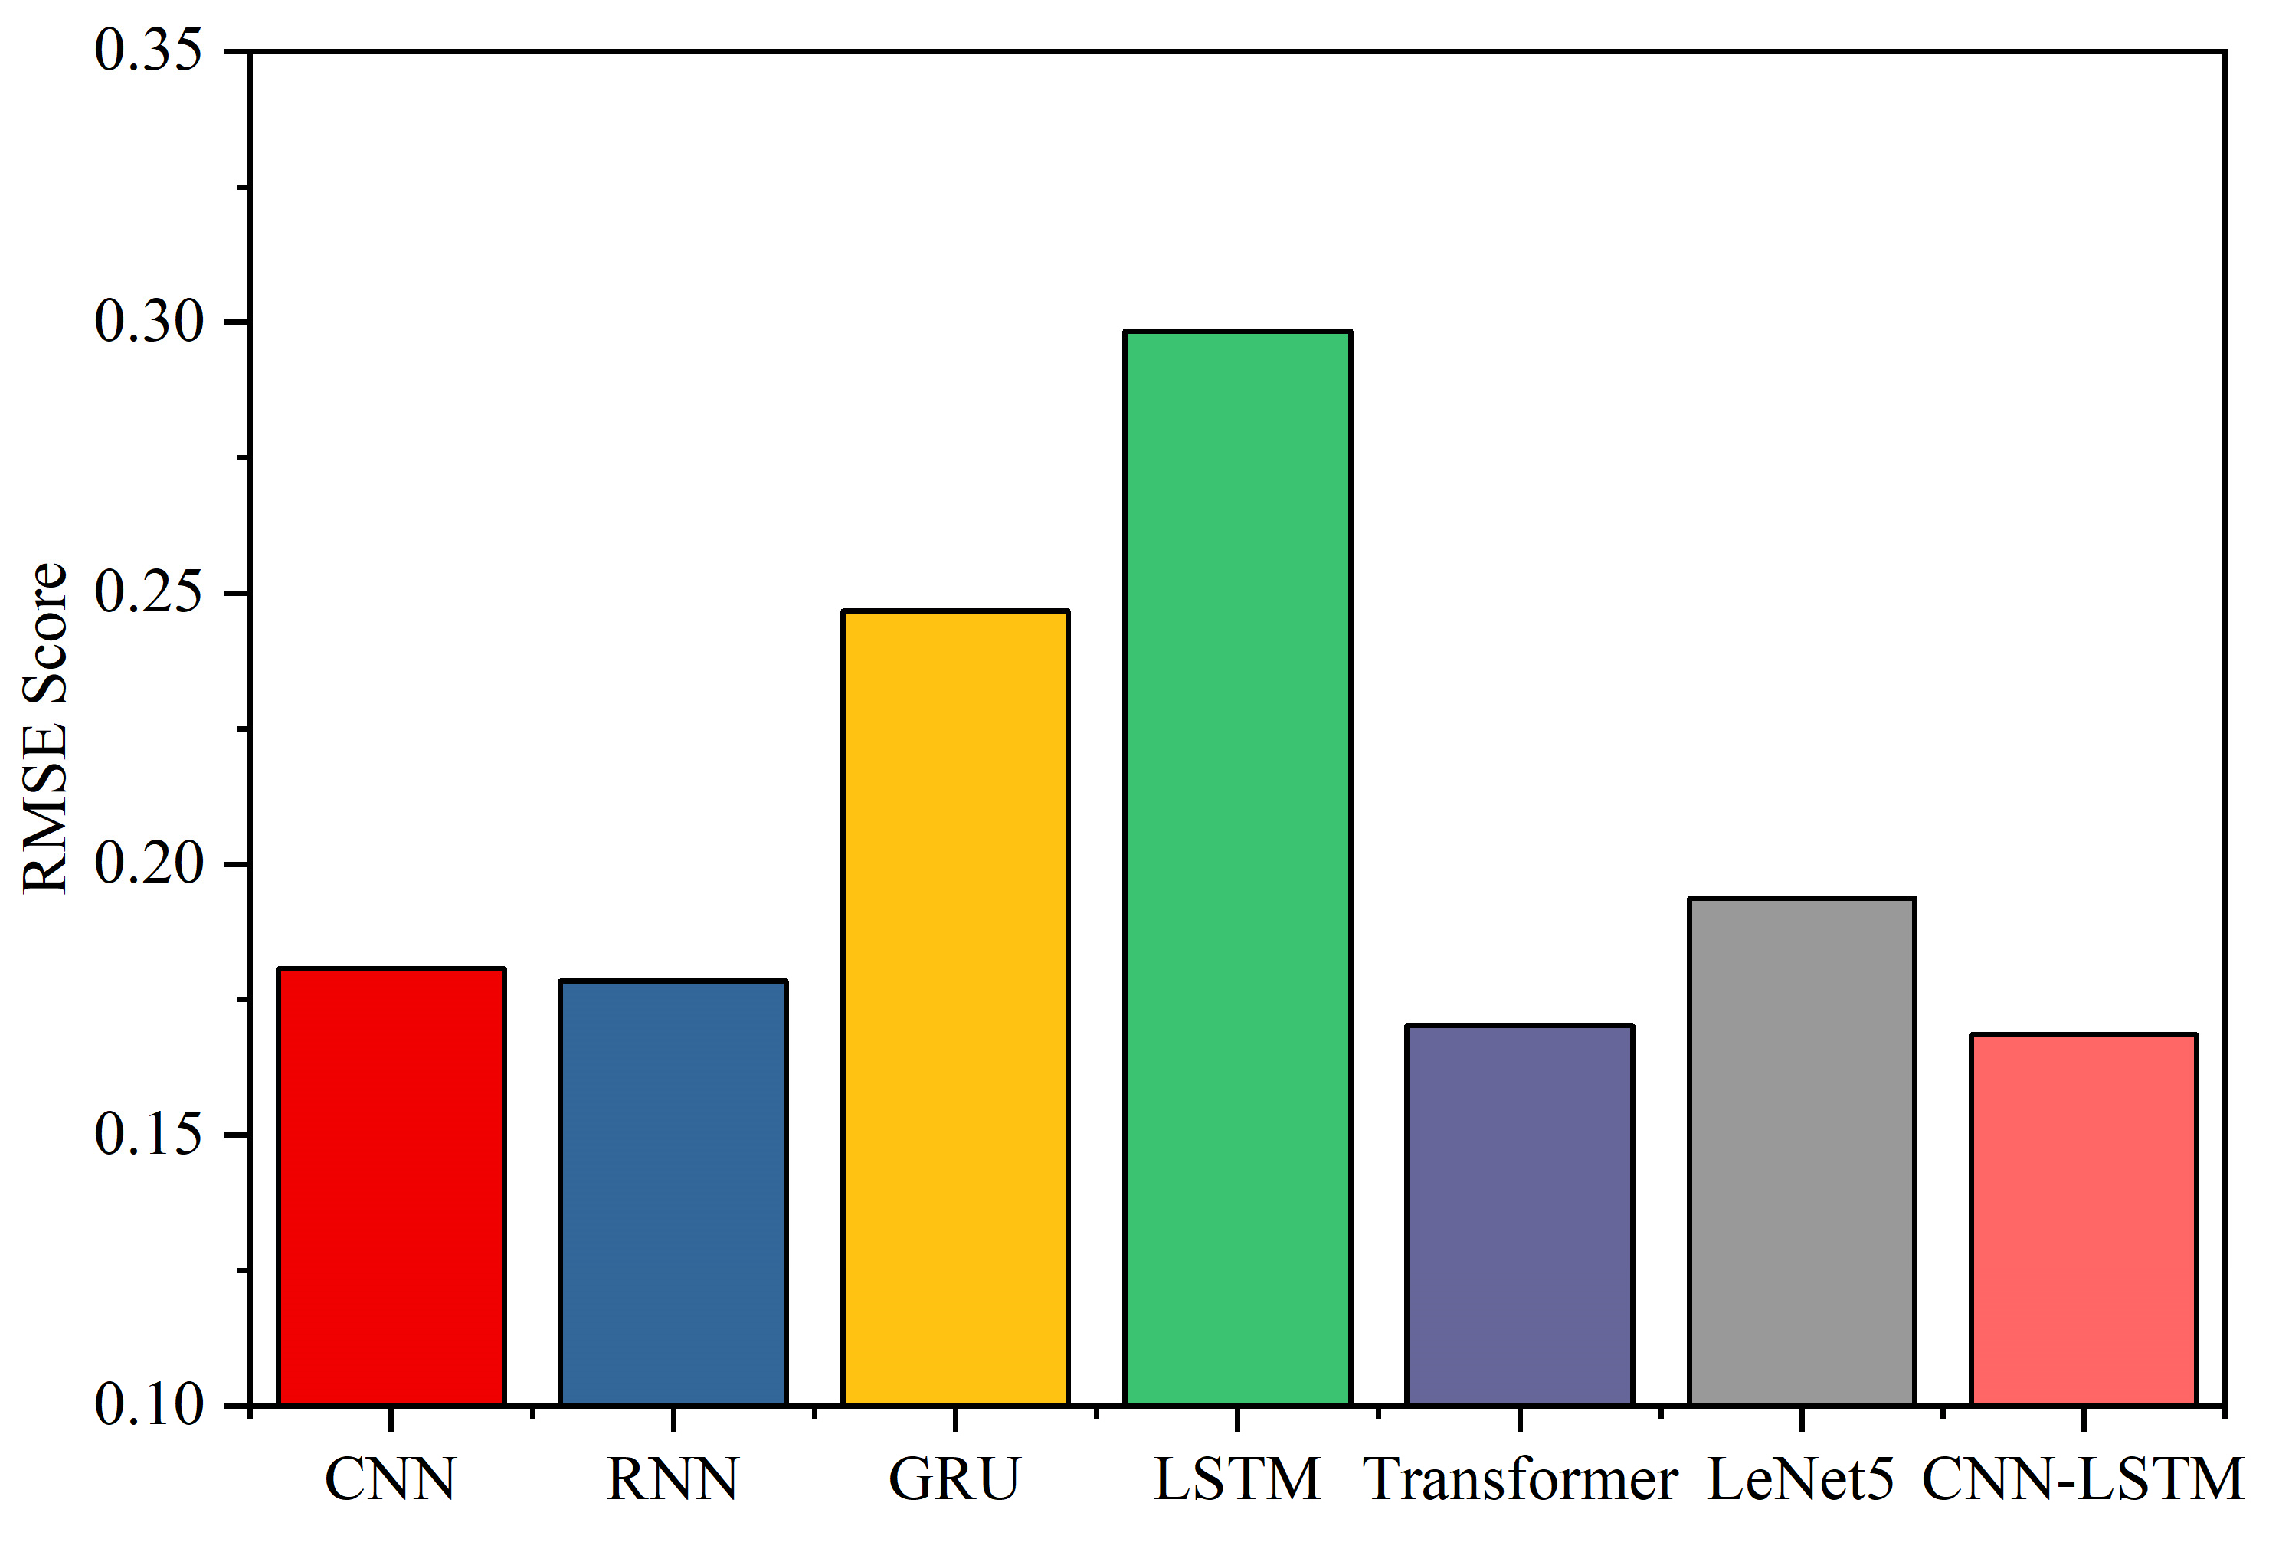
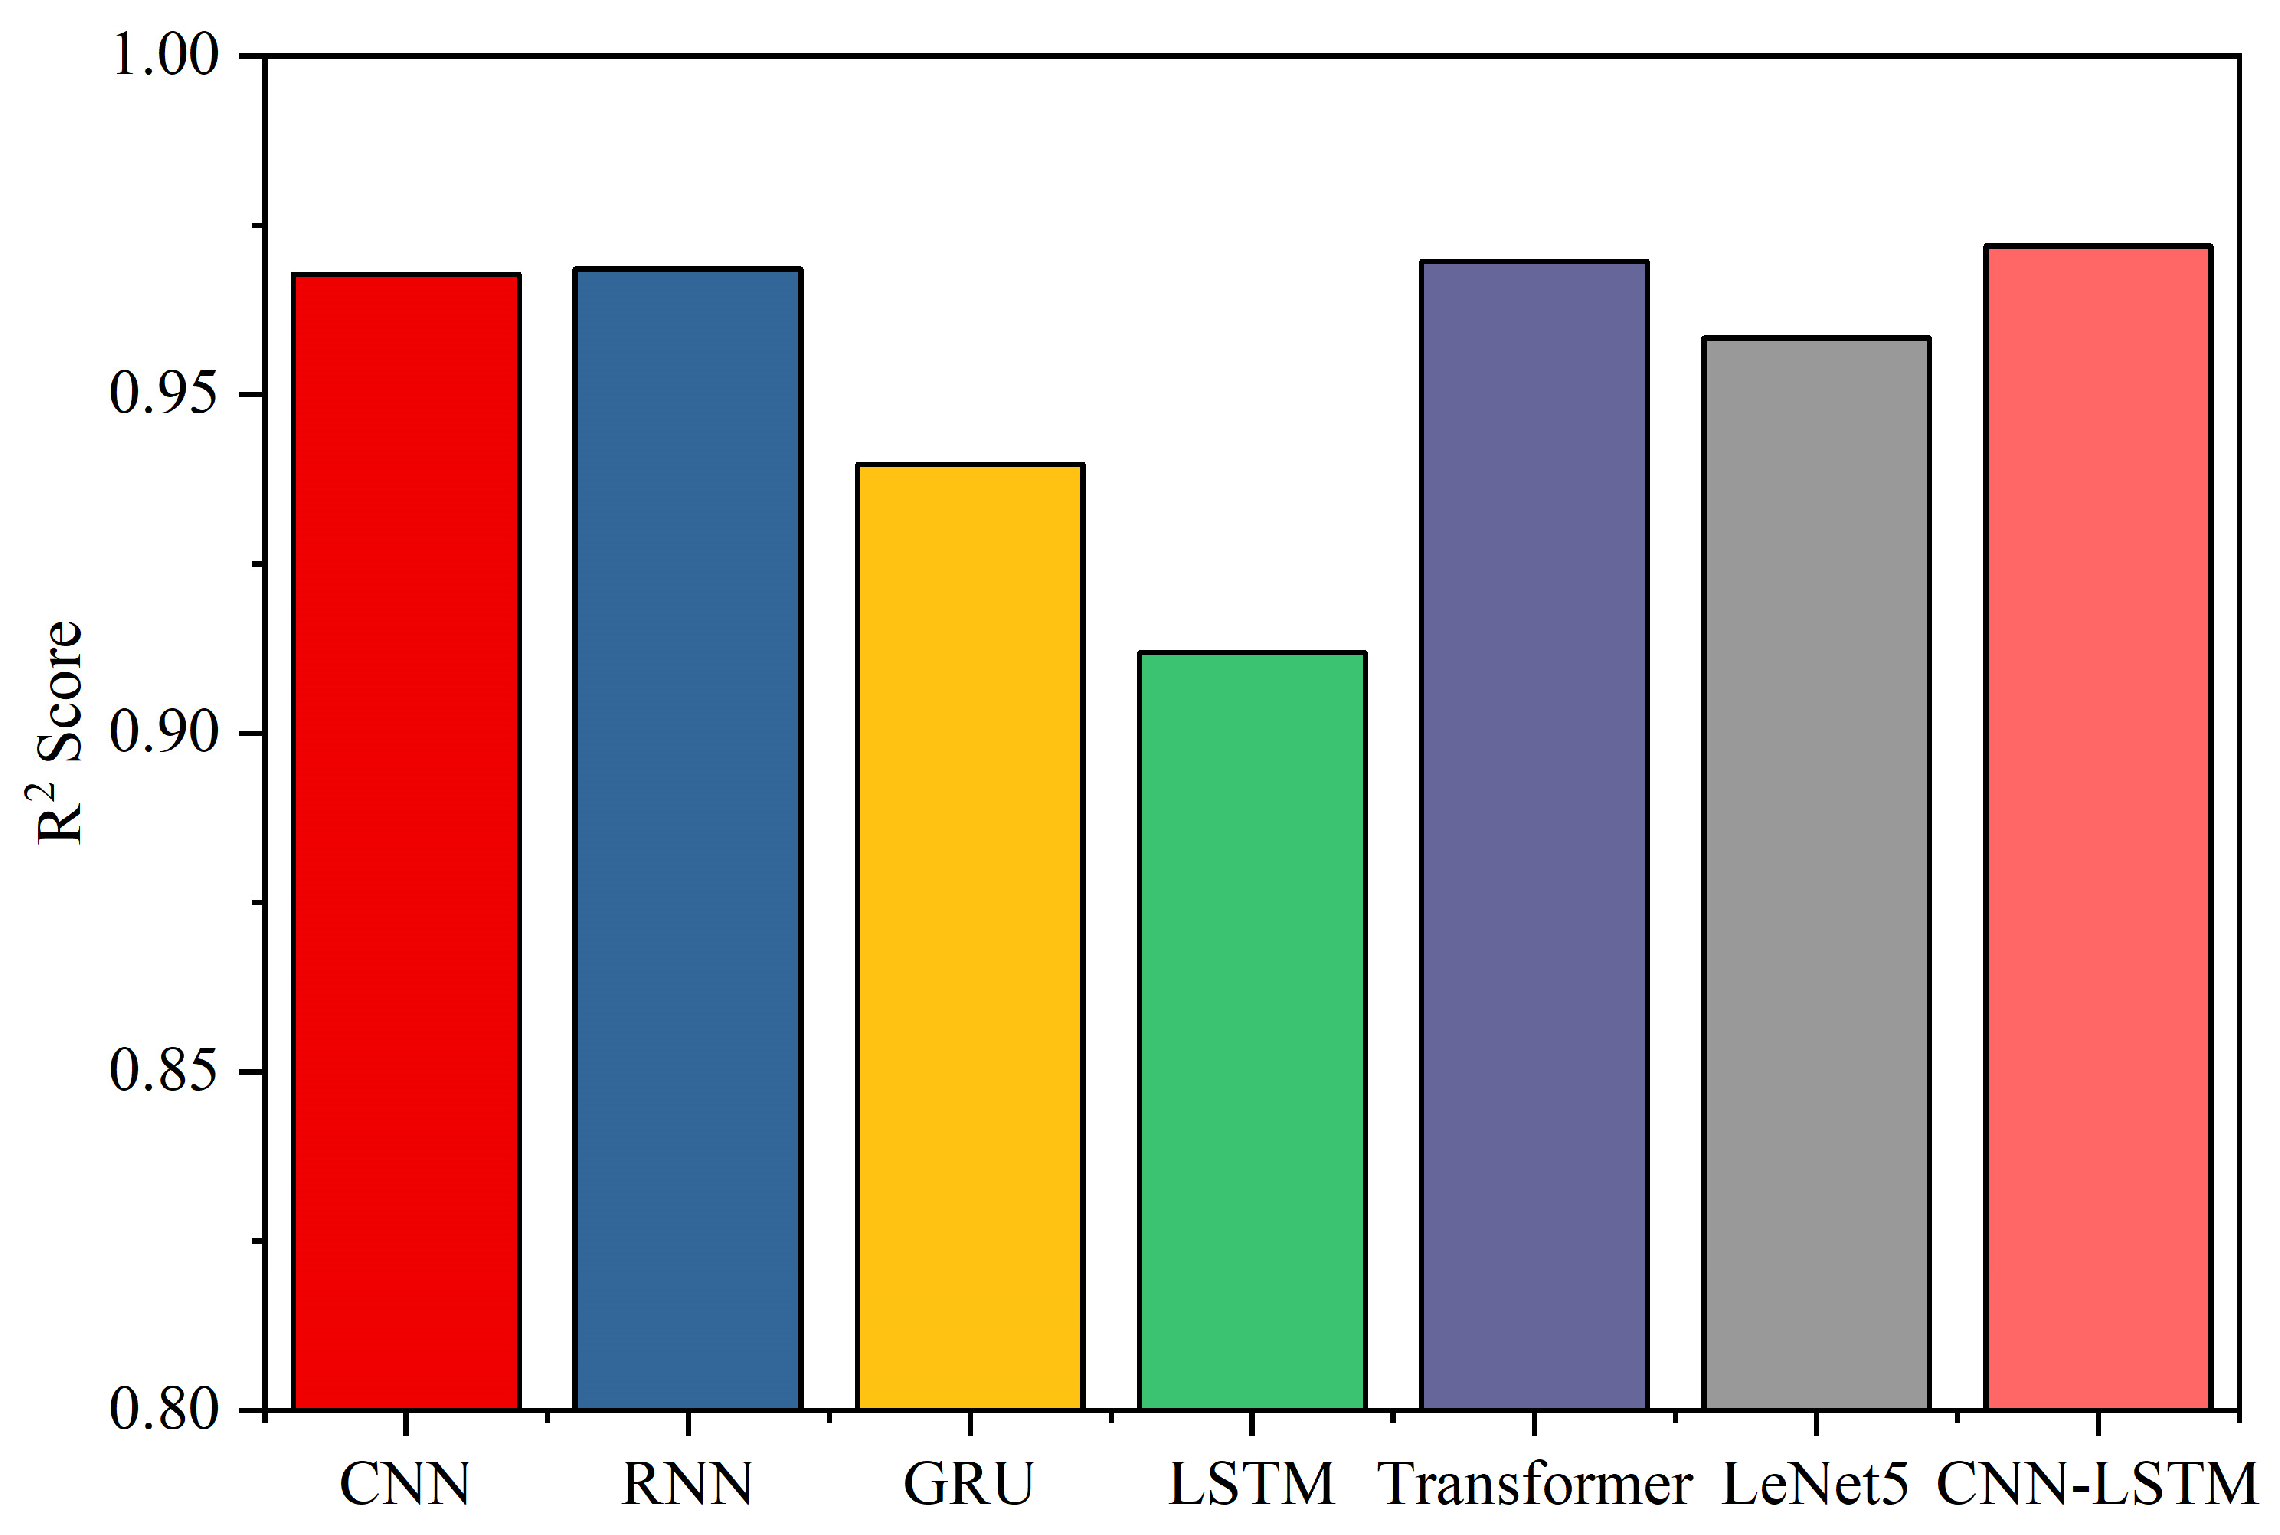
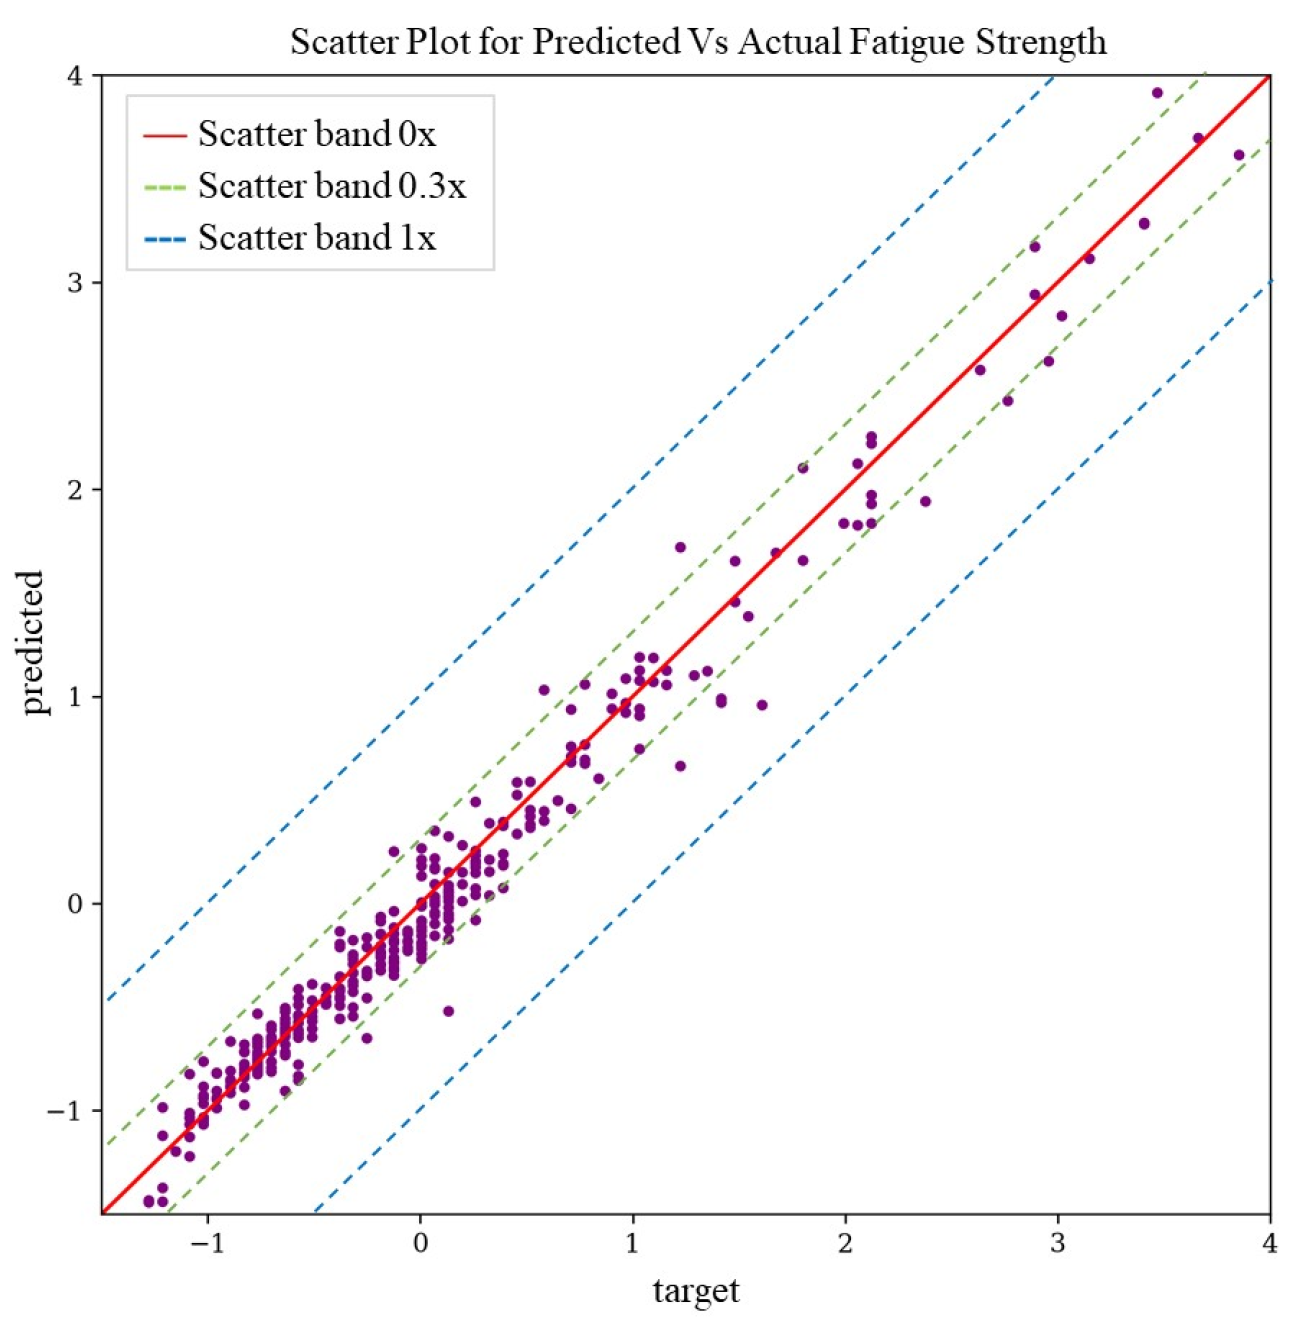
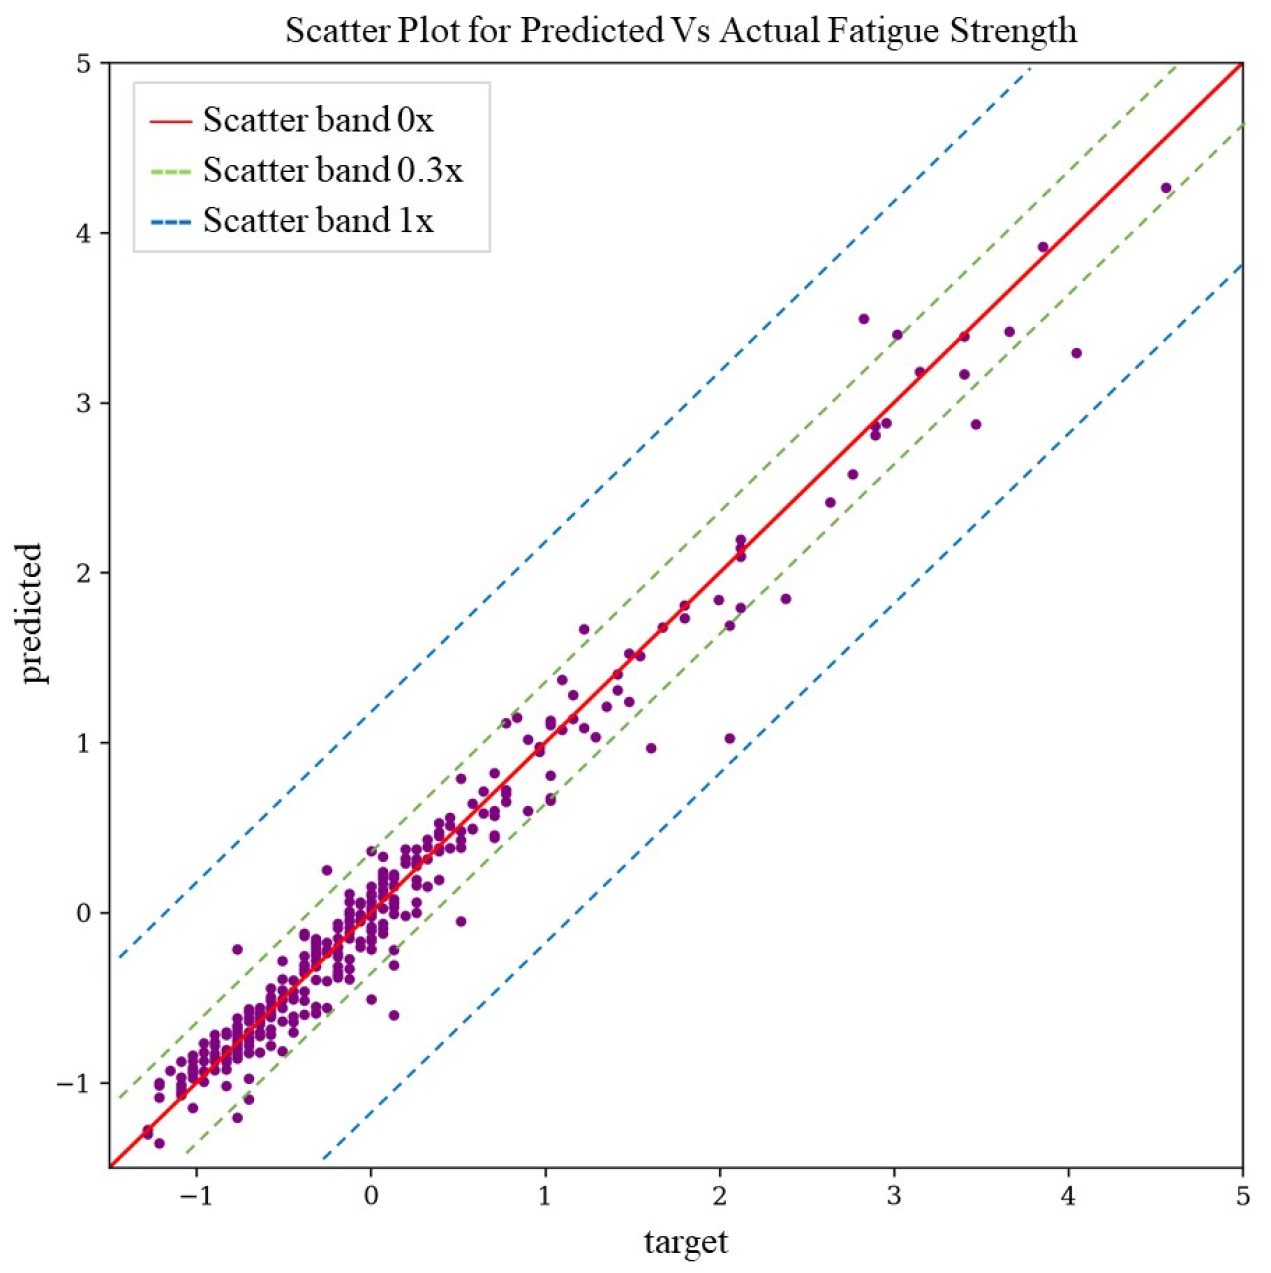
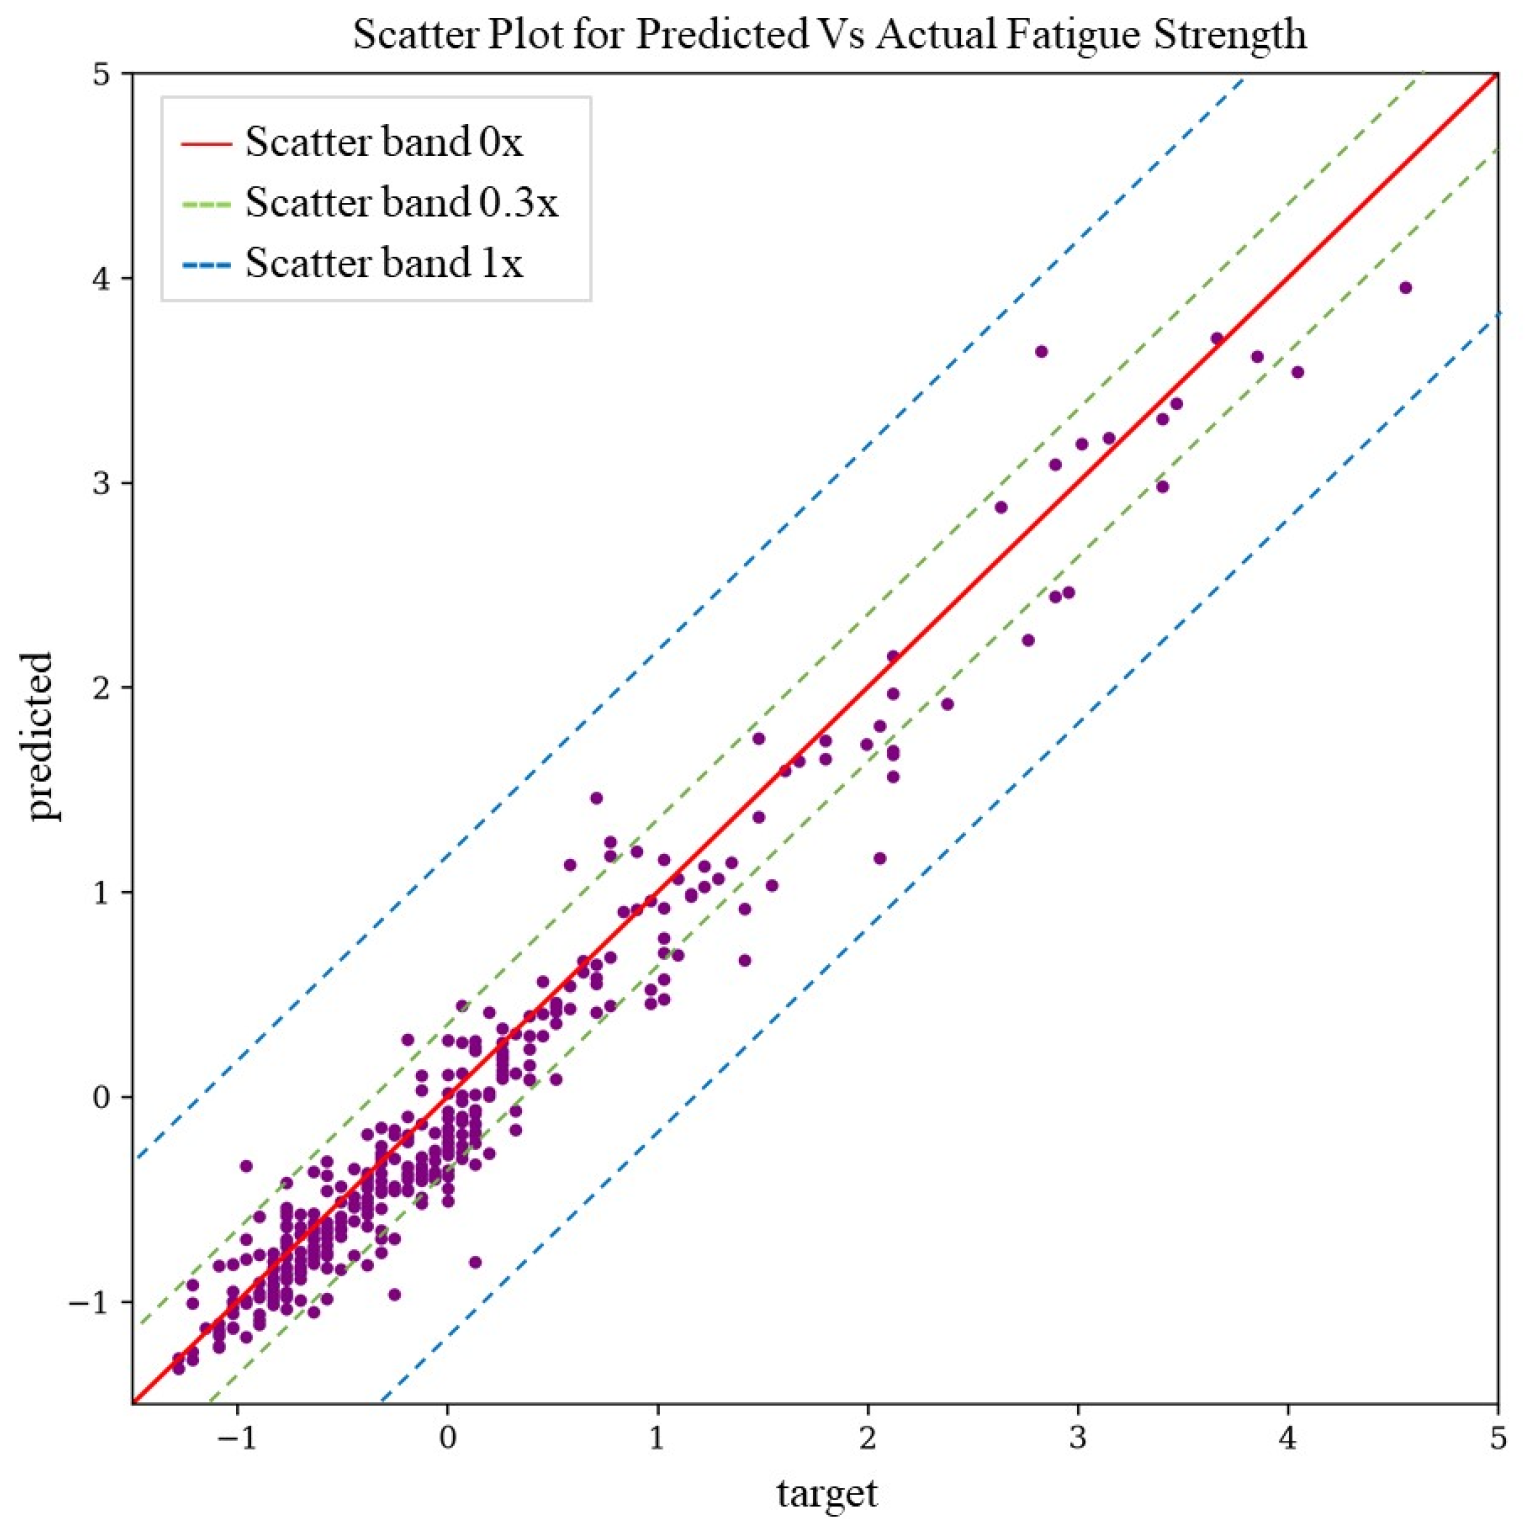
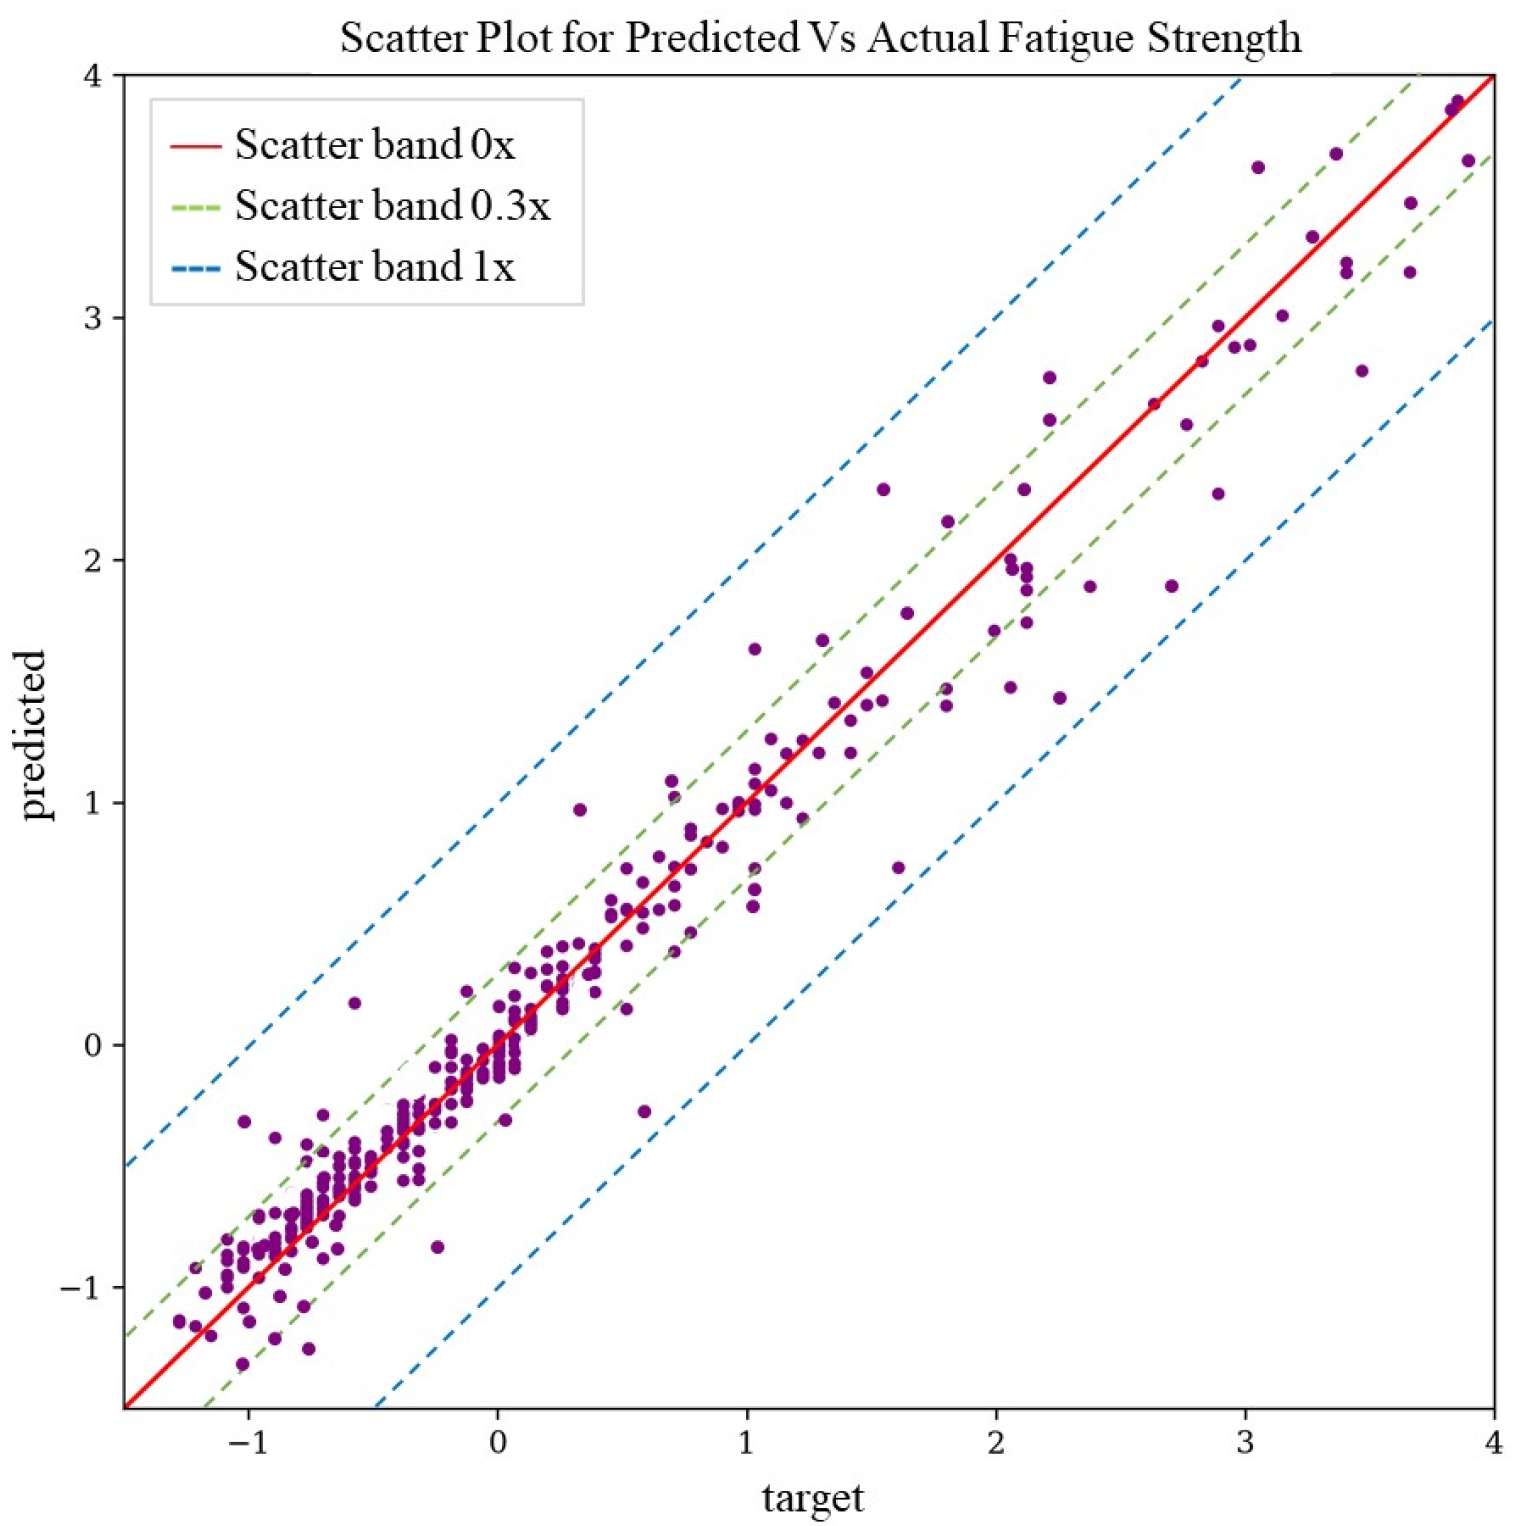
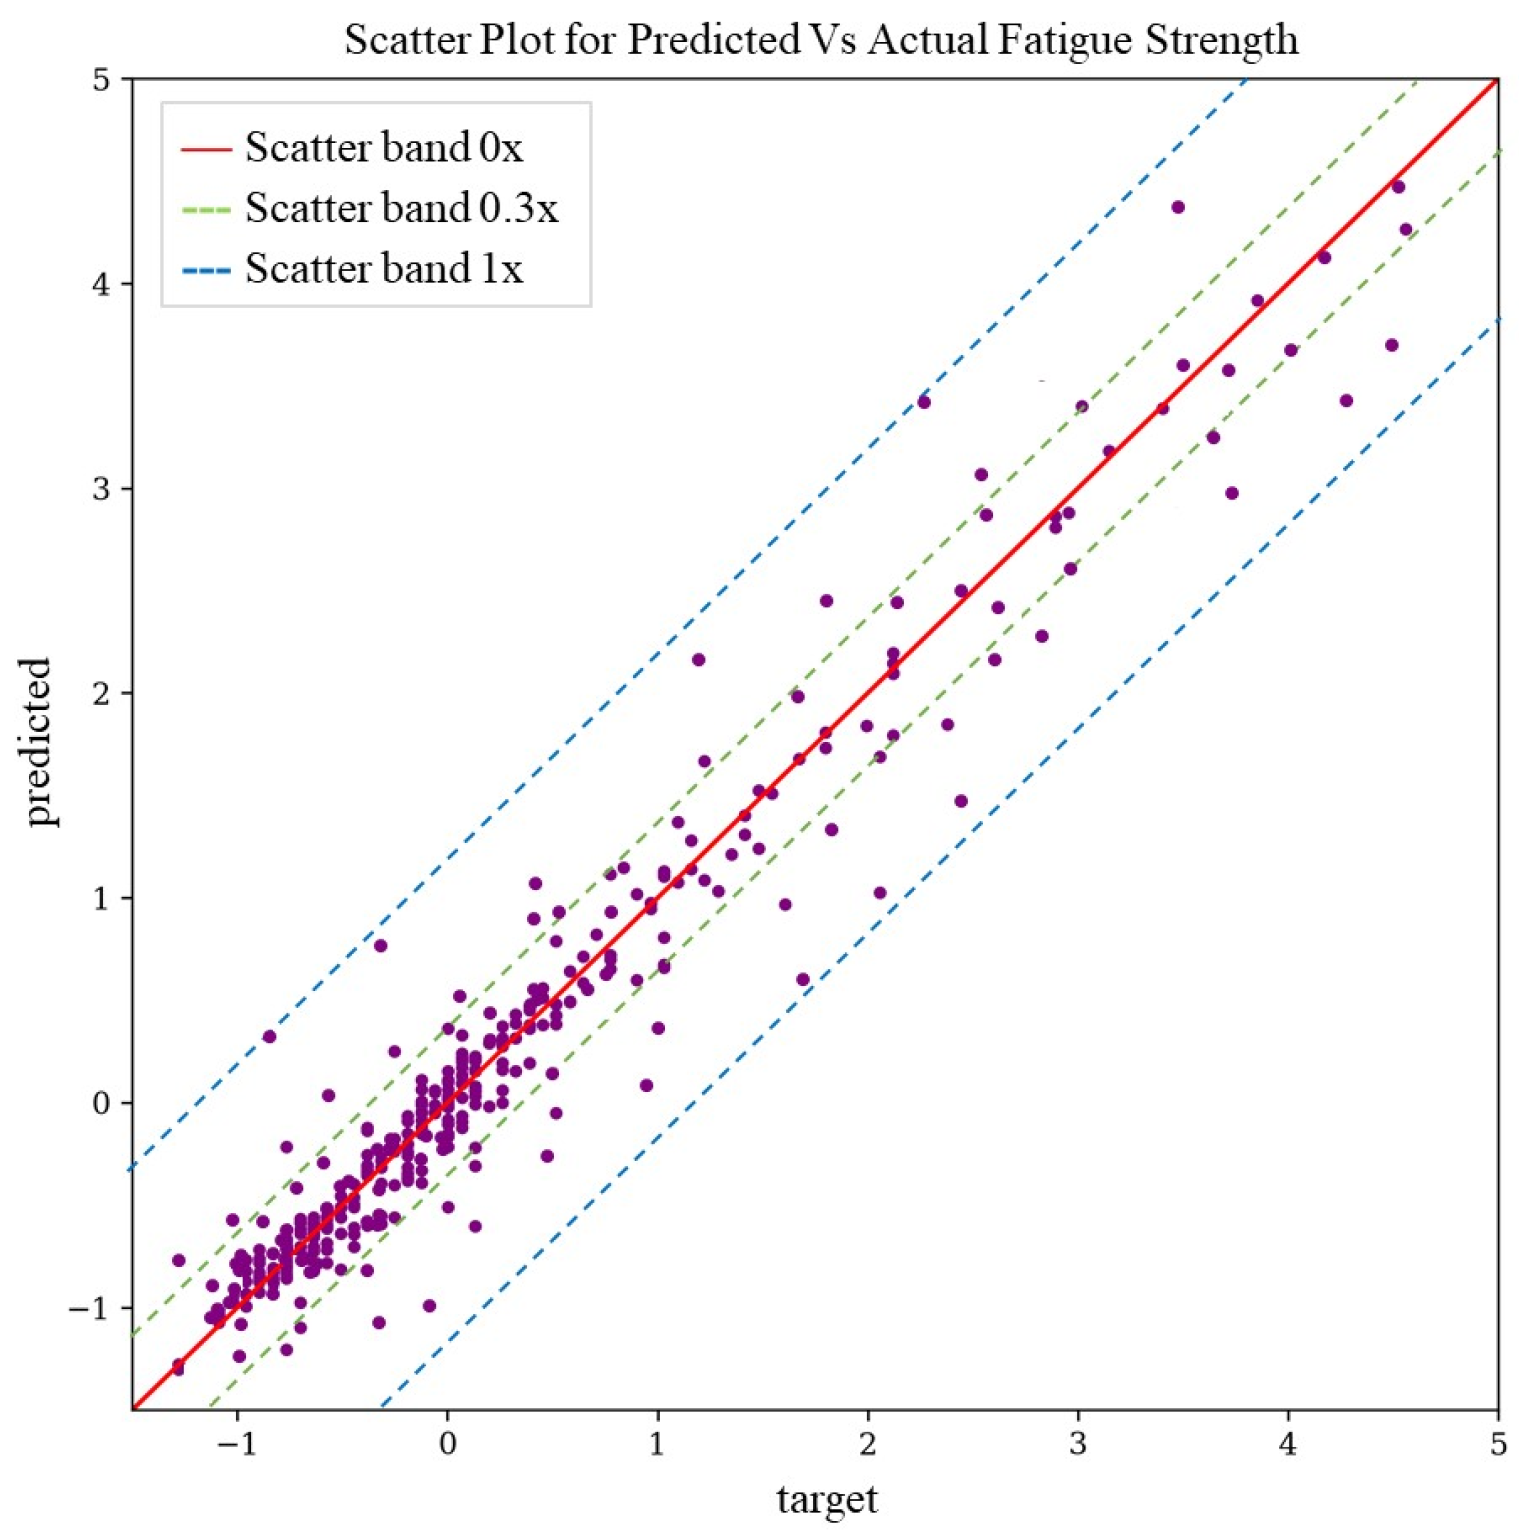
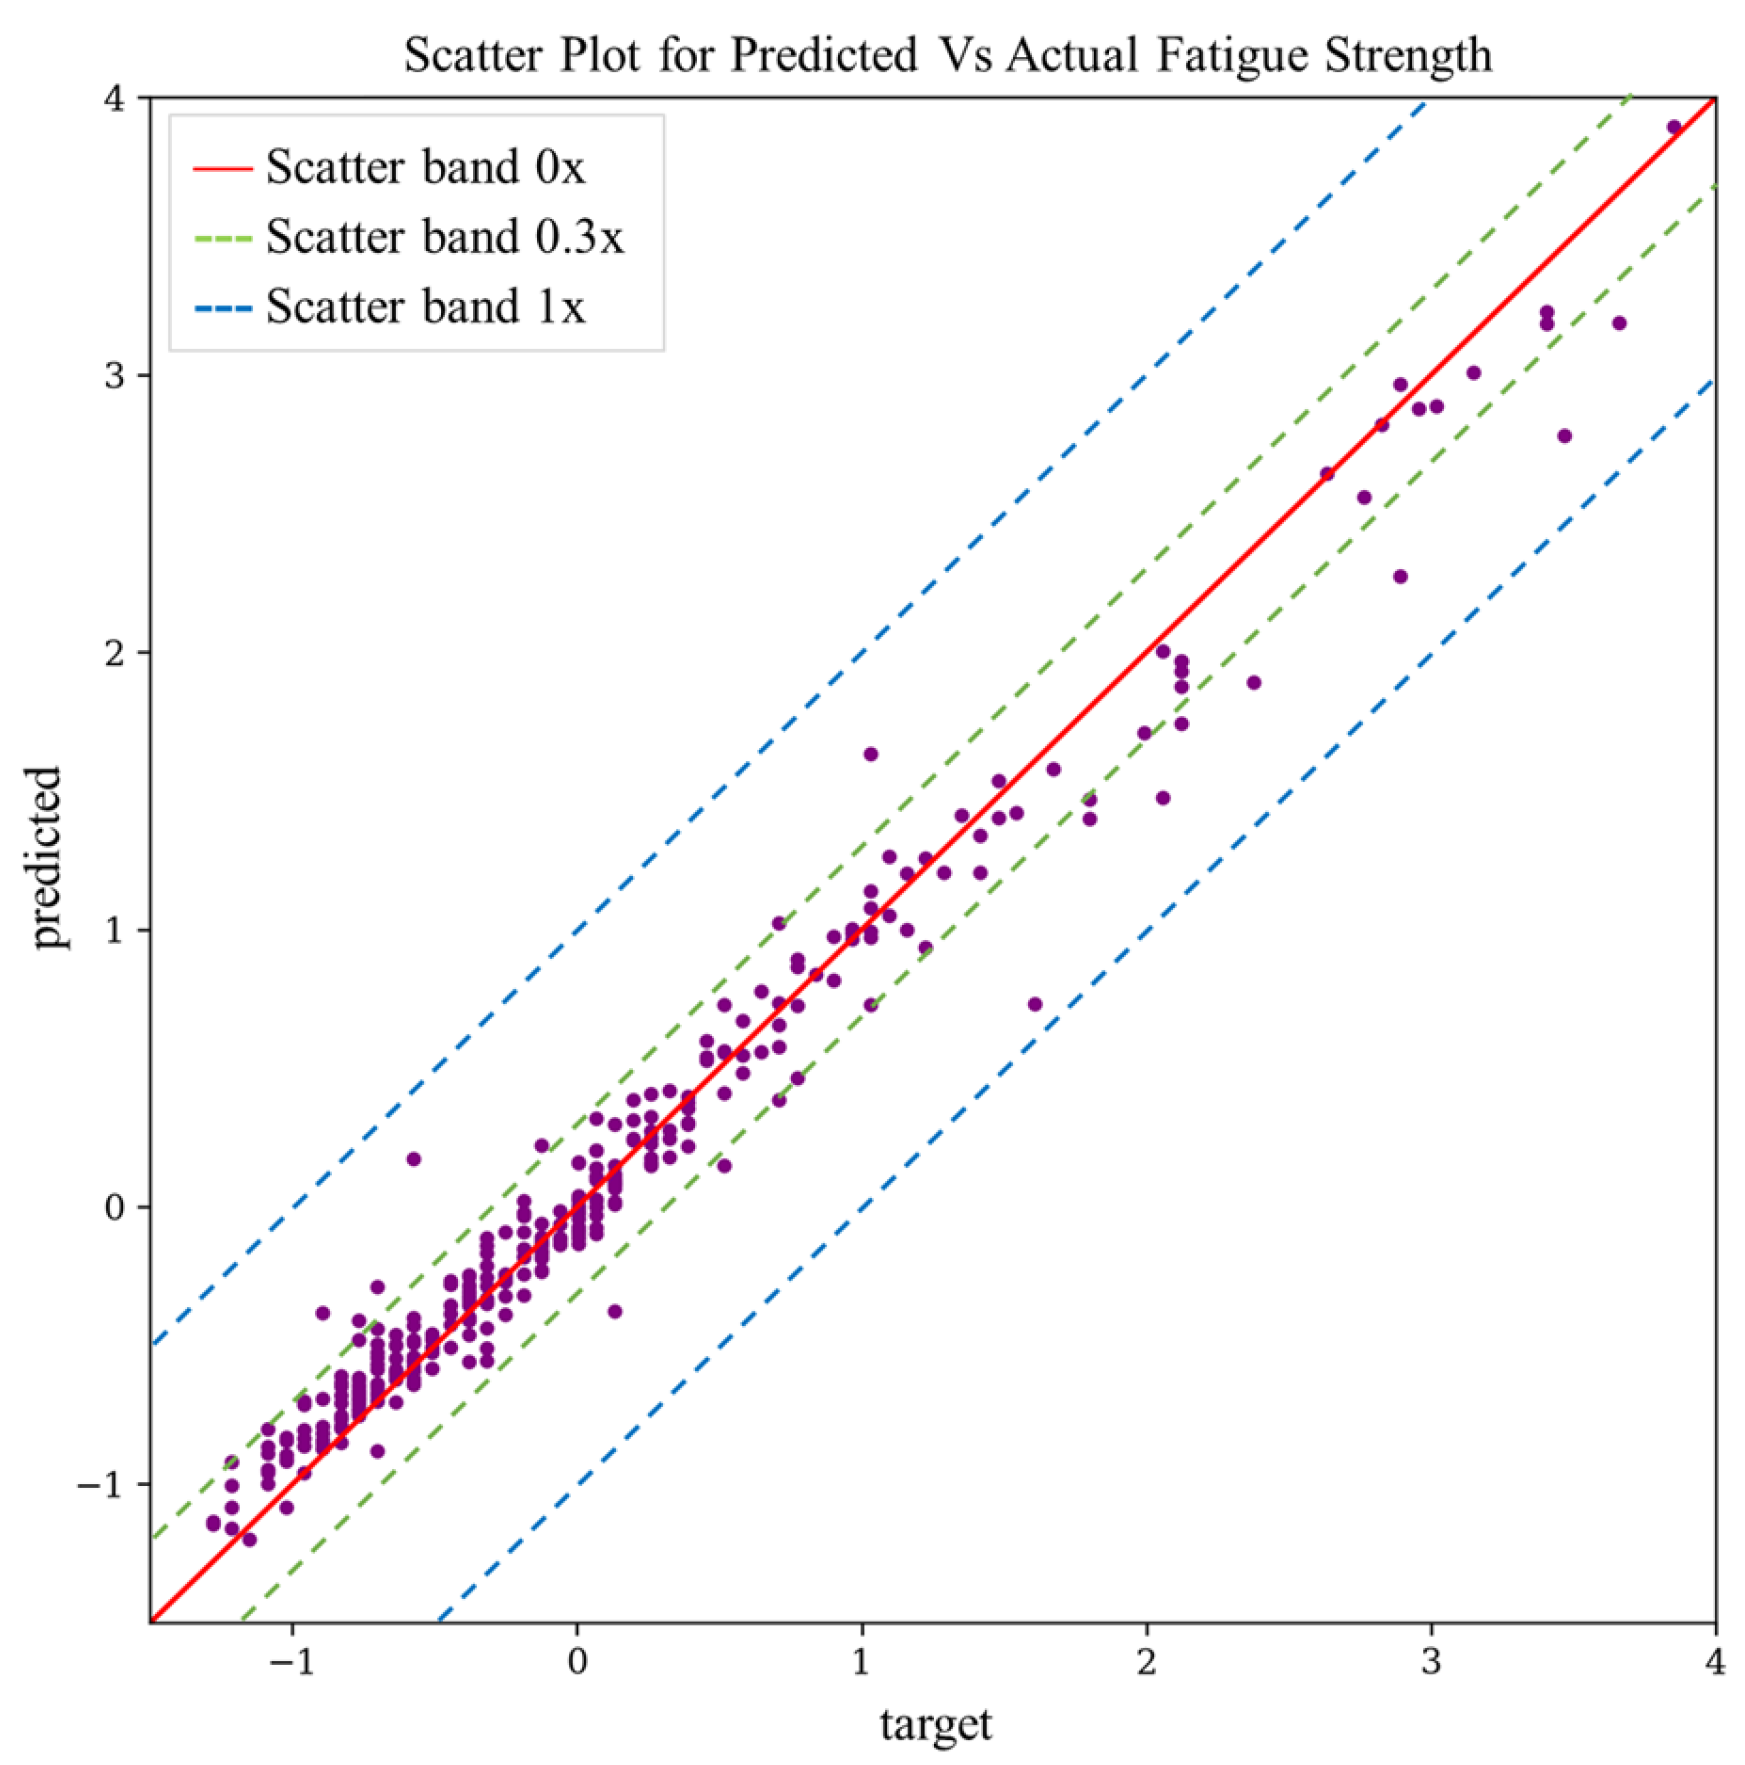
3.4. Predictive Model Evaluation

Model evaluation criteria are essential for assessing the performance of prediction models. Metrics were used in this study to evaluate the model’s effectiveness:
Table 3 presents the details of the metrics scores for the prediction models used in the paper. Lower values of RMSE, MAE, and MAPE, and a higher R2 score indicate better prediction performance and higher accuracy of the model.
From an analysis of the above table, it is found that the R2 of the CNN-LSTM fatigue strength prediction model is improved by 0.4% and 6.2%, the RMSE is reduced by 7.2% and 77%, the MAE is reduced by 7.9% and 60.40%, and the MAPE is reduced by 112% and 297% compared to the CNN and LSTM models. Therefore, CNN-LSTM outperforms individual models, and integrating them leads to better prediction of metal fatigue strength. Compared with RNN, GRU, Transformer, and LeNet5 models, CNN-LSTM improves R2 scores by 0.3%, 0.3%, 0.2%, and 1.4%, reduces RMSE by 5.9%, 46.4%, 0.9%, and 14.9%, and reduces MAE by 7.1%, 69.5%, 5.4%, and 39.1%, respectively; MAPE decreases by 84.1%, 251.2%, 33.2%, and 61.6%, respectively. It is shown that the proposed model has a better ability to predict the fatigue strength of metals in comparison with other advanced models, highlighting the superiority of the proposed model. Figure 5, Figure 6, Figure 7 and Figure 8 present a graphical comparison of the scores for MAE, RMSE, R2, and MAPE for all models.
Comparing the R2, RMSE, MAE, and MAPE evaluation scores of the models, it is found that the CNN-LSTM have the best ability to predict fatigue intensity, with the largest R2, which is higher than the rest of the six evaluation metrics scores. The LSTM prediction model has the worst prediction ability, with the smallest R2. The dispersion of fatigue strength predictions for all regression models on the same test set of data is shown in Figure 9, Figure 10, Figure 11, Figure 12, Figure 13, Figure 14 and Figure 15.
Using Z-score normalization as described in Equation (1), the fatigue strength values are scaled to values between −1.5 and 5. Among the seven deep learning fatigue strength prediction models, the CNN-LSTM model has the best predictive ability with predictions closer to the contour line than the experimental values, and the Z-score normalized fatigue strength predictions are greater than 1.0; the predictions of LSTM, Transformer, and LeNet5 models deviate more from the ±0.3 scatter band than the experimental values. The difference between the LSTM, Transformer, and LeNet5 model predictions and the experimental values deviate more from the ±0.3 scatter line, and the predictions are more in the range of 0.3 to 1.0 scatter line, while the CNN, GRU and RNN predictions deviate less from the 0.3 scatter line. A larger number of the data points in the CNN-LSTM are in the range of the 0.3 scatter line, which indicates that the fatigue strength predictions are highly accurate in this range. For normalized fatigue strengths from −0.5 to 1.5, the predictions of the proposed model are symmetrically distributed around the scatter bands with dense data points. Most of the data points lie within the 0.3 scatter band, with only a few outliers located between the 0.3 and 1.0 scatter bands, and no predictions outside the 1.0 scatter band. Overall, these results indicate that the CNN-LSTM model has excellent prediction performance.

4. Conclusions

This paper has focused on collecting parameters that influence the fatigue strength of ferrous alloys, creating a dataset for fatigue strength prediction, and training a deep learning regression model. Among the models tested, the CNN-LSTM model demonstrates the best predictive performance. From the evaluation metrics, it is shown that the CNN-LSTM model outperforms CNN, RNN, GRU, LSTM, Transformer, and LeNet5. There is an increase in the R2 scores of the proposed model ranging from 0.3% to 6.2%, and a decrease in the MAE, RMSE, and MAPE scores ranging from 0.9% to 297%. The fatigue strength prediction dispersion of the CNN-LSTM model is better than that of the other models, and its prediction results in the whole prediction interval are more uniformly and closely distributed on both sides of the equivocal prediction line, and the predicted values are more clearly concentrated within the 0.3 scatter band than those of the other models, and there are rarely any predicted values outside the 1.0 scatter band. This proves the feasibility of the proposed model for predicting the fatigue strength of ferrous alloys. The proposed model and method enable accurate and efficient fatigue strength predictions by inputting characteristic data, such as elemental composition, into existing datasets. This approach offers a viable alternative to traditional fatigue testing, significantly reducing the time and costs associated with fatigue analysis.
The method is based on data-driven fatigue strength prediction, and the data used in the paper do not include all the factors affecting fatigue strength, such as microstructure parameters and heat treatment process. Relevant experimental data will be further collected in the future to reduce the prediction accuracy problem caused by insufficient data.

Author Contributions

Conceptualization, J.Z.; methodology, Z.H.; software, C.H.; validation, J.P.; formal analysis, J.C.; investigation, J.Z.; resources, J.Y.; data curation, Z.W.; writing—original draft preparation, Z.H.; writing—review and editing, P.Y.; visualization, P.Y.; supervision, M.L.; project administration, Z.H.; funding acquisition, Z.H. and P.Y. All authors have read and agreed to the published version of the manuscript.

Funding

This work was financially supported by Fujian Provincial Natural Science Foundation (Grant No. 2020J05098).

Data Availability Statement

Data from publicly archived datasets: https://www.makeitfrom.com/material-group/Iron-Alloy (accessed on 4 July 2023).

Conflicts of Interest

Authors Zhikun Huang, Jingchao Yan, Jianlong Zhang, Chong Han, Jingfei Peng, Ju Cheng, Zhenggang Wang and Min Luo were employed by the company China Oil & Gas Pipeline Network Corporation Central China Branch. The remaining authors declare that the research was conducted in the absence of any commercial or financial relationships that could be construed as a potential conflict of interest.

References

  1. Yang, Y.; Xu, Q.; Chen, Y.; Yu, T.; Fu, G.; Huang, S. A fast nonlinear equivalent magnetic network model for magnetic jack type control rod drive mechanism in reactor. Prog. Nucl. Energy 2024, 169, 105058. [Google Scholar] [CrossRef]
  2. Li, Y.; Sun, L.; Geng, J.; Zhao, X. Semi-analytical investigation on hydrodynamic efficiency and loading of perforated breakwater-integrated OWCs. Ocean Eng. 2024, 309, 118460. [Google Scholar] [CrossRef]
  3. Guo, J.; Yang, Y.; Li, H.; Wang, J.; Tang, A.; Shan, D.; Huang, B. A hybrid deep learning model towards fault diagnosis of drilling pump. Appl. Energy 2024, 372, 123773. [Google Scholar] [CrossRef]
  4. Wang, L.; Hu, C.; Ma, T.; Yang, Z.; Guo, W.; Mao, Z.; Guo, J.; Li, H. GTFE-Net-BiLSTM-AM: An intelligent feature recognition method for natural gas pipelines. J. Nat. Gas Sci. Eng. 2024, 125, 205311. [Google Scholar] [CrossRef]
  5. Shao, Z.; Yin, Y.; Lyu, H.; Soares, C.G.; Cheng, T.; Jing, Q.; Yang, Z. An efficient model for small object detection in the maritime environment. Appl. Ocean Res. 2024, 152, 104194. [Google Scholar] [CrossRef]
  6. Wang, L.; Xie, Q.; Chen, J.; Ma, T.; Guo, J.; Li, H. Numerical analysis of the effect of hydrogen doping ratio on gas transmission in low-pressure pipeline network. Int. J. Hydrogen Energy 2024, 73, 868–884. [Google Scholar] [CrossRef]
  7. Wu, H.; Wei, J.; Wu, P.; Zhang, F.; Liu, Y. Dynamic response analysis of high-speed train gearboxes excited by wheel out-of-round: Experiment and simulation. Veh. Syst. Dyn. 2024, 1–27. [Google Scholar] [CrossRef]
  8. Guo, J.; Wang, Z.; Li, H.; Yang, Y.; Huang, C.G.; Yazdi, M.; Kang, H.S. A hybrid prognosis scheme for rolling bearings based on a novel health indicator and nonlinear Wiener process. Reliab. Eng. Syst. Saf. 2024, 245, 110014. [Google Scholar] [CrossRef]
  9. Dai, L.; Guo, J.; Wan, J.L.; Wang, J.; Zan, X. A reliability evaluation model of rolling bearings based on WKN-BiGRU and Wiener process. Reliab. Eng. Syst. Saf. 2022, 225, 108646. [Google Scholar] [CrossRef]
  10. Shao, Z.; Yin, Y.; Lyu, H.; Soares, C.G. A robust method for multi object tracking in autonomous ship navigation systems. Ocean Eng. 2024, 311, 118560. [Google Scholar] [CrossRef]
  11. Zou, C.L.; Pang, J.; Qiu, Y.; Liu, R.; Li, S.; Jing, G.; Xu, C.; Zhang, Z. The high-cycle fatigue fracture mechanism and fatigue strength prediction of compacted graphite iron. Int. J. Fatigue 2022, 161, 106881. [Google Scholar] [CrossRef]
  12. Liu, R.; Zhang, P.; Zhang, Z.J.; Wang, B.; Zhang, Z.F. A Practical Model for Efficient Anti-Fatigue Design and Selection of Metallic Materials: I. Model Building and Fatigue Strength Prediction. Mater. Sci. Technol. 2021, 70, 233–249. [Google Scholar] [CrossRef]
  13. Yuan, X.; Li, C. An Engineering High Cycle Fatigue Strength Prediction Model for Low Plasticity Burnished Samples. Int. J. Fatigue 2017, 103, 318–326. [Google Scholar] [CrossRef]
  14. Liviu, M.; Francesco, I.; Liviu, D.P.; Vittorio, D.C.; Lucian, R. Engineering prediction of fatigue strength for AM50 magnesium alloys. Int. J. Fatigue 2019, 127, 10–15. [Google Scholar]
  15. Guo, J.; Yang, Y.; Li, H.; Dai, L.; Huang, B. A parallel deep neural network for intelligent fault diagnosis of drilling pumps. Eng. Appl. Artif. Intell. 2024, 133, 108071. [Google Scholar] [CrossRef]
  16. Li, F.; Wu, H.; Liu, L.; Ye, Y.; Wang, Y.; Wu, P. Nonlinear optimal frequency control for dynamic vibration absorber and its application. Mech. Syst. Sig. Process. 2025, 223, 111932. [Google Scholar] [CrossRef]
  17. Guo, J.; Wang, Z.; Yang, Y.; Song, Y.; Wan, J.L.; Huang, C.G. A dual-channel transferable RUL prediction method integrated with Bayesian deep learning and domain adaptation for rolling bearings. Qual. Reliab. Eng. Int. 2024, 40, 2348–2366. [Google Scholar] [CrossRef]
  18. Wang, X.; Liu, X.; Yang, H.; Wang, Z.; Wen, X.; He, X.; Qing, L.; Chen, H. Degradation Modeling for Restoration-enhanced Object Detection in Adverse Weather Scenes. IEEE Trans. Intell. Veh. 2024, 1–17. [Google Scholar] [CrossRef]
  19. Yan, F.; Song, K.; Liu, Y.; Chen, S.; Chen, J. Predictions and mechanism analyses of the fatigue strength of steel based on machine learning. J. Mater. Sci. 2020, 55, 15334–15349. [Google Scholar] [CrossRef]
  20. Zhao, Z.; Wang, L.; Zhang, J.; Liu, L.; Chen, W. Prediction of high-cycle fatigue strength in a Ti-17 alloy blade after foreign object damage. Eng. Fract. Mech. 2021, 241, 107385. [Google Scholar] [CrossRef]
  21. Wang, H.; Li, B.; Gong, J.; Xuan, F.Z. Machine learning-based fatigue life prediction of metal materials: Perspectives of physics-informed and data-driven hybrid methods. Eng. Fract. Mech. 2023, 284, 109242. [Google Scholar] [CrossRef]
  22. Liu, C.; Wang, X.; Cai, W.; Yang, J.; Su, H. Prediction of the fatigue strength of steel based on interpretable machine learning. Materials 2023, 16, 7354. [Google Scholar] [CrossRef] [PubMed]
  23. Guo, J.; Zan, X.; Wang, L.; Lei, L.; Ou, C.; Bai, S. A random forest regression with Bayesian optimization-based method for fatigue strength prediction of ferrous alloys. Eng. Fract. Mech. 2023, 293, 109714. [Google Scholar] [CrossRef]
  24. Utpat, V.S.; Kulkarni, S.G. Analysis of Various Machine Learning Algorithms for Cast Aluminium Alloy to Estimate Fatigue Strength. J. Inst. Eng. (India) Ser. D 2023, 104, 61–70. [Google Scholar] [CrossRef]
  25. Kashyzadeh, K.R.; Ghorbani, S. New neural network-based algorithm for predicting fatigue life of aluminum alloys in terms of machining parameters. Eng. Fail. Anal. 2023, 146, 107128. [Google Scholar] [CrossRef]
  26. Yin, C.; Yang, Y. The Prediction of Fatigue Life Basing Random Forest Algorithm//ASME International Mechanical Engineering Congress and Exposition. Am. Soc. Mech. Eng. 2021, 85680, V012T12A008. [Google Scholar]
  27. Zhou, K.; Sun, X.; Shi, S.; Kai, S.; Xu, C. Machine learning-based genetic feature identification and fatigue life prediction. Fatigue Fract. Eng. Mater. Struct. 2021, 44, 2524–2537. [Google Scholar] [CrossRef]
  28. Gan, L.; Wu, H.; Zhong, Z. Fatigue life prediction considering mean stress effect based on random forests and kernel extreme learning machine. Int. J. Fatigue 2022, 158, 106761. [Google Scholar] [CrossRef]
  29. Shiraiwa, T.; Miyazawa, Y.; Enoki, M. Prediction of fatigue strength in steels by linear regression and neural network. Mater. Trans. 2018, 60, 189–198. [Google Scholar] [CrossRef]
  30. Agrawal, A.; Deshpande, P.D.; Cecen, A.; Basavarsu, G.P.; Choudhary, A.N.; Kalidindi, S.R. Exploration of data science techniques to predict fatigue strength of steel from composition and processing parameters. Integr. Mater. Manuf. Innov. 2014, 3, 90–108. [Google Scholar] [CrossRef]
  31. Gebhardt, C.; Trimborn, T.; Weber, F.; Bezold, A.; Broeckmann, C.; Herty, M. Simplified ResNet approach for data driven prediction of microstructure-fatigue relationship. Mech. Mater. 2020, 151, 103625. [Google Scholar] [CrossRef]
  32. Malinov, S.; Sha, W.; McKeown, J.J. Modelling the correlation between processing parameters and properties in titanium alloys using artificial neural network. Comput. Mater. Sci. 2001, 21, 375–394. [Google Scholar] [CrossRef]
  33. Duan, H.; Pei, L.; Sheng, J.; Tang, G.; Liu, L.; Zhang, Z. A novel model for fatigue strength prediction based on the true stress-strain curves. Ferroelectrics 2022, 596, 137–151. [Google Scholar] [CrossRef]
  34. Wang, X.; Chen, H.; Gou, H.; He, J.; Wang, Z.; He, X.; Qing, L.; Sheriff, R.E. RestorNet: An efficient network for multiple degradation image restoration. Knowl. Based Syst. 2023, 282, 111116. [Google Scholar] [CrossRef]
  35. Zhao, Y.; Teng, Q.; Chen, H.; Zhang, S.; He, X.; He, X.; Li, Y.; Sheriff, R.E. Activating more information in arbitrary-scale image super-resolution. IEEE Trans. Multimed. 2024, 26, 7946–7961. [Google Scholar] [CrossRef]
  36. Guo, J.; Wan, J.L.; Yang, Y.; Dai, L.; Tang, A.; Huang, B.; Zhang, F.; Li, H. A deep feature learning method for remaining useful life prediction of drilling pumps. Energy 2023, 282, 128442. [Google Scholar] [CrossRef]
  37. Fu, G.Z.; Zhang, X.; Li, W.; Guo, J. Bayesian Fusion of Degradation and Failure Time Data for Reliability Assessment of In-dustrial Equipment Considering Individual Differences. Processes 2024, 12, 268. [Google Scholar] [CrossRef]
  38. Iron-Alloy Datasets. Available online: https://www.makeitfrom.com/material-group/Iron-Alloy/ (accessed on 4 July 2023).
  39. Sun, X.; Zhou, T.; Song, K.; Chen, X. An image recognition based multiaxial low-cycle fatigue life prediction method with CNN model. Int. J. Fatigue 2023, 167, 107324. [Google Scholar] [CrossRef]
  40. Sherstinsky, A. Fundamentals of recurrent neural network (RNN) and long short-term memory (LSTM) network. Phys. D 2020, 404, 132306. [Google Scholar] [CrossRef]
  41. Lu, H.; Yang, G.; Chen, Z.; Zhang, Y.; Fu, C.; Huang, H.; Yuan, X.; Li, Z. Research on Fatigue Crack Propagation and Life Prediction Based on GRU Neural Network. ICMD: International Conference on Mechanical Design. In Advances in Mechanical Design; Springer: Singapore, 2023; pp. 1537–1557. [Google Scholar]
  42. Yang, J.; Kang, G.; Liu, Y.; Kan, Q. A novel method of multiaxial fatigue life prediction based on deep learning. Int. J. Fatigue 2021, 151, 106356. [Google Scholar] [CrossRef]
  43. Zhang, J.; Yu, X.; Lei, X.; Wu, C. A novel deep LeNet-5 convolutional neural network model for image recognition. Comput. Sci. Inf. Syst. 2022, 19, 1463–1480. [Google Scholar] [CrossRef]
  44. Merlini, D.; Sprugnoli, R.; Verri, M.C. The method of coefficients. Am. Math. Mon. 2007, 114, 40–57. [Google Scholar] [CrossRef]
Figure 1. The structure of LSTM.
Processes 12 02214 g001
Figure 2. The structure of CNN-LSTM.
Processes 12 02214 g002
Figure 3. Density of fatigue strength distribution.
Processes 12 02214 g003
Figure 4. Feature Pearson coefficient.
Processes 12 02214 g004
Figure 5. MAE scores.
Processes 12 02214 g005
Figure 6. RMSE scores.
Processes 12 02214 g006
Figure 7. R2 scores.
Processes 12 02214 g007
Figure 8. MAPE scores.
Processes 12 02214 g008
Figure 9. CNN fatigue strength prediction.
Processes 12 02214 g009
Figure 10. RNN fatigue strength prediction.
Processes 12 02214 g010
Figure 11. GRU fatigue strength prediction.
Processes 12 02214 g011
Figure 12. LSTM fatigue strength prediction.
Processes 12 02214 g012
Figure 13. Transformer fatigue strength prediction.
Processes 12 02214 g013
Figure 14. LeNet5 fatigue strength prediction.
Processes 12 02214 g014
Figure 15. CNN-LSTM fatigue strength prediction.
Processes 12 02214 g015
Table 1. Data information table.
AbbreviationDetails
BHBrinell Hardness
EBElongation at Break (%)
SMShear Modulus (Gpa)
UTSUltimate tensile strength (MPa)
TSYTensile Yield Strength (MPa)
TCThermal Conductivity(W/m-K)
DEDensity (g/cm3)
ECEmbodied Carbon (kg CO2/kg material)
EWEmbodied Water (L/kg)
FeIron (%)
MnManganese (%)
CrChromium (%)
NiNickel (%)
SiSilicon (%)
CCarbon (%)
MoMolybdenum (%)
SSulfur (%)
PPhosphorus (%)
NNitrogen (%)
CuCuprum (%)
FSFatigue Strength (MPa)—107 cycles
Table 2. CNN- LSTM model parameter information.
Parameter NameOptimization RangeOptimized Value
Number of Convolution Filters(8, 128)64
Convolution Kernel Size(2, 7)3
Dropout Rate(0.1, 0.5)0.2
Number of LSTM Units(32, 160)64
Number of Fully Connected Layer (4, 16)2
Learning Rate(0.0001, 0.001, 0.01)0.001
Table 3. Model scoring table.
ModelMAERMSER2MAPE
CNN0.12110.18070.96772.4876
RNN0.12020.17850.96852.1607
GRU0.19020.24680.93974.1212
LSTM0.21960.29840.91194.6546
Transformer0.11830.17020.96971.5630
LeNet50.15610.19370.95831.8964
CNN-LSTM0.11220.16860.97191.1734
Disclaimer/Publisher’s Note: The statements, opinions and data contained in all publications are solely those of the individual author(s) and contributor(s) and not of MDPI and/or the editor(s). MDPI and/or the editor(s) disclaim responsibility for any injury to people or property resulting from any ideas, methods, instructions or products referred to in the content.

