Abstract
Carbon capture, utilization, and storage (CCUS) technologies are crucial for reducing CO2 emissions. Currently, subsea CO2 storage is considered a highly feasible CCUS method. With the development of marine CCUS projects, impact loads from ship anchoring and marine debris, combined with internal corrosion defects in CO2 transport pipelines, significantly increase the risk of pipeline failure. This represents a major challenge for offshore SCCO2 pipelines. To investigate the stress–strain response of corroded pipelines under impact loads, a pipeline model with corrosion defects under rockfall impact conditions was established using ABAQUS 2014 finite element software. By varying factors such as the rock mass, impact velocity, drop point, and defect area, a single-variable analysis was conducted to explore the dynamic response of the pipeline. The results indicate that the rock mass and impact velocity are the key factors affecting pipeline stress, while the drop point and defect area have minimal impacts. Additionally, when the pipeline reaches yield failure, the effects of these factors become negligible.
1. Introduction
Carbon capture, utilization, and storage (CCUS) technologies, which offer the potential for largescale carbon reduction and utilization from fossil fuels, are crucial for China’s future efforts to reduce CO2 emissions and achieve sustainable development [1]. Covering 71% of the Earth’s surface, the oceans can sequester carbon at rates that are 20 times greater than land and 50 times greater than the atmosphere, playing a prominent role in the global carbon cycle. Recently, subsea CO2 storage has been recognized as a highly feasible CCUS technology, with countries like the United States, Canada, and Norway already implementing this technology [2]; China National Offshore Oil Corporation has also launched a CO2 storage project at the Enping 15-1 oil field at a depth of 800 m [3]. As marine CCUS projects expand, subsea pipelines are increasingly subjected to impact loads from ship anchoring and marine debris before and during operation, leading to potential dents and damage that can reduce the mechanical strength and threaten the pipeline’s safety. Simultaneously, a pipeline transporting high-pressure CO2 gas contains impurities such as H2O, O2, and SO2 that cannot be completely removed. These impurities can interact synergistically with the CO2, leading to significant pitting or localized corrosion of the pipeline steel [4]. In the risk assessment sections of CO2 pipelines within CCUS cases in Australia, Canada, Europe, and the United States, corrosion has been identified as the most critical safety issue in the CO2 transportation phase [5]. Therefore, corrosion has become a highly challenging influencing factor in the CCUS chain. Describing the dynamic behavior and mechanisms of steel pipelines under internal corrosion in SCCO2 environments, accurately predicting the residual strength of corroded pipelines, and effectively controlling the corrosion rate to ensure safe transport in subsea CCUS projects are critical issues that need to be addressed.
In offshore areas, subsea pipelines are typically protected using the method of trenching and natural backfill, often remaining in a semi-exposed state. Research on the deformation response of these pipelines to impacts from falling objects is extensive, focusing primarily on macro-level deformations such as dents and buckling, as well as micro-level stress and strain. For example, Zang Zhipeng et al. [6] investigated the deformation of subsea pipelines impacted by anchor drops under protection from rubble and concrete mats, examining how factors such as the pipe wall thickness, internal pressure, anchor weight, and impact velocity affect the strain extremes and dent deformation of the pipeline. M Zeinoddini et al. [7] explored the effects of internal pressure, end constraints, impact object shape, burial depth, and seabed soil properties on the depth of dents in subsea pipelines. Li Xiaomin [8], Tian [9], Zhang [10], and others employed finite element simulations to analyze the impact of different seabed soil mechanics and anchor drop velocities on subsea pipeline damage. Dong Feifei [11], Huang Xiaoguang [12], Li Qiaozhen [13], and colleagues investigated the effects of falling objects’ impacts on buried pipelines, analyzing the influence of the impact energy, soil material, and pipe material on the pipeline impacts. Zhao Yuliang [14], Li Yong [15], Li Wei [16], and others studied pipelines subjected to scour-induced spans and the effects of the impact energy, impact angle, soil properties, and span length on the dent damage from falling objects. Additionally, Vestrum O [17,18] and Wu Q [19] investigated the response of pipelines coated with polymer coatings and glass-fiber-reinforced epoxy resin, respectively, to impacts from falling objects.
In summary, the current research on subsea pipeline impacts primarily focuses on intact oil and gas pipelines, with limited studies addressing rockfall impacts on corroded supercritical CO2 pipelines. To address this gap, an impact model for falling rocks was developed using ABAQUS. By calibrating the model parameters through comparison with experimental data and validating the model with SCCO2 explosion tests, this study investigates the effects of variable factors such as the impact velocity, rock mass, impact location, and defect size on the pipeline. The aim is to explore the mechanical response of corroded pipelines to rockfall impacts and provide reference for protective measures and damage assessment of SCCO2 pipelines. The structure of this paper is illustrated in Figure 1.
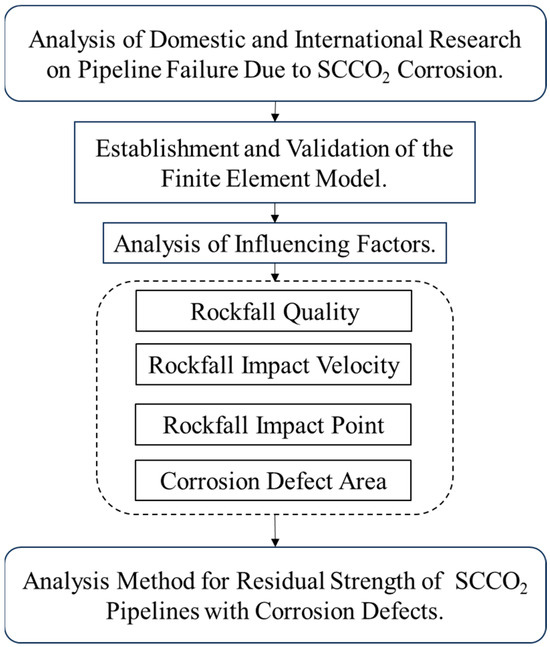
Figure 1.
Flowchart of this article.
2. Establishment of the Finite Element Model
The impact of falling anchors or objects on subsea pipelines is a transient process, and research on this issue falls under the category of transient dynamic analysis. In transient dynamic analysis, it is necessary to solve semi-discrete equations (where “discrete” refers to the structure being described by discrete nodes, and “semi-discrete” means that equilibrium must be maintained at each time step during the derivation of the equations). In transient analysis, the continuous time domain is divided into many time intervals, and solutions are only obtained at discrete time points. The equilibrium and motion equations in this analysis process are as follows:
where M is the mass of the structure; , , and u represent the acceleration, velocity, and displacement of the structure, respectively; I denotes the internal forces within the structure; F is the external force applied to the structure; and [M], [C], and [K] are the mass matrix, damping matrix, and stiffness matrix, respectively.
Based on the above principles, a solid model of a SCCO2 pipeline with corrosion defects under rockfall impact is established, and various sensitivity parameters are introduced for analysis. Due to the significant variation in rockfall shapes, the analysis simplifies the rockfall to a spherical shape impacting the pipeline [20], as shown in Figure 2.
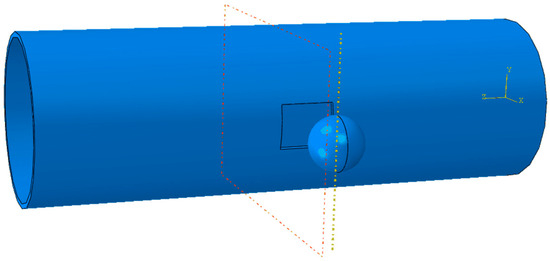
Figure 2.
Schematic of rockfall’s impact on a pipeline with corrosion defects.
2.1. Geometric Model and Material Parameters
The nonlinear numerical simulation software ABAQUS was used to establish a numerical simulation model of a CO2 pipeline with corrosion defects under rockfall impact. The geometric dimensions of the pipeline are based on actual parameters for SCCO2 pipelines [21], with an outer diameter of D = 323 mm and a wall thickness of t = 9 mm. The pipeline parameters are set according to L360M pipeline steel, with an elastic modulus of 207 GPa, Poisson’s ratio of 0.3, and density of 7850 kg/m3. The pipeline uses the Ramberg–Osgood constitutive model, with the stress–strain relationship given by Equation (3).
where ε is the true strain; E is the elastic modulus of 210 GPa; σy is the yield strength of the material in MPa; σ1 is the uniaxial tensile stress in MPa; α is the hardening coefficient, with α = 1.234; and v is the power hardening index, with v = 14.58.
2.2. Boundary Conditions and Mesh Division
To accommodate the supercritical phase transport of CO2, the internal pressure of the pipeline must be maintained above the critical pressure (7.38 MPa). The high internal pressure significantly impacts the safe operation of the pipeline. In the model, pressure is applied to the inner wall of the pipeline to simulate the working pressure. Additionally, to define the movement direction of the pipeline and rockfall, boundary conditions are set with fixed constraints at both ends of the pipeline model, and displacement/rotation constraints are applied to the rockfall model. The pipeline model uses C3D8R mesh elements, with finer meshing applied to the defect areas; the rockfall model uses C3D10M mesh elements, and the model is partitioned to facilitate mesh convergence [22,23], as shown in Figure 3. To save computation time, a coarser mesh is used for areas other than the pipeline defects, balancing computational accuracy with time cost to some extent.
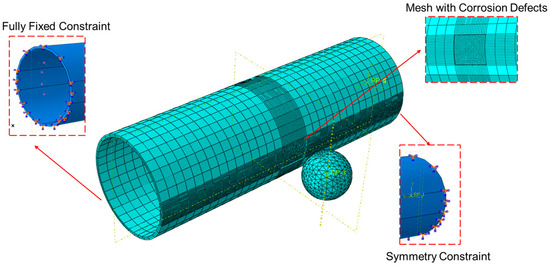
Figure 3.
Schematic of pipeline model boundary conditions and mesh division.
2.3. Pipeline Failure Criteria
In pipelines with corrosion defects, failure is typically determined by an increase in localized stress leading to plastic deformation. Failure occurs when the stress state in the corroded region reaches the end of the post-yield strengthening phase, i.e., when the minimum Mises equivalent stress in the corroded area equals the material’s tensile strength. Otherwise, the pipeline remains safe [24]. At this point, the applied burst pressure in the pipeline is considered the failure pressure of the pipeline, as shown in Equation (4).
where σy represents the material’s yield strength in MPa; σ1, σ2, and σ3 are the three principal stresses in MPa.
2.4. Model Validation
Since no experiments have been conducted to verify the impact of falling rocks on corroded pipelines, the model experiments from reference [25], which involve pipelines being placed on a concrete floor and subjected to impacts from small balls dropped from a specified height and mass, were used as the basis for modeling. The depth of the dents obtained from experimental conditions 1–5 in the reference was used to validate the accuracy of the finite element model as shown in Figure 4. (as the pipeline remains in an oscillatory stabilization phase for a significant time after impact, the finite element analysis used the average displacement difference between the top and bottom center points of the pipeline during this phase as the dent depth). The comparison between the experimental and finite element results is shown in Table 1. It is evident from the table that the relative error between the experimental and finite element results is less than 10%, confirming the accuracy of the finite element model.
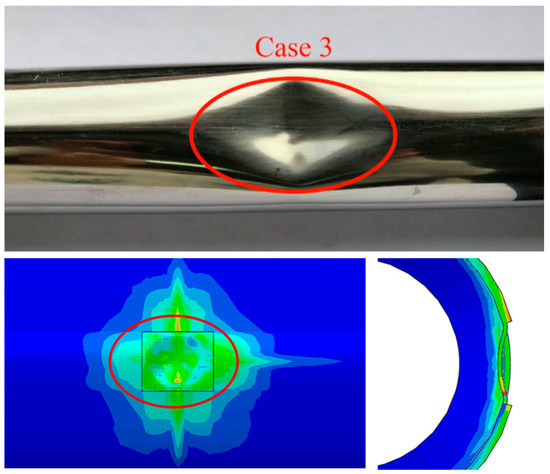
Figure 4.
Comparison of experimental and simulation results. The different colors in the picture indicate different levels of stress on the pipeline.

Table 1.
Verification of the accuracy of the finite element model.
3. Analysis of Factors Affecting Pipeline Failure
3.1. Rockfall Quality
To investigate the impact of rockfall quality on the impact mechanics of pipelines with corrosion defects, a numerical simulation analysis was conducted focusing on rockfall quality as a single variable. Specifically, rockfall radii were set at 25 mm, 37.5 mm, 50 mm, 67.5 mm, 75 mm, 87.5 mm, 100 mm, 117.5 mm, and 125 mm. A comparative analysis was performed on the stress changes in the pipeline due to spherical rockfalls at different impact velocities. The rockfall velocities were set at 10 m/s, 20 m/s, and 30 m/s. When the area of the corrosion defect is constant and the rockfall impact point is at the center of the corrosion defect, the relationship between rockfall quality and the maximum stress in the pipeline is shown in Figure 5.
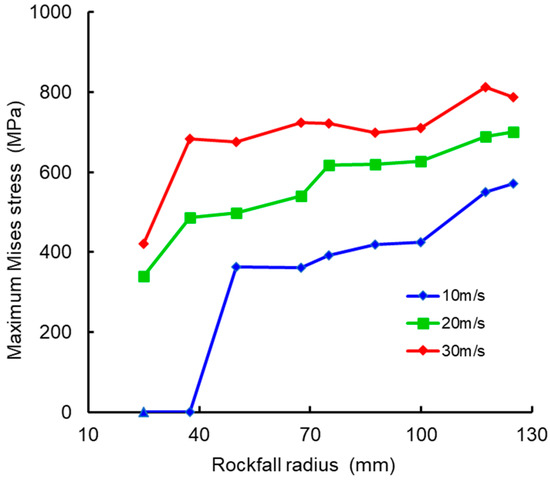
Figure 5.
Relationship between maximum Mises stress in pipeline and rock mass.
As the rockfall velocity increases, the maximum Mises stress in the pipeline also increases with the rockfall quality, although the rate of increase slows down gradually. When the rockfall quality is relatively small, the maximum Mises stress in the pipeline increases rapidly with the rockfall quality. For rockfalls with a radius less than 40 mm and a velocity of 10 m/s, the impact force is insufficient to cause significant damage to the pipeline, and no impact incidents occur. When the rockfall radius is 50 mm, the influence of rockfall quality on pipeline stress is significantly reduced. As the rockfall quality increases to 100 mm, the pipeline stress initially shows a notable increasing trend across all three scenarios, which then becomes more gradual. Under this rockfall quality condition, with a fall velocity of 10 m/s, the pipeline stress increases slowly. As the fall velocity increases, the rate of stress increase in the pipeline continually decreases, and by a fall velocity of 30 m/s, the pipeline stress shows a decreasing trend. The analysis indicates that rockfall quality has the most significant impact on the maximum Mises stress in the pipeline, which requires particular attention in practical conditions.
3.2. Rockfall Impact Velocity
The rockfall impact velocity was set as a single variable with a stepped variation in impact velocities of 5 m/s, 10 m/s, 15 m/s, 20 m/s, 25 m/s, and 30 m/s, resulting in a total of six conditions. Based on these six conditions, rockfall radii of 50 mm, 75 mm, and 150 mm were used to represent monotonically increasing rockfall masses. When the corrosion defect area is fixed and the rockfall impact point is at the center of the defect, the relationship between the maximum Mises stress in the pipeline and rockfall mass is shown in Figure 6.
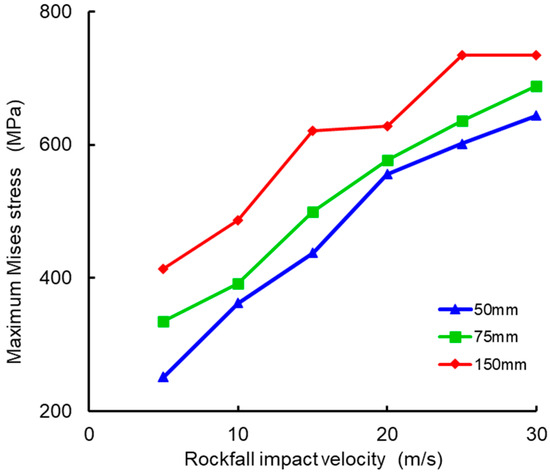
Figure 6.
Relationship between maximum Mises stress and rockfall mass in pipeline.
As seen from the figure, the impact of different rockfall masses on the pipeline stress varies. With the increase in rockfall mass and radius, the maximum Mises stress in the pipeline also increases. For CO2 pipelines with corrosion defects, when the rockfall impact velocity is less than 20 m/s, the equivalent stress in the pipeline increases rapidly, with an average growth rate of 15–28%. When the rockfall impact velocity is higher (v = 25 m/s, 30 m/s), the growth rate of the equivalent stress becomes more gradual and even slows down, with an average growth rate of 8–10%. Due to the presence of corrosion defects, it is highly likely that the pipeline wall stress reaches the yield strength upon impact. After the impact, the yield strength of the pipeline wall will increase. Even after reaching the yield strength of the material, the stress continues to rise, but the rate of increase significantly slows down. Therefore, it can be concluded that the rockfall impact velocity has a significant effect on corroded pipelines.
3.3. Rockfall Impact Point
The rockfall impact point was set as a single variable, with seven different impact points designated as ① to ⑦, as shown in Figure 7. Based on these conditions, rockfall radii of 50 mm, 75 mm, and 150 mm were used to represent monotonically increasing rockfall masses. The relationship between the maximum Mises stress in the pipeline and the rockfall impact velocity is shown in Figure 8.
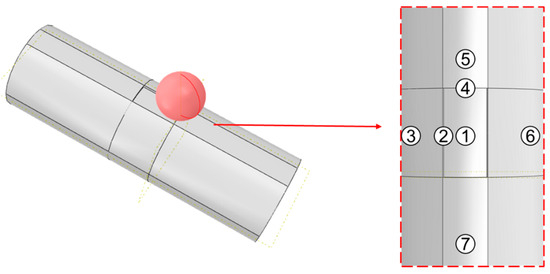
Figure 7.
Schematic diagram of rockfall impact drop points on pipeline with corrosion defects.
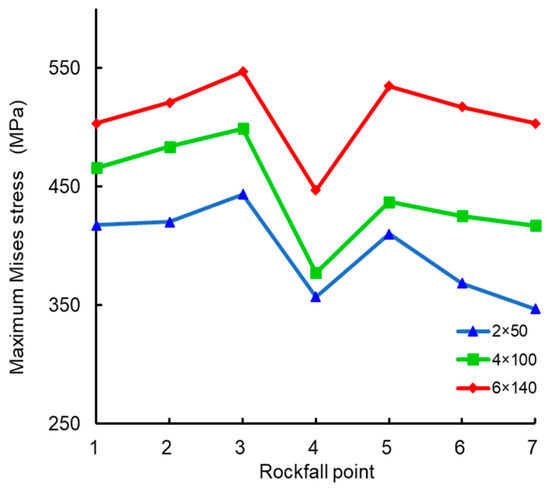
Figure 8.
Relationship between maximum Mises stress in pipeline and rockfall drop point location.
The analysis of the finite element model data indicates that when the rockfall impact point transitions from positions ①–③ to ④–⑤, the equivalent stress in the pipeline increases with the increase in corrosion defect area, and the rate of increase accelerates as the distance between the impact points increases. Conversely, during the transition from positions ③–④ to ⑤–⑥, the equivalent stress in the pipeline decreases with the increase in corrosion defect area, and the rate of decrease accelerates with the increasing distance. The maximum equivalent stress in the pipeline fluctuates between 86.4 and 121.6 MPa. Overall, it can be concluded that the impact point has a relatively minor effect on the maximum Mises stress in pipelines with corrosion defects compared to other variables.
3.4. Corrosion Defect Area
The corrosion defect area was set as a single variable, with rockfall impact velocities varying in a stepped manner, corresponding to five different conditions for corrosion defect areas: 2 × 50 mm2, 3 × 70 mm2, 4 × 100 mm2, 6 × 140 mm2, and 7 × 160 mm2. Based on these conditions, rockfall velocities of 10 m/s, 20 m/s, and 30 m/s were used for the monotonic increasing variable set. When the rockfall mass area is fixed and the impact point is at the center of the defect, the relationship between the maximum Mises stress in the pipeline and the corrosion defect area is shown in Figure 9.
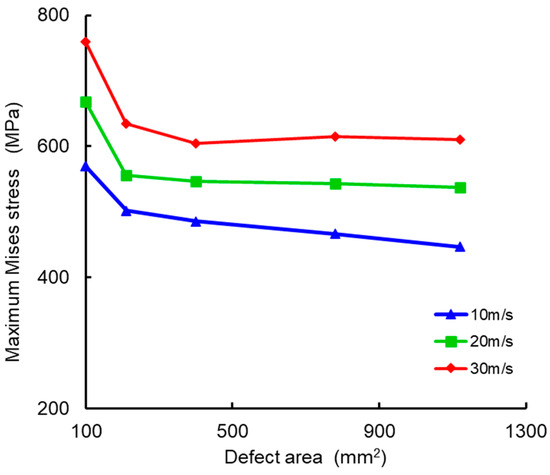
Figure 9.
Relationship between maximum Mises stress in pipeline and corrosion defect area.
As the corrosion defect area in the pipeline increases, the maximum Mises stress in the pipeline gradually decreases. The reduction in equivalent stress is most significant when the defect area is less than 3 × 70 mm2. When the maximum Mises stress in the pipeline equals the yield strength of the pipe material, the rate of stress reduction decreases with the increasing defect area. When the corrosion defect area is greater than or equal to 4 × 100 mm2, further increases in the defect area no longer affect the maximum Mises stress in the pipeline. This indicates that changes in the corrosion defect area only affect the failure pressure of the pipeline to a certain extent. Specifically, with smaller defect areas, the pipeline stress decreases significantly with an increase in defect area, while larger defect areas have less impact on stress. Additionally, if the rockfall velocity exceeds 10 m/s, increasing the defect area will no longer affect the pipeline stress.
4. Conclusions
Using ABAQUS finite element simulation software, a model of a pipeline with corrosion defects under rockfall impact in SCCO₂ conditions was established. The model’s limitations were validated through SCCO₂ pipeline rupture tests and underwater rockfall impact tests. The impact of variable factors such as the rock mass, impact velocity, impact point, and corrosion defect area on the safety performance of pipelines with corrosion defects was analyzed under different conditions. The specific conclusions are as follows:
- (1)
- The rock mass and impact velocity significantly affect pipelines with corrosion defects. As the rock mass and impact velocity increase, the maximum Mises stress in the pipeline shows linear growth. However, the rate of increase in impact velocity is higher, leading to greater destructive capability for pipelines with corrosion defects. Under actual working conditions, if avoidance is not possible, research indicates that the pipeline can withstand impacts from small falling objects with a radius of less than 40 mm and an impact velocity of up to 10 m/s.
- (2)
- The position of the rockfall impact point and the corrosion defect area have minimal effects on the stress and strain on the pipeline. The closer the impact point is to the center of the corrosion defect, the smaller the maximum Mises stress. The maximum Mises stress decreases with an increasing defect area, and if the pipeline reaches yield failure, the impact of corrosion defects on stress and strain becomes less pronounced.
- (3)
- In CCUS pipeline engineering, implementing pipeline protection measures and increasing wall thickness can effectively enhance the corrosion resistance of the pipelines. Common protective measures against third-party damage for subsea pipelines, such as concrete weight coatings, trench burial, concrete blocks, and flexible protective mats, can alleviate anchor and drag anchor damage to subsea SCCO2 pipelines to some extent.
- (4)
- Future research on the corrosion of SCCO2 pipelines needs to employ effective electrochemical testing methods. This includes designing reliable electrochemical measurement devices and developing in situ characterization techniques for thin liquid film properties based on electrochemical tests. Studies should also investigate the corrosion processes under pressure and temperature fluctuations, clarifying the corrosion mechanisms in complex systems. The goal is to establish a predictive model for the corrosion rate within supercritical/dense-phase CO2 pipelines that incorporates the coupling of multi-impurity synergistic competition, mass transfer diffusion, electrochemical mechanisms, and the protective effects of corrosion product films [26].
Author Contributions
Conceptualization, Y.W. and Y.X.; methodology, Y.W.; software, Y.X.; validation, Y.X.; formal analysis, Y.W.; investigation, Y.W.; resources, Y.W.; data curation, Y.W.; writing—original draft preparation, Y.W.; writing—review and editing, Y.W.; visualization, X.G.; supervision, X.G.; project administration, X.G.; funding acquisition, X.G. All authors have read and agreed to the published version of the manuscript.
Funding
This research was funded by the China Petroleum Science and Technology Innovation Fund (grant number 2017D-5007-0606).
Data Availability Statement
The raw data supporting the conclusions of this article will be made available by the authors on request.
Conflicts of Interest
The authors declare no conflict of interest.
References
- Guo, K.; Yan, G.; Zhang, A.; Xi, M.; Niu, A. Current Status and Development of CO2 Capture, Utilization, and Storage Technologies and CO2 Pipeline Research. Nat. Gas Oil 2023, 41, 28–40. [Google Scholar] [CrossRef]
- Chen, J.; Tang, X.; Liu, Y.; Chen, J.; Hu, Q.; Li, Y.; Chen, G.; Guo, Y.; Zhang, M.; Yang, F.; et al. Investigation of the Impact of Supercritical CO2 Pipeline Rupture and Leakage. Nat. Gas Oil 2023, 41, 1–8. [Google Scholar] [CrossRef]
- Qin, J.; Li, Y.; Wu, D.; Weng, H.; Wang, G. Global Progress of CCUS and China’s Countermeasures. Oil Gas Geol. Recovery Effic. 2020, 27, 20–28. [Google Scholar] [CrossRef]
- Eldevik, F.; Graver, B.; Torbergsen, L.E.; Saugerud, O.T. Development of a guideline for safe, reliable and cost efficient transmission of CO2 in pipelines. Energy Procedia 2009, 1, 1579–1585. [Google Scholar] [CrossRef]
- Choi, Y.S.; Nešic, S. Effect of water content on the corrosion behavior of carbon steel in supercritical CO2 phase with impurities. In Proceedings of the Corrosion 2011, Houston, TX, USA, 13–17 March 2011. [Google Scholar]
- Zang, Z.; Xu, Z.; Zou, X.; Hou, J. Deformation Response of Subsea Pipeline Under Anchor Impact with Boulder and Concrete Pad Protection. Ocean Eng. 2023, 41, 114–126. [Google Scholar] [CrossRef]
- Zeinoddini, M.; Nikoo, H.; Ahmadpour, F. A Coupled Soil-Fluid-Structure Simulation of the Near-Field Earthquake Effects on Gravity Type Quay-Walls. China Ocean. Eng. 2013, 27, 481–494. [Google Scholar] [CrossRef]
- Li, X.; Sun, C.; Ma, W.; Guo, H. Numerical Simulation Study of Dented Damage on Bare Subsea Pipelines under Dropped Object Impact. J. Shipbuild. 2020, 24, 1479–1486. [Google Scholar]
- Tian, Y.; Chai, W.; El Borgi, S.; Zhang, C.; Sun, L.; Xiao, Z.; Fu, D. Assessment of submarine pipeline damages subjected tofalling object impact considering the effect of seabed. Mar. Struct. 2021, 78, 102963. [Google Scholar] [CrossRef]
- Zhang, H.; Zhang, J.; Lin, R.; Li, Y. Numerical Study on Mechanism Responses of SubmarinePipeline Impacted by Bar-Shaped Falling Object. J. Pipeline Syst. Eng. Pract. 2020, 11, 04020051. [Google Scholar] [CrossRef]
- Dong, F.; Zhang, D.; Tian, J.; She, Y.; Du, G. Dynamic Response of Buried Long-Distance Pipelines under Impact Load. Pet. Mach. 2020, 48, 132–141. [Google Scholar] [CrossRef]
- Huang, X.; Sun, F. Dynamic Simulation of Subsea Pipeline Impacted by Dropped Anchor Based on ANSYS/LS-DYNA. China Offshore Platf. 2012, 27, 41–44. [Google Scholar]
- Li, Q.; Luo, M.; Shi, Z.; Wang, J.; Zhang, Q. Mechanical Response of Buried Pipelines under Spherical Impact. Nat. Gas Ind. 2021, 41, 138–145. [Google Scholar]
- Zhao, Y.; Jiang, F.; Tian, Q.; Dong, S. Numerical Simulation Study of Dropped Object Impact on Suspended Subsea Pipelines. Ocean Lake Res. 2020, 2, 28–34. [Google Scholar]
- Li, Y.; Wei, Y.; Cao, Y.; Zhang, S.; Fan, D. Failure Analysis of Suspended Subsea Pipelines under Dropped Object Impact. China Offshore Platf. 2019, 34, 71–77+90. [Google Scholar]
- Li, W.; Guo, H.; Li, X. Study on the Dent Damage of Suspended Subsea Pipelines under Dropped Object Impact. J. Ocean Univ. China (Nat. Sci. Ed.) 2018, 48, 139–144. [Google Scholar]
- Vestrum, O.; Kristoffersen, M.; Polanco-Loria, M.A.; Ilstad, H.; Langseth, M.; Børvik, T. Quasi-static and dynamic indentation ofoffshore pipelines with and without multi-layer polymeric coating. Mar. Struct. 2018, 62, 60–76. [Google Scholar] [CrossRef]
- Vestrum, O.; Langseth, M.; Borvik, T. Finite element analysis of porous polymer coated pipelinessubjected to impact. Int. J. Impact Eng. 2021, 152, 103825. [Google Scholar] [CrossRef]
- Wu, Q.; Zhi, X.; Li, Q.; Guo, M. Experimental and numerical studies of GFRP-reinforced steel tubeunder low-velocity transverse impact. Int. J. Impact Eng. 2019, 127, 135–153. [Google Scholar] [CrossRef]
- Ma, C.; Tu, Y.; Zhou, Y.; Yang, J.; Cheng, L. Dynamic Response of PCCP under the Rockfall Impact Based on the Continuous–Discontinuous Method: A Case Study. Water 2024, 16, 801. [Google Scholar] [CrossRef]
- Magda, W. Wave-induced uplift force acting on a submarine buried pipeline: Finite element formulation and verification of computations. Comput. Geotech. 1996, 19, 47–73. [Google Scholar] [CrossRef]
- Li, X.; Sun, J.; Li, T. The analysis and comparison of all kinds of buried pipeline model based on seismic effect. Engineering 2016, 8, 365–370. [Google Scholar] [CrossRef][Green Version]
- Jiang, F.; Dong, S.; Zhao, Y.; Xie, Z.; Soares, C.G. Investigation on the deformation response of submarine pipelines subjected to impact loads by dropped objects. Ocean. Eng. 2019, 194, 106638. [Google Scholar] [CrossRef]
- Rossi, N.; Bačić, M.; Kovačević, M.S.; Librić, L. Development of Fragility Curves for Piping and Slope Stability of River Levees. Water 2021, 13, 738. [Google Scholar] [CrossRef]
- Zhang, Y.; Feng, J.; Du, L.; Zhao, P.; Peng, J.; Yang, C.; Fan, H.; Li, L. Numerical Investigation of the Dynamic Response of a Sand Cushion with Multiple Rockfall Impacts. Sustainability 2023, 15, 3554. [Google Scholar] [CrossRef]
- Mirmozaffari, M.; Yazdani, M.; Boskabadi, A.; Ahady Dolatsara, H.; Kabirifar, K.; Amiri Golilarz, N. A Novel Machine Learning Approach Combined with Optimization Models for Eco-efficiency Evaluation. Appl. Sci. 2020, 10, 5210. [Google Scholar] [CrossRef]


Disclaimer/Publisher’s Note: The statements, opinions and data contained in all publications are solely those of the individual author(s) and contributor(s) and not of MDPI and/or the editor(s). MDPI and/or the editor(s) disclaim responsibility for any injury to people or property resulting from any ideas, methods, instructions or products referred to in the content. |
© 2024 by the authors. Licensee MDPI, Basel, Switzerland. This article is an open access article distributed under the terms and conditions of the Creative Commons Attribution (CC BY) license (https://creativecommons.org/licenses/by/4.0/).