Article

The Assessment of Abrasion Resistance of Casted Non-Ferrous Metals and Alloys with the Use of 3D Scanning

Faculty of Non-Ferrous Metals, AGH University of Krakow, al. Mickiewicza 30, 30-059 Krakow, Poland
Processes 2024, 12(10), 2200; https://doi.org/10.3390/pr12102200
Submission received: 19 September 2024 / Revised: 4 October 2024 / Accepted: 8 October 2024 / Published: 10 October 2024
(This article belongs to the Special Issue Processing, Manufacturing and Properties of Metal and Alloys)

Abstract

:
Three-dimensional scanning techniques are being more frequently used in modern industry, especially for quality control. This study shows the possibility of implementing 3D scanning as a tool for assessing the abrasion resistance of non-ferrous metal and alloy cast rods obtained in the continuous casting process. Samples of the same diameter after preweighing and initial scanning were subjected to abrasion tests in five identical cycles to show the progress of their wear. To conduct this process, the samples were weighed and scanned after each cycle. After the final abrasion test, the pure aluminum weight loss was 7%, with 3.4–4.1 mm abrasion, while the AlSi alloy had a weight loss of only 4.63% and 2.3–2.4 mm abrasion. When it came to pure copper, the loss was 2.76%, with 1.6–1.7 mm abrasion. CuNiSi alloys showed a loss between 2.01% and 2.24% and 1.3–1.5 mm abrasion, while CuMg alloys showed a loss between 1.51% and 1.63% and 1.2–1.4 mm abrasion, depending on the Ni and Mg content, respectively. The obtained results were correlated with the density and hardness of the tested materials and proved that both these factors are relevant when it comes to abrasion resistance; however, hardness is more significant.

1. Introduction

Metallic materials can be generally divided into ferrous (steel) and non-ferrous metals and alloys (aluminum, magnesium, titanium, copper, etc.). The general difference between them is that ferrous metals contain iron and are magnetic, while non-ferrous do not contain a significant amount of metal and are not magnetic. There are, of course, materials, such as aluminum alloys, whose chemical composition consists of Fe; however, the amount of Fe is very limited and thus is not considered to be meaningful. Currently, non-ferrous metals are widely used in aviation, the automotive industry, military applications, medical and consumer goods, heat exchangers, and of course cables and wires for electrical current conductivity [1,2,3,4,5]. Many of these applications require metal-forming processes to obtain the final shapes and mechanical properties. However, before that happens, the majority of the processes are preceded by continuous or semi-continuous casting processes to obtain the stock material for further extrusion, rolling, or drawing processes [6,7,8].
For many applications, such as typical cables, pure copper or pure aluminum is sufficient and favorable [9,10,11,12], especially since the addition of alloying elements would limit the electrical conductivity of cables according to Nordheim’s rule of mixtures [13]. On the other hand, when electrical conductivity is not a priority and other factors are of higher importance, the use of alloying additives is necessary. Regarding aluminum, there are eight main series of materials, i.e., 1xxx (min. 99% pure Al), 2xxx (AlCu), 3xxx (AlMn), 4xxx (AlSi), 5xxx (AlMg), 6xxx (AlMgSi), 7xxx (AlZn), and 8xxx (other elements) [14,15,16]. In the case of copper alloys, the current state is slightly different as there are no set series or grades of alloys [11]. The two most known types of copper alloys are brass [17,18] and bronze [19,20,21], which, apart from Zn and Sn, respectively, consist of other elements such as Pb, Al, Ni, etc. [11,20,21,22]. Other well-known and widely studied alloys based on the copper matrix are CuNiSi alloys [23,24], CuAg alloys [25,26], CuSc alloys [27,28], and CuCrZr alloys [29,30], to name a few [11]. Regardless of their countless applications, the use of these alloys is limited by the high price or limited availability of alloying additives, such as Cr, Zr, Ni, Ag, and Sc. Apart from metallurgical synthesis, the properties of copper and aluminum can be enhanced by manufacturing metal matrix composites [31,32,33] or introducing alternative ways of processing, such as the extrusion process with rotating die (KOBO) [34,35], close die precision forging [36], and accumulative angular drawing (AAD) [37,38]. However, composite materials and non-conventional methods of obtaining materials are also expensive and cannot be used in every industry.
Among the most widely studied materials recently are CuMg alloys with various Mg concentrations. The addition of Mg has three main benefits: it is cheaper than the above-mentioned alloying elements, its density is much lower, and it provides a solid solution and strain hardening to a high extent [39]. According to the authors in [39], the hardness of Cu is around 50 HB in the as-cast state and around 87 HB after applying 50% cold deformation. However, regarding CuMg alloys, their hardness is 92 HB and 129 HB in the as-cast state and 143 HB and 188 HB after deformation is applied to CuMg2 and CuMg4 alloys, respectively. Therefore, the authors not only proved that these alloys may be subjected to cold deformation but also that the hardness of these alloys is 2–2.5 times higher than that of pure copper. Gorsse et al. [40], in their studies, proved that CuMg alloys with over 2 wt. % of Mg are not only susceptible to strain hardening and solid-solution hardening but also that alloys with certain amounts of Mg are susceptible to precipitation hardening. In their paper, they presented experimental results showing that it is possible to obtain over 1000 MPa of yield strength, where half of this amount is attributed to precipitation hardening. However, other researchers have studied CuMg alloys with lower concentrations of Mg, i.e., below 2 wt. %. Their studies have proven that after supersaturation and cold rolling, it is possible to obtain between 500 and 830 MPa of proof strength, depending on the amount of Mg, while pure copper can withstand only 400 MPa [41]. In another work [42], Calvillo et al. obtained the two most common CuMg alloys with 0.2 and 0.5 wt. % of Mg. In their study, the authors provided evidence that after 16 passes on an equal channel angular press, the ultimate tensile strength of the tested alloys rose from 170 MPa and 210 MPa to 550 MPa and 740 MPa for CuMg0.2 and CuMg0.5, respectively. Therefore, these alloys show serious potential in terms of applications where high-strength material is required. Similar properties can be obtained with various types of CuNiSi alloys; however, these materials do not provide the other above-mentioned advantages, i.e., lower density and price [23,24]. Nevertheless, in terms of further analysis, these promising copper alloys were selected for comparison purposes in the current study.
High-strength products are used in numerous branches of industry, such as aviation, automotive, structural, and construction industries, but also in terms of conducting electricity; they are used, among other things, for contact wires of trolleys and high-speed railway lines. Commonly used materials for these applications are pure copper and CuAg alloys. However, regarding Cu alloys, their abrasion resistance is not very high, and, regarding CuAg alloys, their extremely high price limits their use, especially due to the wear of the wire resulting from the contact with the pantograph and, consequently, the abrasion of the wire; it is necessary to replace it when the cross-section is reduced by approximately 35–40%. The period of time needed for replacement depends, of course, on the frequency of contact between the pantograph and the wire, but for the usual trolley line, it is between 3 and 5 years [43,44].
In modern industry, the use of 3D scanning is quite common regarding various metal working processes, especially in terms of quality control. Its use is specifically desired in casting and machining processes, where the geometry of the final product can be verified by being compared with its 3D model with high accuracy. The presence of all sorts of defects, cavities, cracks, and deformations are also possible to detect, which is significant when complex products are being considered. Due to digitalization being present in all aspects of life, the 3D scanning techniques proved that they can be an excellent tool for replacing the currently used metrology devices [45,46]. High-quality metrology measurements are also invaluable in additive manufacturing as such technologies provide possibilities for obtaining complex net-shaped products across diverse sectors such as aerospace, automotive, medicine, and many others [47]. However, the use of 3D scanning for the assessment of the wear of final products in real or simulated operational environments is still not a common approach.
One of the most commonly used wear tests assessing abrasion resistance is the Taber abrasive test. It is mainly used to provide information on the wear of flat samples and coatings. The sample during this test is mounted to a rotating platform, which is pressed by abrasive wheels with a constant speed and pressure. Typically, after 1000–10,000 cycles (a cycle is a full rotation of the wheel), the change in specimen mass in relation to its initial weight is evaluated [48,49,50]. Another way of assessing the abrasion resistance is the dry sand and rubber wheel test according to the ASTM G65 standard [51], which simulates sliding abrasion with moderate pressure. The sand is continuously delivered between the rotating rubber wheel and the specimen, which is pressed against the wheel with constant pressure. The abrasion resistance according to this standard is expressed by the volume loss instead of the mass loss. Another test is the block on a ring abrasion assessment according to ASTM G77 and ASTM D2714 standards [52,53]. The idea is using the rotational abrasion due to the metal-to-metal contact of a rectangular sample against the rotating metal ring. However, the direct use of these methods for cast materials in the form of rods would be difficult due to the shape of the friction wheels and/or samples and the general setup of the stand [54]. Therefore, in order to achieve the aim of this paper, which is to improve the existing abrasion resistance tests by implementing 3D scanning techniques and assess its effectiveness on selected non-ferrous cast rods of metals and alloys, a special test stand was designed and built. The classical approach of abrasion tests remained the same, which is to monitor the weight loss of the samples. The additional use of 3D scanning will allow the visualization of the volume loss of the material. The objective of this paper is also to correlate the abrasion resistance with both the hardness and density of the tested materials.

2. Materials and Methods

2.1. Chemical Composition

The materials selected to reach the goal of the paper were obtained using the laboratory continuous casting line provided to AGH University of Krakow by Termetal (Termetal, Piekary Śląskie, Poland). A total of 7 different materials were chosen to assess the influence of density and hardness of the tested rods on their abrasive resistance. These were aluminum and its hypoeutectic alloy with Si and copper and its alloys with NiSi and Mg. The desirable nominal chemical composition of the materials is presented in Table 1.
All of the samples were obtained with the same parameters in terms of the casting speed (0.1 m/min) in the form of cast rods with the diameter of 14 mm. However, since the continuous casting process itself is not the main part of this research, more specific data are available in the author’s previously published paper [8]. The chemical composition of the obtained cast rods was analyzed with the arc spark spectrometer SPECTROTEST TXC35 (SPECTRO Analytical Instruments, Kleve, Germany). The spectrometer uses optical emission. The sample material is vaporized from the surface with the testing probe (an electrode) by an arc spark discharge. During vaporization, the atoms and ions are excited into the emission of radiation. The emitted radiation is passed to the spectrometer optics via optical fiber, where it is dispersed into its spectral components. The software based on the wavelengths and the radiation intensity recalculates the data using stored set of calibration curves and presents the results as percentage concentration. The analysis was performed on a separate part of the cast rod (not subjected to further abrasion test) after machining the sample to the middle of the cross-section. A total of 5 separate measurements were performed and the average value for each of the 7 rods was calculated.

2.2. Properties Characterization

Abrasion resistance is generally associated with high strength or high hardness of materials [57,58]. On the other hand, in [59], the authors claim that increasing hardness had no significant correlation with mass loss resulted from abrasion. Which is why, in this paper, not only hardness but also density will be investigated and correlated with the abrasion resistance.
All 7 materials in the as-cast state were subjected to Vickers hardness analysis prior to abrasion as the heat generated during the abrasion test could influence the mechanical properties of materials. The cast rods were machined to the middle of the cross-section, similar to the method used for chemical composition analysis. The analysis was conducted using TUKON 2500 hardness tester (Buehler, Lake Bluff, IL, USA). The test load accuracy of the measurement is ±1% and the accuracy of the indentation diagonal is 0.02 mm. In order to obtain reliable data, 10 indentations were performed with a test load of 5 kgf and an indentation time of 10 s for each of the materials. These parameters allowed the obtaining of accurate average and standard deviation values.
The density of samples was determined using the Archimedes’ principle. Small cubes with dimensions of 10 mm × 10 mm × 10 mm were machined from the cast rods prior the abrasion test. The samples were precisely weighed both at air atmosphere and in water using RADWAG AS.R2 laboratory scale (Radwag Wagi Elektroniczne, Radom, Poland) with a scale interval of 0.0001 g in an air-conditioned laboratory at a constant, measured temperature. The density analysis was conducted for 3 separate samples of each of the materials to provide accurate average values. The same high accuracy scale was used to weigh the samples prior to the abrasion test and after each consecutive cycle.

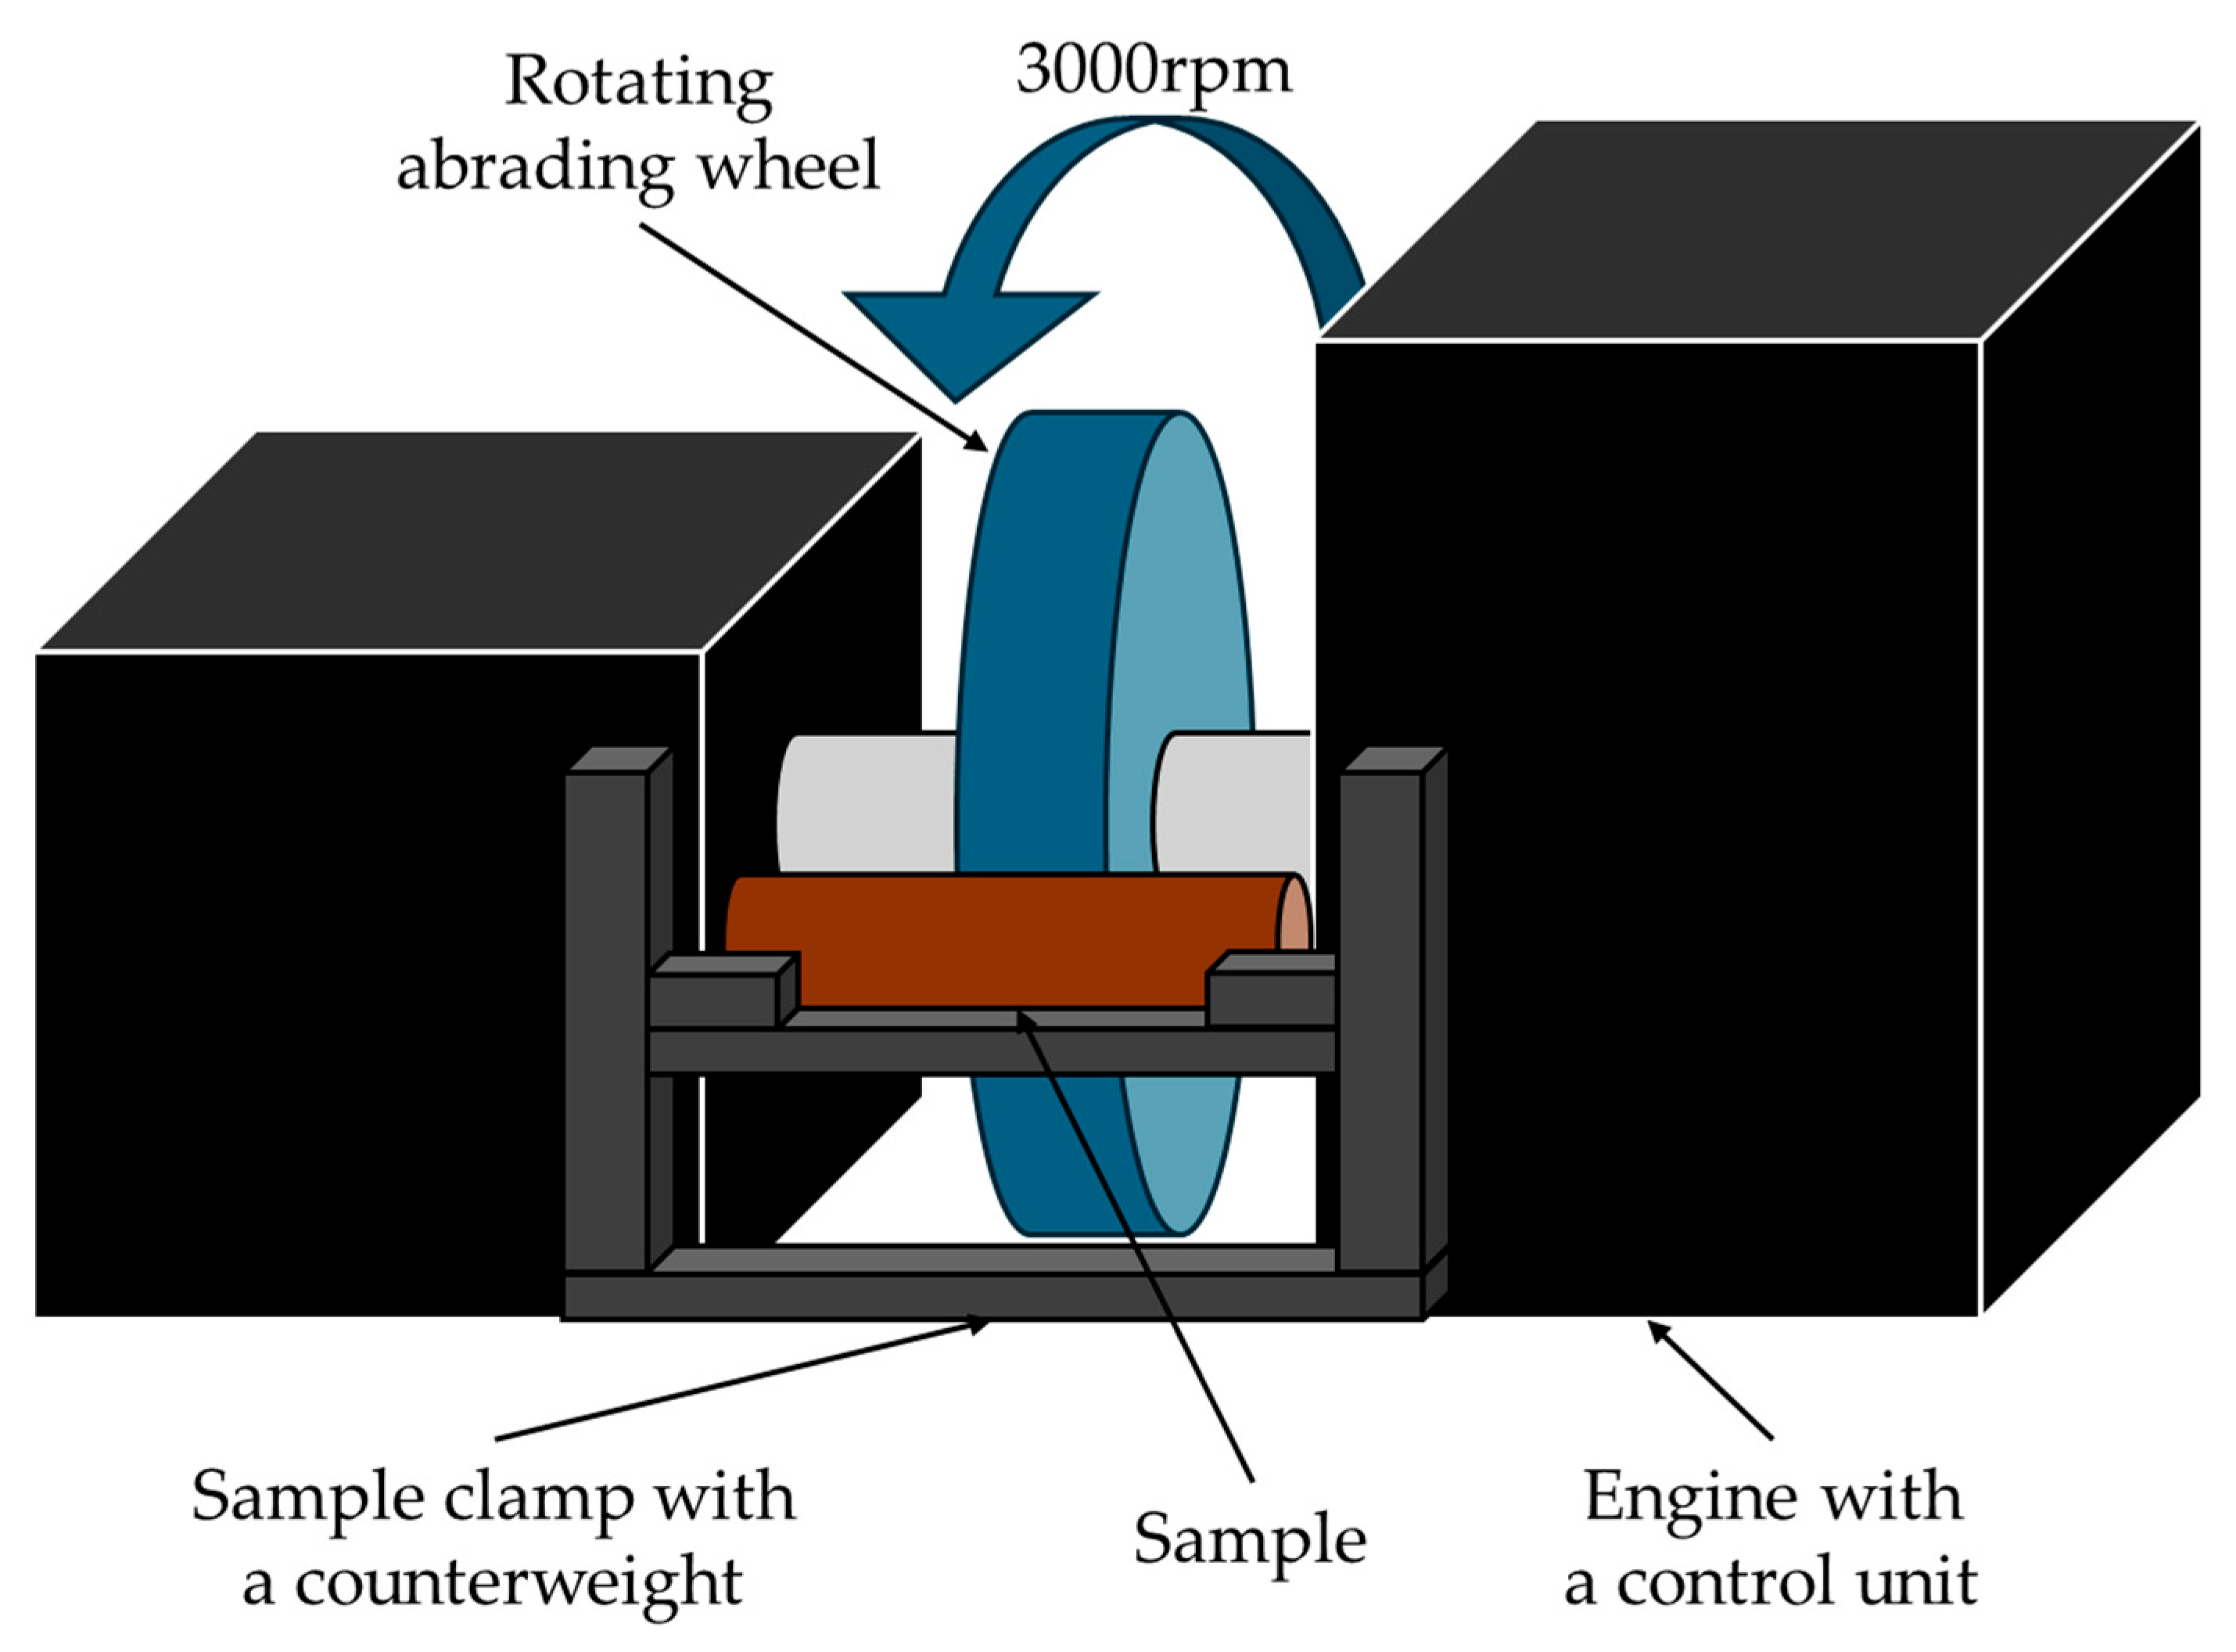
2.3. Abrasion Resistance Test

The main idea of the presented research is to design a fast method of assessing the abrasive resistance of metal rods or wires. Typical Taber abraser test is designed for flat samples, with the spring counterweight of 250 g, and rotating speed of up to 72 rpm, which makes it impossible to implement for such applications [54]. Therefore, a special laboratory device was designed by implementing a grinding machine engine, a control unit and the abrading wheel made of SiC120 with a diameter of 200 mm. By adding a clamp with a compensating spring counterweight of 2500 g (10 times higher than the typical counterweight). As presented schematically in Figure 1, it was possible to create an abrasion test stand that could provide fast results when the rotating speed of the wheel was 3000 rpm. Of course, it created a high temperature increase; therefore, the tests were conducted in 5 identical short cycles for each of the tested materials. The intent was for each cycle to be the equivalent of 1 km of abrasion contact distance; therefore, the time of the abrasion contact was calculated according to Equation (1).
t = 60   ×   d V r × C
where t is time (s), d is distance (mm), V r is rotational speed (rpm), and C is circumference of the abrading wheel (mm).
When all the variables were entered into the equation, it was calculated that the abrasion distance was 1 km using this test stand; it is necessary that each cycle lasts approximately 32 s. After each cycle, the samples were weighed to check the mass loss as a reference to the weight before abrasion. In addition to the classical weight loss approach, a 3D scan of the samples was conducted with the Zeiss T-SCAN Hawk 3D scanner (Carl Zeiss AG, Oberkochen, Germany), and the scanned mesh was correlated with the initial scan using Zeiss Inspect 3D software version 2023.2.0.1520 (Carl Zeiss AG, Oberkochen, Germany). The resolution of the used 3D scanner is 0.01 mm and the accuracy is 0.02 mm + 0.035 mm/m. The acquisition parameters set for each scan were 0.2 mm regarding the point spacing and 4 ms of the exposure time. The parameters were set to allow the reflective metallic surfaces to be captured. The calibration deviation was 0.0052 mm. Since laser/optical technologies are sensitive to temperature variations, the 3D scanning was performed in an air-conditioned laboratory with a constant temperature of 20 °C. The scan is always preceded by capturing of the reference points, which adjust the sample in space and allow high quality models to be obtained. After capturing the mesh of points, it was subjected to polygonization with standard postprocessing applied with a factor of 1.0. The alignment was performed by geometric elements always in the same order of cylinder–plane–plane. This allowed for the best fit of the analyzed samples to be obtained.

3. Results and Discussion

3.1. Chemical Composition

The chemical composition of selected materials was analyzed with the arc spark spectrometer, and the obtained average values are presented in Table 2. The conducted analyses provided more elements; however, most of them were at the verge of the limit of determination or below it, meaning that their amount is 0 ppm or close to 0 ppm. This is why their sum is presented as balance in the other elements column. The dispersion of the measurements is marked next to each average value.
In the case of all seven materials, regarding all of the significant elements, the calculated average values of the measured chemical compositions fall within the nominal ranges presented in Table 1. The five conducted measurements provided similar results, which suggests that the materials did not exhibit a macrosegregation of the alloying additives. Since macrosegregation would notably influence the mechanical properties of the tested materials [60,61,62] and thus could potentially affect the abrasion resistance [57,58], it was important to obtain homogenous materials. After the correctness of the chemical composition was confirmed, the samples were subjected to further research.

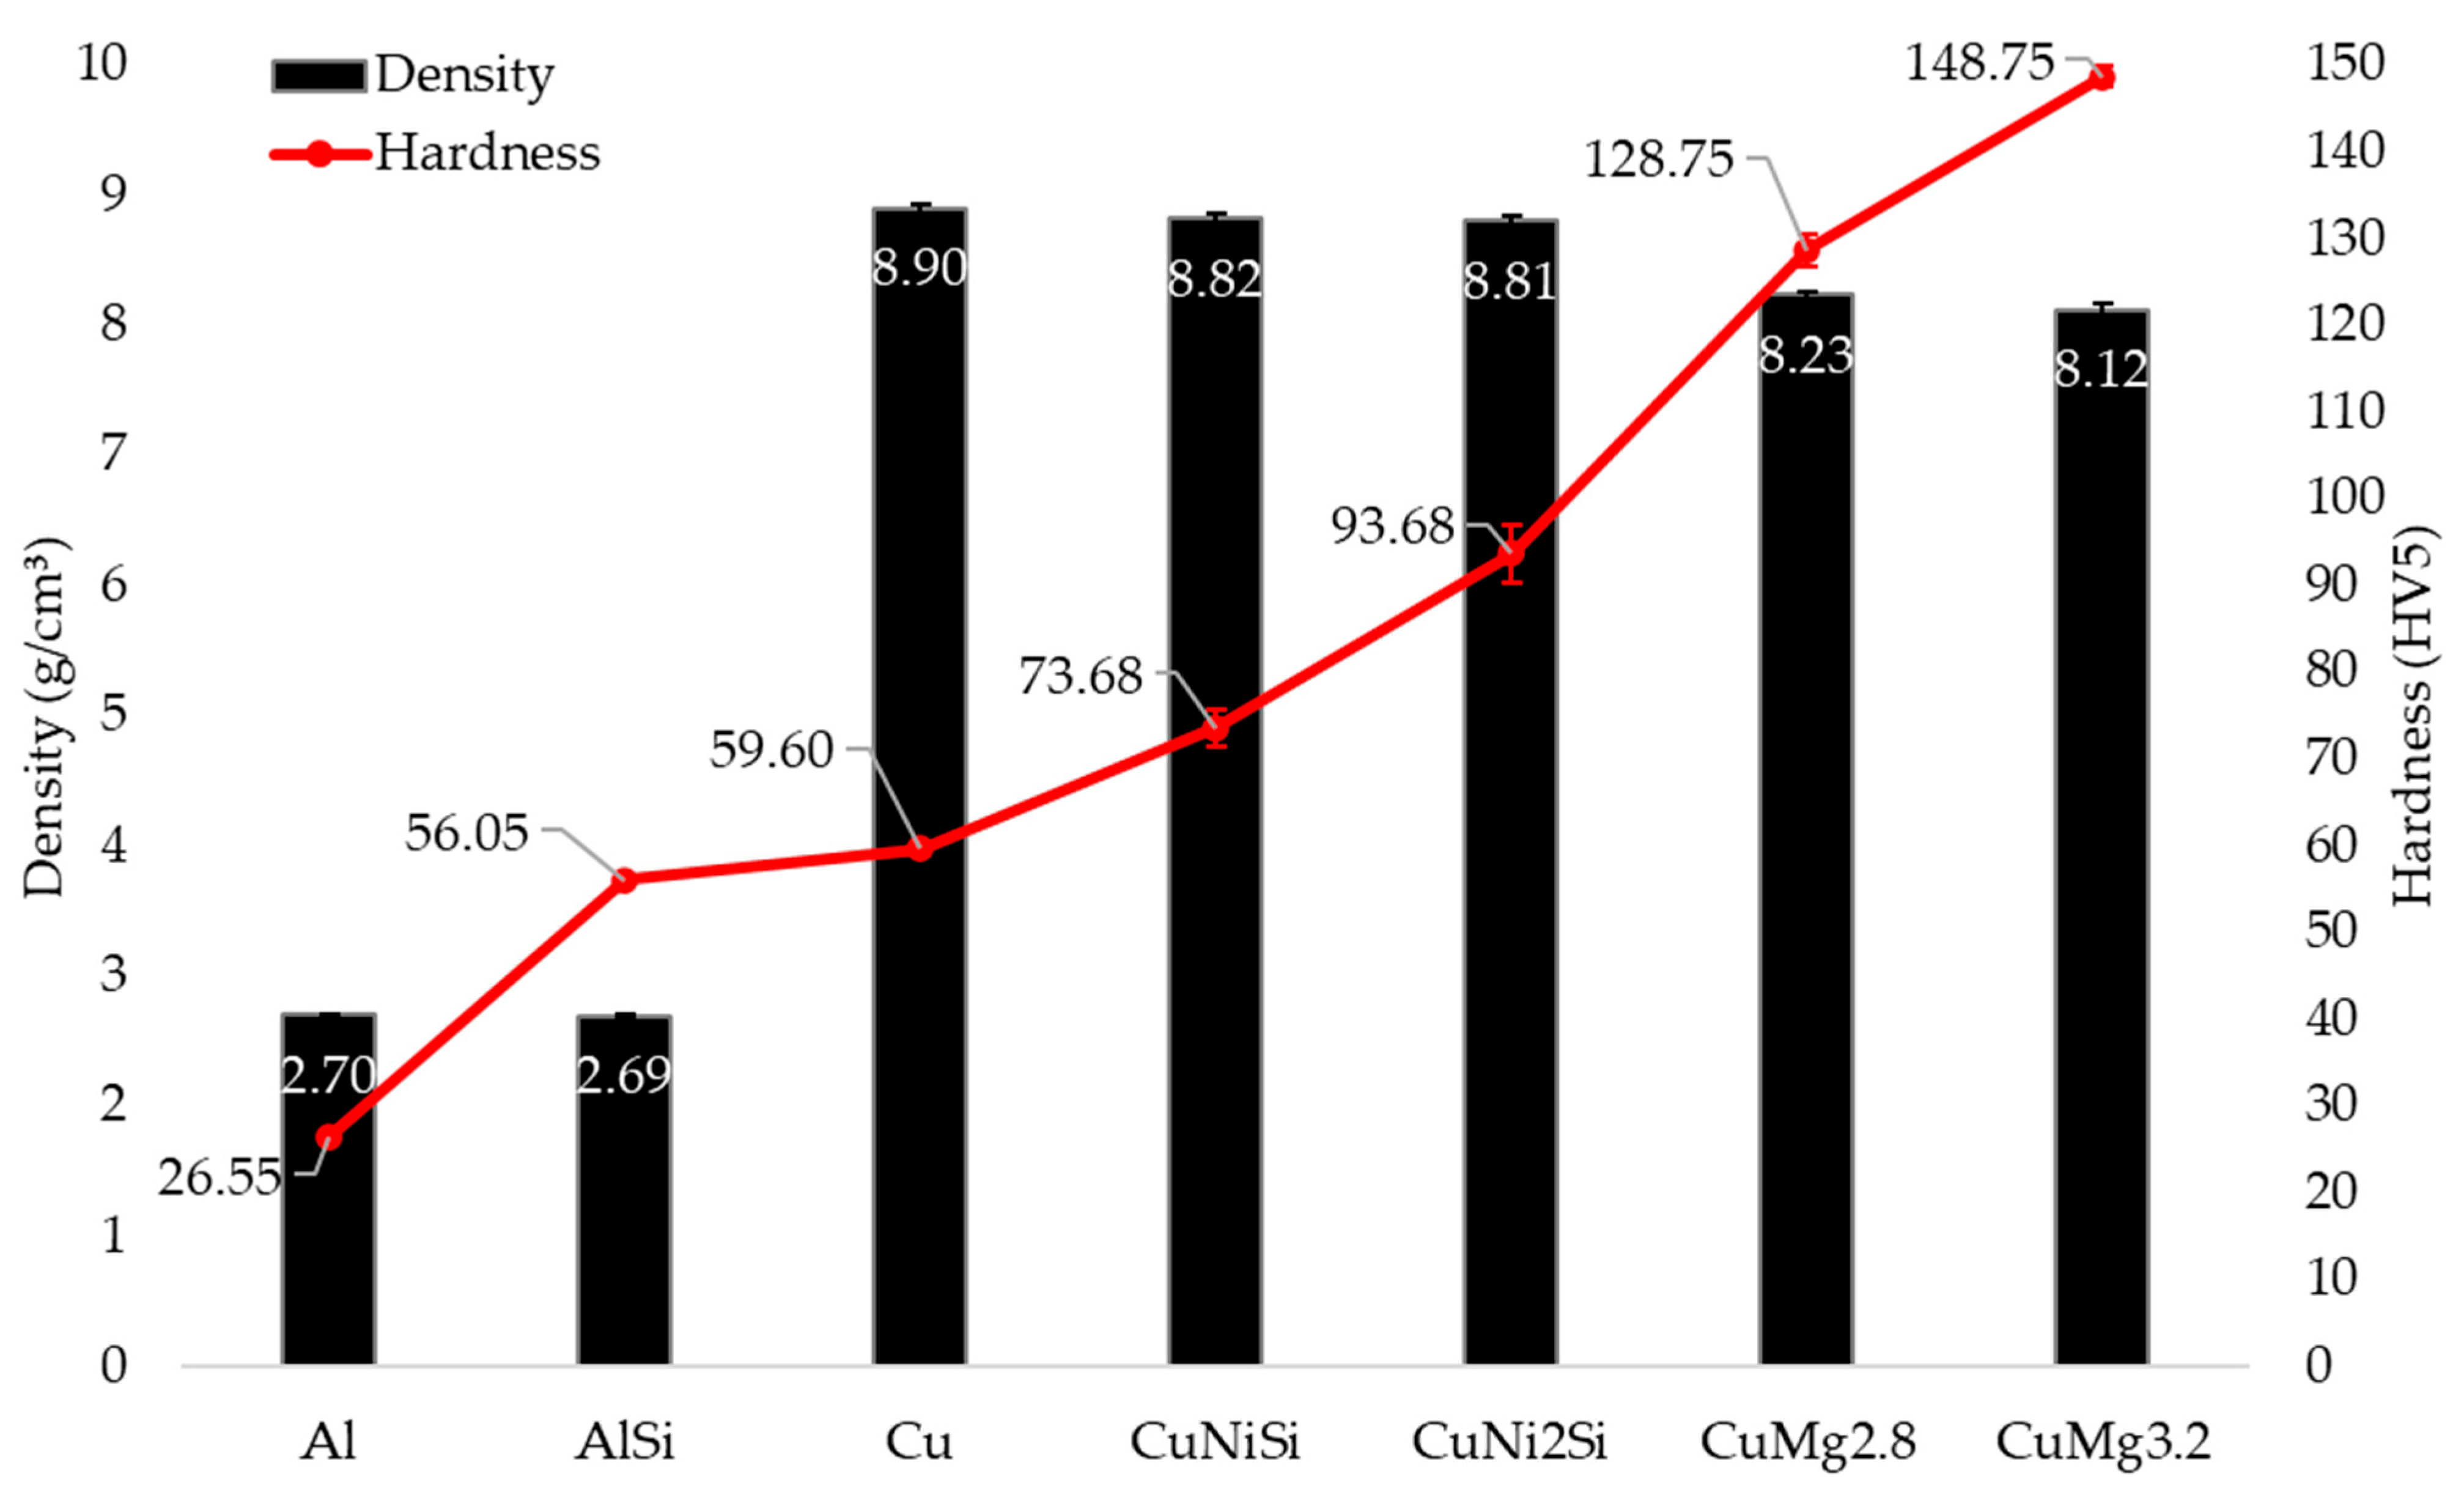
3.2. Properties Characterization

It is important to note that the samples were analyzed in the as-cast state. However, all tested materials can be subjected to strain hardening during cold metal working [12,24,39,63,64]. Moreover, apart from pure materials and the AlSi alloy, which is known to be not heat-treatable [65], the other tested alloys, i.e., CuNiSi and CuMg, may be subjected to further precipitation hardening by supersaturation and aging [40,66,67]. Taking this into account, the samples subjected to hardness and density characterization were taken from the parts of the rods that were not subjected to abrasion, as the test generates heat and might influence the measured values. The graph presented in Figure 2 represents the average values of the conducted measurements along with the error bars representing the standard deviation values for each set of data. Since the standard deviation was at such a low level (in some cases below 1), it was decided that the amount of indentations (10), the time of indentation (10 s), and the applied load (5 kgf) were chosen correctly and did not need to be altered.
The obtained density and hardness results are in agreement with known databases and previously published works [8,39,55,56,65]. The data presented in Figure 2 show why these specific materials were chosen to reach the objective of this paper, which is not only to test the abrasion resistance of materials but also to correlate it with both hardness and density. When analyzing the data, it is important to notice three clusters of data. The first cluster consists of Al and AlSi samples, which have an almost identical density, while the hardness of the latter is approximately two times higher. Another important set is AlSi and Cu, where the hardness is very similar, while Cu is over three times denser. The last significant group is the copper alloys, where CuNiSi alloys have a lower hardness and higher density than CuMg alloys. Since all materials are in the as-cast state, the hardening effect of alloys comes from solid-solution hardening [28,41]. As mentioned, the addition of Si to Al provides a twofold increase in hardness due to solid-solution hardening. Regarding copper alloys, the results are even more significant, especially in the case of CuMg alloys. For the lower concentration of Mg (single-phase alloy [39]), the increase is over twofold, and in the case of the higher concentration of Mg (two-phase alloy [39]), it is almost threefold, while the density of both CuMg alloys decreased compared to pure Cu. This selection of materials should allow the assessment of the influence of both hardness and density on the abrasion resistance of cast rods.

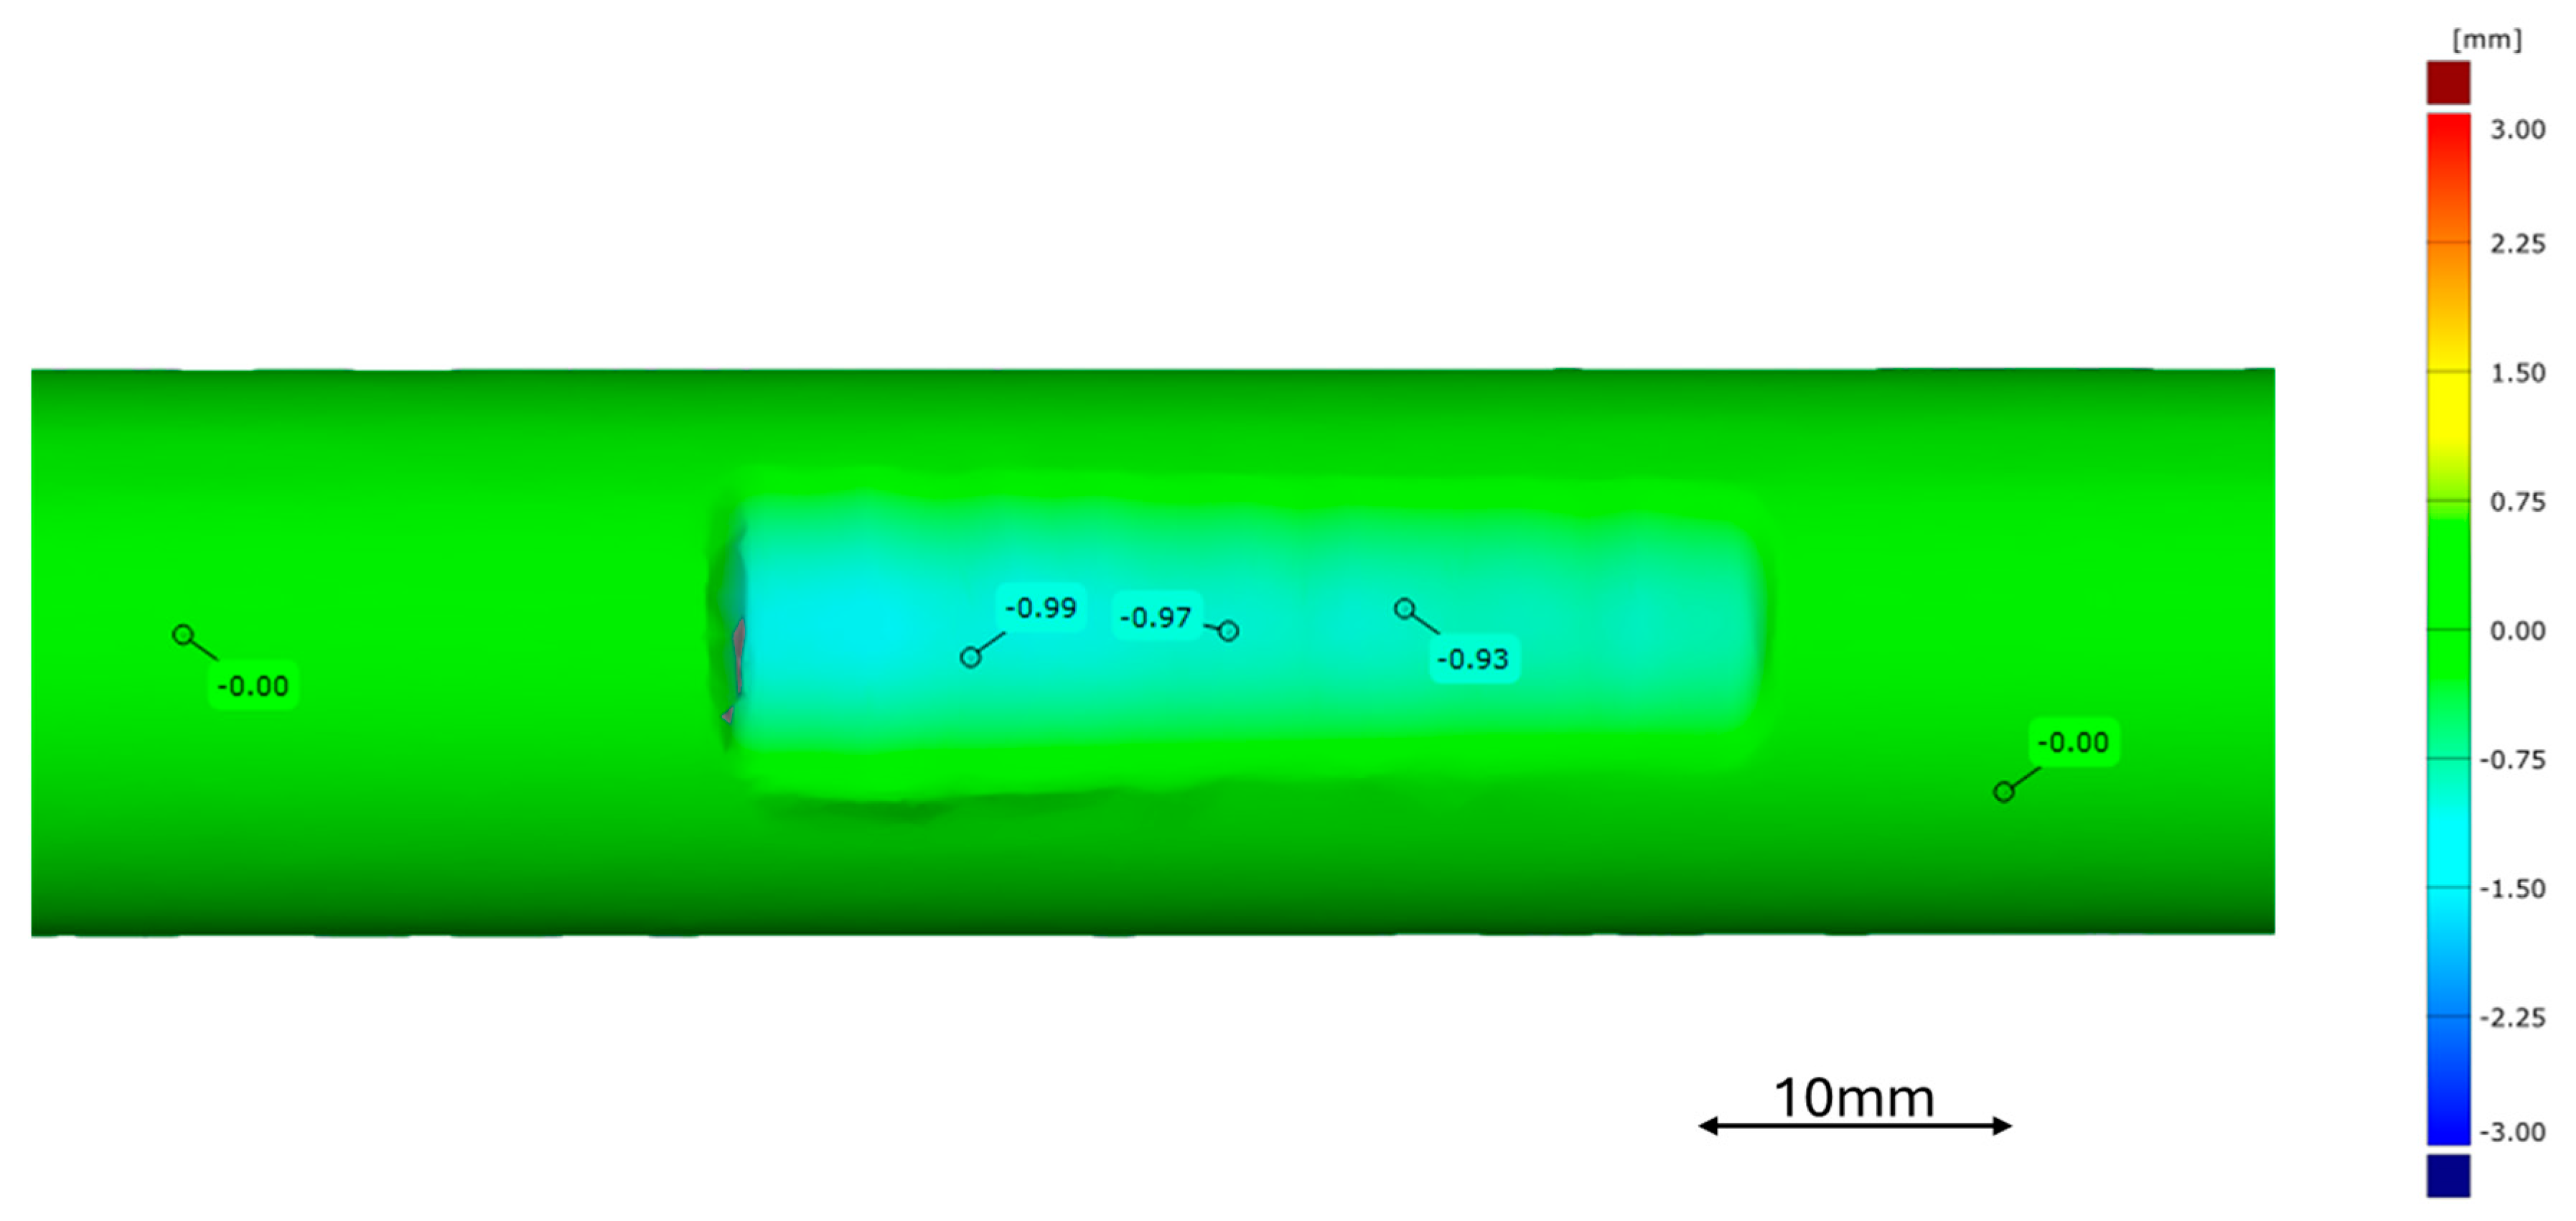
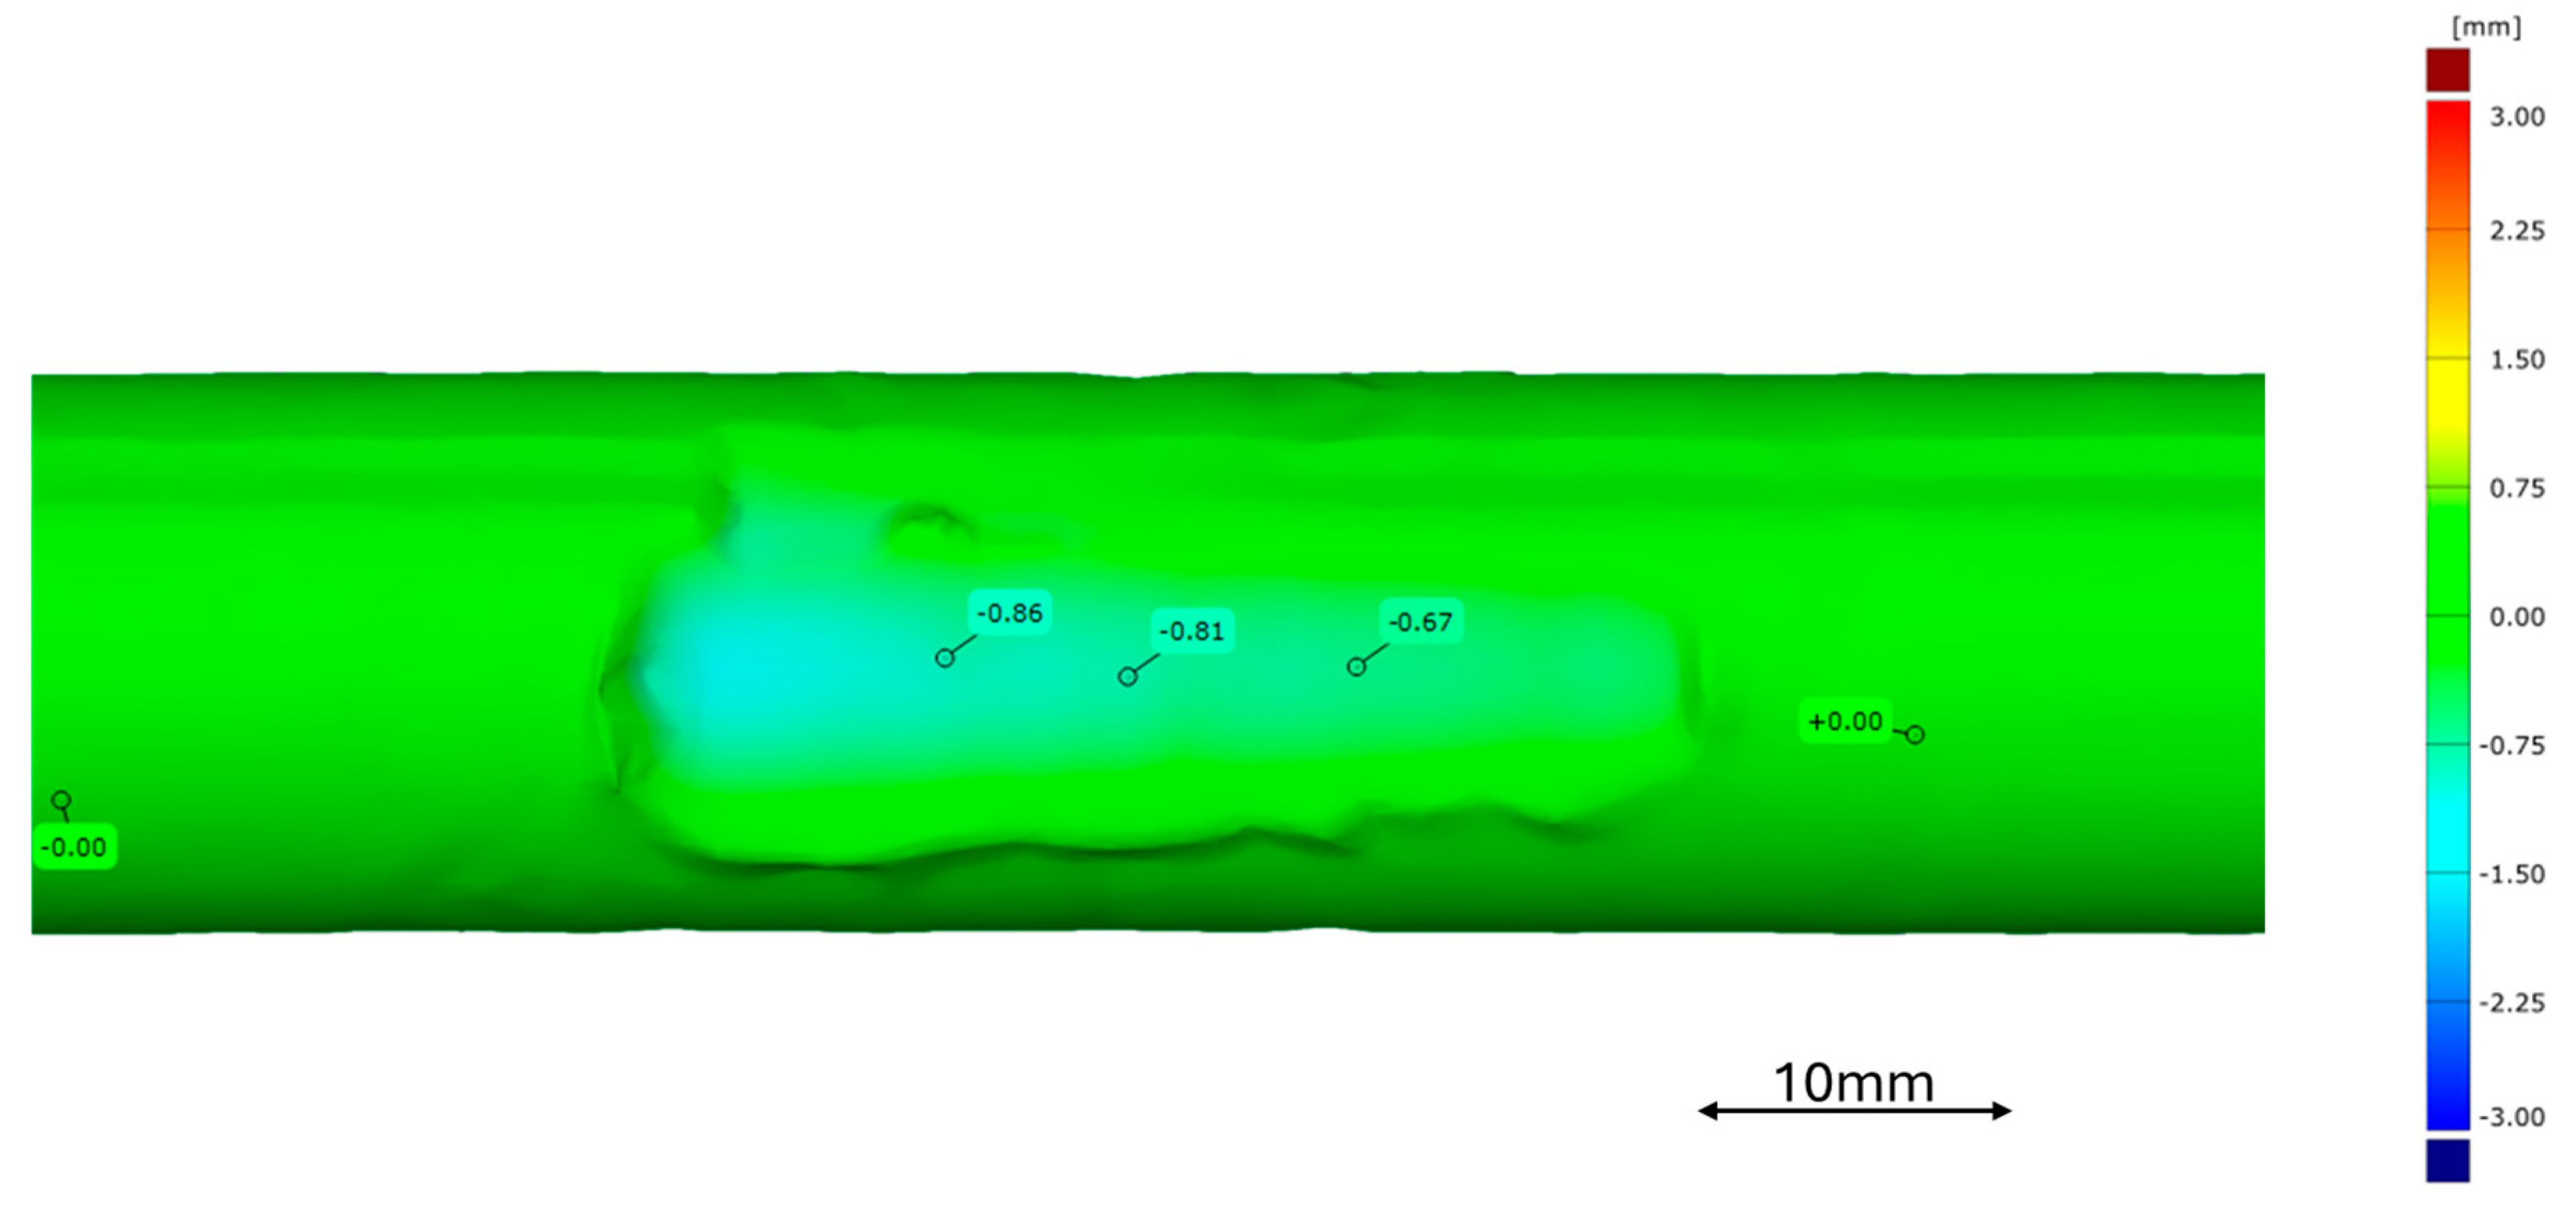
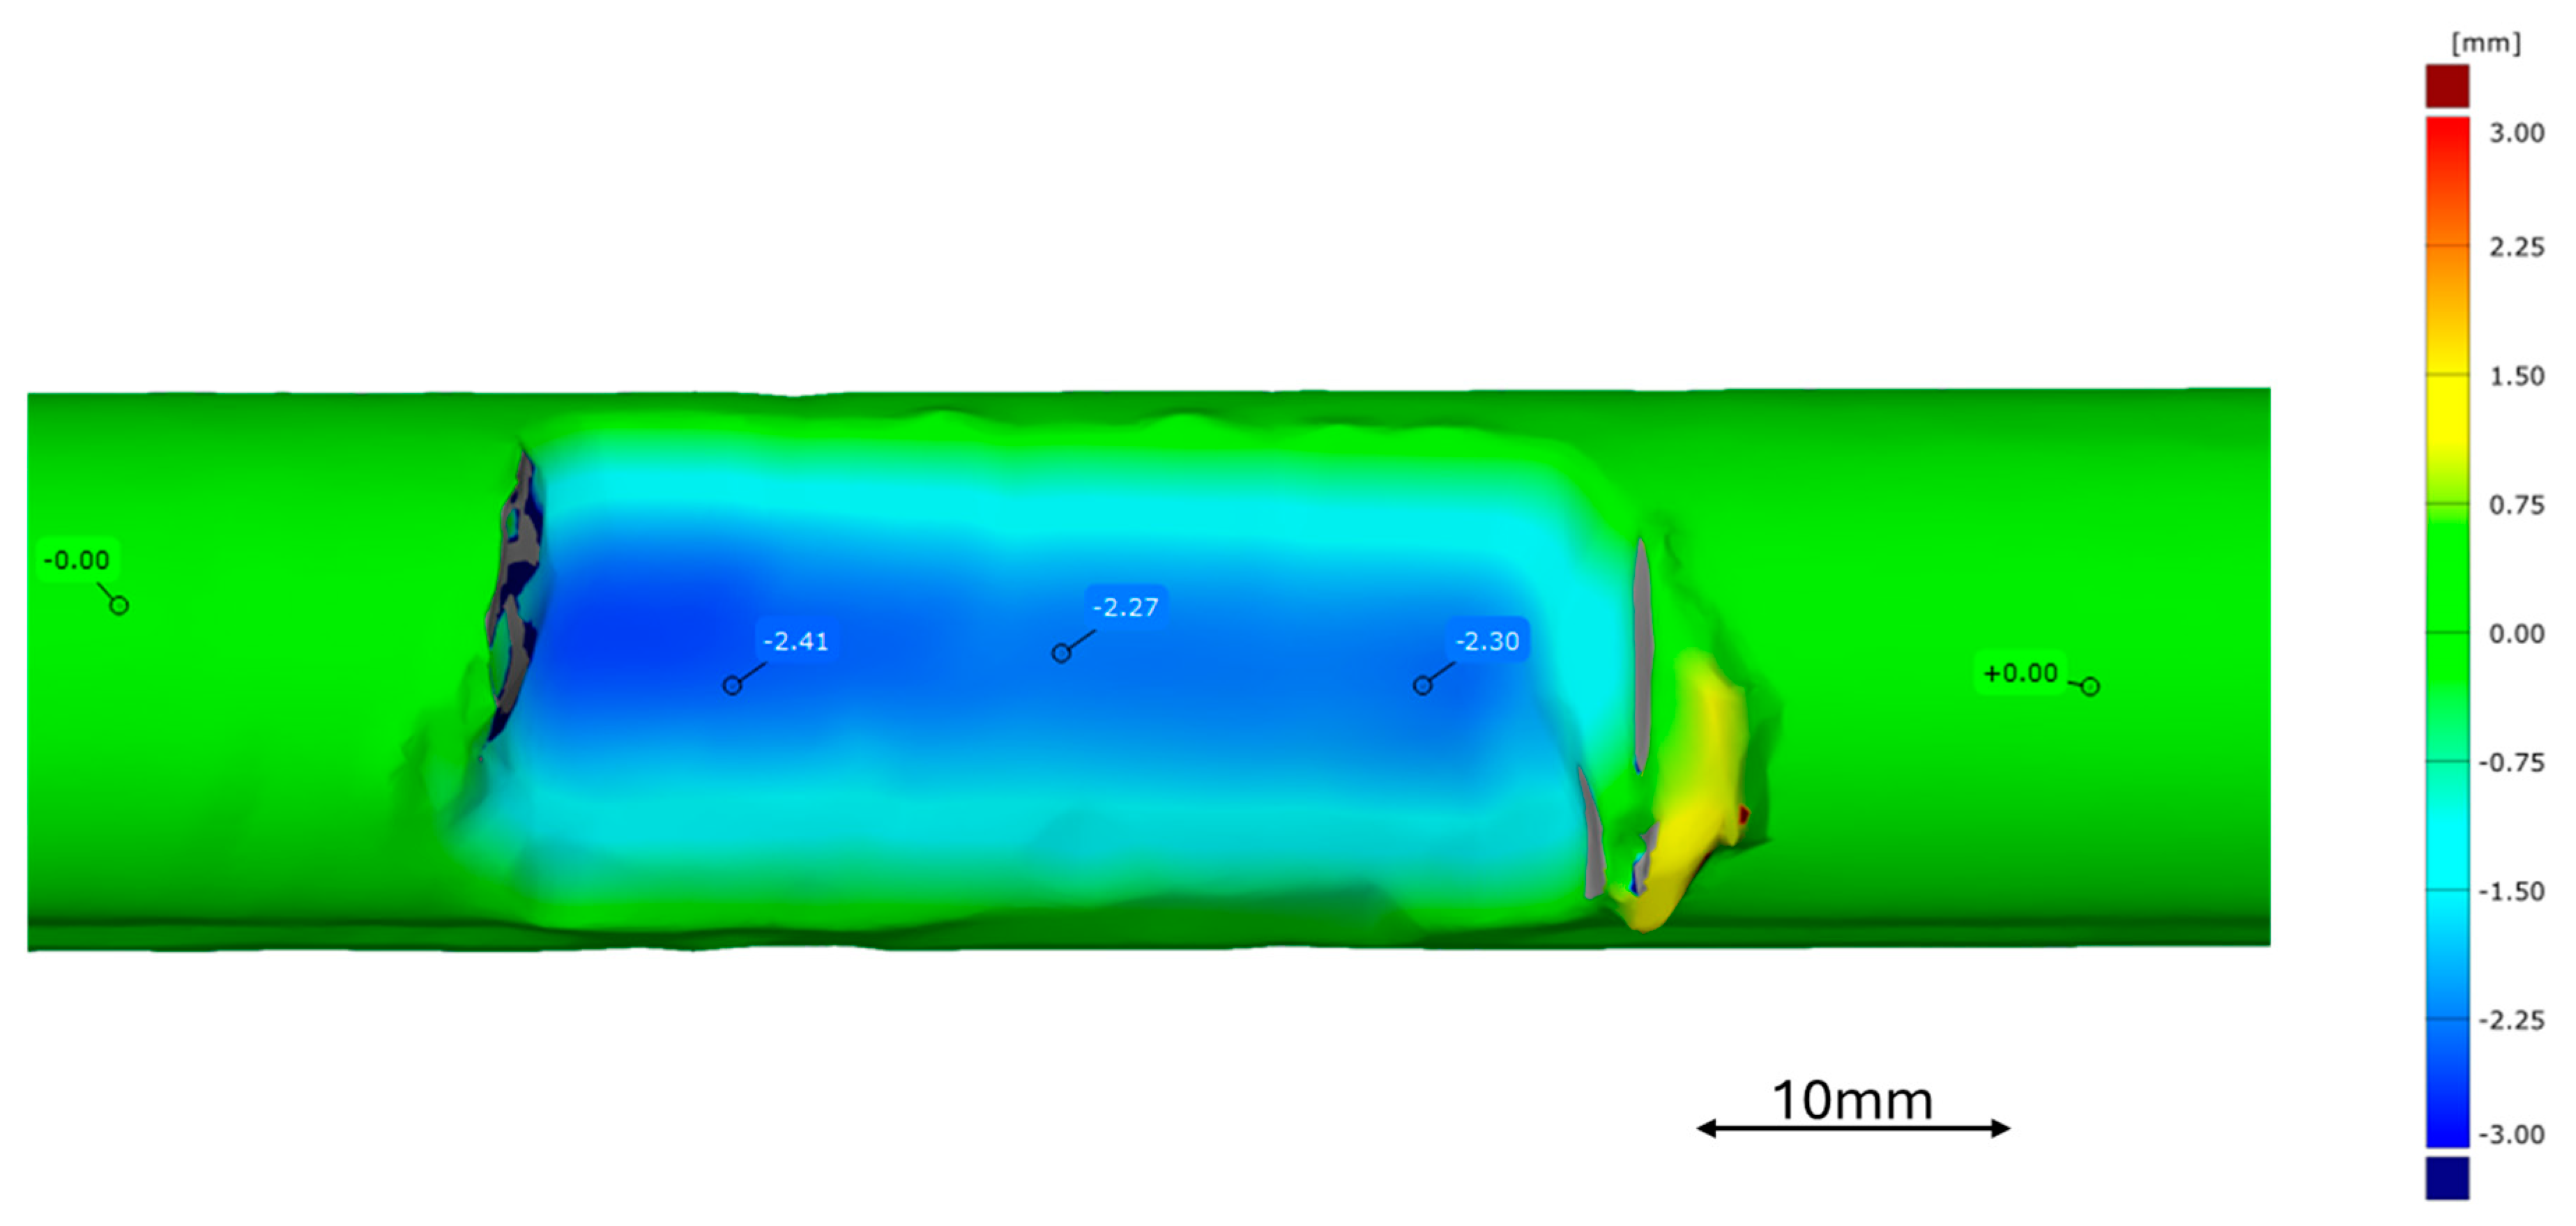
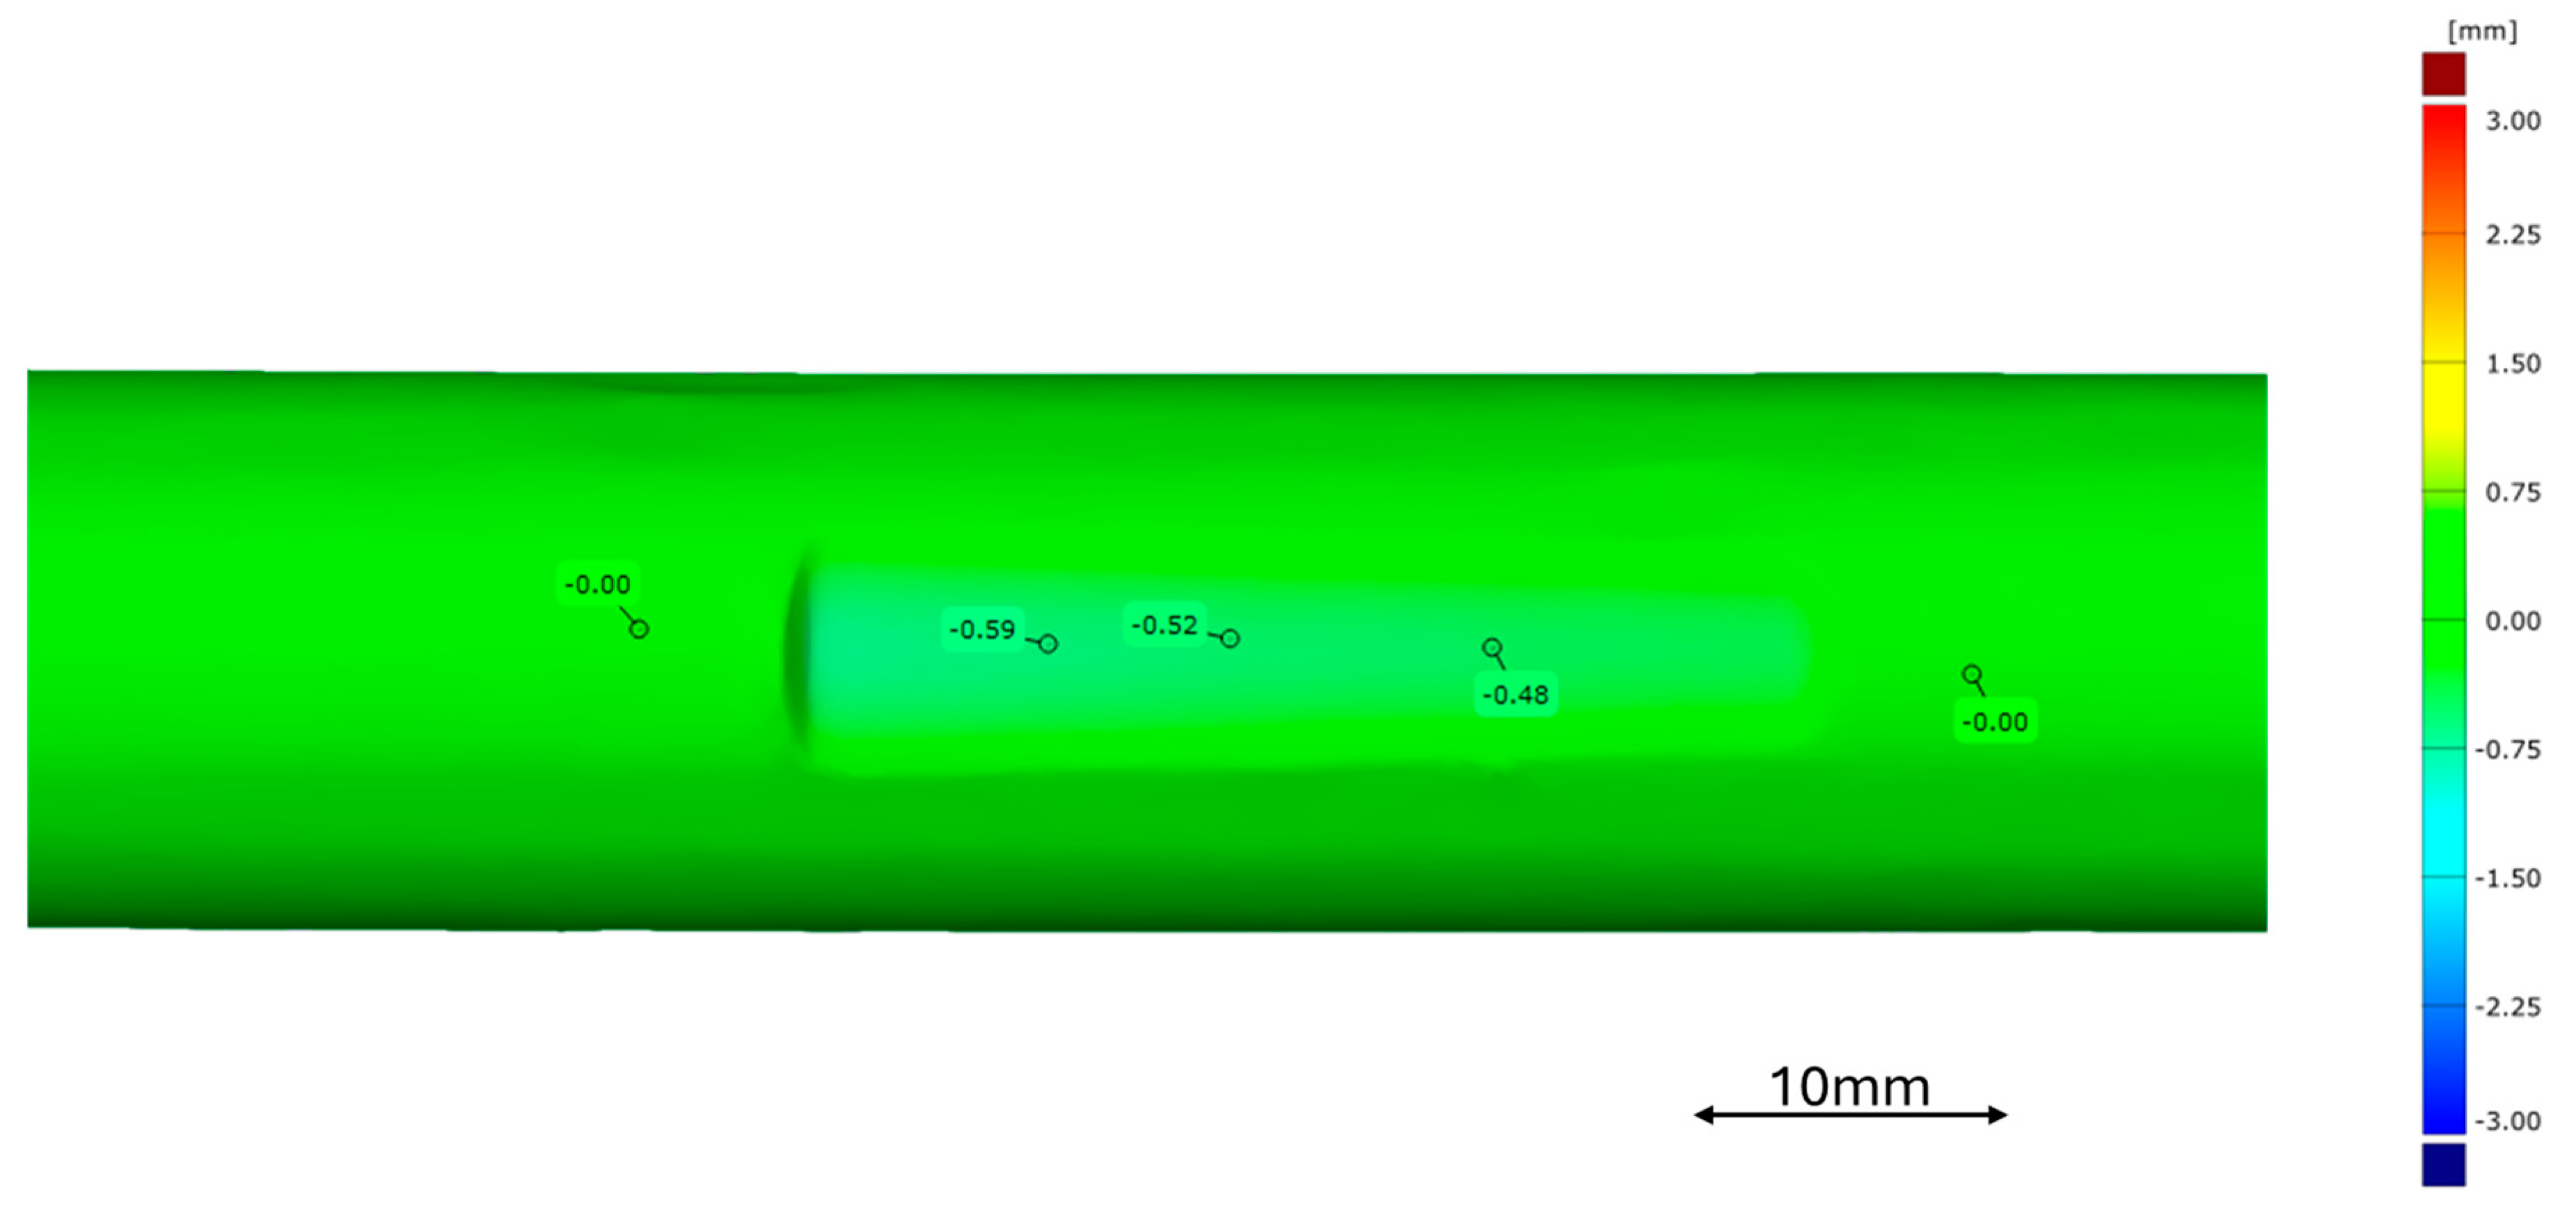
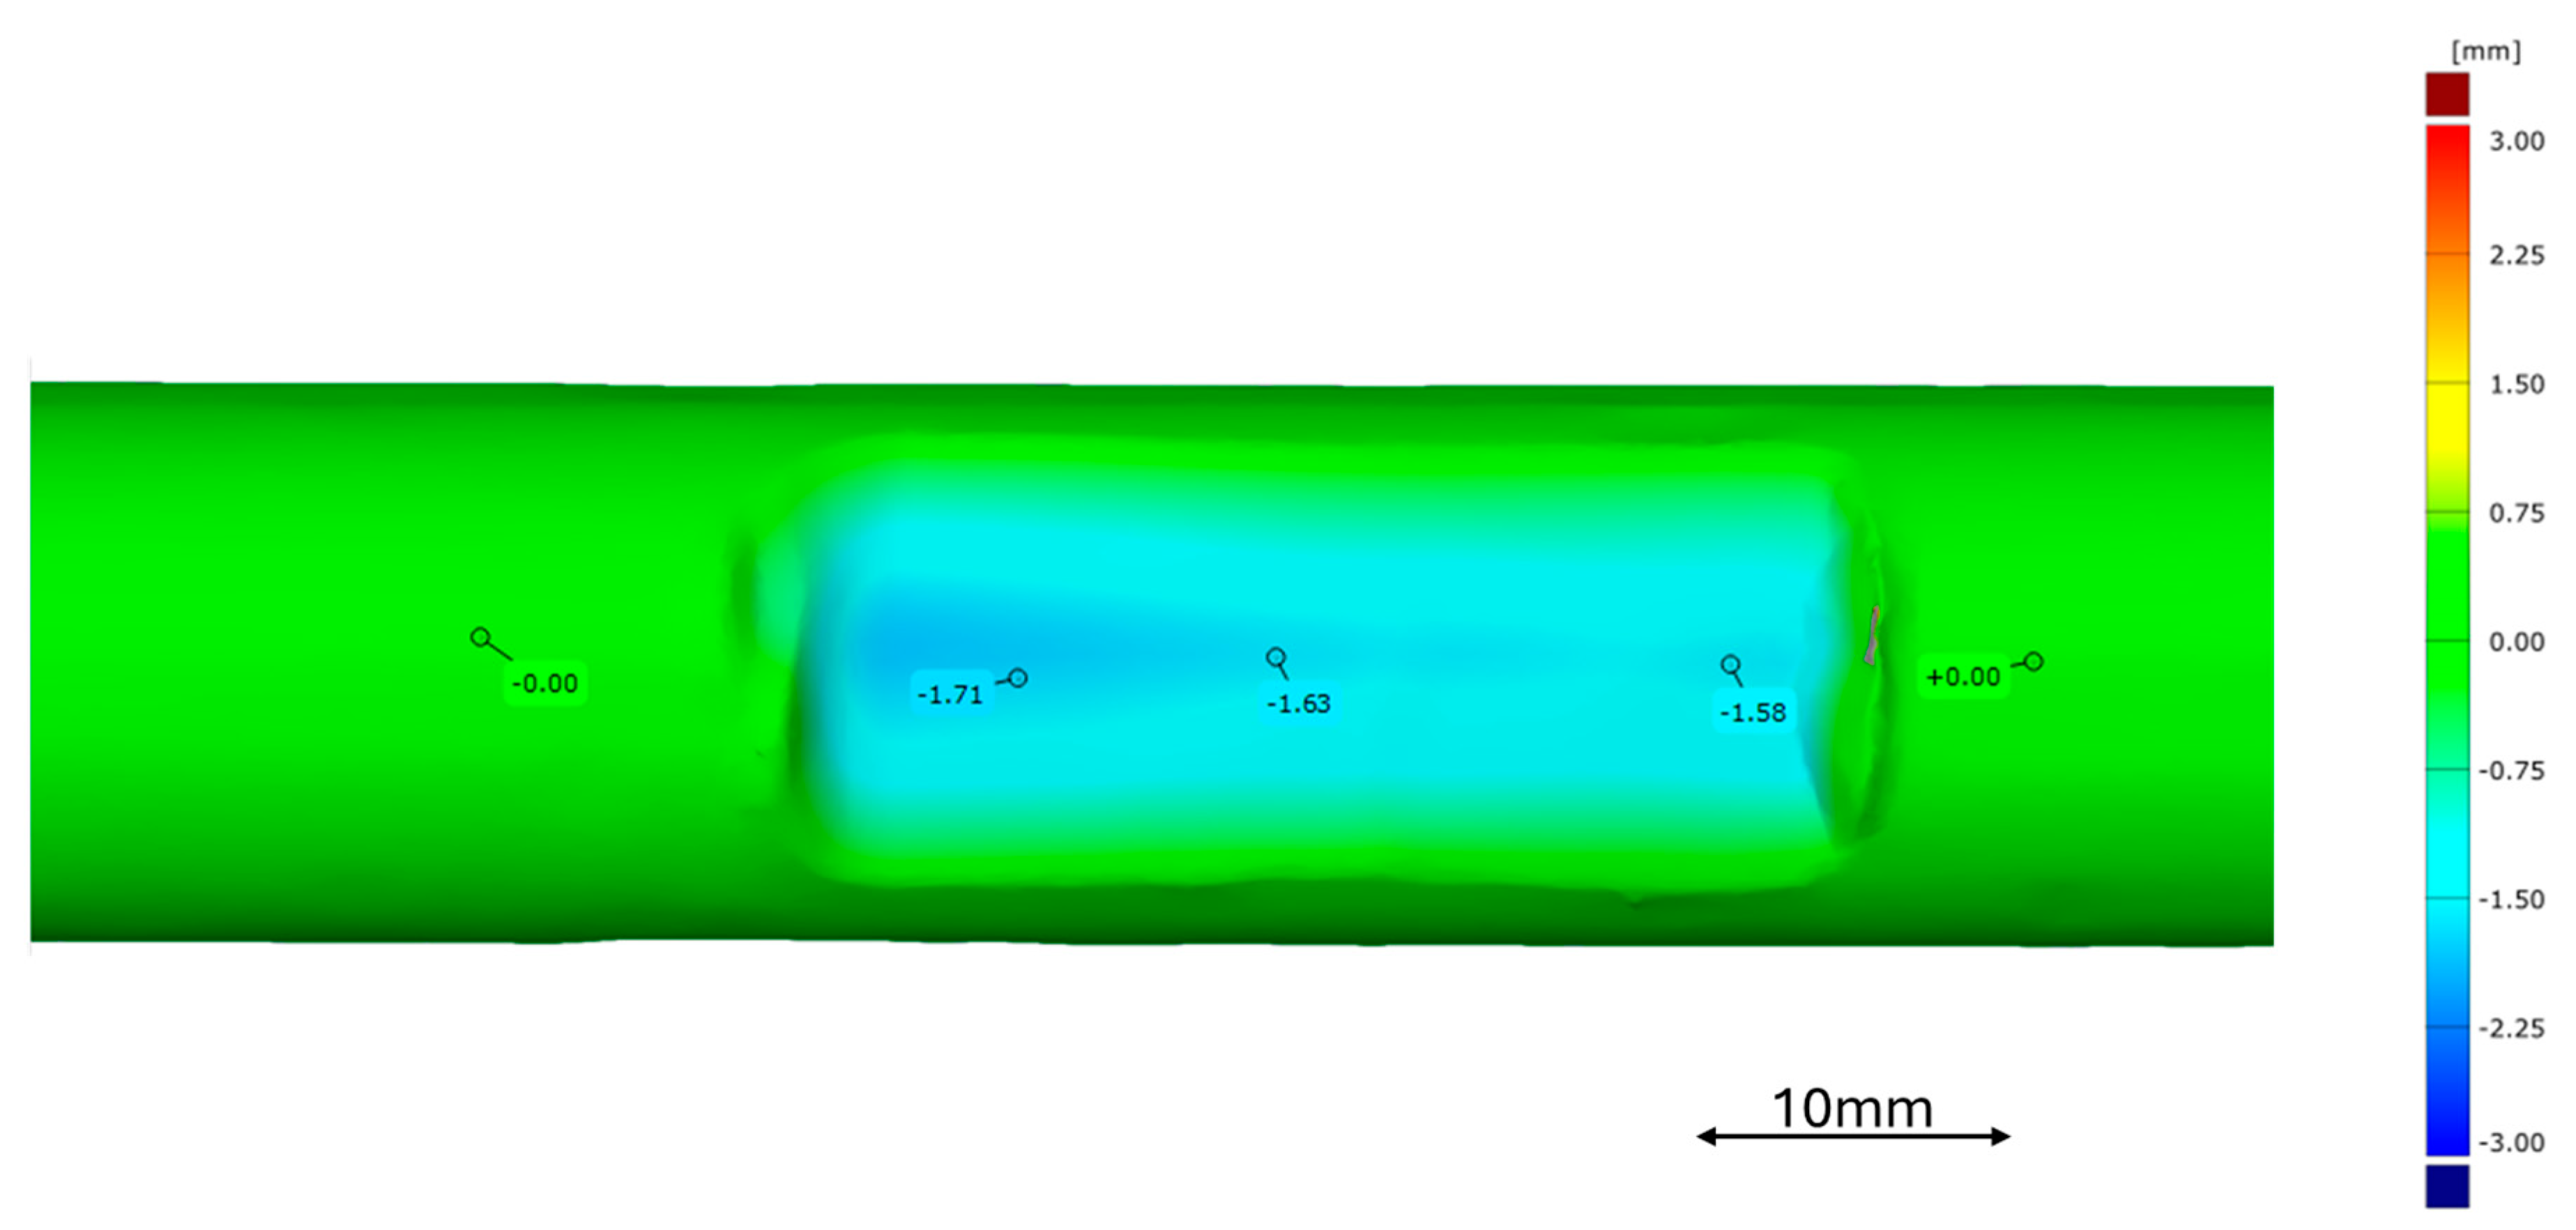
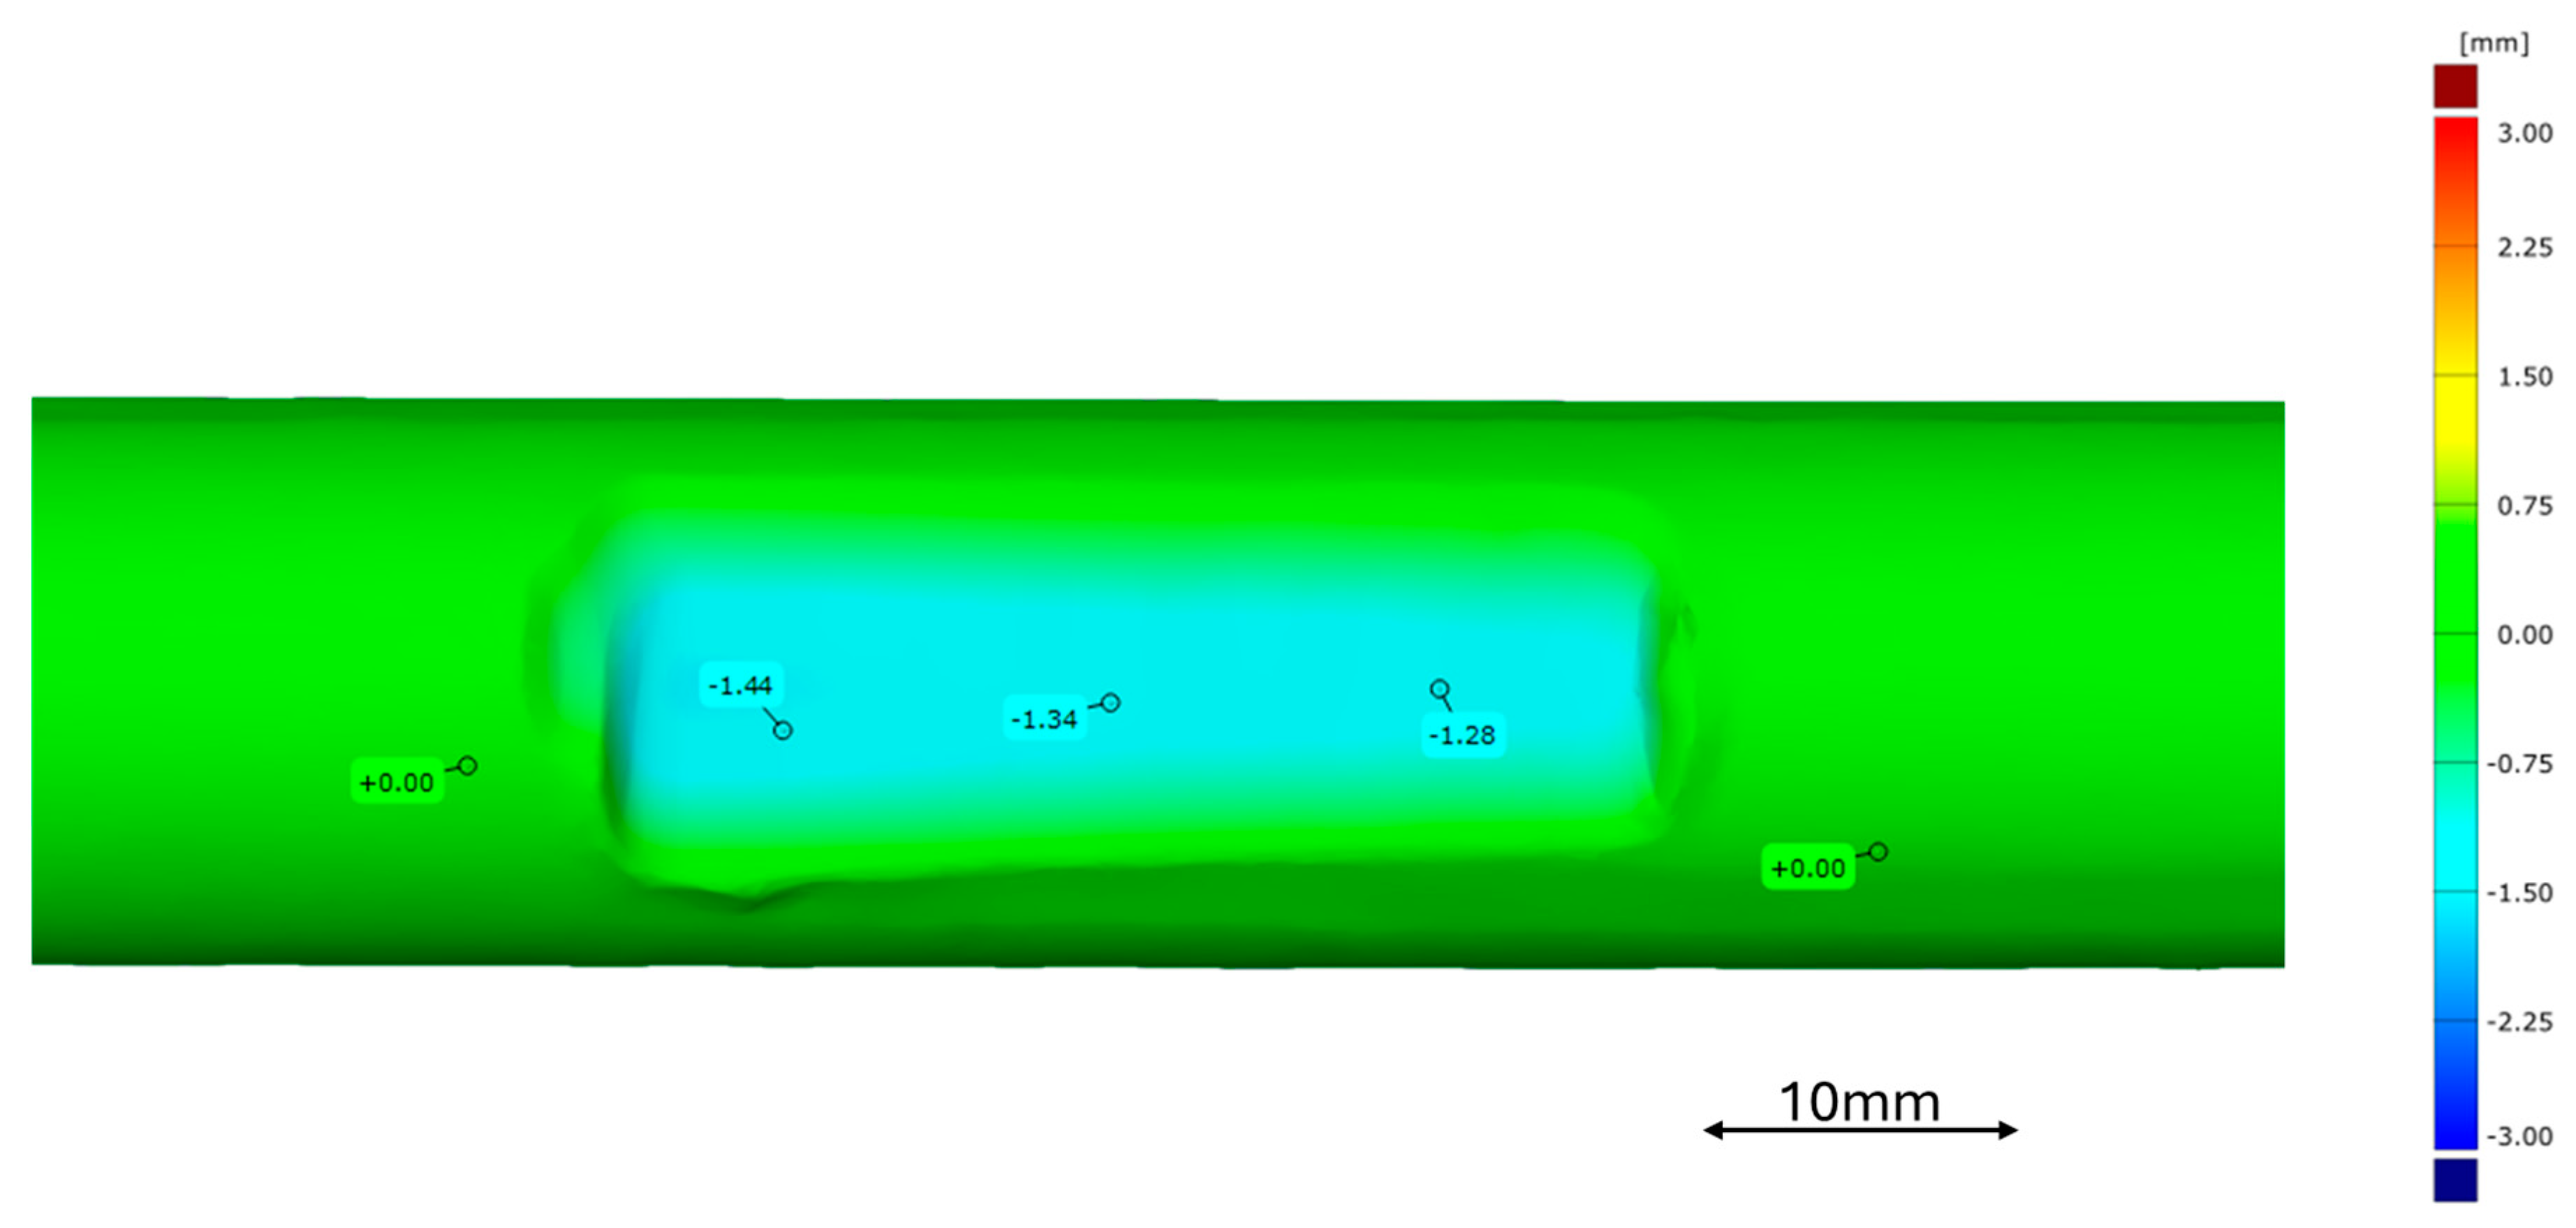
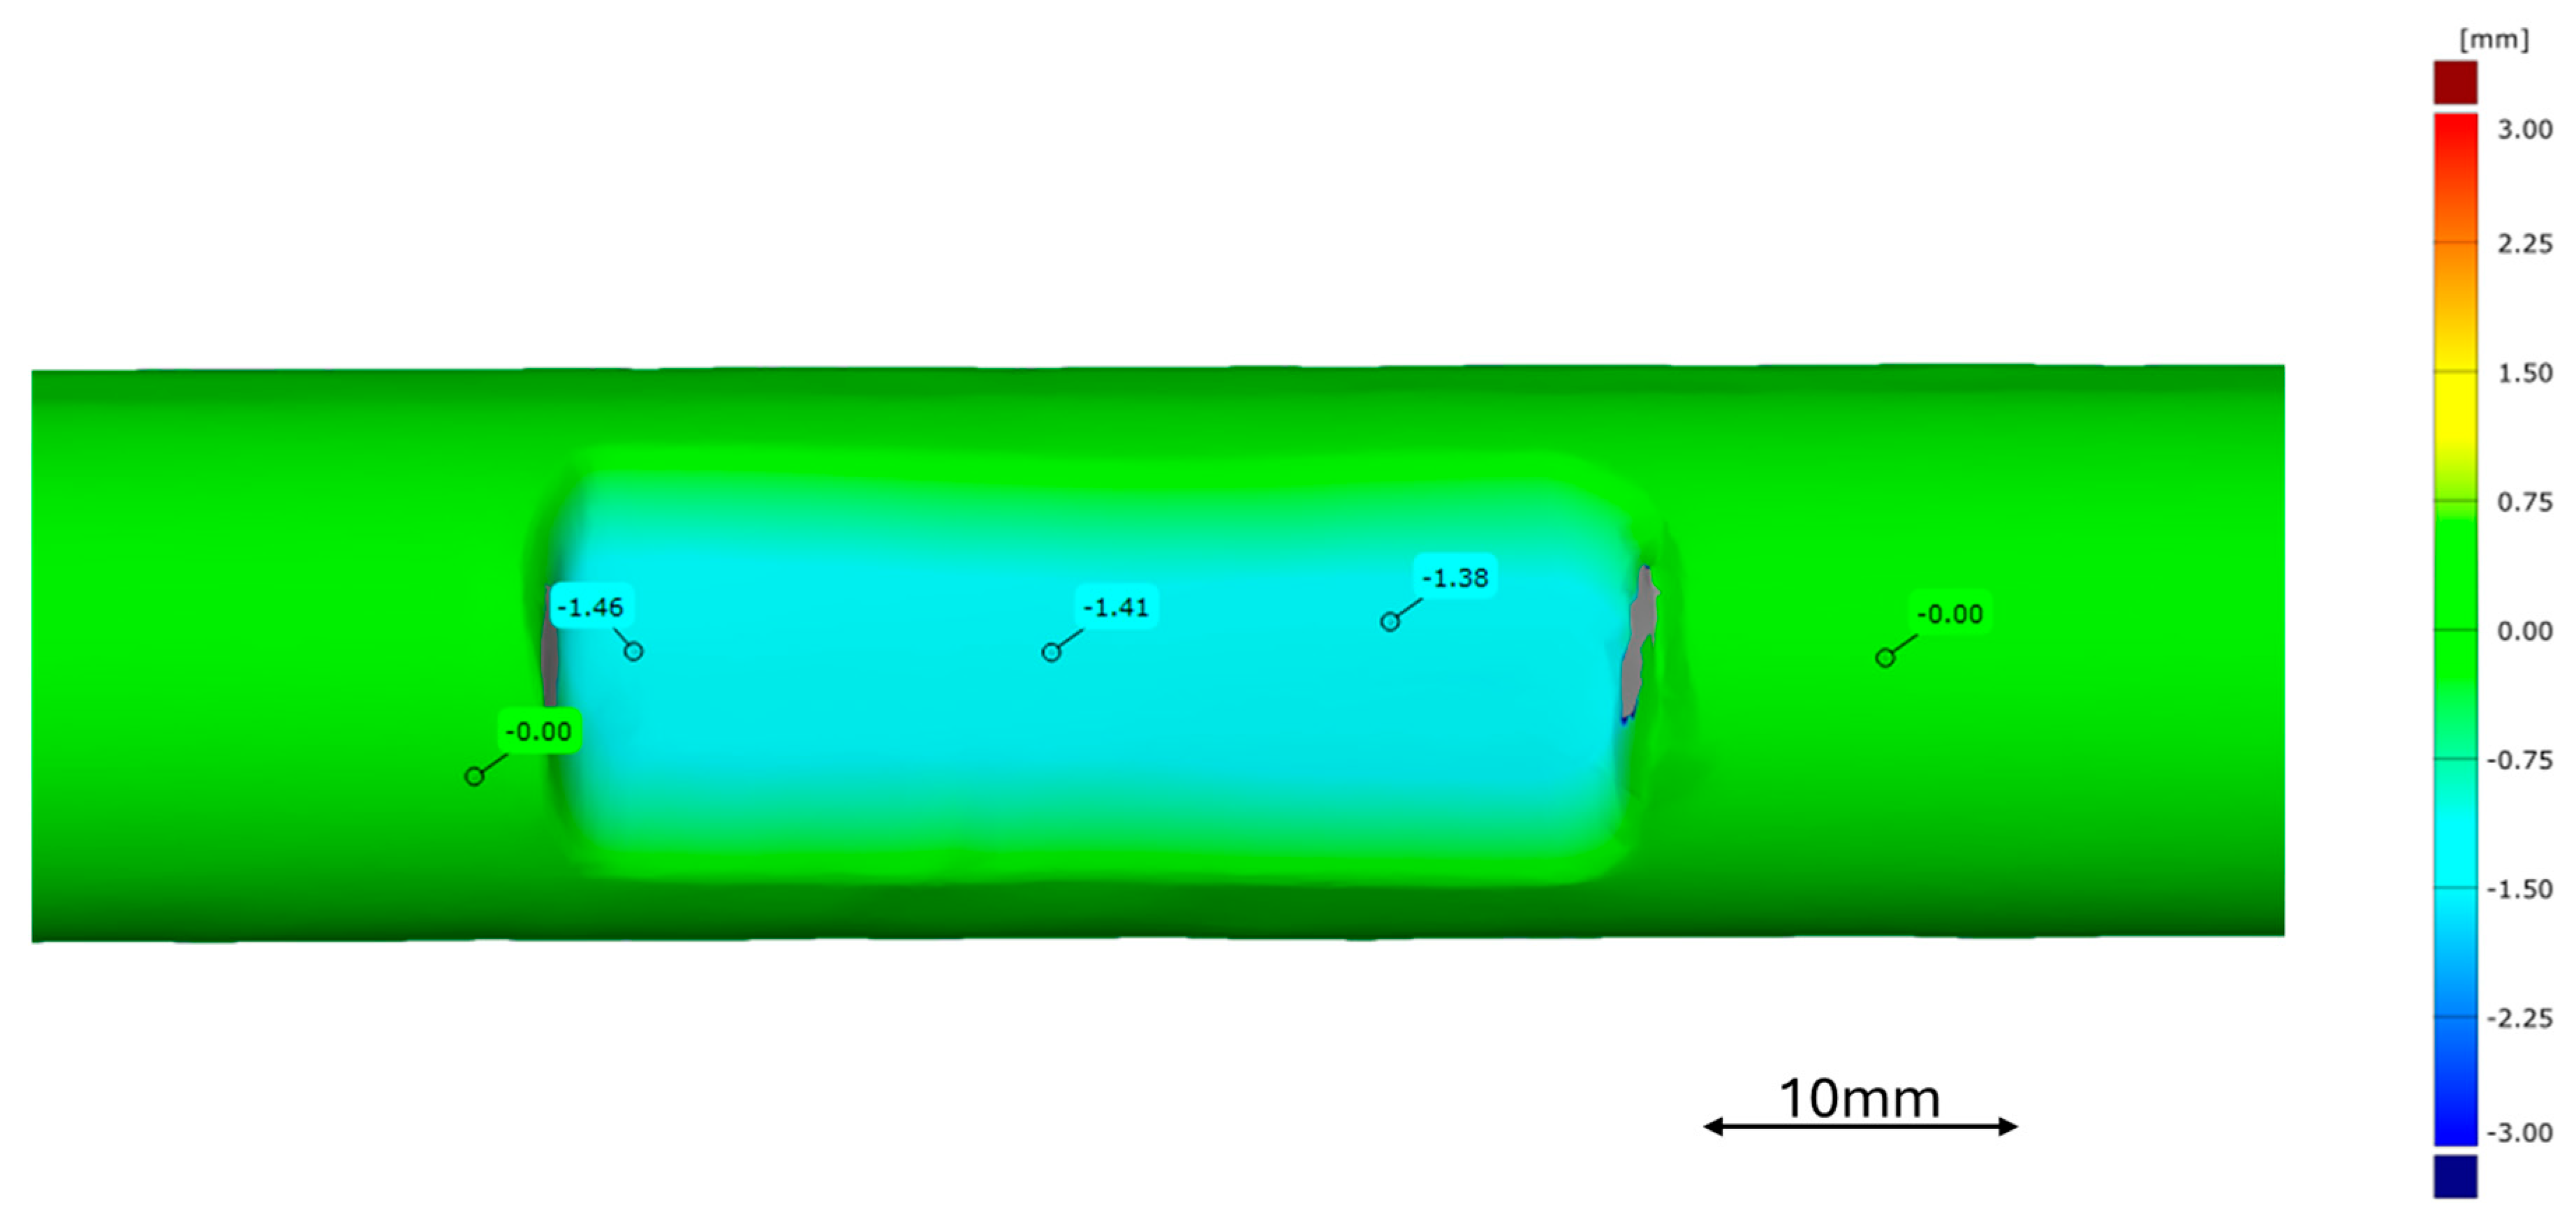
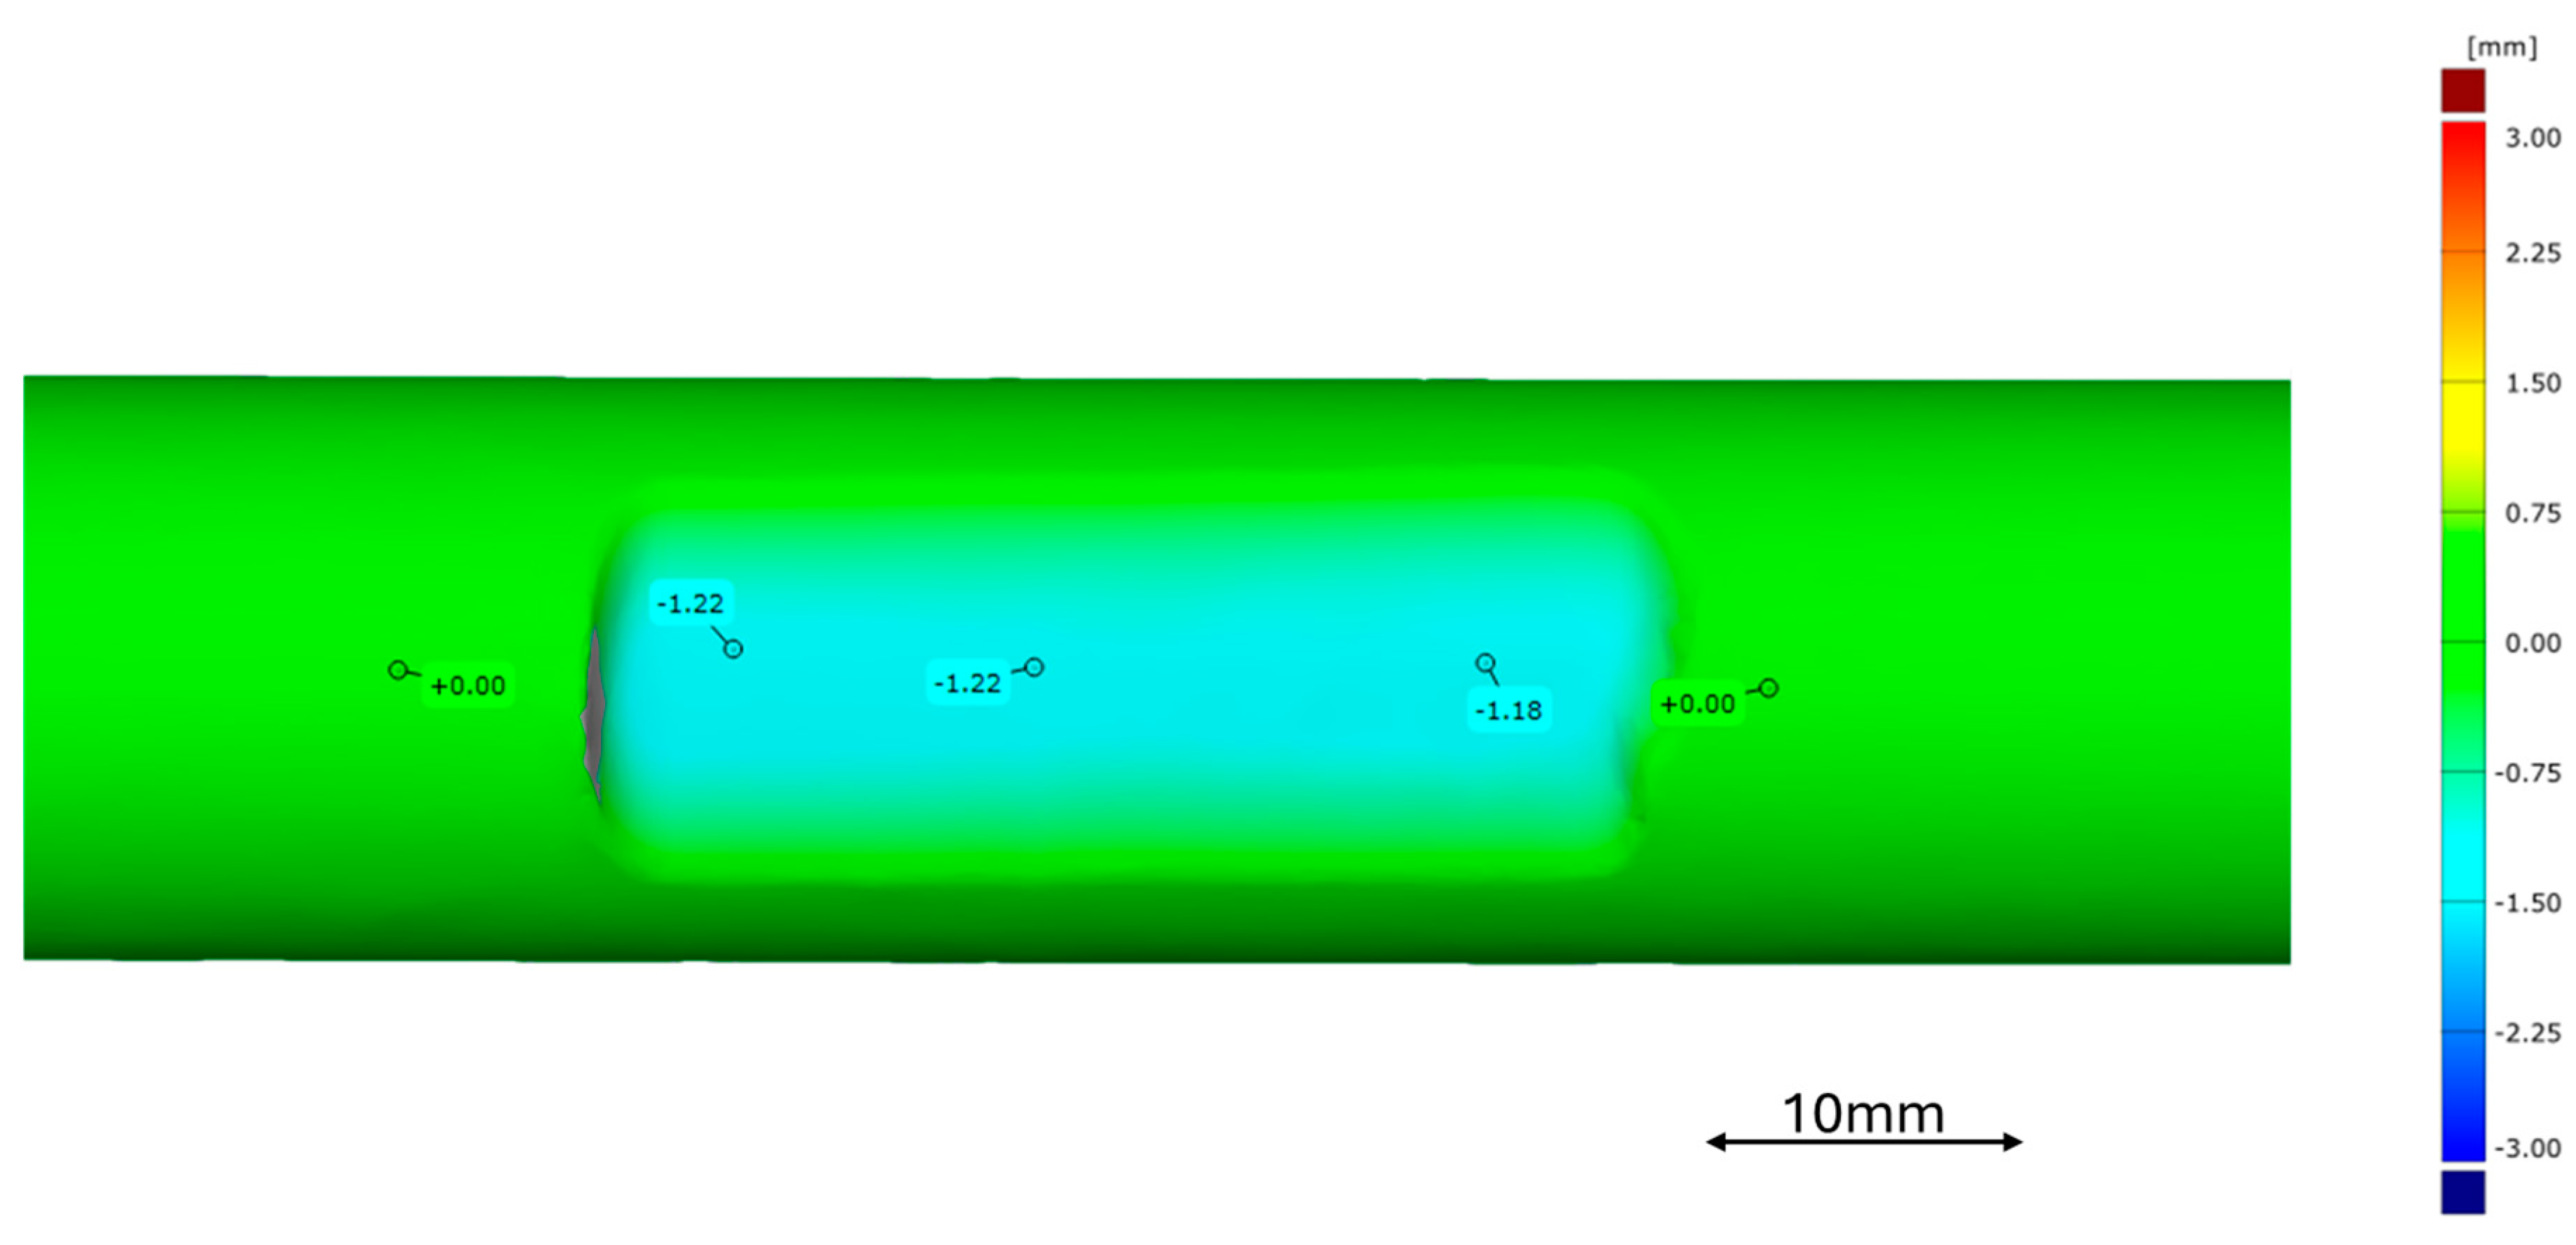
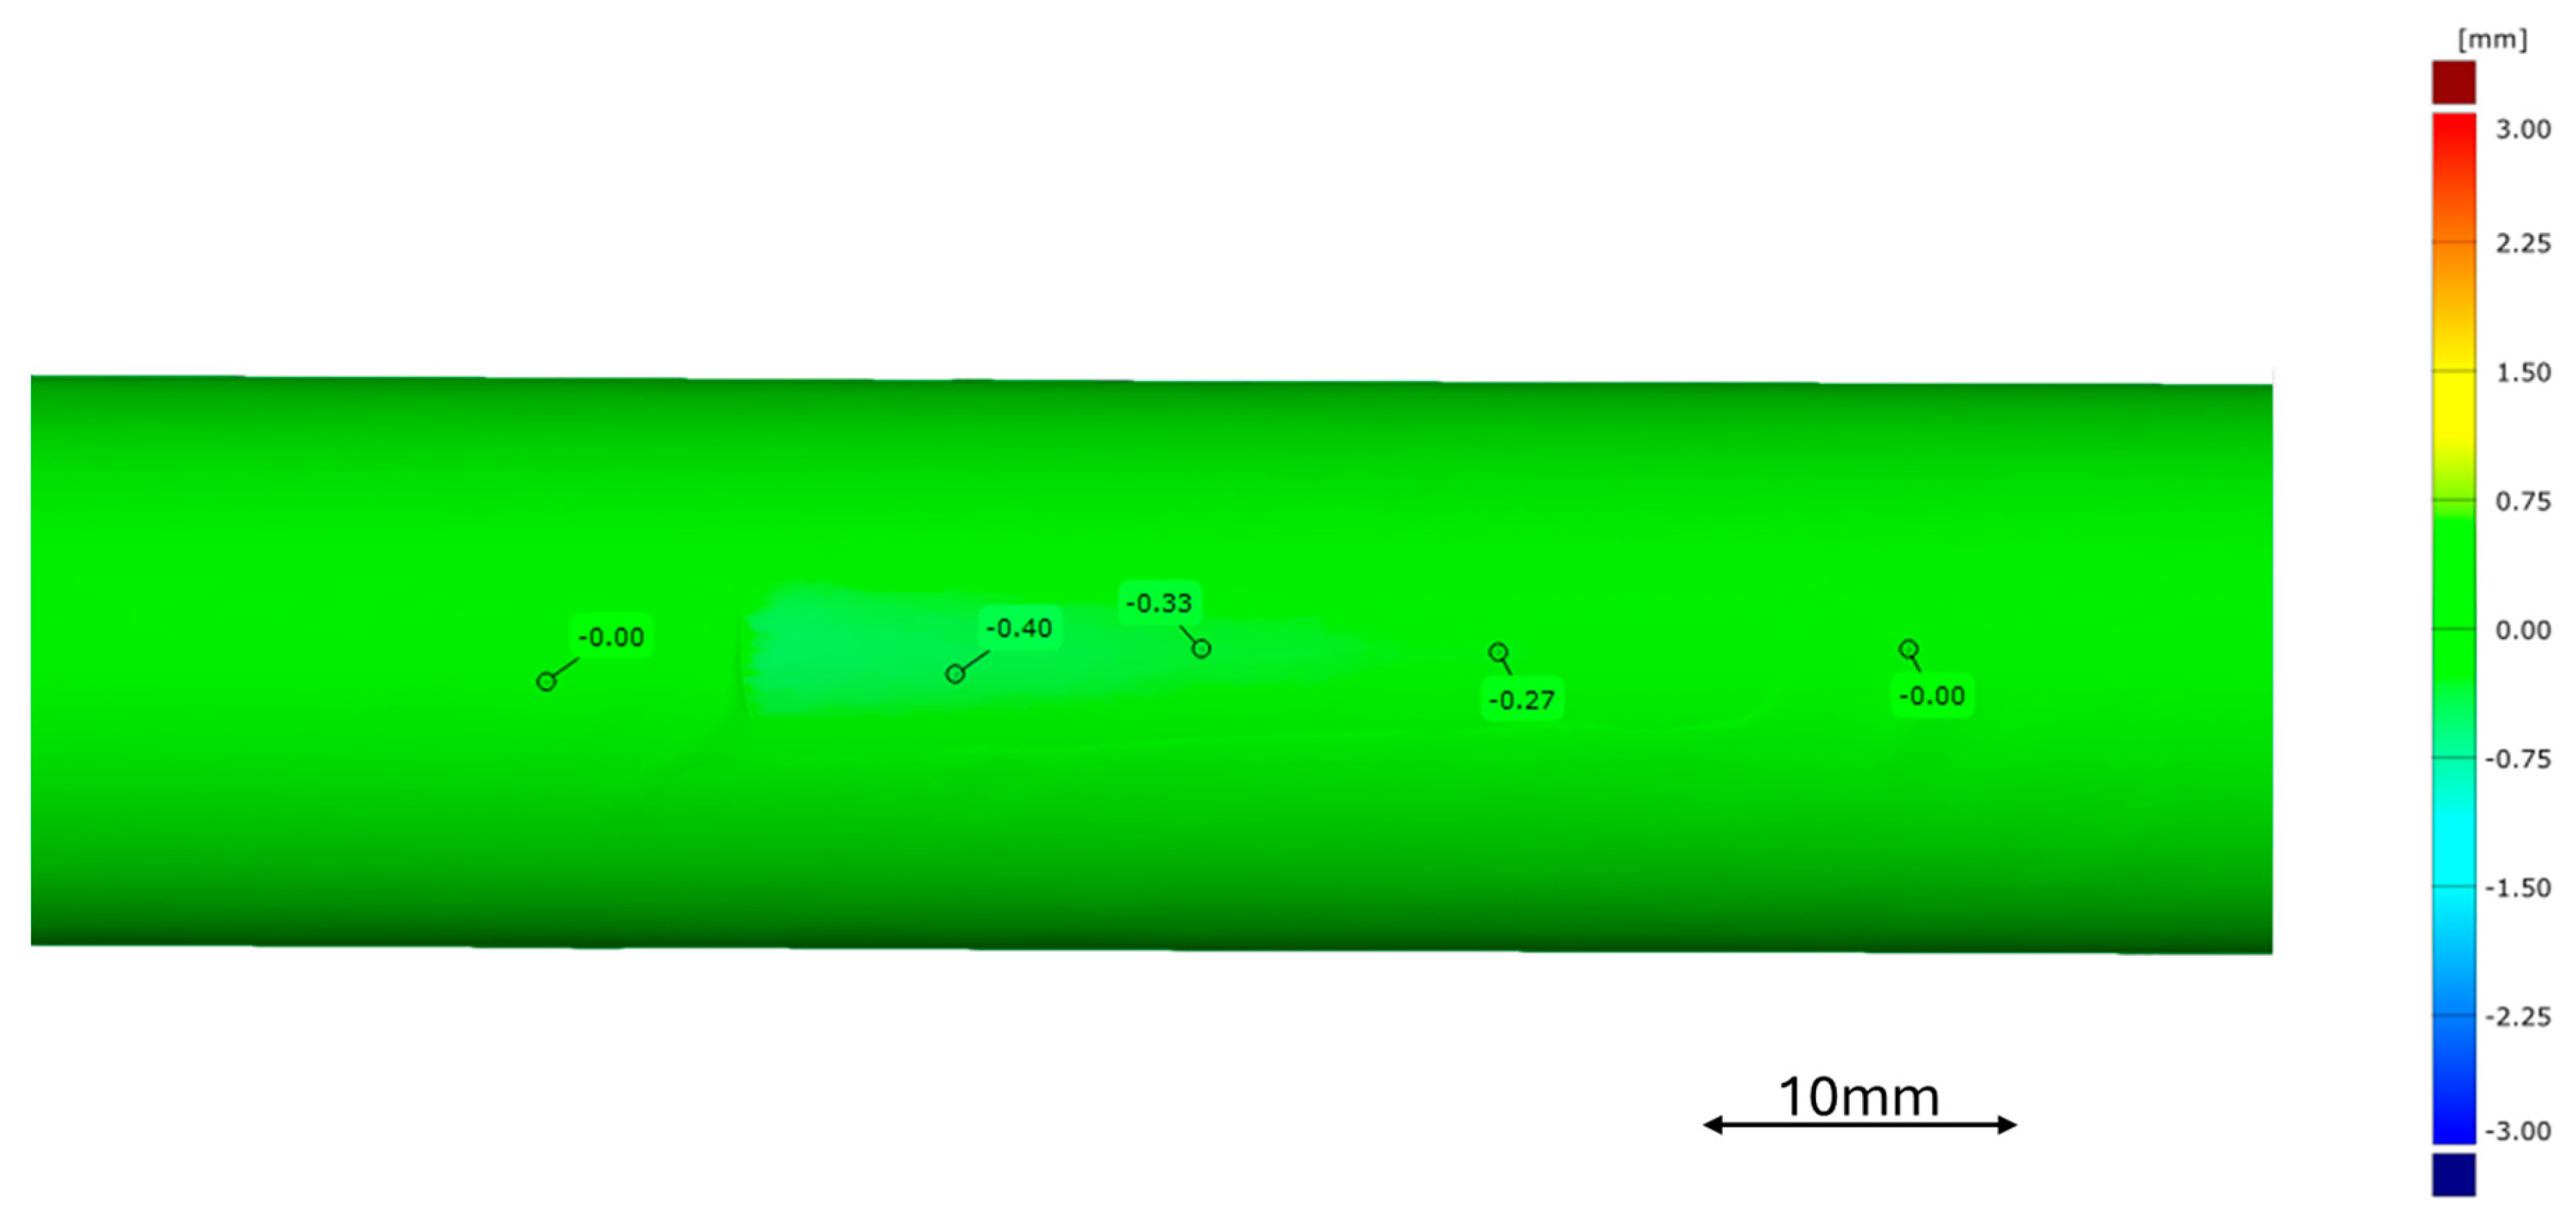
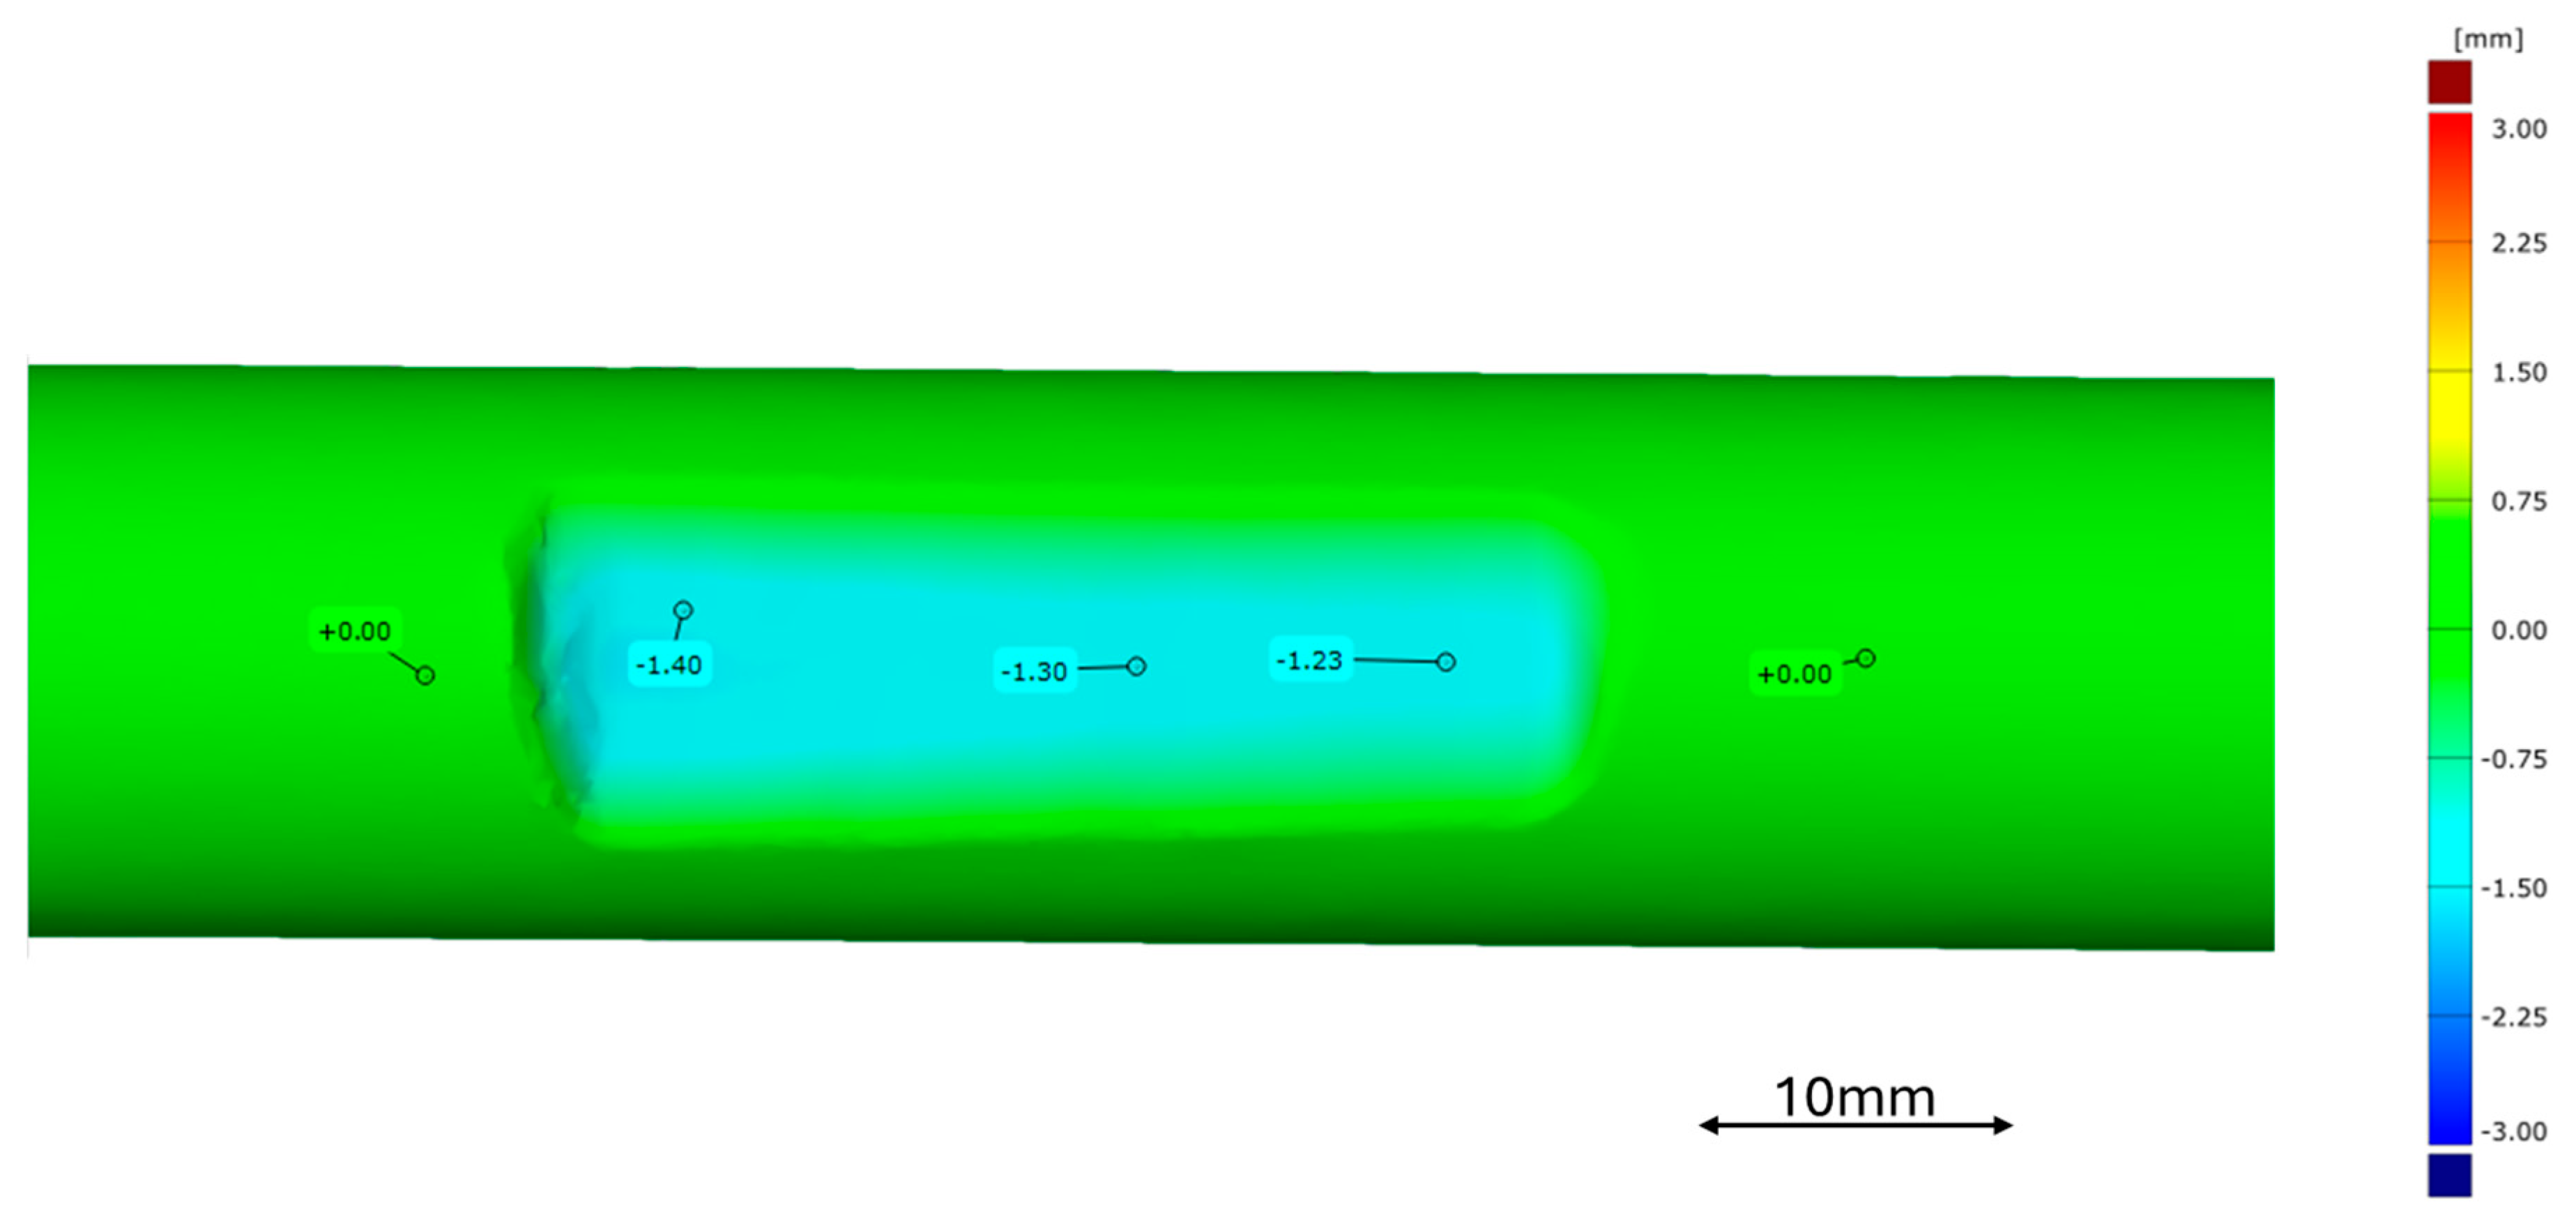
3.3. Abrasion Resistance Test

When it was confirmed that the obtained samples have the correct chemical composition and that their properties will allow to assess the influence of both hardness and density on the abrasion resistance, the main part of the research was conducted. As described in Section 2.3, the abrasion resistance tests were carried out in five identical cycles for each of the materials. Before the first, and after each consecutive cycle, each sample was precisely weighed and scanned with a 3D scanner. Figure 3 presents the collective data regarding the percentile weight loss of all samples.
The decrease in weight is non-linear, which is evident when analyzing the obtained curves. The R2 coefficient of determination for linear function was around 0.92–0.95, and for the polynomial of 2nd degree, it was over 0.99. A more rapid decrease in weight as the abrasion progresses might be related to wider surface contact in comparison to the beginning, where the surface was cylindrical. Providing further cycles probably would accelerate the abrasion even further. Judging by the data presented in Figure 3, in terms of the three clusters of data described in Section 3.2, it is necessary to notice that the least resistant material to abrasion was pure Al, which, after five full cycles, lost almost 7% of its initial mass. When correlated with the tested AlSi alloy with an almost identical density and two times higher hardness, the conclusion was that the higher the hardness, the better the abrasive resistance, as the alloy lost only 4.63% of its initial weight after five cycles. The difference is clearly visible and the influence of hardness is undeniable. However, when assessing the second described set, i.e., the AlSi alloy and pure Cu, where the hardness was almost identical and the density of copper is over three times higher, the weight loss of Cu was significantly lower (2.76%) than AlSi. In the published papers, there is evidence that the presence of hard particles in the microstructure provides a higher resistance to abrasion [68,69,70]. However, hard particles are introduced to Al, while Cu remains a pure, soft metal, which means that the key factor here might be density. Considering the third group, which is copper alloys, the influence of hardness is again of higher importance. The density of CuMg alloys is lower, but the hardness is higher than CuNiSi alloys. The abrasion resistance of CuMg is between 1.51% and 1.63% while CuNiSi is between 2.01% and 2.24% after five cycles, depending on the concentration of alloying additives. Moreover, the abrasion resistance of CuMg alloys is three times higher than pure Cu, while the density of alloys is lower. This is an important issue, as many industries have to constantly replace copper-made products due to wear resulting from abrasion [43,44]. Of course, the electrical conductivity of copper alloys, regardless of the alloying additive, would be lower than pure Cu [13]. However, in applications where 100% IACS (International Annealed Copper Standard) is not required, the use of alloys instead of pure Cu should be beneficial.
A 3D scanning analysis of the samples was conducted after each abrasion cycle; however, since the amount of data would be overwhelming, only the inspection of the surface comparison with deviation labels after the first and the fifth cycle is presented in Figure 4, Figure 5, Figure 6, Figure 7, Figure 8, Figure 9, Figure 10, Figure 11, Figure 12, Figure 13, Figure 14, Figure 15, Figure 16 and Figure 17. At both sides, each inspection’s deviation label of 0.00 mm are marked, which proves that the alignment order of cylinder–plane–plane was chosen correctly, and the scanned mesh is perfectly aligned with the initial sample scanned prior to the abrasion test.
Figure 4, Figure 5, Figure 6 and Figure 7 present the inspection of surface comparison of Al and AlSi samples, which, according to weight loss analysis, exhibited the lowest abrasion resistance. These are also the samples with the lowest densities out of the analyzed materials. What is clearly visible at the deviation labels is that the abrasion is not increasing linearly in terms of depth, even though it is quasi-linear in terms of the percentile weight loss. While in terms of Al, after the first cycle, the abrasion is almost 1 mm, and after the 5th cycle, it is only between 3.4 mm and 4.1 mm. The same situation was observed for AlSi, where the abrasion increases from around 0.8 mm to only 2.4 mm. Regardless of these observations, the abrasion expressed in depth is similar to the weight loss presented in Figure 3. The obtained results are in agreement with other published papers where the authors claim that the addition of Si to Al increases its abrasion resistance significantly [71,72]. In fact, it is claimed to be so high that AlSi alloys with 20 wt. % of Si are used as engine pistons. On the other hand, alloys with lower Si content are used as abrasion resistant coatings for car silencers [73]. The authors of these papers link the higher abrasion resistance with the presence of hard particles of Si in the alloy.
When analyzing the second group of samples, i.e., AlSi and Cu, presented in Figure 6 and Figure 7, and Figure 8 and Figure 9, respectively, it can be determined that the abrasion depth is bigger for AlSi by approximately 35%, while the difference in the percentile weight loss was almost 70%. The reason for this can be explained by the irregular mesh of AlSi samples presented in Figure 6 and Figure 7. The edges of the cast rod during the abrasion tests in some cases splintered instead of just being abrased like in all of the other cases, hence the irregularities and possibly higher percentile weight loss. The phenomenon is described in [74], where the authors discuss the addition of Ti to a binary AlSi alloy. It was found that the presence of hard-phase particles increased the microhardness significantly; however, it caused a tendency for embrittlement and microcracking, which were the reason for the higher weight decrease due to wear. Prasad et al. [75,76] discussed the wear behavior of AlSi alloys and they proved that the presence of primary Si particles in the alloys led to the inferior wear properties. This occurred due to the presence of the predominating embrittling and microcracking effect, which the authors even described as “detachment”, similar to the case tested in this paper with an AlSi alloy. These phenomena were especially present when the abrasive tests were conducted against fine abrasive particles and was reversed when coarser abrasive particles were used.
The last group of analyzed materials, i.e., copper alloys (Figure 10, Figure 11, Figure 12, Figure 13, Figure 14, Figure 15, Figure 16 and Figure 17) shows very similar results, which were not feasible to determine without the use of 3D scanner, as the differences between the CuMg and CuNiSi alloys were approximately 0.1–0.2 mm. Such values would be impossible to see with the naked eye. Even though the marked deviation labels show similar results, it can be assessed that the difference in the percentile weight loss comes from the peripheral areas of the samples. Regarding CuMg alloys after 5 km of testing, the blue color representing between 0.75 mm and 1.5 mm of abrasion is visible in less area than in the case of CuNiSi alloys. This means that the maximum abrasion in the middle is similar, but the edges lost more material in the case of CuNiSi alloys than CuMg alloys. The abrasive wear of copper and its alloys is described in many other papers. Regarding various alloys and chemical compositions, however, CuNiSi and CuMg alloys have not been studied in this matter. The authors in [77] have published results similar to those obtained in this paper regarding the weight loss of CuAl alloys, where, with the increase in Al content, the hardness increased but the density decreased. According to that paper, the strength of the material is crucial in terms of the wear rate, as the abrasive resistance increased significantly with the Al content.
What is especially visible in most of the cases is the anisotropy of the abrasion, as the left side of the sample has deeper abrasion. Most of the differences are between 0.1 mm and 0.2 mm, which, as previously mentioned, is impossible to see with the naked eye. However, as the abrasion becomes deeper, in the case of Al, the difference between the both sides reaches 0.7 mm. This means that the designed test stand does not provide an identical spring counterweight on both sides. Without the use of a 3D scanner, it would not be possible to determine.

4. Conclusions

The aim of the paper was to improve the existing abrasion resistance tests by implementing 3D scanning techniques. The obtained results were assessed and correlated with the measurements of hardness and density. The following conclusions were made.
Abrasion resistance depends both on density and hardness; however, the influence of the latter is more significant. Therefore, the tested alloys were much more resistant to abrasion than pure materials.
CuMg alloys turned out to be the most resistant to abrasion out of the tested materials, even though their density is lower than pure copper and CuNiSi alloys.
The use of 3D scanning shows the irregularities and anisotropy of the test, which were not visible with the naked eye in most cases. The differences between both sides were from 0.1–0.2 mm up to 0.7 mm in the case of pure Al, which had the lowest abrasion resistance.
The paper has successfully proven that 3D scanning can be used as auxiliary tool in the assessment of abrasion resistance. Therefore, it might become a novel tool for assessing not only abrasion but also all kinds of wear mechanisms where the materials volume is changed.
Since the tested metals are subject to strain hardening and CuNiSi and CuMg alloys are highly responsive to heat treatment, the tests should be repeated after the artificial aging and/or wire drawing process to assess the influence of hardening on abrasion resistance.

Funding

The author is grateful for the financial support provided by The National Centre for Research and Development—Research Project No. LIDER/33/0121/L-11/19/NCBR/2020.

Data Availability Statement

The raw data supporting the conclusions of this article will be made available by the authors on request.

Conflicts of Interest

The author declares no conflicts of interest.

References

  1. Fahlman, B.D. Metals. In Materials Chemistry; Springer: Cham, Switzerland, 2023; pp. 191–289. [Google Scholar]
  2. Ellappan, R.; Arumugam, S.; Sundararajan, R.; Venkatesh, K. Comparative Corrosion Behaviour of Ferrous and Non-ferrous Metals in Bio-lubricant and Bio-diesel Environment. Adv. Mater. Manuf. Eng. Springer Proc. Mater. 2021, 7, 425–432. [Google Scholar] [CrossRef]
  3. Ziouche, A.; Zergoug, M.; Boucherrou, N.; Boudjelal, H.; Mokhtari, M.; Abaidia, S. Pulsed eddy current signal analysis of ferrous and non-ferrous metals under thermal and corrosion solicitations. Russ. J. Nondestruct. Test 2017, 54, 652–659. [Google Scholar] [CrossRef]
  4. Avdeeva, L.K.; Godulyan, L.V.; Kovalev, A.I.; Wainstein, D.L.; Vakhrushev, V.O. Corrosion properties, chemical composition, and surface morphology of non-ferrous metals after tests at different temperature and humidity conditions. Metallurgist 2024, 68, 66–82. [Google Scholar] [CrossRef]
  5. Panda, S. Magnetic separation of ferrous fractions linked to improved bioleaching of metals from waste-to-energy incinerator bottom ash (IBA): A green approach. Environ. Sci. Pollut. Res. 2020, 27, 9475–9489. [Google Scholar] [CrossRef]
  6. Saini, D.K.; Bafna, N.; Jha, P.K. Effect of sheet thickness on the solidification and quality of Al-Mg2Si composite sheet fabricated by continuous casting. J. Manuf. Process. 2024, 131, 27–37. [Google Scholar] [CrossRef]
  7. Bagherian, E.-R.; Fan, Y.; Cooper, M.; Frame, B.; Abdolvand, A. Effect of melt temperature, cleanout cycle, continuous casting direction (horizontal / vertical) and super-cooler size on tensile strength, elongation percentage and microstructure of continuous cast copper alloys. Metall. Res. Technol. 2016, 113, 502. [Google Scholar] [CrossRef]
  8. Strzępek, P.; Zasadzińska, M.; Mamala, A.; Walkowicz, M.; Osuch, P. The Effect of the Percentage of Mg on the Properties of Cu-Mg Alloys Manufactured by Horizontal Continuous Casting Process. JOM 2024, 76, 3153–3160. [Google Scholar] [CrossRef]
  9. Maleta MGłuchowski, W.; Rdzawski, Z.; Łagoda, M.; Domagała-Dubiel, J. Influence of the speed of downward semi-continuous casting on the crystal size and mechanical properties of recycled copper. Metalugija 2023, 62, 387–390. [Google Scholar]
  10. Smyrak, B.; Jurkiewicz, B.; Zasadzińska, M.; Gniełczyk, M.; Jałowy, P. The Effect of Al-Mg-Si Wire Rod Heat Treatment on Its Electrical Conductivity and Strength. Metals 2020, 10, 1027. [Google Scholar] [CrossRef]
  11. Davis, J.R. ASM Specialty Handbook: Copper and Copper Alloys; ASM International: Novelty, OH, USA, 2001; ISBN 978-087170-726-0. [Google Scholar]
  12. Zasadzińska, M.; Knych, T. The Morphology of Eutectic Copper Oxides I (Cu2O) in The Processing of Wire Rod and Wires made from ETP Grade Copper. Arch. Metall. Mater. 2019, 64, 1611–1616. [Google Scholar] [CrossRef]
  13. Nordheim, L. Zur Elektronentheorie der Metalle. I. Ann. Phys. 1931, 401, 607–640. [Google Scholar] [CrossRef]
  14. Yadav, R.; Dwivedi, V.K.; Dwivedi, S.P. Analysis of Mechanical Properties and Manufacturing Process of Aluminum Series. J. Inst. Eng. India Ser. D 2024. [Google Scholar] [CrossRef]
  15. Kammer, C. Aluminum and Aluminum Alloys. In Springer Handbook of Materials Data; Springer: Cham, Switzerland, 2018; pp. 161–197. [Google Scholar]
  16. Kaufman, J.G. Introduction to Aluminum Alloys and Tempers; ASM International: Novelty, OH, USA, 2000; ISBN 978-0-87170-689-8. [Google Scholar]
  17. Shariyari, F.; Shaeri, M.H.; Dashti, A.; Zarei, Z.; Noghani, M.T.; Cho, J.H.; Djavanroodi, F. Evolution of mechanical properties, microstructure and texture and of various brass alloys processed by multi-directional forging. Mater. Sci. Eng. A 2022, 831, 142149. [Google Scholar] [CrossRef]
  18. Birch, J.; Jenkins, E.; Vrettou, A.; Said, M.; Vashishtha, H.; Connelley, T.; Brooks, J.; Collins, D.M. A micromechanical study of heat treatment induced hardening in α-brass. Acta Mater. 2024, 278, 120277. [Google Scholar] [CrossRef]
  19. Mao, Z.; Zhang, D.Z.; Jiang, J.; Fu, G.; Zhang, P. Processing optimisation, mechanical properties and microstructural evolution during selective laser melting of Cu-15Sn high-tin bronze. Mater. Sci. Eng. A 2018, 721, 125–134. [Google Scholar] [CrossRef]
  20. Gupta, R.; Srivastava, S.; Kumar, N.K.; Panthi, S.K. High leaded tin bronze processing during multi-directional forging: Effect on microstructure and mechanical properties. Mater. Sci. Eng. A 2016, 654, 282–291. [Google Scholar] [CrossRef]
  21. Brudny, A.; Kulasa, J.; Cwolek, B.; Malec, W.; Juszczyk, B. Influence of the continuous casting process of tin-zinc-lead bronze on the wear of the graphite crystallizer. Metalurgija 2022, 61, 785–788. [Google Scholar]
  22. Ma, S.; Ye, C.; Yang, X.; Fu, L.; Fan, J.; Wang, J.; Shan, A. Microstructure evolution during the heavy warm rolling of a nickel aluminum bronze. Mater. Sci. Eng. A 2023, 883, 145458. [Google Scholar] [CrossRef]
  23. Cao, Y.; Han, S.Z.; Choi, E.-A.; Ahn, J.H.; Mi, X.; Lee, S.; Shin, H.; Kim, S.; Lee, J. Effect of inclusion on strength and conductivity of Cu-Ni-Si alloys with discontinuous precipitation. J. Alloys Compd. 2020, 843, 156006. [Google Scholar] [CrossRef]
  24. Zhang, R.; Li, Z.; Sheng, X.; Gao, Y.; Lei, Q. Grain refinement and mechanical properties improvements in a high strength Cu–Ni–Si alloy during multidirectional forging. Fusion Eng. Des. 2020, 159, 111766. [Google Scholar] [CrossRef]
  25. Pranshanth, M.; Satish, N.; Ajay Kumar, B.S. Effect of Brass and Silver on Mechanical Properties of Copper. Mater. Today Proc. 2018, 5, 25404–25411. [Google Scholar] [CrossRef]
  26. Tardieu, S.; Mesguich, D.; Lonjon, A.; Lecouturier, F.; Ferreira, N.; Chevallier, G.; Proietti, A.; Estournes, C.; Caurent, C. Nanostructured 1% silver-copper composite wires with a high tensile strength and a high electrical conductivity. Mater. Sci. Eng. A 2019, 761, 138048. [Google Scholar] [CrossRef]
  27. Dölling, J.; Henle, R.; Prahl, U.; Zilly, A.; Nandi, G. Copper-Based Alloys with Optimized Hardness and High Conductivity: Research on Precipitation Hardening of Low-Alloyed Binary CuSc Alloys. Metals 2022, 12, 902. [Google Scholar] [CrossRef]
  28. Henle, R.; Kött, S.; Jost, N.; Nandi, G.; Dölling, J.; Zilly, A.; Prahl, U. Investigation of the Solid Solution Hardening Mechanism of Low-Alloyed Copper–Scandium Alloys. Metals 2024, 14, 831. [Google Scholar] [CrossRef]
  29. Li, R.; Guo, E.; Chen, Z.; Kang, H.; Wang, W.; Zou, C.; Li, T.; Wang, T. Optimization of the balance between high strength and high electrical conductivity in CuCrZr alloys through two-step cryorolling and aging. J. Alloys Compd. 2019, 771, 1044–1051. [Google Scholar] [CrossRef]
  30. Ma, B.; An, B.; Zhao, X.; Li, Y.; Du, J.; Wang, E. Microstructure and properties of Cu-Cr-Zr alloy by doping Sc. Mater. Lett. 2023, 336, 133917. [Google Scholar] [CrossRef]
  31. Leśniak, D.; Zasadziński, J.; Libura, W.; Gronostajcki, Z.; Śliwa, R.; Leszczyńska-Madej, B.; Kaszuba, M.; Woźnicki, A.; Płonka, B.; Widomski, P.; et al. Latest advances in extrusion processes of light metals. Arch. Mech. Eng. 2024, 24, 184. [Google Scholar] [CrossRef]
  32. Feng, Y.; Ding, F.; Wang, S.; Zhu, C. ZrB2–Copper–Graphite Composite for Electric Brushes: Positive Effect of ZrB2 Addition on Composite Properties. Materials 2024, 17, 2980. [Google Scholar] [CrossRef]
  33. Wang, Y.; Wang, J.; Xu, Z.; Xu, B.; Yu, B.; Dong, J.; Li, C. Improving the Mechanical Properties of Al-Si Composites through the Synergistic Strengthening of TiB2 Particles and BN Nanosheets. Metals 2024, 14, 957. [Google Scholar] [CrossRef]
  34. Korbel, A.; Pieła, K.; Ostachowski, P.; Łagoda, M.; Błaż, L.; Bochniak, W.; Pawlyta, M. Structural phenomena induced in the course of and post low-temperature KOBO extrusion of AA6013 aluminum alloy. Mater. Sci. Eng. A 2018, 710, 349–358. [Google Scholar] [CrossRef]
  35. Bochniak, W.; Korbel, A.; Ostachowski, P.; Lagoda, M. Plastic flow of metals under cyclic change of deformation path conditions. Arch. Mech. Eng. 2018, 18, 679–686. [Google Scholar] [CrossRef]
  36. Gronostajski, Z.; Hawryluk, M. The main aspects of precision forging. Arch. Mech. Eng. 2008, 8, 39–55. [Google Scholar] [CrossRef]
  37. Muszka, K.; Madej, L.; Majta, J. The effects of deformation and microstructure inhomogeneities in the Accumulative Angular Drawing (AAD). Mater. Sci. Eng. A 2013, 574, 68–74. [Google Scholar] [CrossRef]
  38. Pourbashiri, M.; Sedighi, M.; Poletti, M.C.; Sommitsch, C. Enhancing mechanical properties of wires by a novel continuous severe plastic deformation method. Int. J. Mater. Res. 2017, 108, 741–749. [Google Scholar] [CrossRef]
  39. Strzępek, P.; Zasadzińska, M. Prospective cold metal working and analysis of deformation susceptibility of CuMg alloys with high magnesium content. Sci. Rep. 2024, 14, 6447. [Google Scholar] [CrossRef] [PubMed]
  40. Gorsse, S.; Ouvard, B.; Goune, M.; Poulon-Quintin, A. Microstructural design of new high conductivity—high strength Cu-based alloy. J. Alloys Compd. 2015, 633, 42–47. [Google Scholar] [CrossRef]
  41. Ito, Y.; Matsunaga, H.; Mori, H.; Maki, K. Effect of Plastic Deformation on the Proof Strength and Electrical Conductivity of Copper-Magnesium Supersaturated Solid-Solution Alloys. Mater. Trans. 2014, 55, 1738–1741. [Google Scholar] [CrossRef]
  42. Rodriguez-Calvillo, P.; Ferrer, N.; Cabrera-Marrero, J.M. Analysis of microstructure and strengthening in CuMg alloys deformed by equal channel angular pressing. J. Alloys Compd. 2015, 626, 340–348. [Google Scholar] [CrossRef]
  43. Andrews, J. A modelling approach to railway track asset management. Proc. Inst. Mech. Eng. Part F J. Rail. Rapid. Transit 2012, 7, 56–73. [Google Scholar] [CrossRef]
  44. Kilsby, P.; Remenyte-Prescott, R.; Andrews, J. A modelling approach for railway overhead line equipment asset management. Reliab. Eng. Syst. Saf. 2017, 168, 326–337. [Google Scholar] [CrossRef]
  45. Leśniak, D.; Zasadziński, J.; Libura, W.; Żaba, K.; Puchlerska, S.; Madura, J.; Balcerzak, M.; Płonka, B.; Jurczak, H. FEM Numerical and Experimental Study on Dimensional Accuracy of Tubes Extruded from 6082 and 7021 Aluminium Alloys. Materials 2023, 16, 556. [Google Scholar] [CrossRef]
  46. Balcerzak, M.; Żaba, K.; Hojny, M.; Puchlerska, S.; Kuczek, Ł.; Trzepieciński, T.; Novák, V. Experimental Research and Numerical Modelling of the Cold Forming Process of the Inconel 625 Alloy Sheets Using Flexible Punch. Materials 2024, 17, 85. [Google Scholar] [CrossRef] [PubMed]
  47. Priyadarshi, A.; Bin Shahrani, S.; Choma, T.; Zrodowski, L.; Qin, L.; Leung, C.L.A.; Clark, S.J.; Fezzaa, K.; Mi, J.; Lee, P.D.; et al. New insights into the mechanism of ultrasonic atomization for the production of metal powders in additive manufacturing. Addit. Manuf. 2024, 83, 104033. [Google Scholar] [CrossRef]
  48. Momber, A.W.; Irmer, M. Taber abrasive wear resistance of organic offshore wind power coatings at varying normal forces. J. Coat. Technol. Res. 2021, 18, 729–740. [Google Scholar] [CrossRef]
  49. Rossi, S.; Deflorian, F.; Scrinzi, E. Comparison of different abrasion mechanisms on aesthetic properties of organic coatings. Wear 2009, 267, 1574–1580. [Google Scholar] [CrossRef]
  50. Rossi, S.; Parziani, N.; Zanella, C. Abrasion resistance of vitreous enamel coatings in function of frit composition and particles presence. Wear 2015, 332–333, 702–709. [Google Scholar] [CrossRef]
  51. ASTM G65; Standard Test Method for Measuring Abrasion Using the Dry Sand/Rubber Wheel Apparatus. ASTM International: West Conshohocken, PA, USA, 2021.
  52. ASTM G77; Standard Test Method for Ranking Resistance of Materials to Sliding Wear Using Block-on-Ring Wear Test. ASTM International: West Conshohocken, PA, USA, 2022.
  53. ASTM D2714; Standard Test Method for Calibration and Operation of the Falex Block-on-Ring Friction and Wear Testing Machine. ASTM International: West Conshohocken, PA, USA, 2019.
  54. Taber Industries—Taber Abraser (Abrader). Available online: https://www.taberindustries.com/taber-rotary-abraser (accessed on 16 September 2024).
  55. MatWeb Material Property Data. Available online: https://www.matweb.com/ (accessed on 18 September 2024).
  56. Copper Alloys Knowledge Base. Available online: http://www.conductivity-app.org/ (accessed on 18 September 2024).
  57. Yao, H.; Gong, J.; Cheng, S.; Liu, C.; Huang, H. Effects of Travel Speed on the Microstructure and Abrasion Resistance of Hardfacing Alloys Deposited with Composite Powder Particles and Solid Wire. Metals 2020, 10, 740. [Google Scholar] [CrossRef]
  58. Chao, L.; Jianxun, G.; Hongjiang, H. Effects of K2co3 Flux on the Microstructure and Abrasion Resistance of High-Chromium Hardfacing Alloys. Trans. Indian Inst. Met. 2022, 75, 3139–3148. [Google Scholar] [CrossRef]
  59. Bezzon, O.L.; de Barros, C.; de Almeid, J.M.; Di Lorenzo, P.L. Pilot study of the relationship between the hardness and abrasion resistance of two base metal alloys used for metal-ceramic restorations. J. Prosthet. Dent. 2001, 85, 190–194. [Google Scholar] [CrossRef]
  60. Yang, Q.-S.; Duan, J.-X.; Deng, A.-Y.; Wang, E.-G. Numerical simulation of macrosegregation phenomenon in Cu-6wt%Ag alloy ingots fabricated by electromagnetic stirring. J. Mater. Res. Technol. 2024, 28, 300–315. [Google Scholar] [CrossRef]
  61. Lesoult, G. Macrosegregation in steel strands and ingots: Characterisation, formation and consequences. Mater. Sci. Eng. A-Struct. 2005, 413, 19–29. [Google Scholar] [CrossRef]
  62. Prescott, P.; Incropera, F.P. Convection heat and mass transfer in alloy solidification. Adv. Heat Tran. 1996, 28, 231–238. [Google Scholar] [CrossRef]
  63. Zhao, Q.; Holmedal, B. The effect of silicon on the strengthening and work hardening of aluminum at room temperature. Mater. Sci. Eng. A 2013, 563, 147–151. [Google Scholar] [CrossRef]
  64. Dash, S.S.; Liu, Z.Y.; Zou, Y.; Li, D.J.; Zeng, X.Q.; Li, D.Y.; Chen, D.L. Strengthening mechanisms and work hardening in a heterostructured cast aluminum alloy under compressive loading: Correlation with nanomechanical properties. J. Alloys Compd. 2023, 968, 171844. [Google Scholar] [CrossRef]
  65. Lumley, R. (Ed.) Fundamentals of Aluminium Metallurgy: Production, Processing and Applications, 1st ed.; Woodhead Publishing Limited: Sawston, UK, 2011; ISBN 978-1-84569-654-2. [Google Scholar]
  66. Gholami, M.; Vesely, J.; Altenberger, I.; Kuhn, H.-A.; Wollmann, M.; Janecek, M.; Wagner, L. Influence of grain size and precipitation hardening on high cycle fatigue performance of CuNiSi alloys. Mater. Sci. Eng. A 2017, 684, 524–533. [Google Scholar] [CrossRef]
  67. Gholami, M.; Vesely, J.; Altenberger, I.; Kuhn, H.-A.; Janecek, M.; Wollmann, M.; Wagner, L. Effects of microstructure on mechanical properties of CuNiSi alloy. J. Alloys Compd. 2017, 696, 201–212. [Google Scholar] [CrossRef]
  68. Badisch, E.; Mitterer, C. Abrasive wear of high speed steels: Influence of abrasive particles and primary carbides on wear resistance. Tribol. Int. 2003, 36, 765–770. [Google Scholar] [CrossRef]
  69. Tęcza, G. Changes in the Microstructure and Abrasion Resistance of Tool Cast Steel after the Formation of Titanium Carbides in the Alloy Matrix. Arch. Foundry Eng. 2023, 23, 173–180. [Google Scholar] [CrossRef]
  70. Zhen, M.; Xiaoxia, L.; Ping, L.; Qichong, L.; Shidan, Y.; Xin, X.; Chao, C.; Minghui, Z. Microstructure and two-body abrasive wear behavior of Fe-B surfacing alloys with different chromium and vanadium contents. Mater. Today Commun. 2023, 34, 105441. [Google Scholar] [CrossRef]
  71. Formanek, B.; Piątkowski, J.; Szymszal, J. Aluminium composite casting dispersion reinforced with iron-aluminium and silicon carbide phases. Arch. Foundry Eng. 2010, 10, 35–38. [Google Scholar]
  72. Kucharska, B.; Kowalczyk, J. Resistance Properties of Al–Si Coatings. Acta Phys. Pol. A 2016, 129, 197–199. [Google Scholar] [CrossRef]
  73. Wróbel, A.; Kucharska, B. Modification of Silicon Crystals in the Al-Si Coating by means of Heat Treatment. Arch. Metall. Mater. 2010, 55, 205–210. [Google Scholar]
  74. Saheb, N.; Laoui, T.; Daud, A.R.; Harun, M.; Radiman, S.; Yahaya, R. Influence of Ti addition on wear properties of Al–Si eutectic alloys. Wear 2001, 249, 656–662. [Google Scholar] [CrossRef]
  75. Prasad, B.K.; Venkateswarlu, K.; Modi, O.P.; Jha, A.K.; Dasupta, R.; Yegneswara, A.H. The Effects of Primary Silicon Particles on the Sliding Wear Behavior of Aluminum-silicon Alloys. J. Mater. Sci. Lett. 1998, 17, 1381–1383. [Google Scholar] [CrossRef]
  76. Prasad, B.K.; Venkateswarlu, K.; Modi, O.P.; Yegneswaran, A.H. Influence of the size and morphology of silicon particles on the physical, mechanical and tribological properties of some aluminium—Silicon alloys. J. Mater. Sci. Lett. 1996, 15, 1773–1776. [Google Scholar] [CrossRef]
  77. Shaik, M.A.; Golla, B.R. Development of highly wear resistant Cu—Al alloys processed via powder metallurgy. Tribol. Int. 2019, 136, 127–139. [Google Scholar] [CrossRef]
Figure 1. Schematics of the laboratory test stand.
Processes 12 02200 g001
Figure 2. Collective graph of hardness and density measurements.
Processes 12 02200 g002
Figure 3. Percentile weight (mass) loss of analyzed materials in the function of abrasion distance.
Processes 12 02200 g003
Figure 4. Inspection of surface comparison after 1 km of abrasion; Al.
Processes 12 02200 g004
Figure 5. Inspection of surface comparison after 5 km of abrasion; Al.
Processes 12 02200 g005
Figure 6. Inspection of surface comparison after 1 km of abrasion; AlSi.
Processes 12 02200 g006
Figure 7. Inspection of surface comparison after 5 km of abrasion; AlSi.
Processes 12 02200 g007
Figure 8. Inspection of surface comparison after 1 km of abrasion; Cu.
Processes 12 02200 g008
Figure 9. Inspection of surface comparison after 5 km of abrasion; Cu.
Processes 12 02200 g009
Figure 10. Inspection of surface comparison after 1 km of abrasion; CuNiSi.
Processes 12 02200 g010
Figure 11. Inspection of surface comparison after 5 km of abrasion; CuNiSi.
Processes 12 02200 g011
Figure 12. Inspection of surface comparison after 1 km of abrasion; CuNi2Si.
Processes 12 02200 g012
Figure 13. Inspection of surface comparison after 5 km of abrasion; CuNi2Si.
Processes 12 02200 g013
Figure 14. Inspection of surface comparison after 1 km of abrasion; CuMg2.8.
Processes 12 02200 g014
Figure 15. Inspection of surface comparison after 5 km of abrasion; CuMg2.8.
Processes 12 02200 g015
Figure 16. Inspection of surface comparison after 1 km of abrasion; CuMg3.2.
Processes 12 02200 g016
Figure 17. Inspection of surface comparison after 5 km of abrasion; CuMg3.2.
Processes 12 02200 g017
Table 1. Nominal chemical composition of alloys (wt. %) [55,56].
Aluminum Based
ElementAlSiFeCuMnZnOther
Al (EN AW 1050)Min. 99.5Max. 0.25Max. 0.4Max. 0.05Max. 0.05Max 0.07Max. 0.03
AlSi (EN AW 4044)89.3–92.2 7.8–9.2Max. 0.8Max. 0.25Max. 0.1Max. 0.2Max. 0.15
Copper Based
ElementCuNiSiMgOther
CuMin. 99.9Max. 0.02Max. 0.02Max. 0.02Max. 0.1
CuNiSi97.1–98.30.6–1.50.4–0.7Max. 0.02Max. 0.3
CuNi2Si95.9–97.71.0–2.50.4–0.8Max. 0.02Max. 0.3
CuMg2.897–97.3Max. 0.02Max. 0.022.7–2.9Max. 0.1
CuMg3.296.6–96.9Max. 0.02Max. 0.023.1–3.3Max. 0.1
Table 2. Chemical composition of the analyzed alloys (wt. %).
Aluminum Based
ElementAlSiFeCuMnZnOther
Al (EN AW 1050)99.633 ± 0.0120.135 ± 0.0020.175 ± 0.0070.019 ± 0.0010.004 ± 0.000040.005 ± 0.001Bal.
AlSi (EN AW 4044)91.013 ± 0.1768.564 ± 0.0970.277 ± 0.010.051 ± 0.0040.007 ± 0.000060.019 ± 0.001Bal.
Copper Based
ElementCuNiSiMgOther
Cu99.92 ± 0.0110.008 ± 0.0010.011 ± 0.0010.001 ± 0.001Bal.
CuNiSi98.25 ± 0.1151.05 ± 0.0090.491 ± 0.0020.000 ± 0.000Bal.
CuNi2Si97.32 ± 0.0742.08 ± 0.0140.475 ± 0.0020.001 ± 0.001Bal.
CuMg2.897.15 ± 0.0550.01 ± 0.0010.013 ± 0.0012.787 ± 0.029Bal.
CuMg3.296.78 ± 0.0310.008 ± 0.0010.014 ± 0.0013.203 ± 0.021Bal.
Disclaimer/Publisher’s Note: The statements, opinions and data contained in all publications are solely those of the individual author(s) and contributor(s) and not of MDPI and/or the editor(s). MDPI and/or the editor(s) disclaim responsibility for any injury to people or property resulting from any ideas, methods, instructions or products referred to in the content.

