Article

Modelling Approach for the Continuous Biocatalytic Synthesis of N-Acetylneuraminic Acid in Packed Bed Reactors

1
GALAB Laboratories GmbH, Am Schleusengraben 7, 21029 Hamburg, Germany
2
Institute of Technical Biocatalysis, Hamburg University of Technology, Denickestraße 15, 21073 Hamburg, Germany
*
Author to whom correspondence should be addressed.
Processes 2024, 12(10), 2191; https://doi.org/10.3390/pr12102191
Submission received: 20 August 2024 / Revised: 20 September 2024 / Accepted: 24 September 2024 / Published: 9 October 2024
(This article belongs to the Special Issue Development, Modelling and Simulation of Biocatalytic Processes)

Abstract

:
Continuous flow technologies have become increasingly important for biocatalytic processes. In this study, we present the application and modelling of covalently immobilised N-acetylglucosamine 2-epimerase and N-acetylneuraminic acid lyase in packed bed reactors for the synthesis of N-acetylneuraminic acid. The immobilised enzymes were stable under continuous flow process conditions with half-life times of >28 d (epimerase immobilised on hexamethylamino methacrylate HA403/M) or 58 d (lyase immobilised on dimenthylamino methacrylate ECR8309M), suitable for continuous flow applications. Kinetic studies revealed Michaelis–Menten kinetic behaviour for both enzymes. The kinetic parameters and the inhibitions were analysed under continuous flow conditions and were integrated into a process model using Python. The model was validated by varying flow rates, the mass of immobilised enzymes and the reactor dimensions and shows a low error compared to the measured data. An error accuracy of 6% (epimerase) or 9% (lyase) was achieved. The product concentrations of the enzyme cascade at the end of the packed bed reactor can be predicted with an accuracy of 9% for the calculation of a large column (84.5 mL) or of 24% if several small columns (2.5 mL, 0.8 mL) are connected in series. The developed model has proved to be valid and will be used to optimise the process with respect to substrate concentrations, reactor dimensions and flow rate.

Graphical Abstract

1. Introduction

N-Acetylneuraminic acid (Neu5Ac) belongs to the sialic acid family. Sialic acids are naturally occurring sugar acids with a nine-carbon backbone. More than 50 sialic acids have been identified. Sialic acids, also known as neuraminic acids, were first isolated from gangliosides [1]. The most common sialic acids are Neu5Ac, N-glycolylneuraminic acid (Neu5Gc), 2-keto-3-deoxy-nonulosonic acid (Kdn) and their O-methyl-, O-lactyl-, O-sulfo-, O-phospho- or O-acyl derivatives [2]. Neu5Ac is the most abundant sialic acid and is the only one that has been found in humans. They rarely occur as free sialic acids in nature. Mostly they occur as terminal, non-reducing position of oligosaccharide chains of mucins, glycoproteins, and glycolipids on cell surfaces of vertebrates and higher invertebrates, mainly linked to galactose, N-acetylgalactosamine and other sialic acid residues [2,3]. In eukaryotes, sialic acids are involved in many cell and cell-molecule interactions [4]. Neu5Ac has many physiological roles in humans, including antiviral function, brain development and cognition, immunomodulation, cancer treatment and antioxidant activity [5]. This leads to an interest in the food, cosmetics and pharmaceutical industries [5]. Sialic acids are also found in some pathogenic bacteria as components of lipooligosaccharides or capsular polysaccharides. The sialic acid metabolism has been well studied in several pathogens, including Escherichia coli K1, Pasteurella multocida, Neisseria meningitidis and Campylobacter jejuni [2].
Neu5Ac can be catalysed in a two-step cascade. The first step is the epimerisation of N-acetylglucosamine (GlcNAc) to N-acetylmannosamine (ManNAc). This step can be catalysed by GlcNAc 2-epimerase or by alkaline treatment [6,7]. In the second step, an aldol addition of ManNAc and pyruvate can be catalysed by Neu5Ac lyase. Another possible pathway is catalysed by Neu5Ac synthase with phosphoenolpyruvate (PEP) [8]. In this study, GlcNAc 2-epimerase from Pedobacter heparinus (EC 5.1.3.8, gene: Phep_3251, UniProt KB: C6Y403) and Neu5Ac lyase from Escherichia coli (EC 4.1.3.3, gene: nanA, UniProt KB: A0A140N3N8) were examined (Scheme 1).
Over the past three decades, several approaches for the biosynthesis of Neu5Ac have been developed and published. In a 1991 publication, Kragl et al. described the use of a GlcNAc 2-epimerase and a Neu5Ac lyase in a membrane reactor with a GlcNAc conversion of 28% [6]. In a study by Maru and workers from 1998, the synthesis with free enzymes and a GlcNAc conversion of 77% is demonstrated in a 150 L batch reactor [9]. The first use of immobilised enzyme to produce Neu5Ac was described by Mahmoudian in 1997. The epimerisation of GlcNAc was carried out via the base-catalysed reaction with sodium hydroxide. The subsequent reaction was performed with immobilised Neu5Ac lyase in a stirred tank reactor [10]. Further studies with immobilisation of both enzymes have been published by Hu et al., 2010 [11] and Cheng et al., 2017 [12]. The experiments were realised in a 50 mL scale and analysed for efficiency and stability. Neu5Ac was synthesised with GlcNAc conversions of 73% (batch) and 82% (fed-batch) [11,12]. In 2019, Bloemendal worked on the synthesis of Neu5Ac using a continuous flow tube with a fixed bed with immobilised lyase, achieving a pyruvate conversion of 82% with a 5-fold ManNAc excess in a chemoenzymatic synthesis [13]. In a paper published in 2021, Obst et al. showed the benefits of immobilised enzymes for sialic acid production and thus the prevention of inhibitory effects by compartmentalisation in microfluidic devices [14]. Recently in 2022, Reich et al. demonstrated the use of epimerase and Neu5Ac lyase immobilised on methacrylate carrier for continuous use in Neu5Ac synthesis. In addition to the outstanding stability of the immobilisates, they can even be used under high pressure up to 115 MPa while remaining stable [15].
Immobilised enzymes offer many advantages that make them attractive for industrial and biotechnological applications. Immobilisation can increase enzyme stability, and enzymes can be easily recovered and reused [16]. In addition, inhibitions can possibly be reduced [17]. Different types of immobilisation can be selected, whereby immobilisation can be achieved by binding to a carrier, encapsulation or cross-linking [18]. Covalent binding to the carrier offers the advantage of stable bonds that prevent leaching of the enzyme and minimise contamination of the product, thereby simplifying product purification [19]. The use of immobilised enzymes in different types of reactors, such as packed bed or rotating bed reactors, allows targeted use for different requirements and enables continuous reaction control [17]. Continuous flow technologies can improve mass transfer. Capacities can be increased by adjusting reaction times or by using parallel or series-connected reactors. Reaction parameters can be specifically adjusted and monitored, enabling reliable and reproducible process control [19,20].
The implementation of multi-enzyme cascades in a process is often challenging. A model can provide information on the effect of parameters for optimisation [19]. A mechanistic model based on Michaelis–Menten kinetics combined with fluid mechanical approaches for dimensioning of a packed bed reactor can be used for this purpose.
In this study, amino methacrylate particles pre-activated with glutaraldehyde and epoxy methacrylate particles were used as carriers to covalently immobilise GlcNAc 2-epimerase and Neu5Ac lyase. The enzymes are used in packed bed reactors (PBRs) for continuous Neu5Ac synthesis. This two-enzyme reaction is the first module of a complex reaction cascade for the production of the human milk oligosaccharide sialyllactose.

2. Materials and Methods

2.1. Chemicals

The following chemicals were used in this study, with manufacturers and order number: acetonitrile (VWR International GmbH, Darmstadt, Germany, 83640.320), adenosine 5’-triphosphate disodium salt hydrate (Biosynth Ltd., Compton, UK, NA00135), albumin from bovine serum (BSA) (Sigma-Aldrich, Saint Louis, MO, USA, A7906), Bradford reagent (Sigma-Aldrich, B6916), dimethylamino methacrylate (Purolite Ltd., Wales, UK, ECR8309F/ECR8309M), dimethylamino methacrylate (Resindion S.r.l., Binasco, Italy, EA403/M), disodium hydrogen phosphate dihydrate (VWR International GmbH, Darmstadt, Germany, 28029.260), D-mannose (Biosynth Ltd., Compton, UK, MM06704), epoxy methacrylate (Purolite Ltd., Wales, UK, ECR8204F/ECR8204M), glutardialdehyde (Carl Roth GmbH & Co. KG, Karlsruhe, Germany, 3778.1), HEPES (Carl Roth GmbH & Co. KG, Karlsruhe, Germany, HN78.3), hexamethylamino methacrylate (Resindion S.r.l., Binasco, Italy, HA403/M), imidazole (Merck KGaA, Darmstadt, Germany, 104716), magnesium chloride hexahydrate (Sigma-Aldrich, Saint Louis, MO, USA, M9272), N-acetyl-D-glucosamine (Biosynth Ltd., Compton, UK, MA00834), N-acetyl-D-mannosamine (Biosynth Ltd., Compton, UK, MA05269), N-acetylneuraminic acid (Biosynth Ltd., Compton, UK, MA00746), NAD (Carl Roth GmbH & Co. KG, Karlsruhe, Germany, AE11.3), orthophosphoric acid (Merck KGaA, Darmstadt, Germany, 100563), sodium chloride (VWR International GmbH, Darmstadt, Germany, 27810.295), sodium phosphate monobasic monohydrate (Sigma-Aldrich, Saint Louis, MO, USA, 71507), sodium pyruvate (Biosynth Ltd., Compton, UK, FS06501), Tris (AppliChem GmbH, Darmstadt, Germany, A1379). All chemicals were of analytical grade.

2.2. Enzyme Expression and Purification

The gene for the GlcNAc 2-epimerase from Pedobacter heparinus (gene: Phep_3251) was ordered as codon optimised gBlock gene fragment (Integrated DNA Technologies, Leuven, Belgium). The gene for the Neu5Ac lyase was amplified from the Escherichia coli (E. coli) BL21(DE3) (gene: nanA) (New England Biolabs, Frankfurt, Germany, C2527H) genome. The genes for epimerase and lyase were cloned into pETDuetTM-1 (Merck KGaA, Darmstadt, Germany, 71146) expression vector. E. coli BL21(DE3) (New England Biolabs) was transformed with the plasmids pETDuet-1_phepi(N) and pETDuet-1_ecneua(N) using heat shock. The gene for N-acylmannosamine 1-dehydrogenase (ManDH) from Flavobacterium sp. 141-8 (EC 1.1.1.233, gene: NAM-DH, UniProt KB: P22441, [21]) cloned into the pET28-a(+) expression vector (pET28a(+)_fsmandh(N)) was kindly provided by the Graz University of Technology, Institute of Biotechnology and Biochemical Engineering. E. coli JM109(DE3) (Promega Corporation, Walldorf, Germany, P9801) was transformed with the plasmids pET28a(+)_fsmandh(N) using heat shock. All enzymes were N-terminal hexahistidine (His6) tagged, and the expression was performed as a fed-batch cultivation with an adjusted medium described by Lilley et al. [22] in a bioreactor (Infors AG, Bottmingen, Switzerland, Multifors 2) with a working volume of up to 0.8 L. For enzyme purification immobilised metal affinity chromatography (IMAC) was used. The buffer was exchanged to 20 mmol∙L−1 Tris buffer with 20 mmol∙L−1 D-Mannose at pH 7.0 for epimerase and to 10 mmol∙L−1 HEPES buffer pH 7.5 for lyase performed by tangential flow filtration (TFF) (Vivaflow® 200 Module, VWR International GmbH, Darmstadt, Germany, 512-4069). The epimerase and lyase were lyophilised in a freeze-drying system (Martin Christ Gefriertrocknungsanlagen GmbH, Osterode, Germany, Alpha 1-2 LD) and stored at −20 °C. ManDH was stored in IMAC elution buffer (50 mmol∙L−1 sodium phosphate, 300 mmol∙L−1 sodium chloride, 150 mmol∙L−1 imidazole, pH 7.5) at 6 °C. The purity of the enzyme was qualified by SDS-PAGE. Protein concentration was determined by the Bradford assay using BSA as a reference. Enzyme-specific absorption at 280 nm was used for purified enzyme [23]. The protein extinction coefficients for enzyme-specific absorption were calculated in the Expasy ProtParam web application [24].

2.3. Immobilisation

For the covalent immobilisation of the epimerase and lyase, amino methacrylate carrier (pre-activated with glutaraldehyde) and epoxy methacrylate carrier were used (Table 1). Using glutaraldehyde pre-activated amino methacrylate carrier, the enzyme’s terminal amino group forms multiple covalent bonds with the resin’s aldehyde group, forming an imino bond [25]. Epoxy-functionalised carriers form stable covalent bonds with thiol, amino, carboxyl or phenol groups of the enzymes [26]. Immobilisation was performed as described in our previous studies [15,27]. A 20 mmol·L−1 sodium phosphate buffer at pH 7.5 was used as buffer for immobilisation. For mixing during the immobilisation process, a rotary mixer (Sample Mixer MXICI, Dynal AS, Oslo, Norway) or a bench-top roller (Wheaton Science Products, Miliville, NJ, USA) was used. For vacuum filtration, a vacuum pump (Chemistry diaphragm pump ME 2C NT, Vacuubrand GmbH + Co. KG, Wertheim, Germany), a filter attachment (Bottletop-filter, Thermo Fisher Scientific Inc., Waltham, MA, USA) and a membrane filter (Labsolute® CA membrane filter, Th. Geyer GmbH & Co. KG, Renningen, Germany) were used. The carrier was equilibrated by washing it three times with immobilisation buffer at a 1:2 (w/v) ratio of carrier to buffer. For pre-activation of the amino methacrylate carrier, a 1% glutaraldehyde (v/v) solution in immobilisation buffer with a ratio of 1:4 (w/v) carrier to solution was used. After the addition of the 1% glutaraldehyde solution, mixing was carried out for 1 h at room temperature and at 10 rpm. The pre-activated amino methacrylate carrier was then washed 3 times with immobilisation buffer (ratio of 1:4 (w/v) carrier to solution). A 5 mg·mL−1 enzyme solution in immobilisation buffer was added to the equilibrated and pre-activated carrier after vacuum filtration with an enzyme loading of 50 or 100 mgezyme·gcarrier−1 and was mixed at 20 °C and at 10 rpm for 18 h. Epoxy methacrylate carrier was then stored for additional 20 h at 20 °C without mixing. The immobilisates were washed with immobilisation buffer containing 500 mmol·L−1 sodium chloride to desorb non-covalently bound proteins and stored in immobilisation buffer at 6 °C. The specific enzyme activity and enzyme concentration were determined in the enzyme solution before and after immobilisation. Enzyme concentration was determined by enzyme-specific absorption at 280 nm. The carrier-specific activity was determined with the immobilisate. In order to characterise the immobilisation process, the immobilisation efficiency and the activity yield were calculated as described by Syldatk et al. [28] (pp. 200–203). The immobilisation efficiency (EffImmo) is the percentage of the measured immobilised activity (apparent activity, EAapp) of the theoretical immobilised activity (Equation (1)).
E f f i m m o = E A a p p E A t o t a l E A f r e e · 100 %
EAtotal is the theoretical maximum enzymatic activity and EAfree is the activity remaining in the enzyme solution after immobilisation. The activity yield (YEA) describes the percentage of the apparent activity (EAapp) from the theoretical maximum activity (EAtotal) (Equation (2)).
Y E A = E A a p p E A t o t a l · 100 %

2.4. Activity Assays in Batch Experiment

The activity assays with a reaction volume of 1 mL ( V r e a c t i o n ) were performed in duplicate in a 1.5 mL reaction tube for soluble enzyme or in a 2 mL reaction tube for immobilised enzyme. The reaction was performed in a thermoshaker (Grant Instruments, Amsterdam, The Netherlands, PCMT Thermoshaker) at 40 °C with a rotation speed of 1000 rpm.
The substrate for epimerase contained 100 mmol·L−1 GlcNAc, 1 mmol·L−1 MgCl2, 1 mmol·L−1 ATP and 100 mmol·L−1 Tris at pH 8.0. The reaction was catalysed by 2.5 µg soluble epimerase ( m e n z y m e ) or 10 mg immobilised epimerase ( m i m m o b i l i s a t e ). The reaction sample was taken after 10 min ( t r e a c t i o n ) and was stopped with acetonitrile in a volumetric ratio of 1:3 (ACN:sample). ManNAc was quantified by ManDH assay according to Klermund et al. [30]. The ManDH assay (Scheme S1) was performed in a 1.6 mL cuvette (Sarstedt AG & Co. KG, Nümbrecht, Germany, 67.740) containing 850 µL of sample diluted in 100 mmol·L−1 Tris at pH 8.0, 100 µL of 20 mmol·L−1 NAD and 50 µL of ManDH solution at a minimum of 3 kU∙mL−1. The reaction time was 30 min at room temperature, and NADH was measured photometrically at 340 nm (Bio Spectrometer Basic Eppendorf SE, Hamburg, Germany). The ManNAc concentration ( c p r o d u c t ) was equivalent to NADH and was calculated by Equation (3), with the absorption at 340 nm ( A 340 ) and an extinction coefficient ε N A D H of 6220 L∙mol−1∙cm−1 [31]. The measuring range was from 0.02 mmol·L−1 to 0.2 mmol·L−1.
c p r o d u c t = A 340 · 1000 · f d i l u t i o n ε N A D H
The substrate for lyase contained 100 mmol·L−1 ManNAc, 250 mmol·L−1 pyruvate and 100 mmol·L−1 Tris at pH 8.0. The reaction was catalysed by 100 µg soluble lyase ( m e n z y m e ) or 50 mg immobilised lyase ( m i m m o b i l i s a t e ). The reaction sample was taken after 10 min ( t r e a c t i o n ) and was stopped with acetonitrile in a volumetric ratio of 1:3 (ACN:sample). Neu5Ac was quantified ( c p r o d u c t ) using an Agilent 1100 series HPLC (Agilent Technologies, Santa Clara, CA, USA). A Nucleogel Sugar 810H (Macherey-Nagel GmbH & Co. KG, Düren, Germany, 719574) column was used at 40 °C and a flow rate of 0.6 mL·min−1. The isocratic eluent was HPLC grade water with 0.1% phosphoric acid (85%). Peaks were detected at 210 nm (variable wavelength detector (VWD, Agilent Technologies)) with a retention time of 8.1 (Neu5Ac), 9.4 (pyruvate) and 10.9 min (GlcNAc/ManNAc) (Figure S1). The measuring range is from 0.05 mmol·L−1 to 10 mmol·L−1.
Activity ( v ) was calculated according to Equation (4).
v = c p r o d u c t · V r e a c t i o n t r e a c t i o n · m e n z y m e   o r   i m m o b i l i s a t e

2.5. Impact of the Reaction Conditions
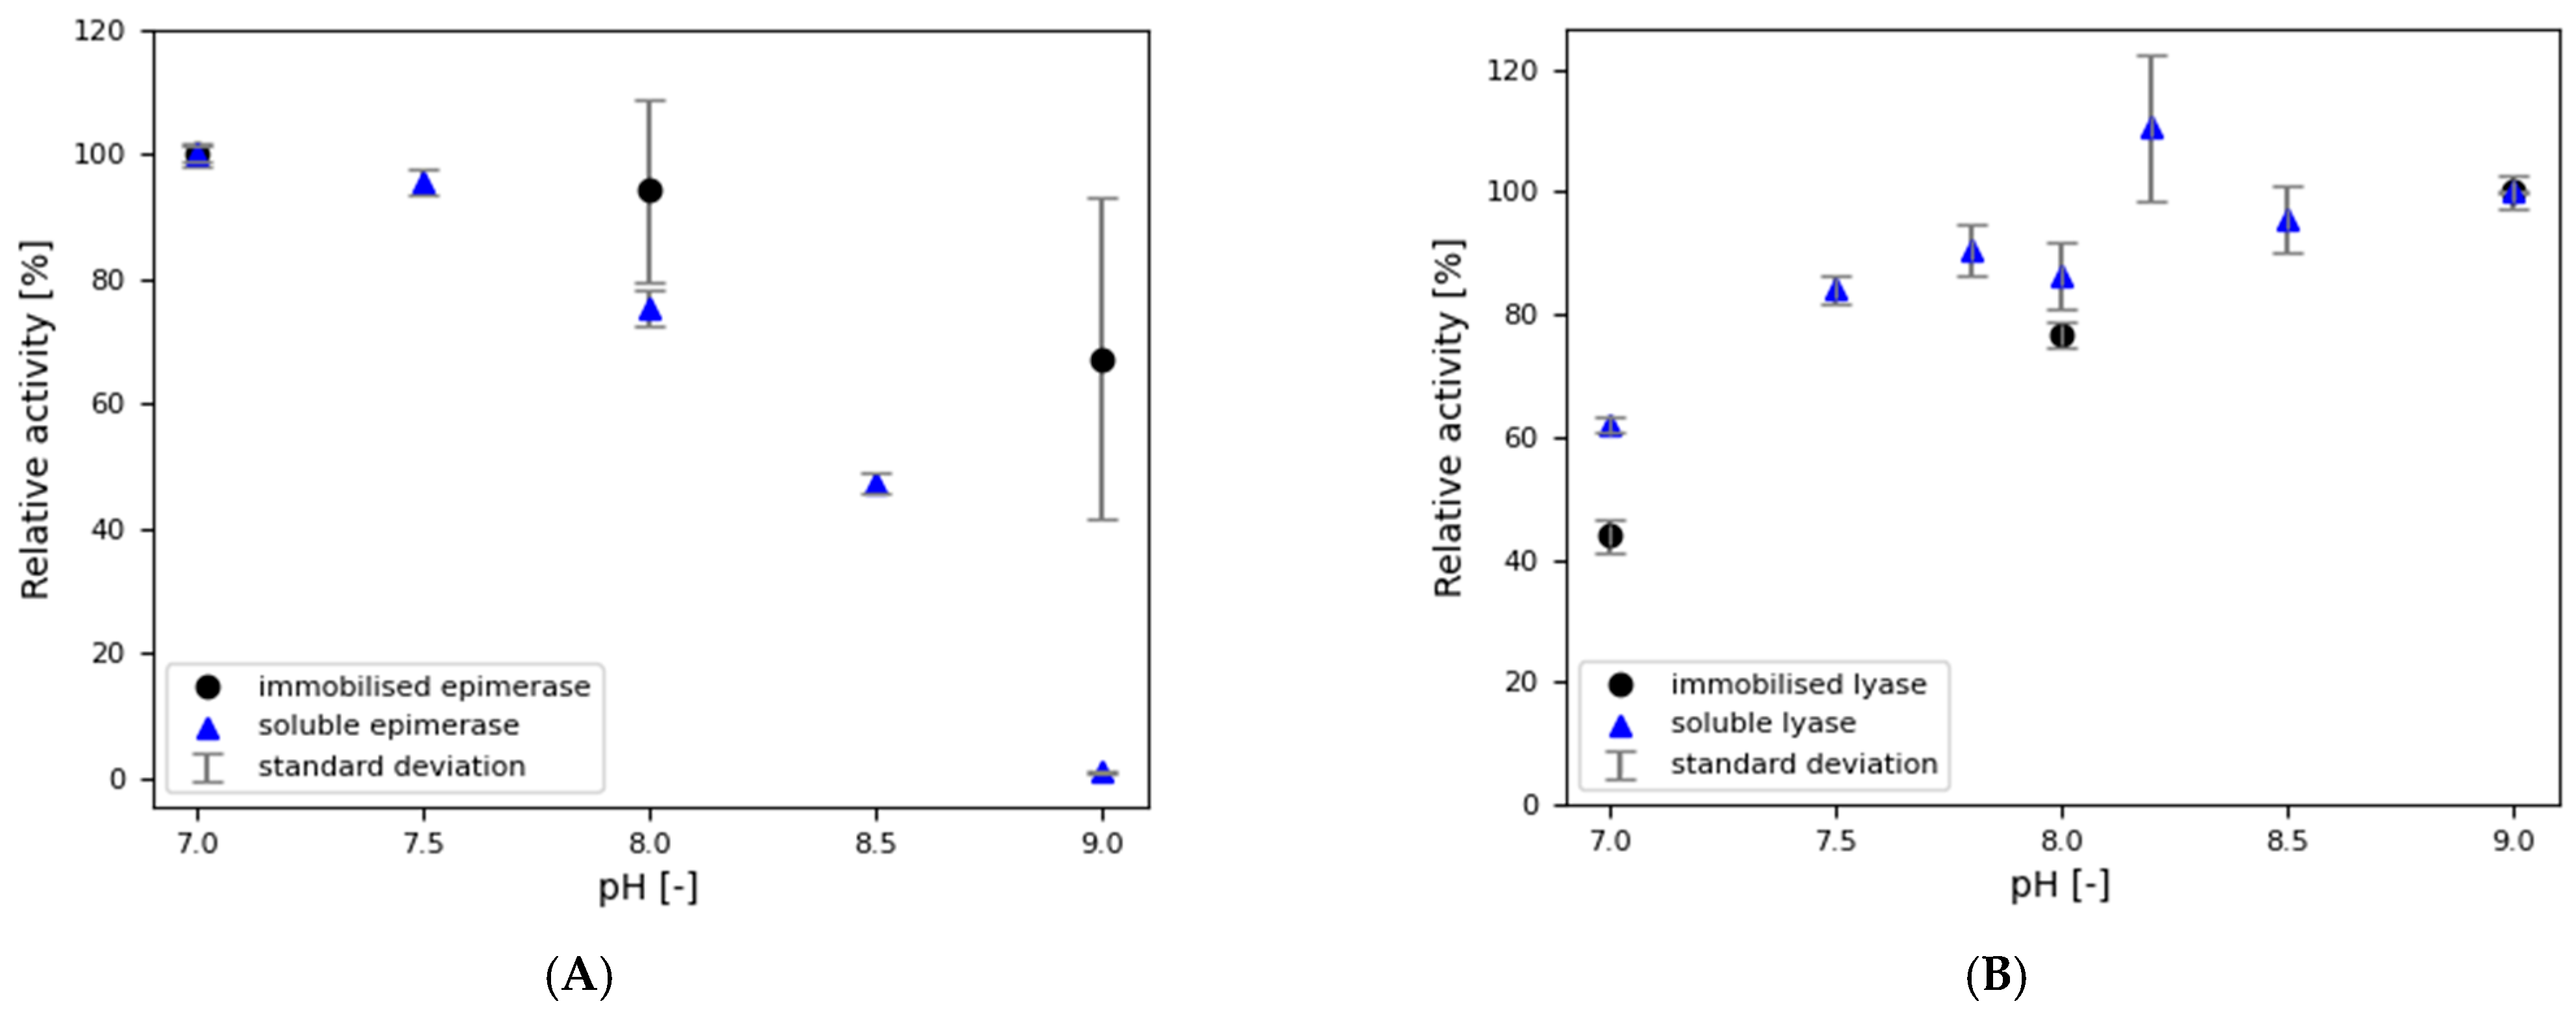
2.5.1. Impact of pH

To determine the influence of pH on the initial activity of the soluble and immobilised enzymes, the substrate pH was varied from 7–9. The activity was determined according to Section 2.4. The experiments with immobilisates were performed with enzymes immobilised on epoxy methacrylate ECR8204M (epimerase) and dimethylamino methacrylate ECR8309M preactivated with glutaraldehyde (lyase).

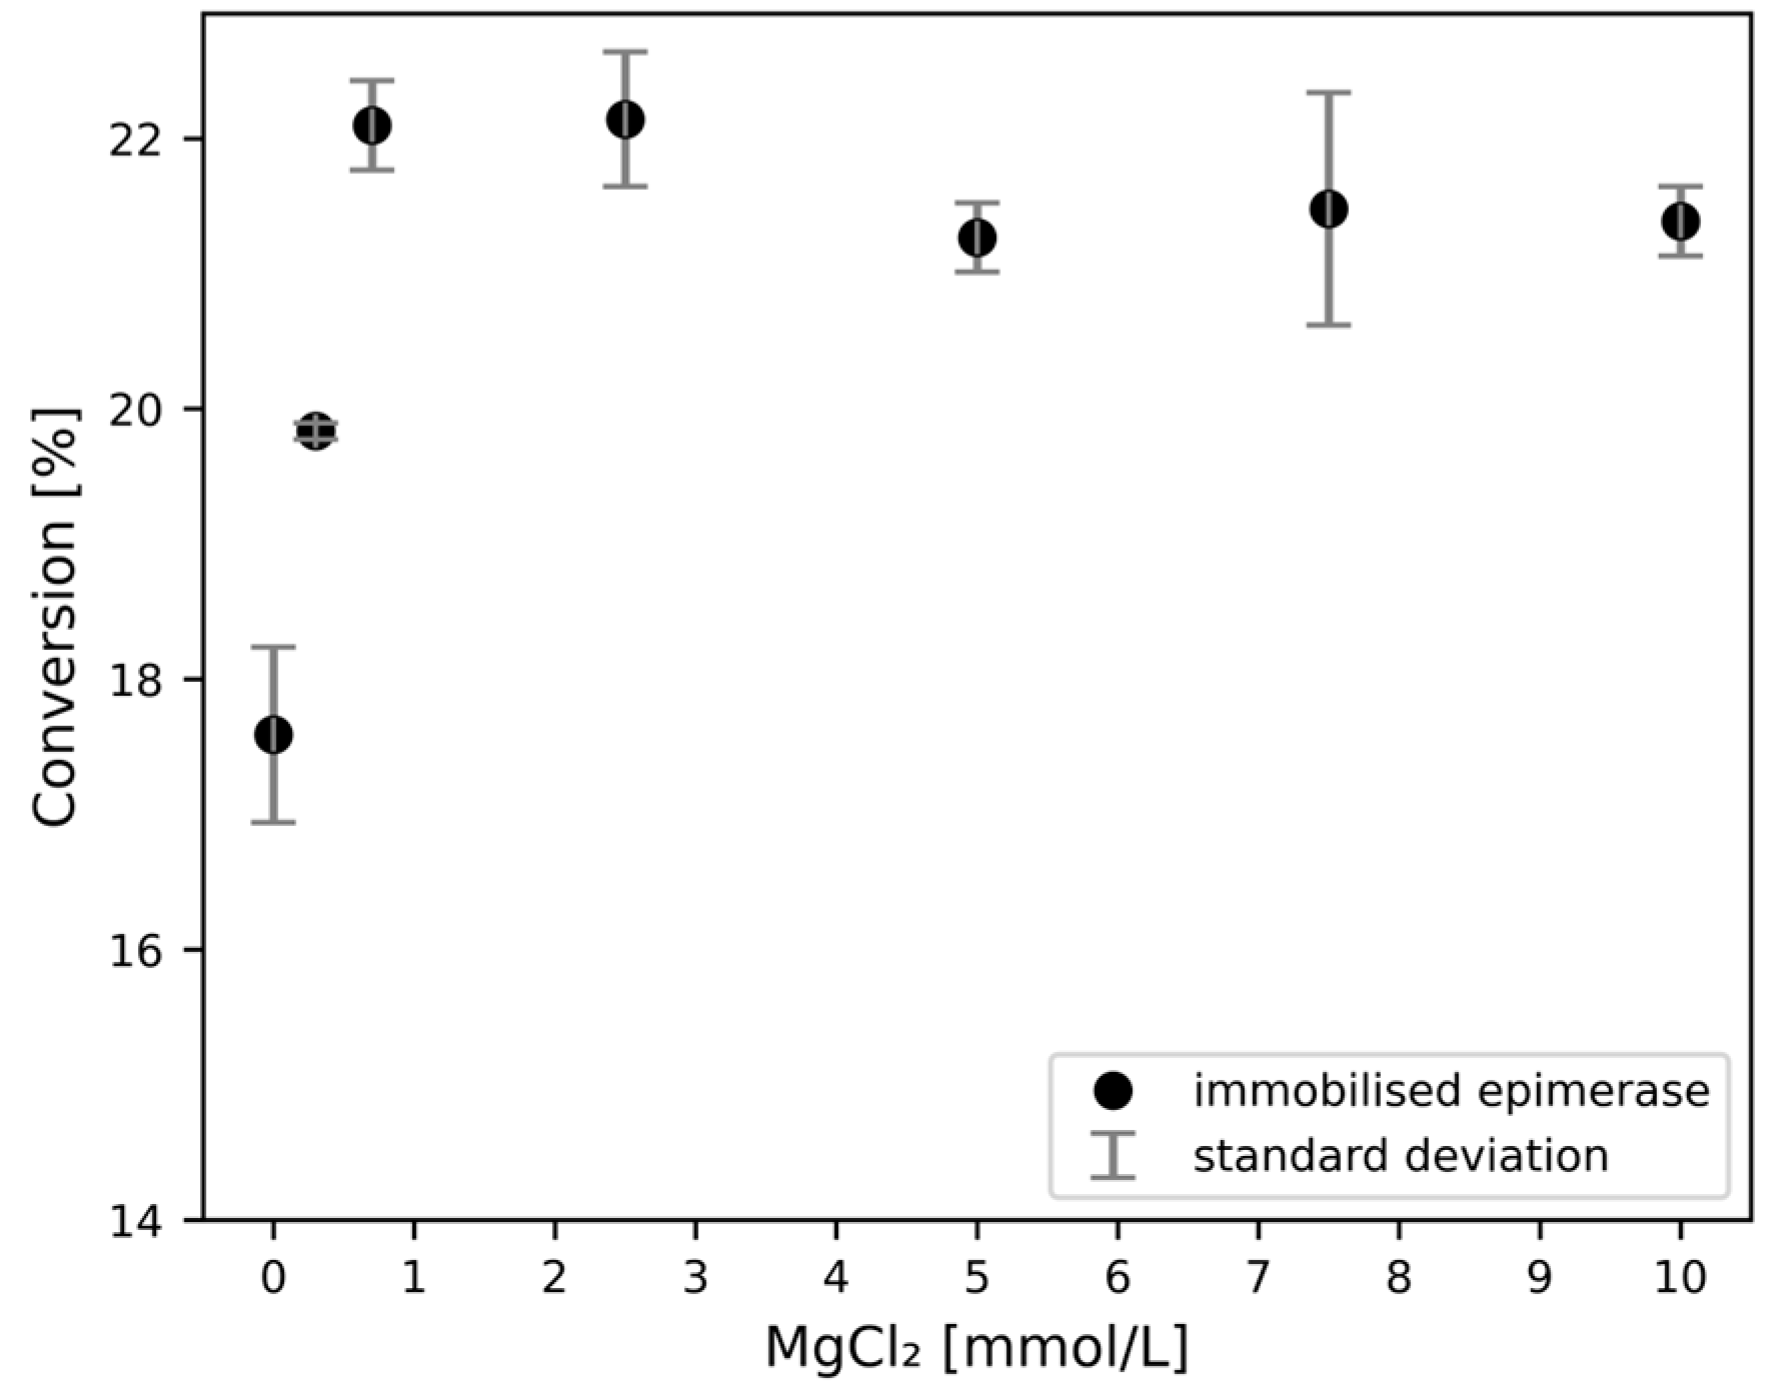
2.5.2. Impact of Activators

The influence of ATP was analysed for the soluble and the immobilised enzyme by varying the ATP concentration in the range of 0–10 mmol·L−1 in the substrate of the activity assay, as described in Section 2.4. The influence of MgCl2 was analysed for the soluble and the immobilised enzyme by varying the MgCl2 concentration in the range of 0–50 mmol·L−1 in the substrate of the activity assay, as described in Section 2.4. The influence of MgCl2 on the equilibrium conversion of epimerase was also investigated. Therefore, MgCl2 was varied in the range of 0–10 mmol·L−1. The conversion was analysed after 180 min. The experiments with immobilisates were performed with enzymes immobilised on epoxy methacrylate ECR8204M (epimerase) and dimethylamino methacrylate ECR8309M preactivated with glutaraldehyde (lyase).

2.6. Characterisation of the Immobilised Enzymes in a Packed Bed Reactor

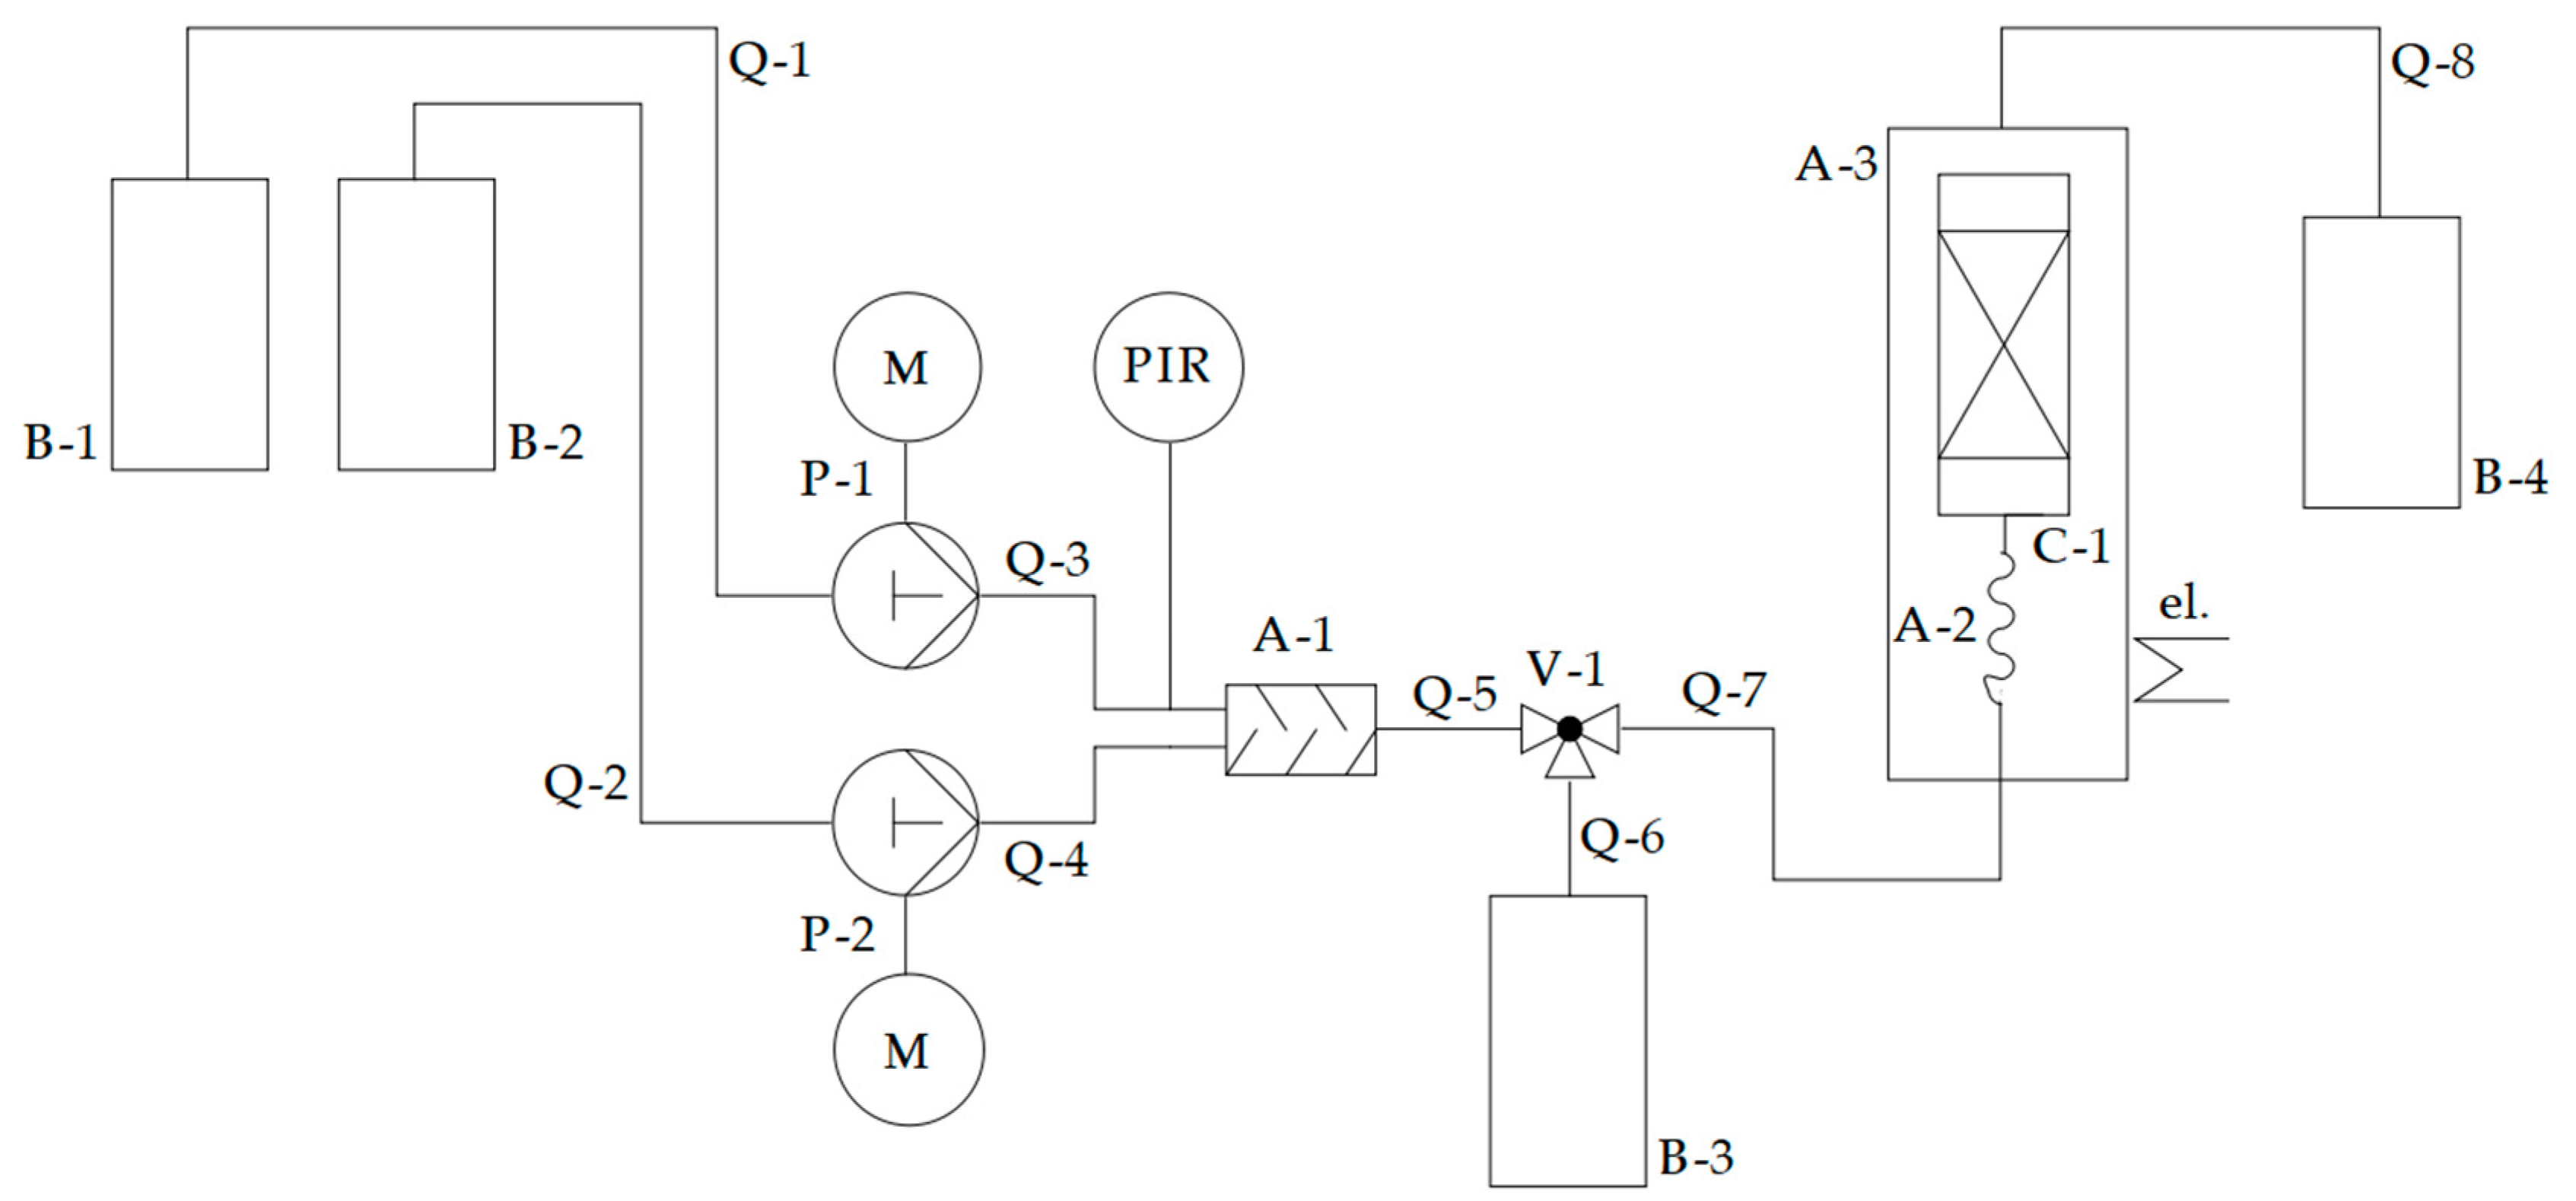
2.6.1. Experimental Setup

The experimental setup shown in Figure 1 was used to determine the activities and kinetic parameters of the immobilised enzymes in the PBR. Substrate solutions were placed in the laboratory bottles (B-1, B-2). Pumps (P-1, P-2) (Acquity UPLC system, Waters Corporation, Milford, MA, USA) were used to adjust the mixing ratio of the substrate solutions and the volume flow. The mixing chamber (A-1) ensured sufficient mixing of the substrate solutions. A sample of the substrate (B-3) was taken after mixing using the sample valve (V-1). The substrate solution was tempered in a capillary loop (A-2) before entering the PBR (C-1). The reactor was filled with immobilised enzyme and blocked carrier (carrier material with covalently bonded Tris). The PBR and the capillary loop were tempered in the column oven (A-3) (Acquity UPLC system, Waters Corporation). Liquid flowing through the system was collected in a laboratory bottle (B-4) or sampled at the end of capillary Q-8. The PEEK capillaries Q-5 to Q-8 had an inner diameter of 0.5 mm.

2.6.2. Packing of the Reactor

To characterise the immobilised enzymes in a PBR, the immobilisate and the blocked carrier (carrier material with covalently bonded Tris) are filled into a reactor (Table 2). When filling the PBR, a consistent, dense packing should be achieved, and the column bed should be reproducible. For filling PBR 1-10, a PEEK seal and a union nut were used to connect the reactor to another 4.6 mm ID column. The larger ID facilitates filling the material into the column. A funnel (Kosmetex GmbH, Unterhaching, Germany, perfume funnel) was used to fill in the material. The reactor, column and funnel were filled with degassed buffer, and the immobilisate was added via the funnel. The funnel was then removed, the column head screwed on and the immobilisate compacted in the reactor under continuous flow using an LC pump. The reactor was overfilled so that the excess material was removed with the additional 4.6 mm ID column after densification. This ensures that the reactor is completely filled. The PBRs used in this study are listed in Table 2. There was no second column used for the filling of PBR 11 because of the large ID. PBR 1-7 were stainless steel UHPLC columns (Isera GmbH, Düren, Germany), PBR 8-10 were BioSafe column systems (IDEX Health & Science, LLC, Middleboro, MA, USA), and PBR 11 was a stainless steel HPLC column (MACHEREY-NAGEL GmbH & Co. KG, Düren, Germany).

2.6.3. Enzyme Activity in Packed Bed Reactors

For the determination of the initial activity in the PBR, the experimental setup from Section 2.6.1. was used. The substrate for epimerase contained 100 mmol·L−1 GlcNAc, 1 mmol·L−1 MgCl2, 1 mmol·L−1 ATP and 200 mmol·L−1 Tris at pH 8.0. The substrate for lyase contained 100 mmol·L−1 ManNAc, 250 mmol·L−1 pyruvate and 200 mmol·L−1 Tris at pH 8.0. The reactor had an ID of 3 mm and a length of 30 mm. At a flow rate of 1.5 mL∙min−1 ( V ˙ ) and a temperature of 30 °C, the activities were determined. The system and the reactor were equilibrated for 4 min to achieve a constant state. A sample for the measurement of product concentration ( c p r o d u c t ) (as described in Section 2.4.) was taken at 4 and 4.5 min and the activity ( v ) was calculated (Equation (5)). The mass of immobilisate ( m i m m o b i l i s a t e ) is defined in Table 2.
v = c p r o d u c t · V ˙ m i m m o b i l i s a t e

2.6.4. Stability of Immobilised Enzymes in Packed Bed Reactors Under Continuous Flow

The stability of the immobilised enzymes in a PBR at continuous flow was analysed using the experimental setup shown in Figure 1. At a flow rate of 1.5 mL∙min−1, a 200 mmol∙L−1 Tris buffer at pH 8.0 containing 20 mmol∙L−1 MgCl2 was continuously pumped through the reactor for at least 28 days. The buffer was in circulation and was changed twice a week. PBR 1 (epimerase) and PBR 7 (lyase) were used for this study (Table 2). The oven was set to 30 °C for tempering the substrate in the capillary loop and the PBR. At regular intervals, the enzyme activity was determined according to Section 2.6.3. Stability was assessed by half-life time, which is the time required to half the initial activity. The deactivation constant kd was determined by exponential fitting. The half-life time ( t 1 2 ) was calculated according to Equation (6) [32].
t 1 2 = l   n 2 k d

2.6.5. Substrate Adsorption on Carrier

The adsorption of substrates, intermediates and products on the carrier was analysed in 2 mL reaction tubes. 30 mg blocked carrier and 0.5 mL solution with substrate, intermediate or product in 200 mmol∙L−1 Tris pH 8.0 with 20 mmol∙L−1 MgCl2 were stored for 4 h at 30 °C and 1000 rpm in a thermoshaker. The solutions contain 100 mmol∙L−1 GlcNAc, pyruvate, ManNAc or Neu5Ac. The concentrations in the solution were measured by HPLC before and after 1 h and 4 h of storage, according to Section 2.4. Adsorption on the carrier material is expected to reduce the concentration in the solution. The experiments were performed with the carriers hexamethylamino methacrylate HA403/M and dimethylamino methacrylate ECR8309M, both preactivated with glutaraldehyde and blocked with Tris.

2.7. Kinetics

Kinetic parameters were determined using the experimental setup described in Section 2.6.1. A stainless-steel reactor with an inner diameter (ID) of 3 mm and a length of 30 mm (Isera GmbH, Düren, Germany) was used. The flow rate was set to 1.5 mL∙min−1 and the reactor was tempered at 30 °C. The substance to be varied was not contained in substrate A (Figure 1, B-1), but in substrate B (Figure 1, B-2) in high concentrations. Different substrate concentrations ( c S ) can be supplied by changing the mixing ratio of the binary pump. A sample for activity determination (Figure 1, B-4) was taken after 4 and 4.5 min equilibration time. Afterwards, a substrate sample was taken (Figure 1, B-3). To ensure a constant activity and to record any decreases in activity caused by the experiments, the activity of the immobilisate in the reactor was measured at the beginning and the end of a daily series of measurements, according to Section 2.6.3.
The Michaelis–Menten constant (Km) and the maximum reaction rate (vmax) were calculated using the method of least squares error deviation. The Michaelis–Menten equations for single-substrate kinetics (Equation (7)) and two-substrate kinetics (Equation (8)) were used [28] (pp. 62–63).
v = v m a x · c S K m + c S
v = v m a x · c S , A K m A + c S , A · c S , B K m B + c S , B
The substances in the cascade that might inhibit epimerase or lyase were screened. The screening was performed in batch experiments with immobilised enzymes, as described in Section 2.4. The inhibitors were added in different concentrations. For epimerase inhibition, 0–1000 mmol∙L−1 pyruvate, 0–1000 mmol∙L−1 ManNAc and 0–250 mmol∙L−1 Neu5Ac were tested. For lyase inhibition, 0–1000 mmol∙L−1 GlcNAc was tested. The screening experiments were performed with enzymes immobilised on epoxy methacrylate ECR8204M (epimerase) and dimethylamino methacrylate ECR8309M preactivated with glutaraldehyde (lyase).
The inhibition constants KI in PBR were determined by adding the inhibitor in different concentrations to the substrates described in Section 2.6.3. Pyruvate was varied from 0–1297 mmol∙L−1 for epimerase inhibition. GlcNAc was varied from 0–1073 mmol∙L−1 for lyase inhibition. KI was determined as competitive inhibition according to Equation (9) by least squares method for epimerase and lyase.
v = v m a x · c S K m · 1 + c I K I + c S

2.8. Modelling of Progress Curves

Progress curves were calculated using Python (Version 3.8.8) in the JupyterNotebook (Version 6.3.0) interactive computing notebook environment (Python script: Figure S2). The change in concentration ( c i ) was calculated over the length of the PBR (z) using the Runge–Kutta method according to Equations (10) and (11) [33] (p. 91).
c i z + d z = c i z + c i z · d z
c i z = r i u z = v i · m i m m o · t ¯ V P B R
Concentration dependent activities ( v i ) were calculated using Michaelis–Menten equations, as described in Section 2.7. The reaction rate ( r i ) is defined as the activity ( v i ) multiplied by the mass of immobilised enzyme ( m i m m o ) . The flow rate ( u z ) is defined as the reactor volume ( V P B R ) divided by the residence time ( t ¯ ).

2.8.1. Residence Time Determination

The mean hydrodynamic residence time of PBR 1-10 (Table 2) was determined by a pulse experiment. The experimental setup consists of a pump, autosampler, diode array detector (DAD) (Agilent 1100 series, Agilent Technologies) and an incubator (Vevor®, Linkenheim–Hochstetten, Germany). A 20 mmol∙L−1 sodium phosphate buffer was pumped through the system. As tracer, 1 µL of a 100 mmol∙L−1 Neu5Ac solution was injected. The signal (S(t)) was detected at intervals of 0.4 s. The residence time distribution of the system and the system with PBR was analysed. The pulse function was converted to the residence time density function (E(t)) according to Equation (12) [34].
E t = S t 0 S t d t
The area under the pulse was calculated using the trapezoidal rule. The mean value of the distribution t ¯ was calculated (Equation (13)).
t ¯ = 0 t E t d t
The residence time of the reactor was calculated by subtracting the residence time of the system from the residence time of the system with PBR. The residence times were determined in triplicates. Python was used for calculation.
The residence time of larger PBR 11 (Table 2) was analysed by mass flux analysis as single determination. A 40 mmol∙L−1 pyruvate solution was pumped through the system using a GPC pump (LCTech GmbH, Dorfen, Germany). Samples were taken in 5 min intervals, and absorption was measured photometrically at 320 nm (Eppendorf SE, BioSpectrometer Basic). The signals were converted to the residence time sum function (Equation (14)) and to the residence time density function by differentiation. The residence time was calculated according to Equation (13).
F t = c ( t ) c 0

2.8.2. Determination of Reactor Volume

The fluid volume in the PBR cannot be calculated, as the pore volume of the particles is not known and is also difficult to determine due to the large particle size distribution. However, it plays an important role in the modelling and was therefore determined experimentally. The volume of the PBR was determined by comparing the residence time of the unfilled reactor with the residence time of the reactor filled with immobilisate. The residence time of the unfilled reactor was determined according to Section 2.8.1. A factor ( f V , P B R ) was calculated by deviation of the residence time of the unfilled and immobilisate-filled reactors. The reactor volume was calculated according to Equation (15) with the inner diameter (D) and the length (L) of the reactor.
V P B R = π 4 · D 2 · L · f V , P B R

2.9. Model Validation

Model validation was performed in two steps. In the first step, the models for epimerase and lyase were validated separately using different column sizes, immobilisate masses and flow rates. The reaction conditions for model validation of epimerase were 200 mmol∙L−1 Tris, 20 mmol∙L−1 MgCl2, 100 mmol∙L−1 GlcNAc, 1 mmol∙L−1 ATP, pH 8.0 and 30 °C. The reaction conditions for model validation of lyase were 200 mmol∙L−1 Tris, 20 mmol∙L−1 MgCl2, 100 mmol∙L−1 ManNAc, 250 mmol∙L−1 pyruvate, pH 8.0 and 30 °C.
The second step in model validation was the combination of the two immobilised enzymes. The two immobilised enzymes were gently and carefully mixed in a tumbler and added to the reactor. The validation was performed with two different PBR configurations. The reaction conditions were the same for these experiments, with a temperature of 30 °C, 1 mmol∙L−1 ATP, 200 mmol∙L−1 Tris and pH 8.0, but with varied substrate and MgCl2 concentrations. The first PBR configuration was a series of two small PBRs (Table 2, PBR 9 and 10) with 117 mmol∙L−1 GlcNAc, 298 mmol∙L−1 pyruvate and 20 mmol∙L−1 MgCl2. The second was one larger-sized column (Table 2, PBR 11) with 236 mmol∙L−1 GlcNAc, 427 mmol∙L−1 pyruvate and 1 mmol∙L−1 MgCl2.
For the measured data, there is only one point at the end of the PBR, as the concentrations inside of the reactor cannot be measured. Changes in activity due to altered immobilised enzymes or batch changes were considered in the model by a correction factor ( f c o r r e c t i o n ) multiplicated with the vmax. The f c o r r e c t i o n was calculated by dividing the actual activity by the activity of the immobilised enzyme used for kinetic characterisation. The mass balances of substrate, intermediate and product concentrations were observed before and after the reactor to ensure the functionality of the model and the analytics of the experimental results.

3. Results and Discussion

3.1. Enzyme Expression and Purification

For fed-batch fermentation, the strains Escherichia coli (E. coli) BL21(DE3) pETDuet-1_phepi(N) (epimerase) and E. coli BL21(DE3) pETDuet-1_ecneua(N) (lyase) were cultivated, with a total volume of 0.6 L. Epimerase production resulted in an enzyme yield of 3.2 g∙L culture−1, with a specific activity of 134 U∙mg enzyme−1. Lyase production resulted in an enzyme yield of 3.1 g∙L culture−1 with a specific activity of 7 U∙mg enzyme−1. The enzyme yield is very high compared to the literature data of other recombinant lyase productions described so far, with 0.005 g∙L culture−1 [35] or 0.4 g∙L culture−1 [22]. Purity was confirmed by sodium dodecyl sulfate-polyacrylamide gel electrophoresis (SDS-PAGE) (Figures S3 and S4). The His6-tagged epimerase, with a calculated mass of 48.8 kDa, and lyase, with 34.3 kDa, clearly show bands at this level. Experiments showed that the enzymes are stable for at least one year when lyophilised and stored at −20 °C.

3.2. Immobilisation

In our previous study, we described an enzyme immobilisation screening with different covalent and adsorptive immobilisations for epimerase and lyase [15]. With respect to the activity and stability of the immobilised enzymes in this screening, the epoxy methacrylate carrier ECR8204F was chosen for epimerase immobilisation and the dimethylamino methacrylate carrier ECR8309F for the lyase immobilisation. Due to high back pressures in the PBR experiments, a change was made, and the epoxy methacrylate carrier ECR8204M for epimerase and dimethylamino methacrylate carrier ECR8309M for lyase with larger particle diameters and the same pore diameters were applied. Particle sizes changed from 150–300 µm (ECR8204F/ECR8309F) to 300–710 µm (ECR8204M/ECR8309M) (Table 1). For epimerase, the change in particle size resulted in a decrease in activity yield from 3.1% (ECR8204F) to 0.6% (ECR8204M) and a decrease in activity from 107.4 U·g carrier−1 (ECR8204F) to 50.8 U·g carrier−1 (ECR8204M), while the carrier load remained unchanged (Table 3). In contrast to this, the change in particle size for lyase resulted in an increase in activity yield from 6.5% (ECR8309F) to 10.6% (ECR8309M) and an increase in activity from 26.5 U·g carrier−1 (ECR8309F) to 63.6 U·g carrier−1 (ECR8309M), while the carrier load remained unchanged (Table 4). The reduction in particle size increases the surface area of the particles for the same pore size. For the epimerase of 48.8 kDa, it could lead to blocking or limited substrate diffusion into the pores and thus to a reduction in activity with larger particles [36]. The smaller particle diameters allowed more enzyme to bind to the outer surface, resulting in higher activities for epimerase. The smaller lyase, with 34.4 kDa, may have been less affected by substrate diffusion or blocking of the pores with enzymes. As a result, the enzymes within the pores had higher activity and resulted in higher activity using larger particle diameters. In the case of lyase, increasing the particle size led to a higher activity yield and a higher carrier-specific activity and is therefore applicable. For epimerase, the smaller particle diameter led to better results in activity yield and carrier-specific activity. However, due to the back pressure problems associated with the use of smaller particles, the larger particle diameter was chosen for both enzymes for further experiments.
The epimerase immobilisation was changed to an amino methacrylate carrier due to the lack of availability and low durability of the epoxy methacrylate carrier ECR8204M (Table 3). The hexamethylamino methacrylate HA403/M and the dimethylamino methacrylate EA403/M were compared. The hexamethylamino methacrylate showed a higher activity with 41.0 U·g carrier−1 (HA403/M) compared to 29.4 U·g carrier−1 (EA403/M) at comparable carrier loading. The accessibility of the active site of the epimerase may be increased by the longer spacer of hexamethylamino methacrylate. The higher activity with the epoxy methacrylate carrier ECR8204M with 50.8 U·g carrier−1 compared to 41.0 U·g carrier−1 with the hexamethylamino methacrylate HA403/M could be explained by the different binding groups. Binding to the epoxy group occurs via amino, thiol, carboxyl and phenol groups, whereas the binding to the aldehyde group of the glutaraldehyde preactivated amino methacrylate carrier is only possible via the amino group [26,37]. Better orientation of the active site may result from the epoxy bond and lead to higher activity. Although the epoxymethacrylate carrier shows a higher activity than the hexamethylamino methacrylate carrier, the hexamethylamino methacrylate is used for further experiments due to the longer shelf life of the carrier material.
The low immobilisation efficiency of 0.3 to 12.4% and activity yield of 0.3 to 10.6% for immobilised epimerase and lyase might be due to enzyme conformational changes or an inaccessible active site due to the undirected covalent immobilisation. Previous studies had already reported such low efficiencies and yields for this type of enzyme immobilisation [27,38]. Enzyme conformational changes by immobilisation had already been described by Rădoi et al. for His-tag affinity immobilisation [39].
For kinetic characterisation, the hexamethylamino methacrylate HA403/M carrier was chosen for the epimerase and dimethylamino methacrylate ECR8309M for the lyase.

3.3. Impact of the Reaction Conditions

3.3.1. Impact of pH

The effect of the pH on the activity of dissolved and immobilised epimerase and lyase in Tris buffer was determined in the buffer range of pH 7–9. The activity of epimerase decreased with increasing pH (Figure 2A). Wang et al. described high epimerase activities in the pH range 7–10 using phosphate buffer [40], whereas in the presented experiments, an activity decrease and low activities at pH 9 using Tris buffer was determined. The buffer might have an influence on activity for epimerase. Another reason could be the base-catalysed epimerisation [10]. In this experiment, only ManNAc catalysed by the enzyme was evaluated. The base-catalysed epimerisation was measured in the substrate and was subtracted from the total ManNAc concentration after enzymatic catalysis. At pH above 8, the base-catalysed epimerisation showed an impact. Wang et al. might have used the total concentration of ManNAc to calculate the activity and therefore did not evaluate only the enzyme activity. The activity of lyase increased with increasing pH, with the highest activities in the range between pH 7.5 and 9.0 (Figure 2B). A pH optimum has been described in the literature as a pH between 7.5 and 8.0 using Tris buffer [41] and a pH of 8.5 using potassium phosphate buffer [12]. When comparing soluble and immobilised enzymes, there is a different pH impact for the epimerase. Enzyme activity for the immobilised epimerase declines at a slower rate with an increase of the buffer pH. This behaviour has already been described for a GlcNAc 2-epimerase from Synechocystis sp. by Cheng et al. [12]. For both enzymes, a pH of 8.0 was chosen for further experiments.

3.3.2. Impact of Activators

The influence of the ATP and Mg2+ concentration on the activity of dissolved and immobilised epimerase and lyase was investigated. The ATP concentration was varied in a range of 0–10 mmol·L−1. For the dissolved and immobilised epimerase, the activity increased by the addition of ATP up to 1 mmol·L−1 (Figure 3A). While the dissolved epimerase had a low activity of 5% in the absence of ATP, 24% relative activity was detected for the immobilised epimerase. The highest activities were found for soluble and immobilised epimerase at an ATP concentration of 1 mmol∙L-1. Higher concentrations showed a slight inhibition of soluble epimerase, but no effect on immobilised epimerase. ATP was described as an allosteric effector of GlcNAc 2-epimerase from porcine kidney by Maru et al., leading to a 20-fold increase in enzyme activity [42]. Wang et al. analysed the effect of different nucleotides on the activity of epimerase from Pedobacter heparinus and found that only ATP can increase the activity [40]. For soluble enzyme, they described a 2-fold activation with 0.1 mmol·L−1 ATP and a 4-fold activation with 1 mmol·L−1 ATP. Lyase activity was not increased by ATP (Figure 3B). At higher concentrations of ATP, a slight inhibition was observed. ATP might compete with the substrates at the active site.
ATP is required as an allosteric effector to increase the activity of epimerase. As both immobilised enzymes were used, combined in a PBR, the effect on lyase was also investigated to ensure that there was no loss of activity. An optimal ATP concentration of 1 mmol∙L−1 was analysed for epimerase. At this concentration, no loss of lyase activity was determined. Therefore, the addition of 1 mmol∙L−1 ATP in the coupled synthesis was chosen to maximise the activity of the epimerase without affecting the activity of the lyase.
The MgCl2 concentration was varied in a range of 0–50 mmol·L−1 for soluble and immobilised epimerase and lyase. Soluble epimerase was poorly activated by Mg2+, whereas immobilised epimerase achieved a 2-fold activity in the presence of Mg2+ (Figure 4A). Wang et al. described that the addition of Mg2+ did not affect the epimerase activity [40], whereas Kragl et al. described an activation [6]. Immobilisation may affect the structural confirmation of the epimerase. Therefore, the presence of Mg2+ may have a higher effect on the immobilisate. A concentration above 20 mmol·L−1 MgCl2 seems to have an inhibitory effect on epimerase. Soluble lyase was activated up to a MgCl2 concentration of 10 mmol·L−1 and inhibited at higher concentrations up to 50 mmol·L−1, whereas immobilised lyase was not affected (Figure 4B). Additionally, the influence of MgCl2 on the reaction equilibrium was analysed in a range of 0–10 mmol·L−1 for immobilised epimerase (Figure 5). The equilibrium could be increased from 18 to 22% ManNAc by addition of 1 mmol·L−1 MgCl2 and remains constant at 21% from 5 to 10 mmol·L−1 MgCl2. Kragl et al. have already described Mg2+ as an activator for epimerase [6]. Zimmermann et al. achieved an equilibrium constant of 24% at 25 °C and pH 7.5 with 2 mmol·L−1 MgCl2 [43], which is comparable with these results.
A concentration of 20 mmol·L−1 MgCl2 was chosen for the combined synthesis in a PBR. At this concentration, the epimerase was activated and the lyase activity was not affected. The highest activity for the epimerase was obtained at 5 mmol·L−1, but, as this cascade is a subsection of the multi-enzyme cascade for sialyllactose synthesis, a concentration was chosen that benefits the whole cascade.

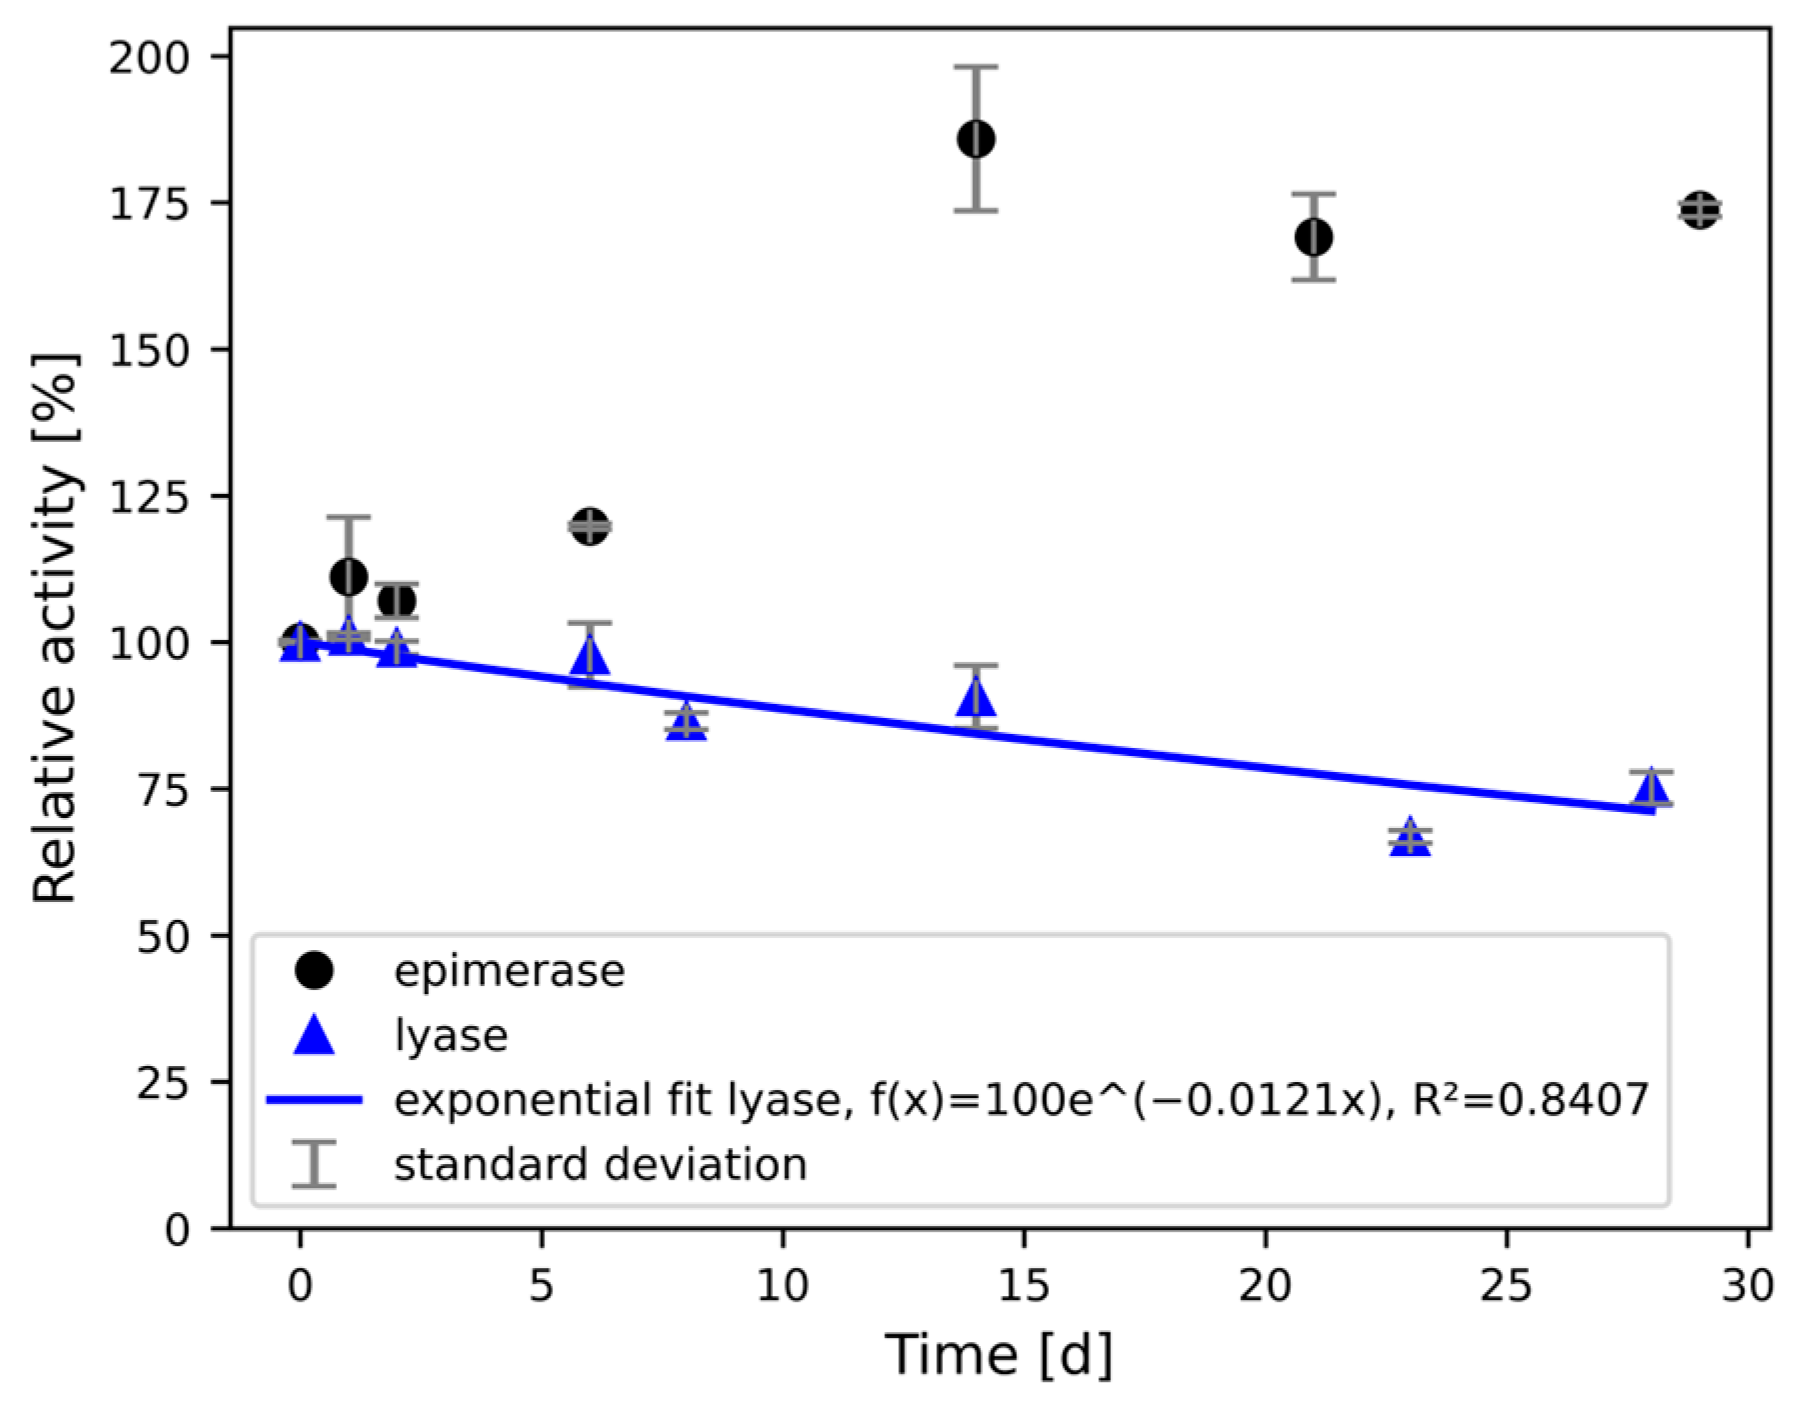
3.4. Stability of Immobilised Enzymes in Packed Bed Reactors Under Continuous Flow

The stability of immobilised enzymes plays an important role for their use in a continuously operated PBR. The reusability of the covalently immobilised epimerase and lyase is described in the literature and has already been verified in a series of repeated batches with the carriers ECR8204F (epimerase) and ECR8309F (lyase) [15]. However, due to flow conditions and temperature stresses, long-term use in PBR under continuous flow poses challenges for enzyme stability. The stability of the immobilised epimerase and lyase were determined under continuous flow in a PBR at 30 °C. An exponential fitting curve was applied to the measured activities to calculate the half-life time (Figure 6). Unexpectedly, an increased activity could be analysed for immobilised epimerase over a period of 28 days. Adsorbed, inactive enzymes or buffer residues may have been flushed out of the PBR over time, making the pores and active site of the enzyme more accessible. It is not possible to calculate a half-life time for immobilised epimerase due to the activity increase, but it can be given as >28 days. A half-life of 57 days was determined for the immobilised lyase. The high stability of the covalently immobilised enzymes demonstrates their suitability for use in a PBR. The stability of the immobilised enzymes can be incorporated into the kinetic model to estimate the PBRs lifetime.
The immobilisates were examined under a microscope (Carl Zeiss Microscopy GmbH, Göttingen, Germany, Stemi 305) after the stability study. There was no change in size or shape visible (Figure S5).

3.5. Kinetics

The kinetic parameters vmax,app, Km,app and KI,app were determined in the PBR by varying the substrate concentrations. The parameters are given as apparent (app) values, as they do not correspond to the real values, but are modified by the limitation of the material transport in the PBR. An adsorption study was carried out to ensure that the substrates, intermediates and products do not adsorb on the carrier material and thus falsify the results. No relevant adsorption on the carrier material could be determined in this study (Table S1).
The catalytic activity for epimerase has been described as a deprotonation/reprotonation mechanism with an activity for GlcNAc and ManNAc [40]. For immobilised epimerase (carrier HA403/M, glutaraldehyde preactivated hexamethylamino methacrylate), the forward and reverse reaction were analysed (Table 5, Figures S6 and S7). All kinetic analyses showed a typical Michaelis–Menten substrate saturation curve. The Km,app value of the forward reaction of 266 ± 10 mmol·L−1 is slightly higher than the Km,app of Reich et al. of 195 ± 26 mmol·L−1, which was also analysed with immobilised enzymes (carrier ECR8204F, epoxy methacrylate) [15], while the vmax,app of 234 ± 3 U·gcarrier−1 is lower than the vmax,app of 1324 ± 77 U·gcarrier−1 reported by Reich et al. The different type of enzyme binding to the carrier (via aldehyde (HA403/M) or epoxy group (ECR8204F)) and the different particle diameter (200–500 µm (HA403/M) and 150–300 µm (ECR8204F)) may influence the Km,app and vmax,app. A comparison of the activity for different particle diameters is given in Section 3.2. A better orientation of the active site could be achieved by the binding to the epoxy group via amino, thiol, carboxyl and phenol groups of the epimerase, instead of only amino groups with the aldehyde groups of the preactivated amino methacrylate [26], and could result in higher activities. The higher temperature (40 °C (Reich et al.) and 30 °C (this work)) and the different buffer (100 mmol∙L−1 sodium phosphate buffer (Reich et al.) and 200 mmol∙L−1 Tris buffer (this work)) could also influence the activity and kinetics. The Km,app of the immobilised epimerase is higher compared to the Km of the soluble epimerase of 82 mmol·L−1 reported by Wang et al. [40]. This may be due to diffusion limitations. Undirected immobilisation, as used in this study, may also result in a less-accessible active site. The Km,app for the reverse reaction of 294 ± 45 mmol·L−1 is comparable to the forward reaction with 266 ± 10 mmol·L−1. This can be explained by the structural similarity of the substrates GlcNAc (forward) and ManNAc (reverse). The vmax,app of 797 ± 46 U·gcarrier−1 for the reverse reaction is higher than the vmax,app of 234 ± 3 U·gcarrier−1 for the forward reaction, which can be explained by the equilibrium position on the GlcNAc site, with only 22% ManNAc being formed (Section 3.3.2.).
The catalytic activity of lyase has been described as a Schiff base intermediate formation with a lysine residue as ordered bi uni mechanism with pyruvate binding first [44,45,46,47]. For immobilised lyase (carrier ECR8309M, glutaraldehyde preactivated dimethylamino methacrylate), the forward and reverse reaction were analysed (Table 5, Figures S8–S11). A typical Michaelis–Menten substrate saturation curve was observed in all kinetic analyses. For the forward reaction, a Km,app,ManNac of 249 ± 64 mmol·L−1 and Km,app,pyruvate of 229 ± 11 mmol·L−1 were determined. Reich et al. reported a comparable Km,app,ManNAc of 230 ± 110 mmol·L−1 for immobilised lyase (ECR8309F, glutaraldehyde preactivated dimethylamino methacrylate) with a smaller particle diameter but a lower Km,pyruvate of 91 ± 45 mmol·L−1 [15]. The kinetic parameters for immobilised lyase described by Reich et al. have an error of approx. 50% standard deviation, which could explain these differences. However, for soluble lyase, a Km,ManNAc of 180 mmol·L−1 was analysed by Li et al. [41], which is comparable to the kinetics of immobilised lyase reported in this study. The Km,pyruvate for soluble lyase of 22 mmol·L−1 would be more in line with the data from Reich et al. The vmax,app of 294 ± 22 U·gcarrier−1 for the forward reaction is lower than the vmax,app of 650 ± 150 U·gcarrier−1 reported by Reich et al. [15]. However, the activity of the immobilised enzyme can vary with batches of immobilisate due to many different factors during the process from enzyme expression to immobilisation. The Km,app,Neu5Ac for the reverse reaction of 205 ± 19 mmol·L−1 is lower than the Km,Neu5Ac of 650 ± 300 mmol·L−1 described by Reich et al. [15].
Combining two or more enzymes in a cascade can result in one enzyme becoming inhibited by the substrates, intermediates or products of the other. These inhibitions were identified in an inhibition screening carried out as batch experiments. An epimerase inhibition was detected by pyruvate and a lyase inhibition by GlcNAc. An inhibition of epimerase by Neu5Ac was not detected (Table S2). Klermund et al. described an inhibition of GlcNAc 2-epimerase from Anabaena variabilis ATCC 29413 by Neu5Ac and pyruvate [30]. The fact that we were unable to demonstrate inhibition by Neu5Ac may be due to sequence deviations of the enzyme and to immobilisation, as immobilisation might reduce inhibitions [17].
The inhibition constants were determined in a PBR (Table 5, Figures S12 and S13). Epimerase inhibition by pyruvate has already been described by Klermund et al. as competitive inhibition [30]. The KI,app of 940 ± 107 mmol∙L−1 is higher than the KI,app reported by Reich et al. of 108 ± 21 mmol∙L−1 [15]. The KI,app by Reich et al. was analysed in a range of 0–500 mmol∙L−1 pyruvate. In this study, we analysed the range of 0–1297 mmol∙L−1 pyruvate, which could affect the KI,app. Competitive inhibition was assumed for lyase inhibition by GlcNAc due to the structural similarity to the substrate ManNAc, and a KI,app of 418 ± 40 U∙gcarrier−1 was determined.
The calculated kinetic parameters were used in the kinetic model.

3.6. Modelling of Progress Curves

To model the progress curves in the PBR, the Michaelis–Menten kinetics of the immobilised epimerase and lyase were combined with fluid mechanic approaches. Residence time plays an important role and was determined for different PBRs. By applying the model to different reactor configurations, flow rates, substrate concentrations and masses of immobilised enzymes, it will be tested whether the developed model can reproduce real conditions.

3.6.1. Residence Time and Reactor Volume Determination

The residence time in the PBR and the reactor volume are required to model the progress curves (Equation (11)). The porosity of the carriers and the fluid surrounding the particles in the reactor are required to calculate the residence time and the reactor volume. Both porosity and surrounding fluid volume are difficult to measure. Attempts to dry the immobilisate after vacuum filtration and to calculate the fluid volume remaining in the pores by mass balance did not give reproducible results for porosity. Attempts to determine the fluid volume surrounding the particles by weighing of the filled reactor were also not purposeful. By determining the residence time using pulse or mass flux experiments, the reactor volume could also be determined successfully. The residence time distribution of the system and the PBR integrated into the system were analysed (Figure S14). The residence times ( t ¯ ) were examined for the applied reactors at different flow rates and a factor ( f V , P B R ) for the calculation of the PBR fluid volume ( V P B R ), according to Equation (15), was determined (Table 6). These PBR specific parameters are used for the modelling of progress curves in the model validation experiments for the different PBRs. The factor f V , P B R might be influenced by several factors, such as the reactor dimension, the carrier used for immobilisation or the packing method. By comparing PBR 5 (3 mm ID) and PBR 8 (4.6 mm ID) at 1.5 mL∙min−1 filled with the same immobilisate, a slight decrease in f V , P B R from 0.77 (3 mm ID) to 0.69 (4.6 mm ID) was detectable. In small ID reactors, the arrangement of the particles might be different from larger ID. Tighter packing and therefore a lower f V , P B R can be achieved by increasing the ID. By changing the PBR length from 30 mm (PBR 1) to 100 mm (PBR 4), the f V , P B R decreased from 0.82 to 0.71 at 1.5 mL∙min−1 filled with the same immobilisate. The same behaviour is shown by PBR 10 (50 mm length) with 0.79 to PBR 9 (150 mm length) with 0.61 at 1.5 mL∙min−1 filled with the same immobilisate. When filling long columns, air entrapment is more likely to occur, especially at low ID, which may explain this decrease. When only the carrier material was changed, the f V , P B R changed from 0.82 (PBR 1, HA403/M) to 0.77 (PBR 5, ECR8309M). This can be explained by the different particle size distributions. The lower particle size of 200–500 µm (PBR 1) resulted in tighter packing than the particle size of 300–710 µm (PBR 5). Differences also occurred by changing the flow rate for the same PBR. For PBR 4, the f V , P B R was 0.71 at 1.5 mL∙min−1 and 0.62 at 0.5 mL∙min−1; for PBR 8, the f V , P B R was 0.69 at 1.5 mL∙min−1 and 0.81 for 0.5 mL∙min−1. Also, for PBR 9 and 10, the f V , P B R varied by changing the flow rate, although the volume of liquid in the reactor did not change. These deviations can be explained by the increased back-mixing at low flow rates, which has a particular effect when measuring the empty column and influences of the f V , P B R . It might be useful to determine f V , P B R at higher flow rates. In addition, the quality of the reactor packing can affect the f V , P B R . A reproducible procedure for filling the reactor is therefore essential. More data are needed to verify the packing procedure. It may be possible not to determine the residence time for each reactor, but to use an average value of f V , P B R for all reactors containing the same immobilisate if the PBR packing is reproducible.

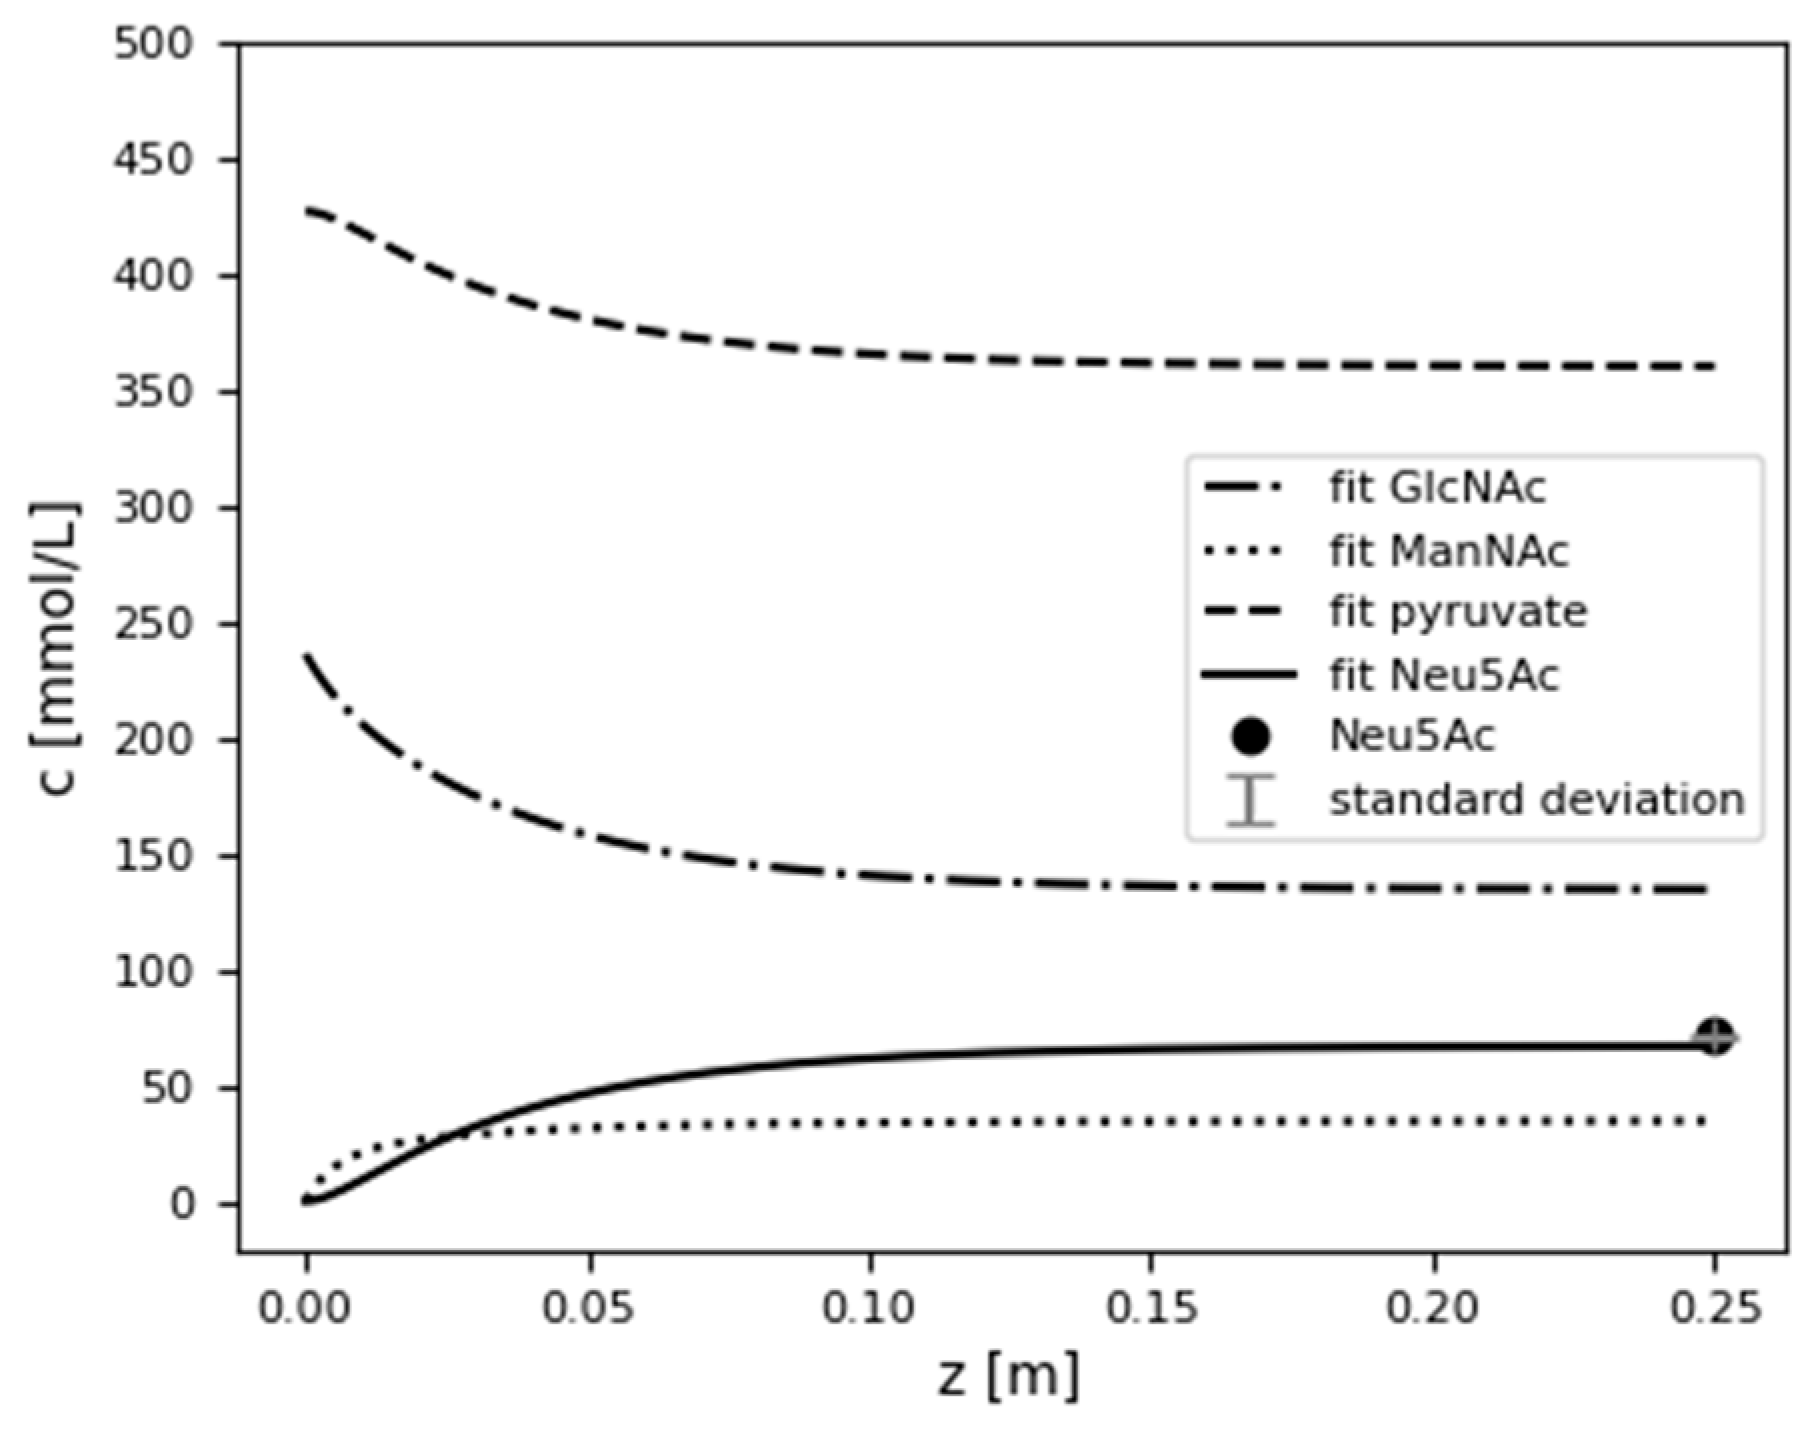
3.6.2. Model Validation

To validate the kinetic model, the immobilised enzymes in the PBR were first modelled and validated individually and then as a coupled reaction using a mixed bed. Three experiments were performed to validate the epimerase model (Table 7). The substrate was the same for the three experiments with a GlcNAc concentration of 100 mmol∙L−1. Experiment 1 was in the range of the initial rate. The measured ManNAc concentration of 1.07 mmol∙L−1 and the model-predicted ManNAc concentration of 1.05 mmol∙L−1 are within 2% of each other. By varying the reactor length and the mass of immobilised enzyme (experiment 2), the measured value of 12.96 mmol∙L−1 can be predicted with 5% deviation. Even if the flow rate is reduced (experiment 3), the model can predict the measured value of 19.48 mmol∙L−1 with only 6% deviation. The model-predicted maximum equilibrium was nearly reached at experiment 3 (Figure S15). As an example, the concentration curve over the length of the PBR for the result of experiment 3 is shown in Figure 7A. The measured data and the model fit the equilibrium constant of 22% ManNAc formation, as described in Section 3.3.2. The 22% ManNAc formation was analysed in batch experiments at 40 °C. The use in continuous flow and the reduced temperature of 30 °C may explain the slightly reduced ManNAc formation of 19% (measured) and 21% (predicted by the model). The epimerase model is therefore applicable; even if the reactor dimensions, the mass of immobilised enzyme or the flow rate vary, it is giving the correct results.
For lyase model validation, three experiments were performed with varied reactor sizes, immobilisate masses and flow rates (Table 8). The substrate concentration stayed the same for these experiments, with 100 mmol∙L−1 ManNAc and 250 mmol∙L−1 pyruvate. Experiment 4, with 4.90 mmol∙L−1 measured Neu5Ac concentration, with a model prediction accuracy of 7%, is in the range of initial rate measurement. With a varied reactor size and mass of immobilised lyase, the Neu5Ac concentration of 32.52 mmol∙L−1 can be predicted with an accuracy of 9% (experiment 5). Reducing the flow rate still predicts the Neu5Ac concentration of 45.63 mmol∙L−1 with 6% accuracy (experiment 6). The model-predicted maximum equilibrium was reached at experiment 6 (Figure S16). Figure 7B shows as an example the concentration curve over the length of the PBR for the results of experiment 6. A maximum ManNAc conversion of 45.6% was achieved (experiment 6). Bloemendal et al. achieved 19% conversion with 100 mmol∙L−1 ManNAc and 300 mmol∙L−1 pyruvate using immobilised enzymes in a continuous flow system, but >80% with a 5-fold ManNAc excess [13]. The developed model can also predict higher conversions with high excess of ManNAc or pyruvate, e.g., 60% at 10-fold pyruvate excess, and may be useful for optimising substrate concentrations regarding cost minimisation. The lyase model is therefore applicable even if the dimensions of the reactor, the mass of the immobilised enzyme or the flow rate are varied.
For validation of the coupled reaction using a mixed bed, three experiments were performed with different reactor size, immobilisate mass, substrate concentration and flow rate (Table 9). In experiments 7 and 8, two different reactors were used in series. At a flow rate of 1.5 mL∙min−1, the Neu5Ac concentration of 8.43 mmol∙L−1 can be predicted by the model, with a deviation of 13% (experiment 7). For 0.5 mL∙min−1 the deviation is higher, at 24% (experiment 8). The increased deviations can be explained by a summation of errors from the epimerase and lyase models, but the progress curves can still be predicted with high precision. The model-predicted maximum equilibrium was not reached at experiment 7 and 8 (Figure S17). To achieve the maximum equilibrium experimentally, a larger column was filled with immobilisate (experiment 9). The Neu5Ac concentration of 71.47 mmol∙L−1 was predicted by the model, with only 6% deviation. Exemplary concentration curves over the length of the PBR for experiment 9 are shown in Figure 8. For the coupled reaction, a maximum GlcNAc conversion of 32% was achieved with a substrate concentration of 236 mmol∙L−1 GlcNAc and a 1.9-fold pyruvate concentration. Cheng et al. achieved 82% GlcNAc conversion with a substrate concentration of 400 mmol∙L−1 GlcNAc and 2-fold pyruvate concentration in total, added via a two-step feeding strategy, in a 50 mL fed-batch reactor at 37 °C using enzymes immobilised on glutaraldehyde cross-linked amino methacrylate [12]. The different flow conditions in a stirred tank compared to the PBR may have an influence on conversion.
There are many factors that can cause deviations from the model when performing the experiments. When weighing the immobilisate in the PBR, there may be variations due to residual moisture after vacuum filtration. Deviations in the activity of the immobilised enzymes or unexpected deactivation can also have an effect. Different flow rates may also have an influence on the activity of the enzyme, but this could not be observed in this study. Reich et al. described an increase in conversion at pressures up to 130 MPa [15]. This is not relevant to this study, as the pressure in these experiments is below 2.5 MPa. Diffusion limitations can influence the kinetic behaviour when immobilised enzymes are used in a PBR, resulting in apparent kinetic parameters. Nevertheless, a model could be developed using Michaelis–Menten kinetics and analysed residence times.
However, the model can predict the coupled reaction with a deviation of <24% and is useful for process optimisation. In further studies, this model will be combined with a cost calculation to develop cost-effective process strategies in regard to substrate composition and reactor dimension. The reaction cascade shown here represents a part of the multi-enzyme cascade for sialyllactose synthesis. The cascade will be extended in further studies.

4. Conclusions

The integration of continuous flow technologies in biotechnical applications can lead to more efficient and sustainable processes [19]. Developing a resilient biocatalyst and designing a suitable reactor are both present challenges [48]. Modelling of the reaction system can be a useful tool in the optimisation of reactor dimensions. Immobilisation can intensify the process by stabilising the enzymes for the development of robust biocatalysts [48]. In this study, a covalent immobilisation technique was used. Immobilisation shows a difference in the behaviour of the epimerase and lyase. Depending on the presumed size of the enzyme, the smaller lyase (34.4 kDa) shows higher carrier-specific activities when immobilised to larger particles, whereas the epimerase (48.8 kDa) activity decreases. Possible clogging of the pores and reduced accessibility of the epimerase within the pores could explain the lower epimerase activities. In particular, stability studies under continuous flow show an unexpected increase in the activity of the epimerase during the process time, which could also be explained by the unblocking of the blocked pores and the increase in the diffusion permeability insight of the pores. Both immobilisates exhibit high stability in continuous flow applications under process conditions with half-life times of >28 days. For both enzymes, pH 8 can be used in a cascade reaction, as the activity of the epimerase decreases at higher pH values and the activity of the lyase decreases at pH values below 8. Conducting the reaction at pH 8 is a good compromise for both enzymes.
With the data of the kinetic analysis and the residence time determination, a model was developed using Python to predict the reaction processes with a high degree of accuracy. With varying amounts of immobilisate, column dimensions or flow rates, the model shows high accuracy, with less than 10% deviation of the model data from the measured data. However, for a reaction with multiple columns in series, the processes may be less accurately presented. Further model refinement is required to account to these deviating factors.

Supplementary Materials

The following supporting information can be downloaded at: https://www.mdpi.com/article/10.3390/pr12102191/s1, Scheme S1: ManDH-catalysed conversion of ManNAc and NAD to N-acetyl-D-glucosaminic acid and NADH for ManNAc quantification, Figure S1: HPLC chromatogram of sample measurement from the lyase activity assay, Figure S2: Python script for modelling of progress curves, Figure S3: SDS-PAGE of epimerase, Figure S4: SDS-PAGE of lyase, Figure S5: Immobilised epimerase microscope pictures, Figure S6: Variation of GlcNAc concentration for kinetic characterisation of immobilised epimerase in a PBR, Figure S7: Variation of ManNAc concentration for kinetic characterisation of immobilised epimerase in a PBR, Figure S8: Variation of ManNAc concentration for kinetic characterisation of immobilised lyase in a PBR, Figure S9: Variation of pyruvate concentration for kinetic characterisation of immobilised lyase in a PBR, Figure S10: 3D visualisation of ManNAc and pyruvate variation for kinetic characterisation of immobilised lyase in a PBR, Figure S11: Variation of Neu5Ac concentration for kinetic characterisation of immobilised lyase in a PBR, Figure S12: Variation of pyruvate concentration as an inhibitor of epimerase for kinetic characterisation of immobilised epimerase in a PBR, Figure S13: Variation of GlcNAc concentration as an inhibitor for lyase for kinetic characterisation of immobilised lyase in a PBR, Figure S14: Residence time distribution of the system and the PBR integrated into the system exemplary for PBR 1, Figure S15: Model predicted ManNAc concentration plotted against residence time for immobilised epimerase in a PBR, Figure S16: Model predicted Neu5Ac concentration plotted against residence time for immobilised lyase in a PBR, Figure S17: Model predicted Neu5Ac concentration plotted against residence time for a mixed bed of immobilised epimerase and lyase in a PBR, Table S1: Substrate adsorption on the carrier, Table S2: Inhibition screening for immobilised epimerase and lyase in a batch experiment.

Author Contributions

Conceptualization, K.H.; methodology, K.H. and M.A.; investigation, K.H. and M.A.; resources, J.K.; writing—original draft preparation, K.H.; writing—review and editing, M.A., P.B. and A.L.; visualization, K.H.; supervision, M.A., P.B., A.L. and J.K.; project administration, M.A. and J.K.; funding acquisition, A.L. and J.K. All authors have read and agreed to the published version of the manuscript.

Funding

This research was funded by the Bundesministerium für Bildung und Forschung (BMBF), grant number 031B1080C and 031B1370.

Data Availability Statement

The original contributions presented in the study are included in the article/Supplementary Material. Further inquiries can be directed to the corresponding author/s.

Acknowledgments

The Graz University of Technology, Institute of Biotechnology and Biochemical Engineering, kindly provided the plasmid pET-28a(+)_fsmandh for expression of ManDH from Flavobacterium sp. 141-8. We would like to thank the entire GALAB Biotechnology team for their laboratory support and valuable contributions and the Institute of Technical Biocatalysis at Hamburg University of Technology for their scientific input. Special thanks to Freya Körtje for discussion and input.

Conflicts of Interest

The authors Kristin Hölting, Miriam Aßmann and Jürgen Kuballa were employed by the company GALAB Laboratories GmbH. The authors declare that this study received funding from BMBF. The funder was not involved in the study design, collection, analysis, interpretation of data, the writing of this article or the decision to submit it for publication.

References

  1. Böhm, P.; Dauber, S.; Baumeister, L. Über Neuraminsäure, Ihr Vorkommen Und Ihre Bestimmung Im Serum. Klin. Wochenschr. 1954, 32, 289–292. [Google Scholar] [CrossRef] [PubMed]
  2. Li, Y.; Chen, X. Sialic Acid Metabolism and Sialyltransferases: Natural Functions and Applications. Appl. Microbiol. Biotechnol. 2012, 94, 887–905. [Google Scholar] [CrossRef]
  3. Wang, B.; Brand-Miller, J. The Role and Potential of Sialic Acid in Human Nutrition. Eur. J. Clin. Nutr. 2003, 57, 1351–1369. [Google Scholar] [CrossRef] [PubMed]
  4. Vimr, E.R.; Kalivoda, K.A.; Deszo, E.L.; Steenbergen, S.M. Diversity of Microbial Sialic Acid Metabolism. Microbiol. Mol. Biol. Rev. 2004, 68, 132–153. [Google Scholar] [CrossRef] [PubMed]
  5. Zhao, M.; Zhu, Y.; Wang, H.; Zhang, W.; Mu, W. Recent Advances on N-Acetylneuraminic Acid: Physiological Roles, Applications, and Biosynthesis. Synth. Syst. Biotechnol. 2023, 8, 2405–2805. [Google Scholar] [CrossRef] [PubMed]
  6. Kragl, U.; Gygax, D.; Ghisalba, O.; Wandrey, C. Enzymatic Two-Step Synthesis of N-Acetylneuraminic Acid in the Enzyme Membrane Reactor. Angew. Chem. Int. 1991, 30, 827–828. [Google Scholar] [CrossRef]
  7. Spivak, C.T.; Roseman, S. Preparation of N-Acetyl-D-Mannosamine (2-Acetamido-2-Deoxy-D-Mannose) and D-Mannosamine Hydrochloride (2-Amino-Deoxy-D-Mannose). J. Am. Chem. Soc. 1959, 81, 2403–2404. [Google Scholar] [CrossRef]
  8. Ferrero, M.Á.; Aparicio, L.R. Biosynthesis and Production of Polysialic Acids in Bacteria. Appl. Microbiol. Biotechnol. 2010, 86, 1621–1635. [Google Scholar] [CrossRef]
  9. Maru, I.; Ohnishi, J.; Ohta, Y.; Tsukada, Y. Simple and Large-Scale Production of N-Acetylneuraminic Acid from N-Acetyl-D-Glucosamine and Pyruvate Using N-Acyl-D-Glucosamine 2-Epimerase and N-Acetylneuraminate Lyase. Carbohydr. Res. 1998, 306, 575–578. [Google Scholar] [CrossRef]
  10. Mahmoudian, M.; Noble, D.; Drake, C.S.; Middleton, R.F.; Montgomery, D.S.; Piercey, J.E.; Ramlakhan, D.; Todd, M.; Dawson, M.J. An Efficient Process for Production of N-Acetylneuraminic Acid Using N-Acetylneuraminic Acid Aldolase. Enzyme Microb. Technol. 1997, 20, 393–400. [Google Scholar] [CrossRef]
  11. Hu, S.; Chen, J.; Yang, Z.; Shao, L.; Bai, H.; Luo, J.; Jiang, W.; Yang, Y. Coupled Bioconversion for Preparation of N-Acetyl-D-Neuraminic Acid Using Immobilized N-Acetyl-D-Glucosamine-2-Epimerase and N-Acetyl-D-Neuraminic Acid Lyase. Appl. Microbiol. Biotechnol. 2010, 85, 1383–1391. [Google Scholar] [CrossRef] [PubMed]
  12. Cheng, J.; Zhuang, W.; Tang, C.; Chen, Y.; Wu, J.; Guo, T.; Ying, H. Efficient Immobilization of AGE and NAL Enzymes onto Functional Amino Resin as Recyclable and High-Performance Biocatalyst. Bioprocess. Biosyst. Eng. 2017, 40, 331–340. [Google Scholar] [CrossRef] [PubMed]
  13. Bloemendal, V.R.L.J.; Moons, S.J.; Heming, J.J.A.; Chayoua, M.; Niesink, O.; van Hest, J.C.M.; Boltje, T.J.; Rutjes, F.P.J.T. Chemoenzymatic Synthesis of Sialic Acid Derivatives Using Immobilized N-Acetylneuraminate Lyase in a Continuous Flow Reactor. Adv. Synth. Catal. 2019, 361, 2443–2447. [Google Scholar] [CrossRef] [PubMed]
  14. Obst, F.; Mertz, M.; Mehner, P.J.; Beck, A.; Castiglione, K.; Richter, A.; Voit, B.; Appelhans, D. Enzymatic Synthesis of Sialic Acids in Microfluidics to Overcome Cross-Inhibitions and Substrate Supply Limitations. ACS Appl. Mater. Interfaces 2021, 13, 49433–49444. [Google Scholar] [CrossRef] [PubMed]
  15. Reich, J.A.; Aßmann, M.; Hölting, K.; Bubenheim, P.; Kuballa, J.; Liese, A. Shift of Reaction Equilibrium at High Pressure in the Continuous Synthesis of Neuraminic Acid. Beilstein 2022, 18, 567–579. [Google Scholar] [CrossRef] [PubMed]
  16. Federsel, H.J.; Moody, T.S.; Taylor, S.J.C. Recent Trends in Enzyme Immobilization—Concepts for Expanding the Biocatalysis Toolbox. Molecules 2021, 26, 2822. [Google Scholar] [CrossRef] [PubMed]
  17. Bolivar, J.M.; Woodley, J.M.; Fernandez-Lafuente, R. Is Enzyme Immobilization a Mature Discipline? Some Critical Considerations to Capitalize on the Benefits of Immobilization. Chem. Soc. Rev. 2022, 51, 6251–6290. [Google Scholar] [CrossRef]
  18. Sheldon, R.A.; van Pelt, S. Enzyme Immobilisation in Biocatalysis: Why, What and How. Chem. Soc. Rev. 2013, 42, 6223–6235. [Google Scholar] [CrossRef]
  19. De Santis, P.; Meyer, L.-E.; Kara, S. The Rise of Continuous Flow Biocatalysis—Fundamentals, Very Recent Developments and Future Perspectives. React. Chem. Eng. 2020, 5, 2155–2184. [Google Scholar] [CrossRef]
  20. Sheldon, R.A.; Woodley, J.M. Role of Biocatalysis in Sustainable Chemistry. Chem. Rev. 2018, 118, 801–838. [Google Scholar] [CrossRef]
  21. Horiuchi, T.; Kurokawa, T. Purification from and Properties of N-Acyl-D-Mannosamine Dehydrogenase Flavobacterium Sp. 141-8. J. Biochem. 1988, 104, 466–471. [Google Scholar] [CrossRef] [PubMed]
  22. Lilley, G.G.; Itzstein, M.; von Ivancic, N. High-Level Production and Purification of Escherichia Coli N-Acetylneuraminic Acid Aldolase (EC 4.1.3.3). Protein. Expr. Purif. 1992, 3, 434–440. [Google Scholar] [CrossRef] [PubMed]
  23. Gill, S.C.; von Hippel, P.H. Calculation of Protein Extinction Coefficients from Amino Acid Sequence Data. Anal. Biochem. 1989, 182, 319–326. [Google Scholar] [CrossRef] [PubMed]
  24. Swiss Institute of Bioinformatics Expasy ProtParam Tool. Available online: https://web.expasy.org/protparam/ (accessed on 9 August 2024).
  25. Purolite Life Sciences Enzyme Immobilization Resins. 2021. Available online: https://sharevent.ams3.digitaloceanspaces.com/production/files/563/exhibitor/6449/6449_3fd71c29bd.pdf (accessed on 23 September 2024).
  26. Rodrigues, R.C.; Berenguer-Murcia, Á.; Carballares, D.; Morellon-Sterling, R.; Fernandez-Lafuente, R. Stabilization of Enzymes via Immobilization: Multipoint Covalent Attachment and Other Stabilization Strategies. Biotechnol. Adv. 2021, 52, 107821. [Google Scholar] [CrossRef]
  27. Hölting, K.; Götz, S.; Aßmann, M.; Bubenheim, P.; Liese, A.; Kuballa, J. Resilient Enzymes through Immobilisation: Stable NDP Polyphosphate Phosphotransferase from Ruegeria Pomeroyi for Nucleotide Regeneration. Catalysts 2024, 14, 165. [Google Scholar] [CrossRef]
  28. Syldatk, C.; Jaeger, K.-E.; Liese, A. Einführung in Die Enzymtechnologie; Springer Spektrum: Berlin, Germany, 2018; ISBN 978-3-662-57618-2. [Google Scholar]
  29. Resindion, S.r.l. ReliZymeTM and SEPABEADSTM EC Enzyme Carriers. 2015. Available online: https://resindion.com/resindion/download/RESINDION_ReliZymeSepabeadsEC_PGD_050612.pdf (accessed on 23 September 2024).
  30. Klermund, L.; Riederer, A.; Hunger, A.; Castiglione, K. Protein Engineering of a Bacterial N-Acyl-D-Glucosamine 2-Epimerase for Improved Stability under Process Conditions. Enzyme Microb. Technol. 2016, 87, 70–78. [Google Scholar] [CrossRef] [PubMed]
  31. Horecker, B.L.; Kornber, A. The Extinction Coefficients of the Reduced Band of Pyridine Nucleotides. J. Biol. Chem. 1948, 175, 385–390. [Google Scholar] [CrossRef] [PubMed]
  32. Liese, A.; Hilterhaus, L. Evaluation of Immobilized Enzymes for Industrial Applications. Chem. Soc. Rev. 2013, 42, 6236–6249. [Google Scholar] [CrossRef]
  33. Chmiel, H.; Takors, R.; Weuster-Botz, D. Bioprozesstechnik, 4th ed.; Springer: Berlin/Heidelberg, Germany, 2018; ISBN 9783662540411. [Google Scholar]
  34. Müller-Erlwein, E. Chemische Reaktionstechnik; Springer Spektrum: Berlin/Heidelberg, Germany, 2015; Volume 3, ISBN 9783658093952. [Google Scholar]
  35. Aisaka, K.; Igarashi, A.; Yamaguchi, K.; Uwajima, T. Purification, Crystallization and Characterization of N-Acetylneuraminate Lyase from Escherichia coli. Biochem. J. 1991, 276, 541–546. [Google Scholar] [CrossRef]
  36. Bayne, L.; Ulijn, R.V.; Halling, P.J. Effect of Pore Size on the Performance of Immobilised Enzymes. Chem. Soc. Rev. 2013, 42, 9000–9010. [Google Scholar] [CrossRef]
  37. Santos, J.C.S.D.; Barbosa, O.; Ortiz, C.; Berenguer-Murcia, A.; Rodrigues, R.C.; Fernandez-Lafuente, R. Importance of the Support Properties for Immobilization or Purification of Enzymes. ChemCatChem 2015, 7, 2413–2432. [Google Scholar] [CrossRef]
  38. De Santis, P.; Petrovai, N.; Meyer, L.-E.; Hobisch, M.; Kara, S. A Holistic Carrier-Bound Immobilization Approach for Unspecific Peroxygenase. Front. Chem. 2022, 10, 985997. [Google Scholar] [CrossRef] [PubMed]
  39. Rădoi, I.I.; Bedolla, D.E.; Vaccari, L.; Todea, A.; Zappaterra, F.; Volkov, A.; Gardossi, L. FTIR Microscopy for Direct Observation of Conformational Changes on Immobilized ω-Transaminase: Effect of Water Activity and Organic Solvent on Biocatalyst Performance. Catal. Sci. Technol. 2023, 13, 4955–4967. [Google Scholar] [CrossRef]
  40. Wang, S.Y.; Laborda, P.; Lu, A.M.; Duan, X.C.; Ma, H.Y.; Liu, L.; Voglmeir, J. N-Acetylglucosamine 2-Epimerase from Pedobacter Heparinus: First Experimental Evidence of a Deprotonation/Reprotonation Mechanism. Catalysts 2016, 6, 212. [Google Scholar] [CrossRef]
  41. Li, Y.; Yu, H.; Cao, H.; Lau, K.; Muthana, S.; Tiwari, V.K.; Son, B.; Chen, X. Pasteurella Multocida Sialic Acid Aldolase: A Promising Biocatalyst. Appl. Microbiol. Biotechnol. 2008, 79, 963–970. [Google Scholar] [CrossRef] [PubMed]
  42. Maru, I.; Ohta, Y.; Murata, K.; Tsukada, Y. Molecular Cloning and Identification of N-Acyl-D-Glucosamine 2-Epimerase from Porcine Kidney as a Renin-Binding Protein. J. Biol. Chem. 1996, 271, 16294–16299. [Google Scholar] [CrossRef] [PubMed]
  43. Zimmermann, V.; Hennemann, H.G.; Daußmann, T.; Kragl, U. Modelling the Reaction Course of N-Acetylneuraminic Acid Synthesis from N-Acetyl-D-Glucosamine—New Strategies for the Optimisation of Neuraminic Acid Synthesis. Appl. Microbiol. Biotechnol. 2007, 76, 597–605. [Google Scholar] [CrossRef] [PubMed]
  44. Izard, T.; Lawrence, M.C.; Malby, R.L.; Lilley, G.G.; Colman, P.M. The Three-Dimensional Structure of N-Acetylneuraminate Lyase from Escherichia coli. Structure 1994, 2, 361–369. [Google Scholar] [CrossRef]
  45. Groher, A.; Hoelsch, K. Mechanistic Model for the Synthesis of N-Acetylneuraminic Acid Using N-Acetylneuraminate Lyase from Escherichia Coli K12. J. Mol. Catal. B Enzym. 2012, 83, 1–7. [Google Scholar] [CrossRef]
  46. Timms, N.; Windle, C.L.; Polyakova, A.; Ault, J.R.; Trinh, C.H.; Pearson, A.R.; Nelson, A.; Berry, A. Structural Insights into the Recovery of Aldolase Activity in N -Acetylneuraminic Acid Lyase by Replacement of the Catalytically Active Lysine with Γ-Thialysine by Using a Chemical Mutagenesis Strategy. ChemBioChem 2013, 14, 474–481. [Google Scholar] [CrossRef]
  47. Daniels, A.D.; Campeotto, I.; Van Der Kamp, M.W.; Bolt, A.H.; Trinh, C.H.; Phillips, S.E.V.; Pearson, A.R.; Nelson, A.; Mulholland, A.J.; Berry, A. Reaction Mechanism of N-Acetylneuraminic Acid Lyase Revealed by a Combination of Crystallography, QM/MM Simulation, and Mutagenesis. ACS Chem. Biol. 2014, 9, 1025–1032. [Google Scholar] [CrossRef] [PubMed]
  48. Bolivar, J.M.; López-Gallego, F. Characterization and Evaluation of Immobilized Enzymes for Applications in Flow Reactors. Curr. Opin. Green Sustain. Chem. 2020, 25, 100349. [Google Scholar] [CrossRef]
Scheme 1. Enzyme cascade for Neu5Ac synthesis (GlcNAc: N-acetylglucosamine, ManNAc: N-acetylmannosamine, Neu5Ac: N-acetylneuraminic acid).
Processes 12 02191 sch001
Figure 1. Experimental setup used for characterisation of immobilised enzymes in a PBR. B-1 and B-2: bottles with substrate; P-1 and P-2: UPLC pump (binary); A-1: mixing chamber; V-1: sample valve; B-3: sample vessel; A-2: capillary loop for substrate tempering; C-1: PBR; A-3: oven with electric heater; B-4: bottle with product; Q-1 bis Q-9: capillaries; M: electric motor; PIR: pressure indicator and recorder. The piping and instruments diagram was created in RI-CAD (HiTec Zang GmbH, Herzogenrath, Germany, version 2.2.0).
Processes 12 02191 g001
Figure 2. Influence of pH on the relative activity of epimerase and lyase. (A): pH variation epimerase, (B): pH variation lyase; reaction conditions activity assay epimerase: 2 mg·L−1 soluble epimerase or 10 g·L−1 immobilised epimerase (ECR8204M), T = 40 °C, 1000 rpm, 100 mmol·L−1 Tris, pH 7.0–9.0, 1 mmol·L−1 MgCl2, 1 mmol·L−1 ATP, 100 mmol·L−1 GlcNAc, V = 1 mL, reaction time: 10 min, ManAc was quantified by ManDH assay; reaction conditions activity assay lyase: 64 mg·L−1 soluble lyase or 50 g·L−1 immobilised lyase (ECR8309M), T = 40 °C, 1000 rpm, 100 mmol·L−1 Tris buffer, pH 7.0–9.0, 100 mmol·L−1 ManNAc, 250 mmol·L−1 pyruvate, V = 1 mL, reaction time: 10 min, Neu5Ac was quantified by HPLC. Error bars show standard deviations of two independent experiments. The maximum level of activity achieved has been defined as 100% relative activity).
Processes 12 02191 g002
Figure 3. Influence of ATP concentration on the activity of epimerase and lyase. (A): ATP variation of epimerase, (B): ATP variation of lyase; reaction conditions activity assay epimerase: 2 mg·L−1 soluble epimerase or 10 g·L−1 immobilised epimerase, T = 40 °C, 1000 rpm, 100 mmol·L−1 Tris buffer, pH 8.0, 1 mmol·L−1 MgCl2, 0–10 mmol·L−1 ATP, 100 mmol·L−1 GlcNAc, V = 1 mL, reaction time: 10 min, ManAc was quantified by ManDH assay; lyase: 64 mg·L−1 soluble lyase or 50 g·L−1 immobilised lyase, T = 40 °C, 1000 rpm, 100 mmol·L−1 Tris buffer, pH 8.0, 100 mmol·L−1 ManNAc, 250 mmol·L−1 pyruvate, V = 1 mL, 0–10 mmol·L−1 ATP, reaction time: 10 min, Neu5Ac was quantified by HPLC. Error bars show standard deviations of two independent experiments. The maximum level of activity achieved has been defined as 100% relative activity).
Processes 12 02191 g003
Figure 4. Influence of MgCl2 concentration on the activity of epimerase and lyase. (A): MgCl2 variation on epimerase, (B): MgCl2 variation on lyase; reaction conditions activity assay epimerase: 2 mg·L−1 soluble epimerase or 10 g·L−1 immobilised epimerase, T = 40 °C, 1000 rpm, 100 mmol·L−1 Tris buffer, pH 8.0, 0–50 mmol·L−1 MgCl2, 1 mmol·L−1 ATP, 100 mmol·L−1 GlcNAc, V = 1 mL, reaction time: 10 min, ManAc was quantified by ManDH assay; lyase: 64 mg·L−1 soluble lyase or 50 g·L−1 immobilised lyase, T = 40 °C, 1000 rpm, 100 mmol·L−1 Tris buffer, pH 8.0, 100 mmol·L−1 ManNAc, 250 mmol·L−1 pyruvate, 0–50 mmol·L−1 MgCl2, V = 1 mL, reaction time: 10 min, Neu5Ac was quantified by HPLC. Error bars show standard deviations of two independent experiments. The maximum level of activity achieved has been defined as 100% relative activity).
Processes 12 02191 g004
Figure 5. Influence of MgCl2 on the conversion of GlcNAc to ManNAc by immobilised epimerase (reaction conditions activity assay: 10 g·L−1 immobilised epimerase, T = 40 °C, 1000 rpm, 100 mmol·L−1 Tris buffer, pH 8.0, 0–10 mmol·L−1 MgCl2, 1 mmol·L−1 ATP, 100 mmol·L−1 GlcNAc, V = 1 mL, reaction time: 180 min. ManAc was quantified by ManDH assay. Error bars show standard deviations of two independent experiments. The conversion is defined as the equilibrium ManNAc concentration from the initial GlcNAc concentration).
Processes 12 02191 g005
Figure 6. Stability of immobilised epimerase and lyase in a PBR. Experimental conditions: PBR 3 & 7 with 30 mm length and 3 mm ID, V ˙ = 1.5 mL∙min−1, 200 mmol·L−1 Tris, pH 8.0, 20 mmol·L−1 MgCl2, T = 30 °C; conditions activity assay epimerase: 100 mmol·L−1 Tris, pH 8.0, 1 mmol·L−1 MgCl2, 1 mmol·L−1 ATP, 100 mmol·L−1 GlcNAc, V ˙   = 1.5 mL∙min−1, T = 30 °C, 25 mg immobilised epimerase (HA403/M); conditions activity assay lyase: 100 mmol−L−1 Tris, pH 8.0, 100 mmol·L−1 ManNAc, 250 mmol·L−1 pyruvate, V ˙ = 1.5 mL∙min-1, T = 30 °C, 205 mg immobilised lyase (ECR8309M). Error bars show standard deviations of two independent samples. The activity at the start of the study was defined as 100% relative activity.
Processes 12 02191 g006
Figure 7. Concentration over the length of the PBR for model validation of epimerase and lyase (A): epimerase validation, (B): lyase validation; reaction conditions for A: PBR 4 with 100 mm length (z) and 3 mm ID, 478 mg immobilised epimerase (HA403/M), V ˙ = 0.5 mL∙min−1, T = 30 °C, 200 mmol∙L−1 Tris, pH 8.0, 20 mmol∙L−1 MgCl2, 100 mmol∙L−1 GlcNAc, 1 mmol∙L−1 ATP, ManNAc was quantified by ManDH assay; reaction conditions for B: PBR 8 with 150 mm length (z) and 4.6 mm ID, 2000 mg immobilised lyase (ECR8309M), V ˙ = 0.5 mL∙min−1, T = 30 °C, 200 mmol∙L−1 Tris, pH 8.0, 20 mmol∙L−1 MgCl2, 100 mmol∙L−1 ManNAc, 250 mmol∙L−1 pyruvate, Neu5Ac was quantified by HPLC).
Processes 12 02191 g007
Figure 8. Concentration over the length of the PBR for model validation of the coupled reaction with epimerase and lyase (reaction conditions: PBR 11 with 250 mm length (z) and 21 mm ID, 38 g immobilised epimerase (ECR8204M), 38 g immobilised lyase (ECR8309M), V ˙ = 1.5 mL∙min−1, T = 30 °C, 200 mmol∙L−1 Tris, pH 8.0, 1 mmol∙L−1 MgCl2, 236 mmol∙L−1 GlcNAc, 427 mmol∙L−1 pyruvate, 1 mmol∙L−1 ATP, Neu5Ac was quantified by HPLC).
Processes 12 02191 g008
Table 1. Carriers used for immobilisation.
Carrier/Order NumberImmobilisation TypePore Diameter */nmParticle Diameter */µm
Epoxy methacrylate/ECR8204F (Purolite Ltd.)covalent30–60150–300
Epoxy methacrylate/ECR8204M (Purolite Ltd.)30–60300–710
Dimethylamino methacrylate/ECR8309F (Purolite Ltd.)covalent via pre-activation with glutaraldehyde60–120150–300
Dimethylamino methacrylate/ECR8309M (Purolite Ltd.)60–120300–710
Hexamethylamino methacrylate/HA403/M (Resindion S.r.l.)40–60200–500
Dimethylamino methacrylate/EA403/M (Resindion S.r.l.)40–60200–500
* Information provided by carrier manufacturers [25,29].
Table 2. PBRs used in this study.
PBR NumberID/cmLength/
cm
V */mLPacked BedPacked Bed Mass/mgApplication
10.330.2immobilised epimerase (HA403/M) blocked carrier (HA403/M)25
176
Kinetic epimerase forward
20.330.2immobilised epimerase (HA403/M)
blocked carrier (HA403/M)
119
81
Kinetic epimerase reverse
30.330.2immobilised epimerase (HA403/M)
blocked carrier (HA403/M)
25
110
Stability study epimerase
40.3100.7immobilised epimerase (HA403/M)478Validation epimerase model
50.330.2immobilised lyase (ECR8309M)188Kinetic lyase forward
60.330.2immobilised lyase (ECR8309M)
blocked carrier (ECR8309M)
20
110
Kinetic lyase reverse
70.330.2immobilised lyase (ECR8309M)205Stability study lyase
80.46152.5immobilised lyase (ECR8309M)1969Validation lyase model
90.46152.5immobilised epimerase (HA403/M)
immobilised lyase (ECR8309M)
1016
1694
Validation combined model
100.4650.8immobilised epimerase (HA403/M)
immobilised lyase (ECR8309M)
196
326
Validation combined model
112.12584.6immobilised epimerase (ECR8204M)
immobilised lyase (ECR8309M)
38,337
38,340
Validation combined model
* V defined the volume of the unfilled reactor.
Table 3. Characteristic parameters for the immobilisation of epimerase with different carriers.
Characteristic VariableECR8204F 1ECR8204M 1HA403/M 2EA403/M 3
Immobilisation efficiency/%8.41.00.40.3
Activity yield/%3.10.60.40.3
Carrier loading/mgenzyme·gcarrier−131.633.344.042.5
Carrier spec. activity 4/U·gcarrier−1107.450.841.029.4
1 Epoxy methacrylate. 2 Hexamethylamino methacrylate, pre-activated with glutaraldehyde. 3 Dimethylamino methacrylate, pre-activated with glutaraldehyde. 4 One unit (U) is defined as a product formation of 1 µmol per min; reaction conditions activity assay: 10 g·L−1 immobilised epimerase, T = 40 °C, 1000 rpm, 100 mmol·L−1 Tris buffer, pH 8.0, 1 mmol·L−1 MgCl2, 1 mmol·L−1 ATP, 100 mmol·L−1 GlcNAc, V = 1 mL, reaction time: 10 min. ManAc was quantified by ManDH assay.
Table 4. Characteristic parameters for the immobilisation of lyase with different carriers.
Characteristic VariableECR8309F 1ECR8309M 1
Immobilisation efficiency/%7.612.4
Activity yield/%6.510.6
Carrier loading/mgenzyme·gcarrier−184.795.1
Carrier spec. activity 2/U·gcarrier−126.563.6
1 Dimethylamino methacrylate, pre-activated with glutaraldehyde. 2 One unit (U) is defined as a product formation of 1 µmol per min; reaction conditions activity assay: 50 g·L−1 immobilised lyase, T = 40 °C, 1000 rpm, 100 mmol·L−1 Tris buffer, pH 8.0, 100 mmol·L−1 ManNAc, 250 mmol·L−1 pyruvate, V = 1 mL, reaction time: 10 min. Neu5Ac was quantified by HPLC.
Table 5. Kinetic parameters of immobilised epimerase and lyase in a PBR.
EnzymeParameterValueUnit *
Epimerasevmax,app,forward234 ± 3U∙gcarrier−1
Km,app,forward266 ± 10mmol∙L−1
vmax,app,backward797 ± 46U∙gcarrier−1
Km,app,backward294 ± 45mmol∙L−1
KI,app,pyruvate940 ± 107mmol∙L−1
Lyasevmax,app,forward294 ± 22U∙gcarrier−1
Km,app,ManNAc,forward249 ± 64mmol∙L−1
Km,app,pyruvate,forward229 ± 11mmol∙L−1
vmax,app,backward151 ± 6U∙gcarrier−1
Km,app,backward205 ± 19mmol∙L−1
KI,app,GlcNAc418 ± 40mmol∙L−1
* One unit (U) is defined as a product formation of 1 µmol per min.
Table 6. Residence times and fluid volumes for the PBRs at different flow rates.
Reactor Number a V ˙ /mL∙min−1 t ¯  b/min f V , P B R /- V P B R  c/mL
11.50.117 ± 0.0040.820.17
41.50.367 ± 0.0380.710.50
40.51.222 ± 0.0080.620.43
51.50.109 ± 0.0080.770.16
81.51.556 ± 0.0090.691.70
80.55.131 ± 0.0770.812.03
91.51.399 ± 0.0450.611.53
90.54.640 ± 0.1060.731.83
101.50.581 ± 0.0200.790.66
100.51.527 ± 0.0480.610.51
111.5480.7464
a Data on reactor size and immobilisate mass are given in Table 2. b Standard deviation of three independent experiments. PBR 1–10 was determined by a pulse experiment and PBR 11 by mass flux analysis. c  V P B R defined the fluid volume of the PBR, calculated with the correction factor f V , P B R according to Equation (15).
Table 7. Model validation for immobilised epimerase in a PBR.
ExperimentReactor Number aFlowRate/
mL∙min−1
Measured b:
ManNAc/mmol·L−1
Model Prediction:
ManNAc/mmol·L−1
Deviation/%
111.51.07 ± 0.011.052
241.512.96 ± 0.0913.655
340.519.48 ± 0.3420.726
a Data on reactor size and immobilisate mass are given in Table 2. b Experimental conditions: T = 30 °C, 200 mmol∙L−1 Tris, pH 8.0, 20 mmol∙L−1 MgCl2, 100 mmol∙L−1 GlcNAc, 1 mmol∙L−1 ATP. ManNAc was quantified by ManDH assay, standard deviation of two independent samples.
Table 8. Model validation for immobilised lyase in a PBR.
ExperimentReactor Number aFlow Rate/
mL∙min−1
Measured b: Neu5Ac/mmol·L−1Model Prediction: Neu5Ac/mmol·L−1Deviation/%
451.54.90 ± 0.115.247
581.532.52 ± 1.1035.889
680.545.63 ± 0.7643.086
a Data on reactor size and immobilisate mass are given in Table 2. b Experimental conditions: T = 30 °C, 200 mmol∙L−1 Tris, pH 8.0, 20 mmol∙L−1 MgCl2, 100 mmol∙L−1 ManNAc, 250 mmol∙L−1 pyruvate. Neu5Ac was quantified by HPLC, standard deviation of two independent samples.
Table 9. Model validation for mixed bed with immobilised epimerase and lyase in a PBR.
ExperimentReactor Number aFlow Rate/mL∙min−1Measured b: Neu5Ac/mmol·L−1Model Prediction: Neu5Ac/mmol·L−1Deviation/%
79 + 10 (in series)1.58.43 ± 0.549.7113
89 + 10 (in series)0.517.54 ± 0.0823.1124
9111.571.47 ± 0.7566.846
a Data on reactor size and immobilisate mass are given in Table 2. b Experimental conditions: Experiment 7 and 8: T = 30 °C, 200 mmol∙L−1 Tris, pH 8.0, 1 mmol∙L−1 ATP, 20 mmol∙L−1 MgCl2, 117 mmol∙L−1 GlcNAc, 298 mmol∙L−1 pyruvate, Neu5Ac was quantified by HPLC. Experiment 9: T = 30 °C, 200 mmol∙L−1 Tris, pH 8.0, 1 mmol∙L−1 ATP, 1 mmol∙L−1 MgCl2, 236 mmol∙L−1 GlcNAc, 427 mmol∙L−1 pyruvate, Neu5Ac was quantified by HPLC, standard deviation of two independent samples.
Disclaimer/Publisher’s Note: The statements, opinions and data contained in all publications are solely those of the individual author(s) and contributor(s) and not of MDPI and/or the editor(s). MDPI and/or the editor(s) disclaim responsibility for any injury to people or property resulting from any ideas, methods, instructions or products referred to in the content.

