Article

Flow Field Characteristics of Fugitive Dust from Grab Unloading in an Open Space

1
School of Mechanical Engineering, Taiyuan University of Science and Technology, Taiyuan 030024, China
2
Shanxi Key Laboratory of Intelligent Logistics Equipments, Taiyuan 030024, China
*
Authors to whom correspondence should be addressed.
Processes 2024, 12(1), 49; https://doi.org/10.3390/pr12010049
Submission received: 17 November 2023 / Revised: 15 December 2023 / Accepted: 18 December 2023 / Published: 24 December 2023

Abstract

:
Aiming at addressing the problem of dust generated when grab is unloaded, the flow field characteristics of fugitive dust in an open space were studied and reflected its unstable and complex nonlinear dynamic process. Using coal, sand, and flour as research objects, an experimental model and measurement system for grab unloading were built, and the dust diffusion range, diffusion speed and direction, settling time, dust concentration, and induced wind velocity at different measurement points were compared. The computational fluid dynamics–discrete element method (CFD-DEM) coupling method was adopted, the discrete phase model (DPM) of dust was established, the interaction of the particle, dust, and airflow fields during the unloading process of the grab was further studied, and the distribution and diffusion laws of the induced airflow and dust were obtained. The acquisition of flow field characteristics is of great significance for controlling and guiding the orderly deposition of dust.

1. Introduction

Environmental protection is an important livelihood issue that the country has focused on and resolved in recent years. Grabs are widely used in ports, thermal power plants, grain depots, and other places to load, unload, and transport bulk materials such as ore, coal, and grain. The inherent powder and fine particles in bulk materials easily diffuse into the air to form aggregated diffusion dust, as shown in Figure 1. Fugitive dust not only causes environmental pollution and the waste of resources, affects the service life of operating machinery, and even causes dust explosions, resulting in significant losses, but also causes serious harm to the physical health of personnel; in severe cases, it can cause pneumoconiosis or lung tissue lesions [1,2]. Specific requirements for dust prevention and control have been put forward in the National (China) Occupational Disease Prevention and Control Plan (2016–2020), the “135” Plan for Safety Production and the outline of the “2030-year Plan for Healthy China” [3]. Therefore, it is of great significance to study the characteristics of the dust flow field of grab unloading in an open space, which can effectively control and guide the dust to settle in an orderly manner, protect the environment, save resources, and guarantee the physical health of personnel.
In this study, the characteristics of the flow field of fugitive dust generated when a grab is loading and unloading bulk materials in open space are investigated. This is a typical comprehensive theoretical study of gas–solid two-phase flow, combining turbulence dynamics and particle kinematics. In 2005 and 2021, Science magazine listed issues related to gas–solid two-phase flow (the comprehensive theory of turbulence dynamics and particle kinematics) as one of the most challenging and cutting-edge scientific problems worldwide [4,5], and the study of particle motion mechanisms has been one of the scientific frontiers in the past 20 years [6]. Since 2010, we have studied the interaction between particles and airflow fields in two-phase flow and the cause of the induced wind. To address the dust pollution problem of belt conveyor transfer stations, the mechanism of unpowered dust suppression and the main points of design and application have been proposed, laying a foundation for studying the formation mechanism of dust suppression flow fields [7,8,9]. Fugitive dust is closely related to the wind induced by the falling of bulk materials [10], which then reacts with the falling bulk materials, forming an open space fugitive dust flow field. Scholars worldwide mostly study the diffusion characteristics of particle flow and the collision mechanism between particles and between particles and walls [11,12]. In [13], the velocity distribution of air carried by particles in the free fall of bulk materials was studied experimentally, and it was found that the velocity distribution of the induced air is in agreement with a Gaussian distribution. The experiment was improved in [14] to explore the effect of the free blanking height on particle velocity, dust concentration, and induced airflow. Reference [15] found that reducing the falling height and bulk flow rate could improve the dispersion degree of particles, weaken the trend of particle diffusion, and prevent larger dust particles from forming. Reference [16] found that adjusting the falling space of particles and increasing the airflow resistance can reduce the induced airflow and the induced air velocity, which restrain dust diffusion. In reference [17], it was found that to control the variation in airflow velocity caused by material falling, the flow rate of the falling material can be reduced appropriately.
Numerous scholars have conducted in-depth studies on the loading and unloading of bulk materials. The induced airflow of the transfer chute was discussed, and the effects of mass flow, falling height, and chute structure on the induced airflow velocity were studied [18]. A similarity criterion was used to determine the relationship between the influencing factors and the induced airflow velocity [19]. A transfer chute was used to improve the degree of aggregation of the bulk materials and adjust the induced airflow velocity to restrain the divergence of dust. Study [20] divided the transport process into three parts: storage area, transfer area, and impact area. Based on the diffusion mechanism of dusty airflow and the energy dissipation theory, the geometric structure of the transport chute was improved, and a composite straight-arc chute dust suppression device was proposed. In studies [21,22,23,24], according to the motion characteristics of the induced airflow during the transfer of loose materials in a chute, a return flow structure was set in the material-guide chute to form eddy currents to promote the internal airflow hedge, and thus reduce the induced airflow speed. In addition, a dust curtain was set in the dust removal area of the maze to further consume the kinetic energy of the airflow and allow the dust carried by the dusty air to settle to suppress the dust. A dust suppression hopper was studied in [25]; its dust suppression mechanism concerns the process where fast-flowing bulk materials form a closed negative pressure space in the lower region of the dividing cone, and the dust moves to the centre under the action of pressure. Owing to the extrusion of the parting cone, the air inside the material column is expelled, which reduces the induced airflow and thus the secondary dust-raising rate.
In the aforementioned research, an induced wind model was established from the free fall, loading and unloading, and transportation of bulk materials; however, the characteristics of the variable flow rate and variable cross-section of grab unloading were not studied. Several factors affect grab unloading related to the characteristics of the bulk materials, particle size composition and distribution, unloading height, unloading flow rate, and the structure of the grab and hopper. Moreover, the flow rate changes in real time during grab unloading, which is a complex flow field under multivariate working conditions, and there are few related studies. Based on three types of bulk materials (coal, sand, and flour) with different characteristics, according to the particle size composition and distribution of bulk materials, this study analyses the gas–solid two-phase flow with variable flow rate and variable cross section in the process of grab unloading. Through theory, experimentation, and numerical simulation, the flow field characteristics of fugitive dust in open space are obtained. Specifically, it includes the distribution and diffusion law of the dust concentration, the variation law of the induced wind velocity, the motion trajectories and velocity distributions of the air and particle flow fields, and it establishes the interaction and variation law of the gas–solid two-phase flow field between the air and particle flow fields. The purpose of this study was to provide theoretical and design bases for achieving efficient control of dust generation, guiding orderly dust settlement, and the targeted design of dust suppression equipment.

2. Research Method

2.1. Experimental Method

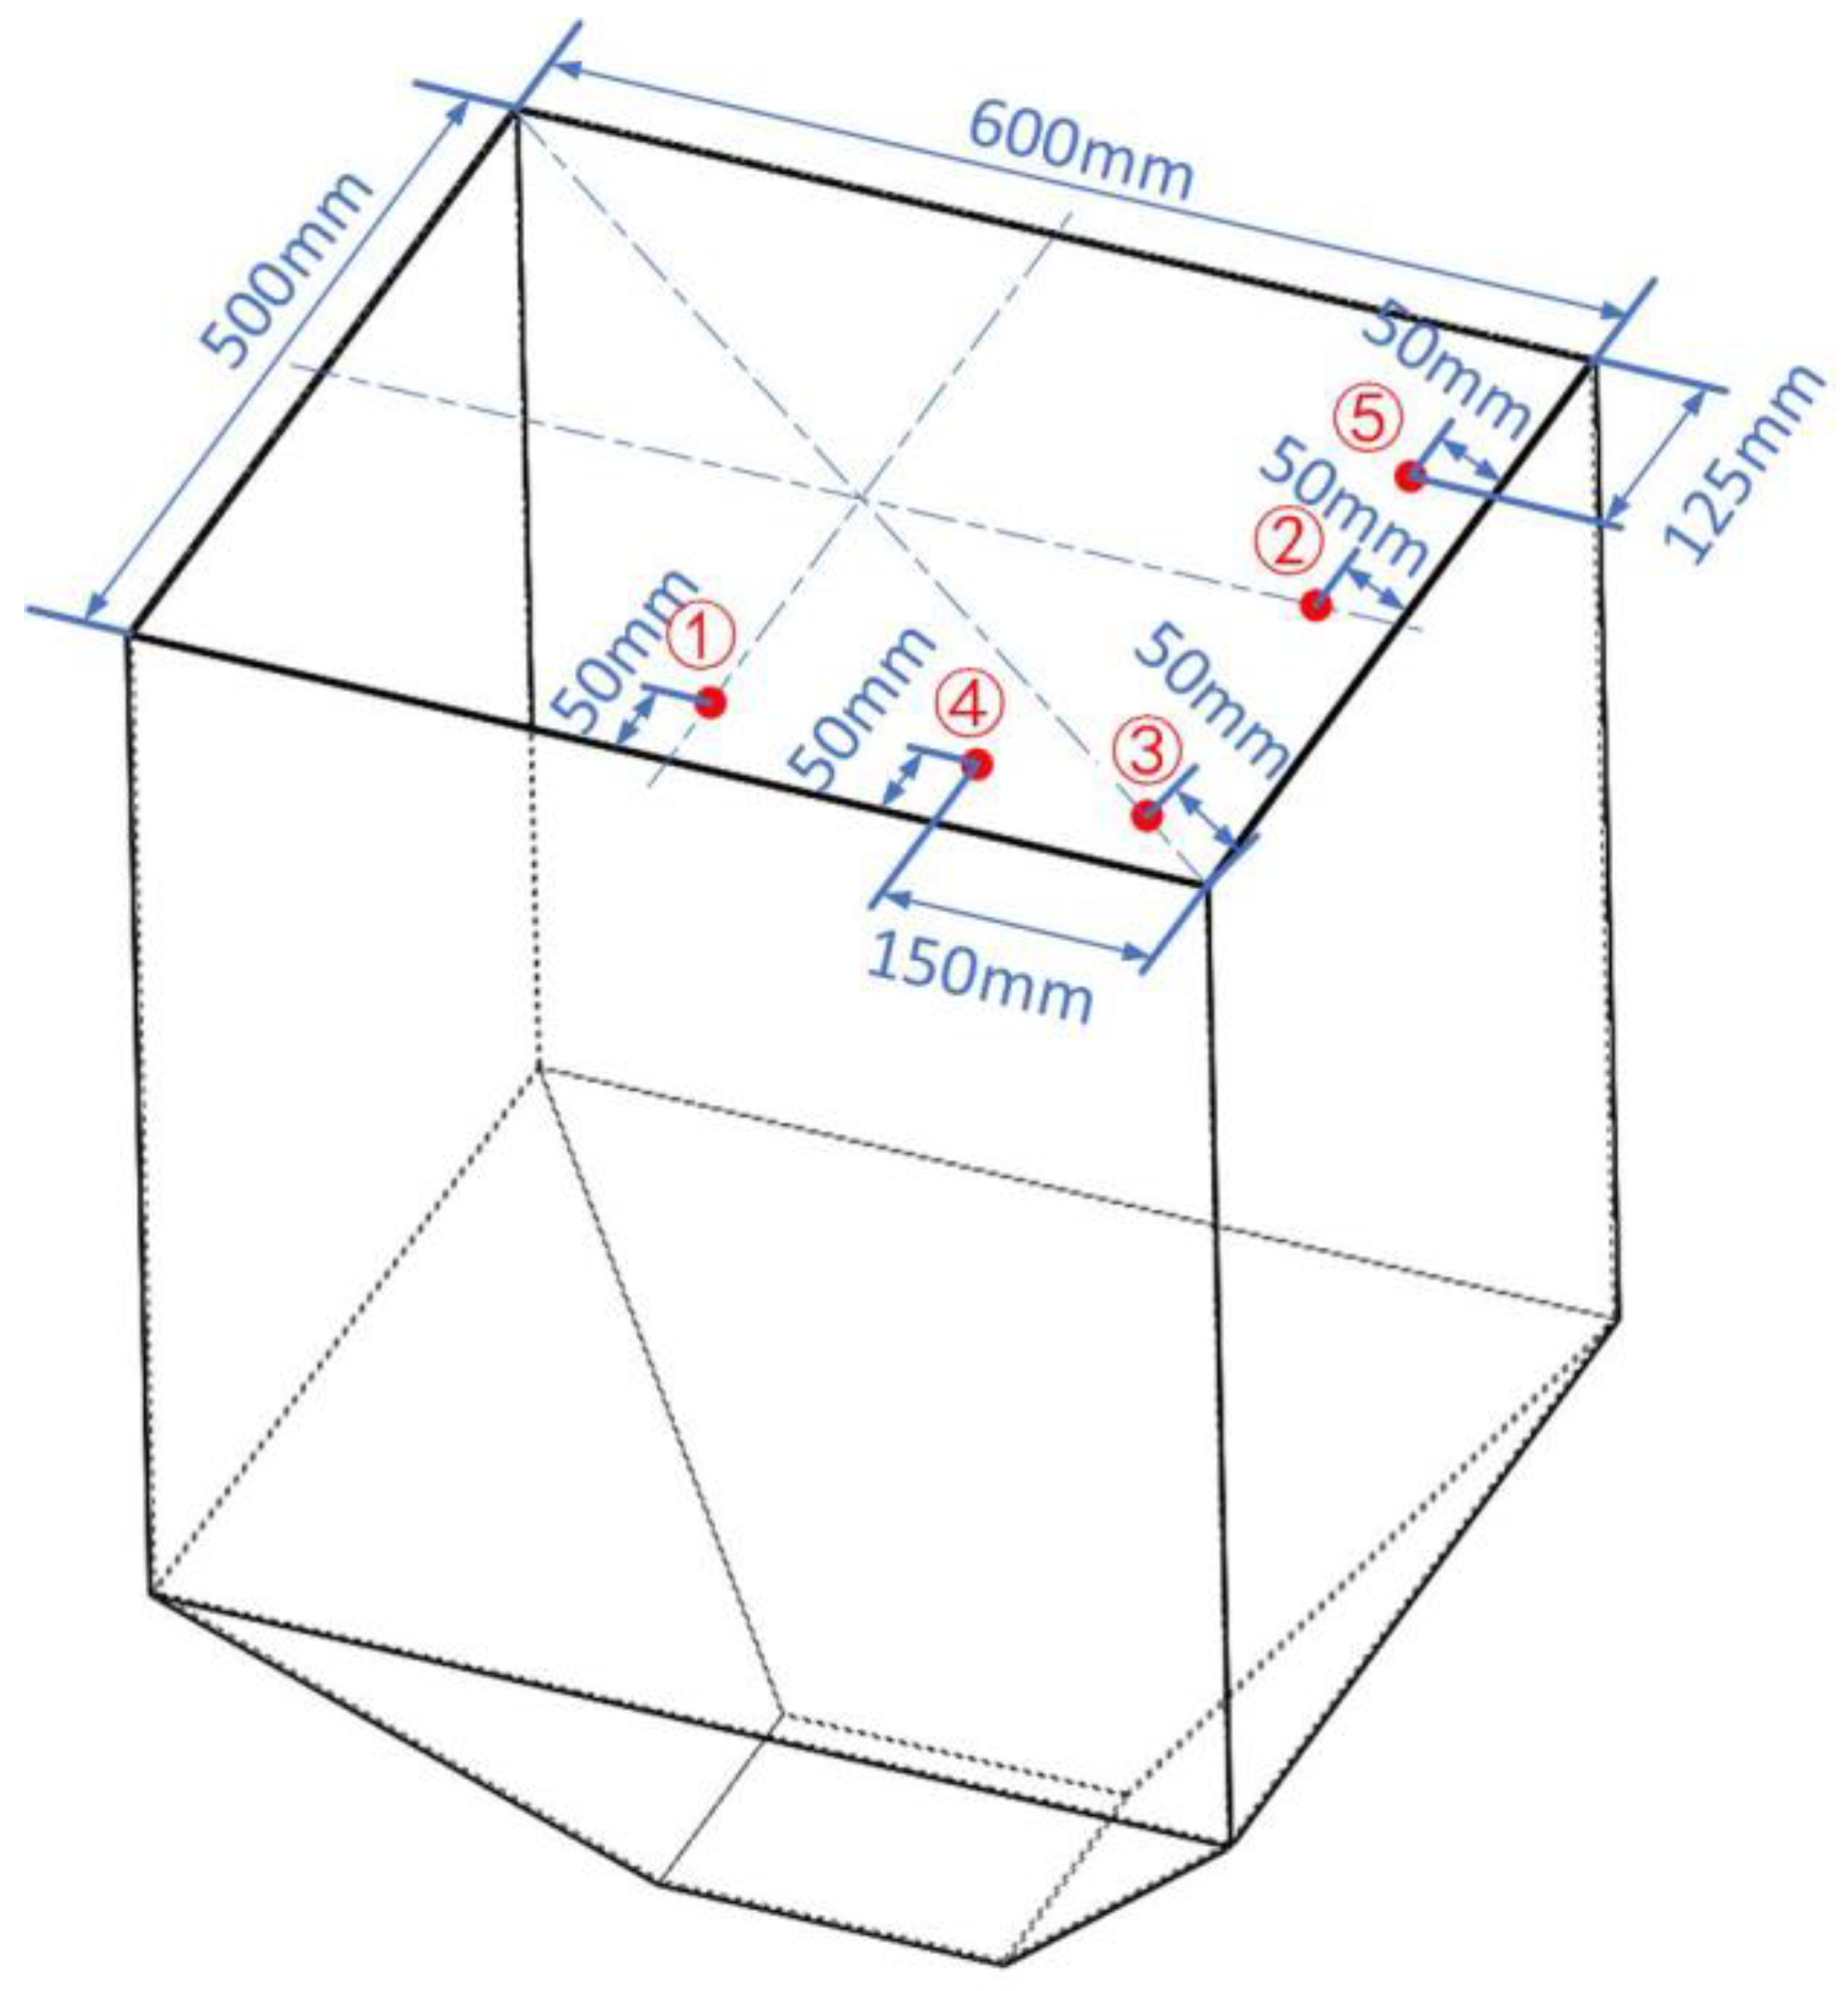
2.1.1. Construction of Grab Unloading Experimental Model

As shown in Figure 2, an experimental model for unloading from a grab to a hopper was constructed. The size of the cuboid hopper was 840 mm × 600 mm × 500 mm. The lower part of the hopper was a pyramid, the bottom surface was 192 mm × 160 mm, the grab was placed at the centre above the hopper, and the height of the bottom end from the hopper mouth was 200 mm. The opening and closing of the grab were realised by expanding the electric push rod. The opening angular velocity of the grab was set at 30 deg/s, the maximum opening angle was 105°, and the opening time was 3.5 s. Three types of bulk materials (coal, sand, and flour) were unloaded, the volume was 3.8 L, and the ambient temperature was 25 °C.

2.1.2. Construction of Experimental Measurement System

As shown in Figure 3, the experimental measurement system consisted of a high-speed camera, thermal anemometer, and dust concentration measuring instrument. The high-speed camera uses Photron FASTCAM Viewer (PFV Ver.3691) software to photograph and record the unloading process of the grab and analyse the interaction between the bulk material and the surrounding induced air. By calibrating the distance and angle, the dust diffusion range, diffusion speed and direction, and settling time of different materials were obtained. The purpose of this study was to analyse and compare the dust ranges of different materials at the same stage and the same material at different stages.
The dust concentration-measuring instrument adopts the CCZ3000 direct reading dust concentration-measuring instrument, and the measuring range is 0–3000 mg/m3, which matches the measured concentration range. By presetting the dust light scattering ratio coefficient K, the dust concentration of different materials can be accurately and continuously monitored, real-time concentration data can be output, and the data can be exported to Excel. This is power exhaust type, which has stable performance and higher accuracy compared to the natural airflow type. Using this instrument, the variation law of the dust concentration during the unloading process was determined, and the dust concentrations of different materials at the same position and the same material at different positions were compared.
A thermal anemometer can measure the wind speed at various positions using a telescopic, small-diameter wind probe. The measurement results were exported to Excel. In the experiment, several measurement points were selected, multiple planning experiments were conducted for each material and each measurement point, and the variation law of the induced wind speed with time for different materials and measurement points was obtained.

2.2. Numerical Simulation Method

The experimental grab-unloading method was used to compare the dust diffusion range, diffusion speed and direction, and settling time of the three types of materials, as well as the local law of dust concentration and induced wind velocity at different measurement points. However, it is impossible to obtain the interaction between the particle and airflow fields or the global law of dust distribution and diffusion in the entire unloading area; therefore, a numerical simulation method was needed to supplement the study of the flow field law. A CFD-DEM coupling was adopted based on the Euler–Lagrangian model. The fluid phase was solved by the continuous phase under the Eulerian framework, and the solid phase was solved by the discrete phase under the Lagrangian framework, considering the interactions between the particle and fluid phases and between the particles. Simultaneously, the DPM in ANSYS FLUENT was used to generate dust and simulate the dust distribution during the unloading process. The basic model was set as follows: A complete discrete element solver was used to calculate the particles that occupied the fluid volume and interacted with the fluid.
The basic theories of the governing equation of CFD-DEM coupling, the fluid–particle interaction equation, the governing equation of the k–ε model, and the motion equation of dust particles are as follows.

2.2.1. CFD-DEM Governing Equations

The gas phase obeys the Navier–Stokes equations. The continuity equation is given as
t ε g ρ g + ε g ρ g u g = 0
The momentum conservation equation is given as
t ε g ρ g u g + ε g ρ g u g = ε g p + ε g τ g + ε g ρ g g F g p
where ρ g , u g , p , and τ g are the density, velocity, pressure, and viscous stress tensors of the gas phase, respectively. g is gravitational acceleration, F g p is the force between the particle and gas phases, and ε g is the volume fraction of the gas.
In the Euler–Lagrangian method, each particle of the solid phase is solved individually to obtain detailed particle motion dynamics information, including particle–particle, particle–fluid, and particle–wall interactions. According to Newton’s second law, the governing equation for a single particle is
m i d v i d t = m i g + f p g , i + j = 1 k i f c o n t a c t , i j
I i d w i d t = j = 1 k i T i j
where I i , m i , v i , and w i are the moment of inertia, mass, translational velocity, and rotational velocity of the particle i, respectively. k i is the number of particles in contact with particle i and T i j is the total torque of particle i. f p g , i and f c o n t a c t , i j are the gas–solid interaction and contact forces of the particles, respectively.

2.2.2. Fluid–Particle Interaction Forces

According to the empirical correlations for the pressure drop, the particle–fluid drag force can be represented by the interphase momentum transfer coefficient and slip velocity, expressed as
F d = β ( u g u p ) ρ g
where u g and u p are the velocities of the gas and particles, respectively. β is the interphase momentum transfer coefficient. A proper drag model for the description of β is vital in CFD-DEM simulations. A combination of the Ergun [26] and Wen Yu [27] correlations is typically used [28]. β is given by
β = 150 1 ε g 2 μ g ε g d p 2 + 1.75 1 ε g ρ g d p u g u p , ε g 0.8 3 4 C D 1 ε g ρ g d p u g u p ε g 2.65 , ε g > 0.8 ,
where d p , μ g , and C D denote the particle diameter, gas viscosity, and drag coefficient, respectively.
The drag coefficient C D is given by
C D = 24 R e 1 + 0.15 R e 0.687 , R e 1000 0.44 , R e > 1000
where R e is
R e = ε g ρ g d p u g u p μ g
The gas pressure gradient force is given by
F p = V p p
where V p and p are the particle volume and gas pressure, respectively.

2.2.3. Turbulence Model

Several models, such as the zero-equation model, one-equation model, two-equation model, Reynolds stress model, and direct numerical simulation method, can describe the air turbulence flow in the process of grab unloading. The high Reynolds number k–ε model is the most common two-equation model and a typical mathematical treatment of the Eulerian method. The Reynolds number in the unloading process of grab is high, and hence, the k–ε turbulence model can well reflect the characteristics of airflow field [29,30]. The realisable k–ε model can better describe the turbulent flow characteristics under the airflow field. The governing equations of the k–ε model can be expressed as [31,32,33,34,35]
t ρ k + x i ρ k u j = x i μ + μ t σ k k x i + G k + G b ρ ε Y M
t ρ ε + x i ρ ε u j = x i μ + μ t σ ε ε x j + ρ C 1 S ε ρ C 2 ε 2 k + v ε + C 1 ε ε k C 3 e G b
where C 1 = max 0.43 , η η + 5 ; η = S k ε ; S ˜ = S i j S i j ; ρ is the density; t is the time; i and j are the tensor coordinates; k is the kth type of particle; u is air velocity; Gk denotes the turbulent kinetic energy induced by the average velocity gradient; Gb denotes the buoyancy-induced turbulent kinetic energy; YM describes the effect of the pulse expansion of the compressive turbulent fluctuation on the overall dissipation rate; μ is air viscosity; μt is the turbulent viscosity; G2 and C1ε are constants; σk and σε are the turbulent Prandtl numbers for k and ε, respectively; C1ε, C2, σk, and σε are default constants (C1ε = 1.44, C2 =1.9, σk = 1.0, and σε = 1.2).
The eddy viscosity is computed from [36,37,38,39,40]:
μ t = ρ C μ k 2 ε
and C μ can be written as
C μ = 1 A 0 + A s U k ε

2.2.4. Motion Equation of Dust

The dust generated during the grab-unloading process is distributed in a discrete state, and the interaction between dust and the influence of the dust phase volume on the continuous phase can be ignored; thus, the DPM can be used to simulate the migration and diffusion of dust. According to the principle of force balance, the motion equation of dust particles in the Lagrangian coordinate system can be written as [41,42,43]
d u p d t = F D ( u u p ) + g ( ρ p ρ ) ρ p
where g ( ρ p ρ ) ρ p is the combined force of gravity and the buoyancy of the particle mass, F D ( u u p ) is the resistance of the particle mass, u is the velocity of the continuous phase, u p is the particle velocity, ρ and ρ p are the fluid and particle densities, respectively.

3. Experimental Study on Fugitive Dust from Grab Unloading

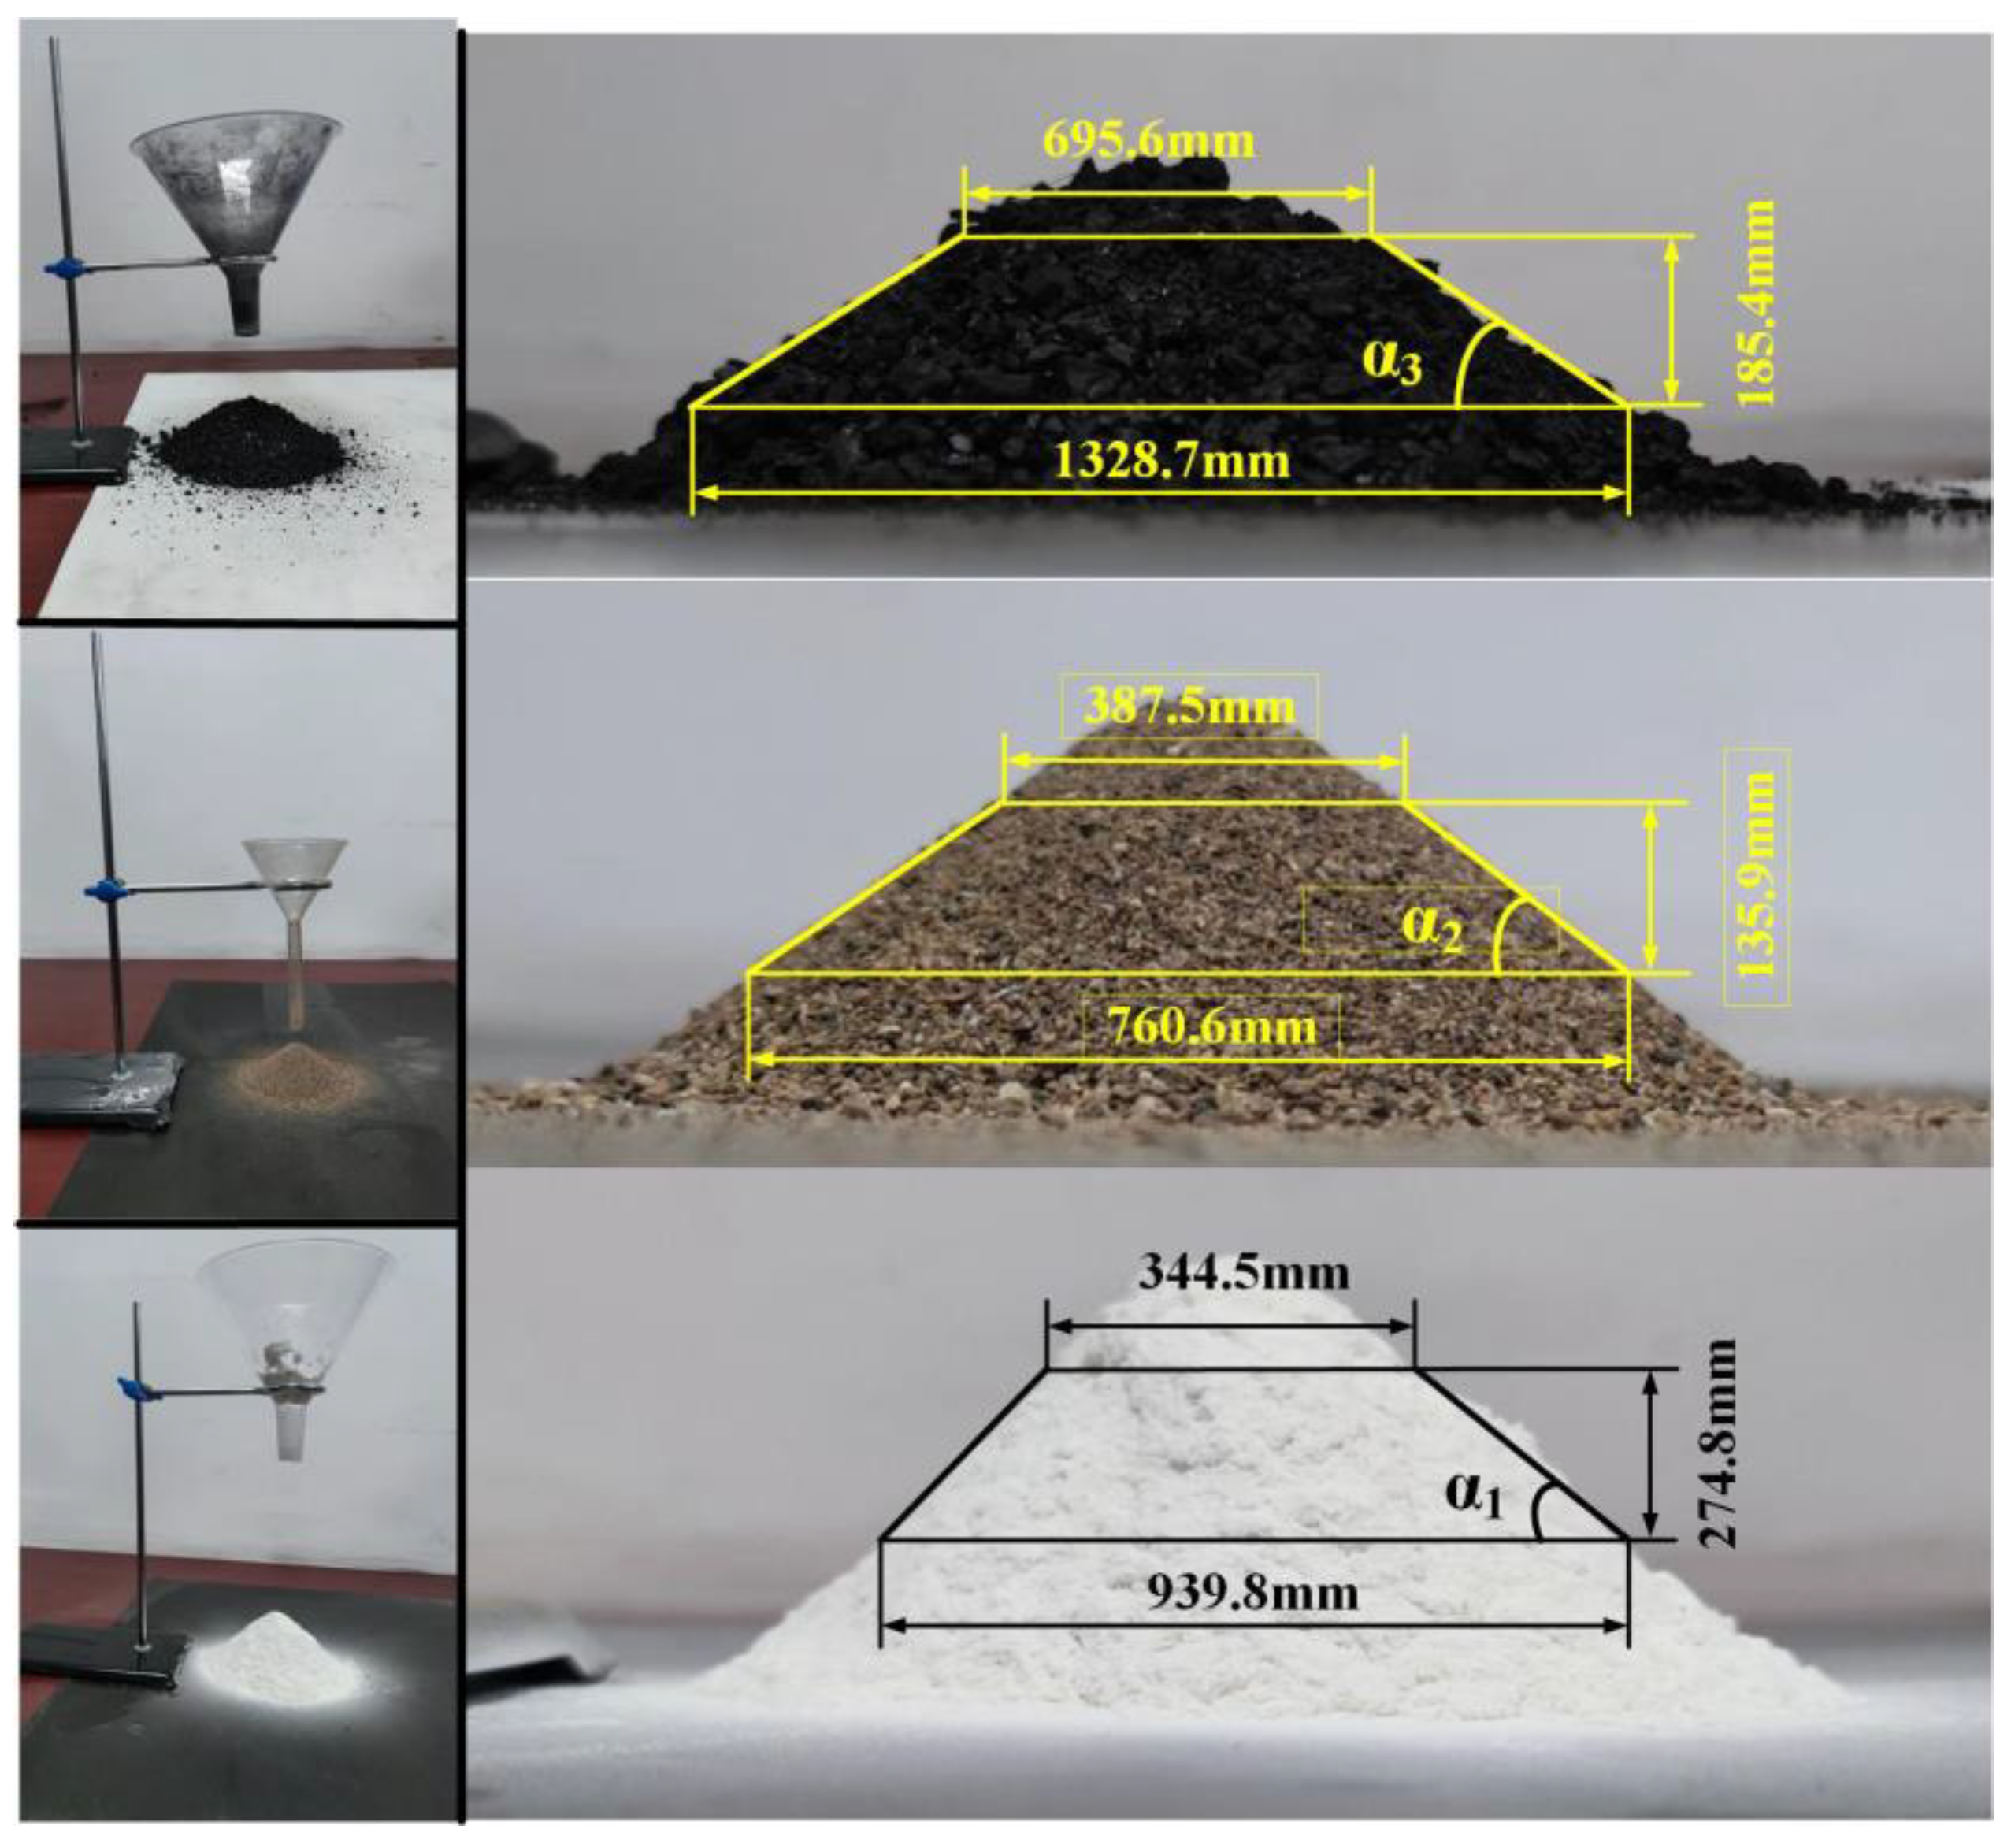
3.1. Parameter Calibration of the Bulk Material

As shown in Figure 4, to test the stacking angles of the three types of materials, a conical hopper was used to drop the materials freely onto the flat plate of the pile to form a conical pile. The stacking angle of the material is the angle between the surface of the material pile and a horizontal line. The calculated stacking angles of the coal, sand, and flour were 30.36°, 36.07°, and 42.71°, respectively.
The parameters of coal, sand, and flour were calibrated as shown in Table 1. The bulk material densities, from large to small, are those of sand, coal, and flour. The particle size distribution and composition were obtained using a sieve mesh, in which the particle size distribution of coal and sand was uneven and the particle size of the flour was uniform. The fluidity of materials is inversely proportional to the stacking angle. The fluidities, from best to worst, are of coal, sand, and flour. Material types were classified based on the bulk density and particle size distribution.

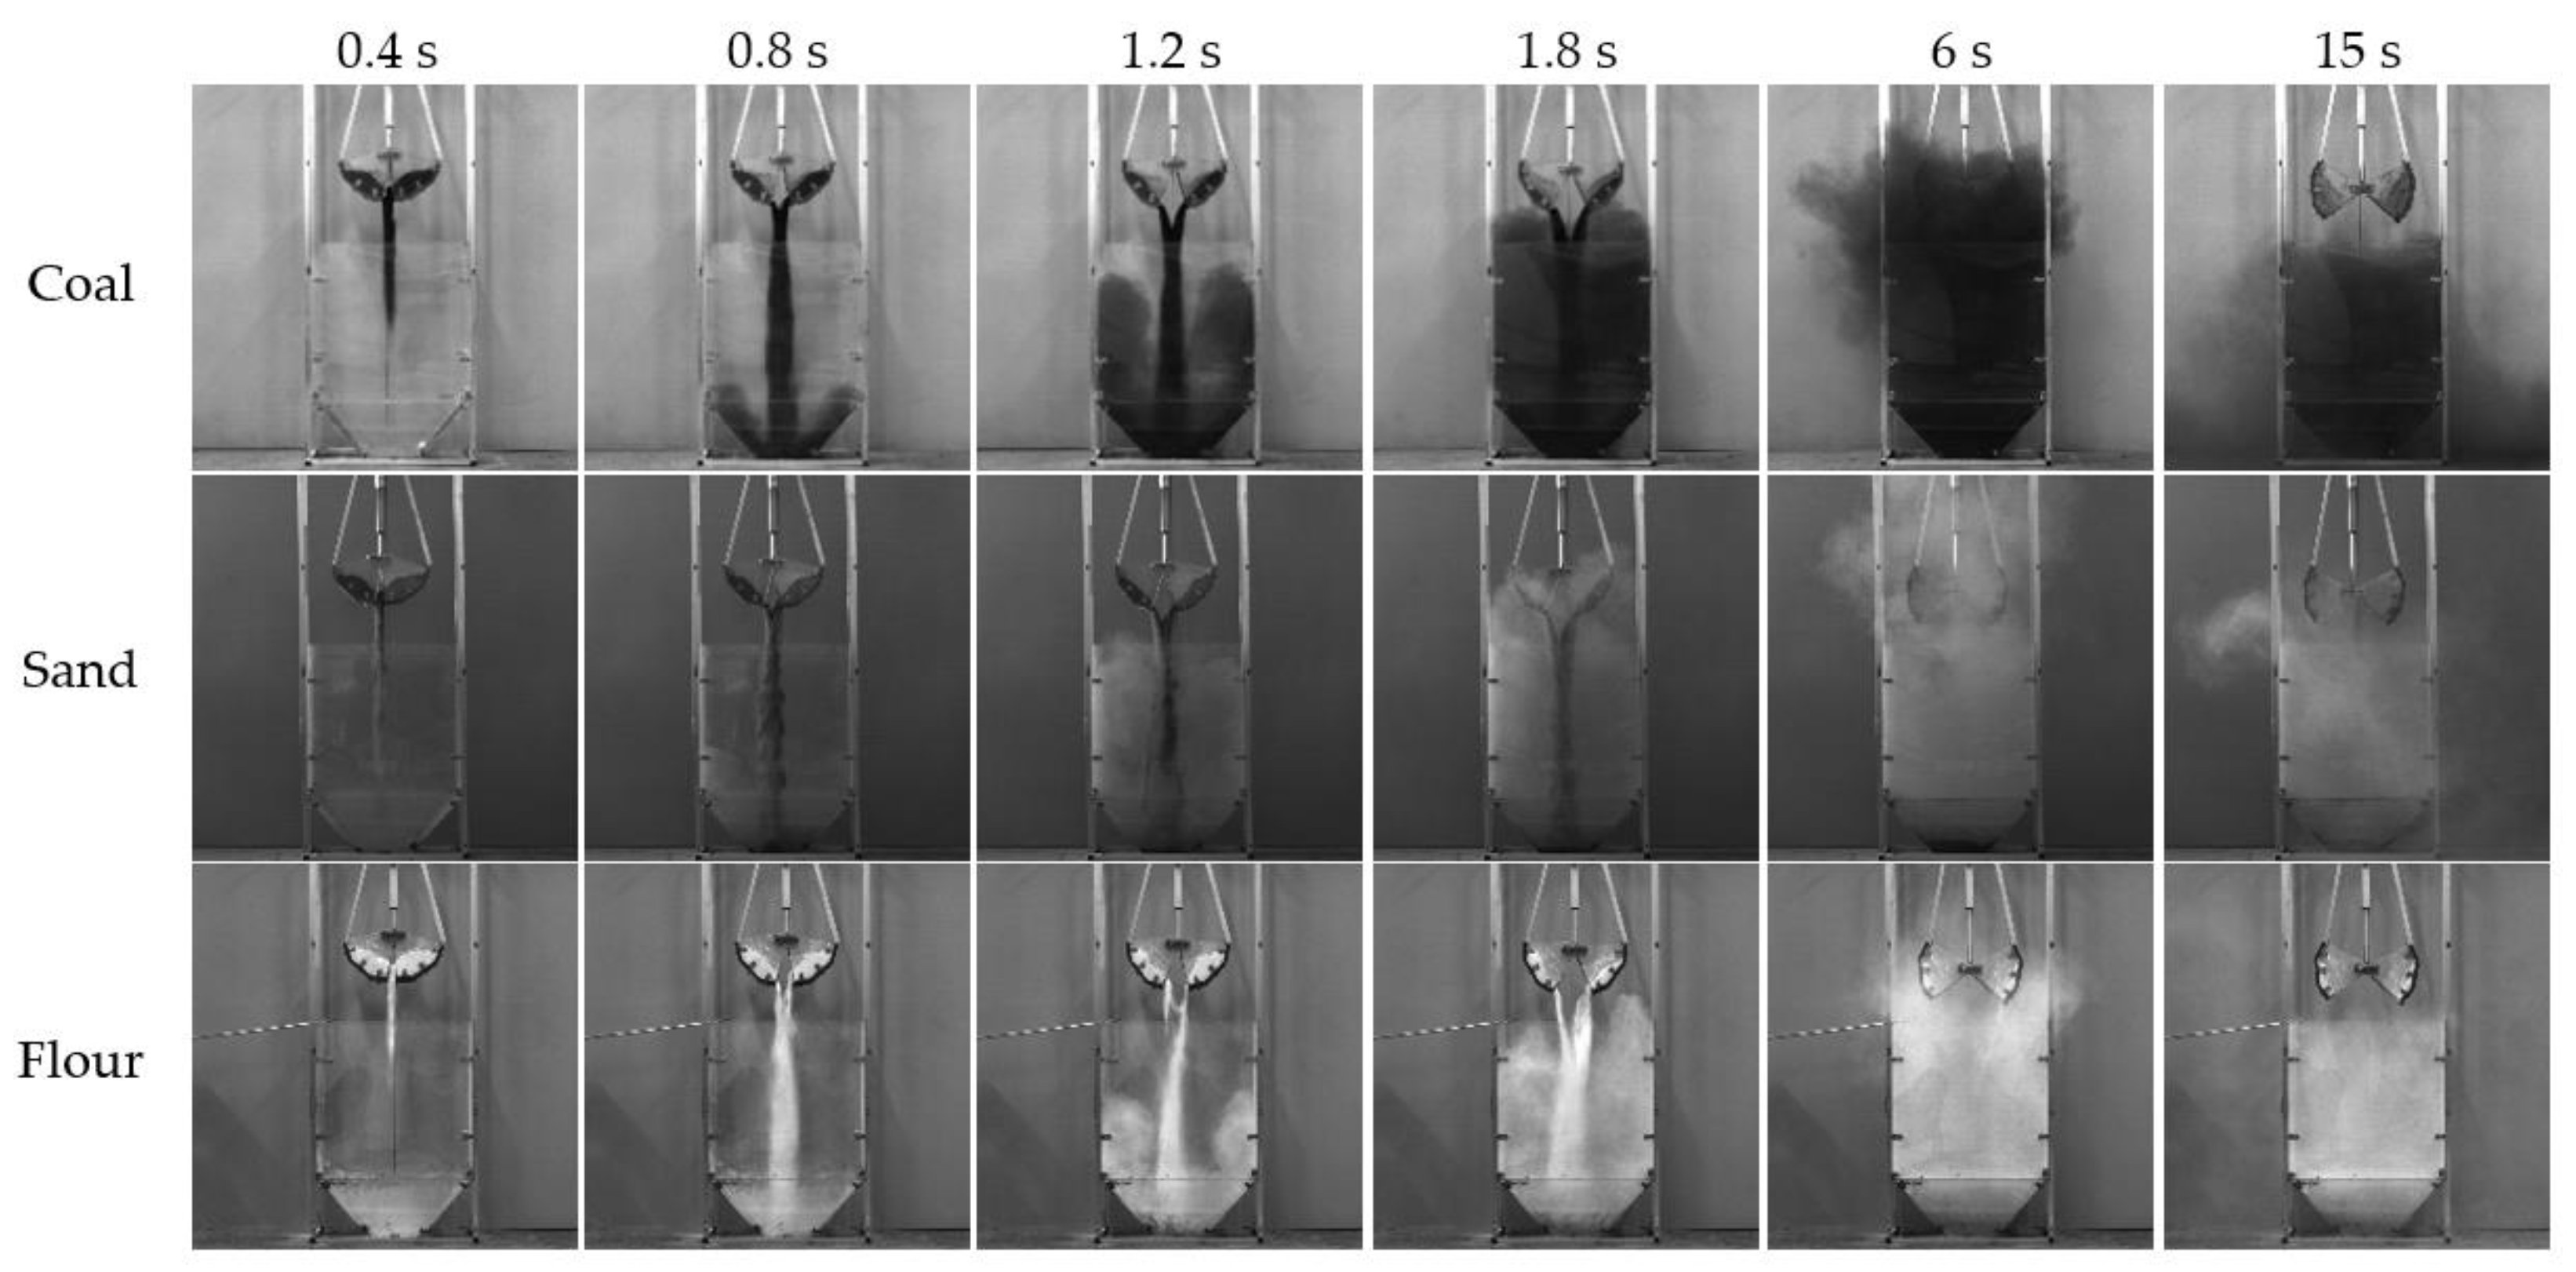
3.2. The Law of Fugitive Dust during Unloading Process

As shown in Figure 5, a high-speed camera is used to photograph the unloading process of three different materials, and six typical moments (T = 0.4 s, T = 0.8 s, T = 1.2 s, T = 1.8 s, T = 6 s, and T = 15 s) are selected to represent the whole unloading process, which is used to compare and analyse the fugitive dust laws of different materials.
As shown in Figure 5, with the uniform opening of the grab, the unloading cross-sectional area and material flow rate gradually increased, which gradually increased the diffusion amount and diffusion area of the dust. During the process of unloading coal and sand, the material flow on both sides of the grab was continuous, uniform, and symmetrical. The dust diffusion was relatively symmetrical at the beginning and showed evident disorderly diffusion with the progress of the unloading process. For flour, owing to its high viscosity and poor fluidity, the material flow on both sides of the grab was clearly different, and the material flow was unstable, forming multiple intermittent material flows, and the dust spread in disorder during the entire unloading process.
The unloading processes of the three materials were compared, as listed in Table 2. It can be observed that the duration of the dust rising diffusion, in decreasing order, was sand, flour, and coal. The emptying time of materials in the grab, in the order of long to short, was flour, sand, and coal, which is related to the fluidity of the materials; the emptying time of materials with good fluidity is short. The maximum diffusion ranges of dust are compared in Figure 6: the outer profile is the maximum diffusion range of dust, in which the transverse dimensions, from large to small, are coal, sand, and flour, and the longitudinal dimensions, from large to small, are sand, flour, and coal.
Overall, the unloading processes of the different materials were roughly the same and could be divided into four stages.
First stage (0–0.8 s): As the grab opens, part of the particle flow enters the hopper, forming a vertical downward material column. As the opening angle of the grab increases, the material column widens gradually. In this process, the movement direction of the particle flow is nearly parallel to the vertical direction, the diffusion in the horizontal direction is weak, and there are small-scale vortexes along the direction of the falling material.
Second stage (0.8–1.8 s): The particle flow is continuous blanking, and the dust begins the diffusion stage. At this stage, the particle flow field has an evident effect on the airflow field, and the shear effect of the downward flow is strengthened. The high-speed airflow field entrained in the particle flow field rapidly increases the positive pressure inside the hopper; the particle flow falls to the bottom of the hopper when the particles collide with each other, and the particle flow collides with the hopper wall, causing secondary dust. These two superposition effects cause the airflow field to entrain dust from the centre to the left and right sides to form vortices, and the dust diffuses upward.
Third stage (1.8–6 s): This is the stage in which the particle flow accumulates in the hopper and the dust continues to spread out of the hopper. The dust entrained in the airflow field forms a vortex in the hopper, and the position becomes clearer as it goes down; after turning back at the bottom of the hopper, it escapes to the edge and above the hopper mouth. At this stage, the diffusion of the dust flow field is most significant, exhibiting a disordered distribution.
Fourth stage (6 s to end): Most of the particle flow accumulates at the bottom of the hopper, the dust diffusion to the outside of the hopper is weakened, and the dust settles slowly owing to gravity. During the settlement process, the disordered diffusion along the radial direction is significant. As the dust concentration inside the hopper is greater than that outside the hopper, the settling speed outside the hopper is faster than that inside the hopper.

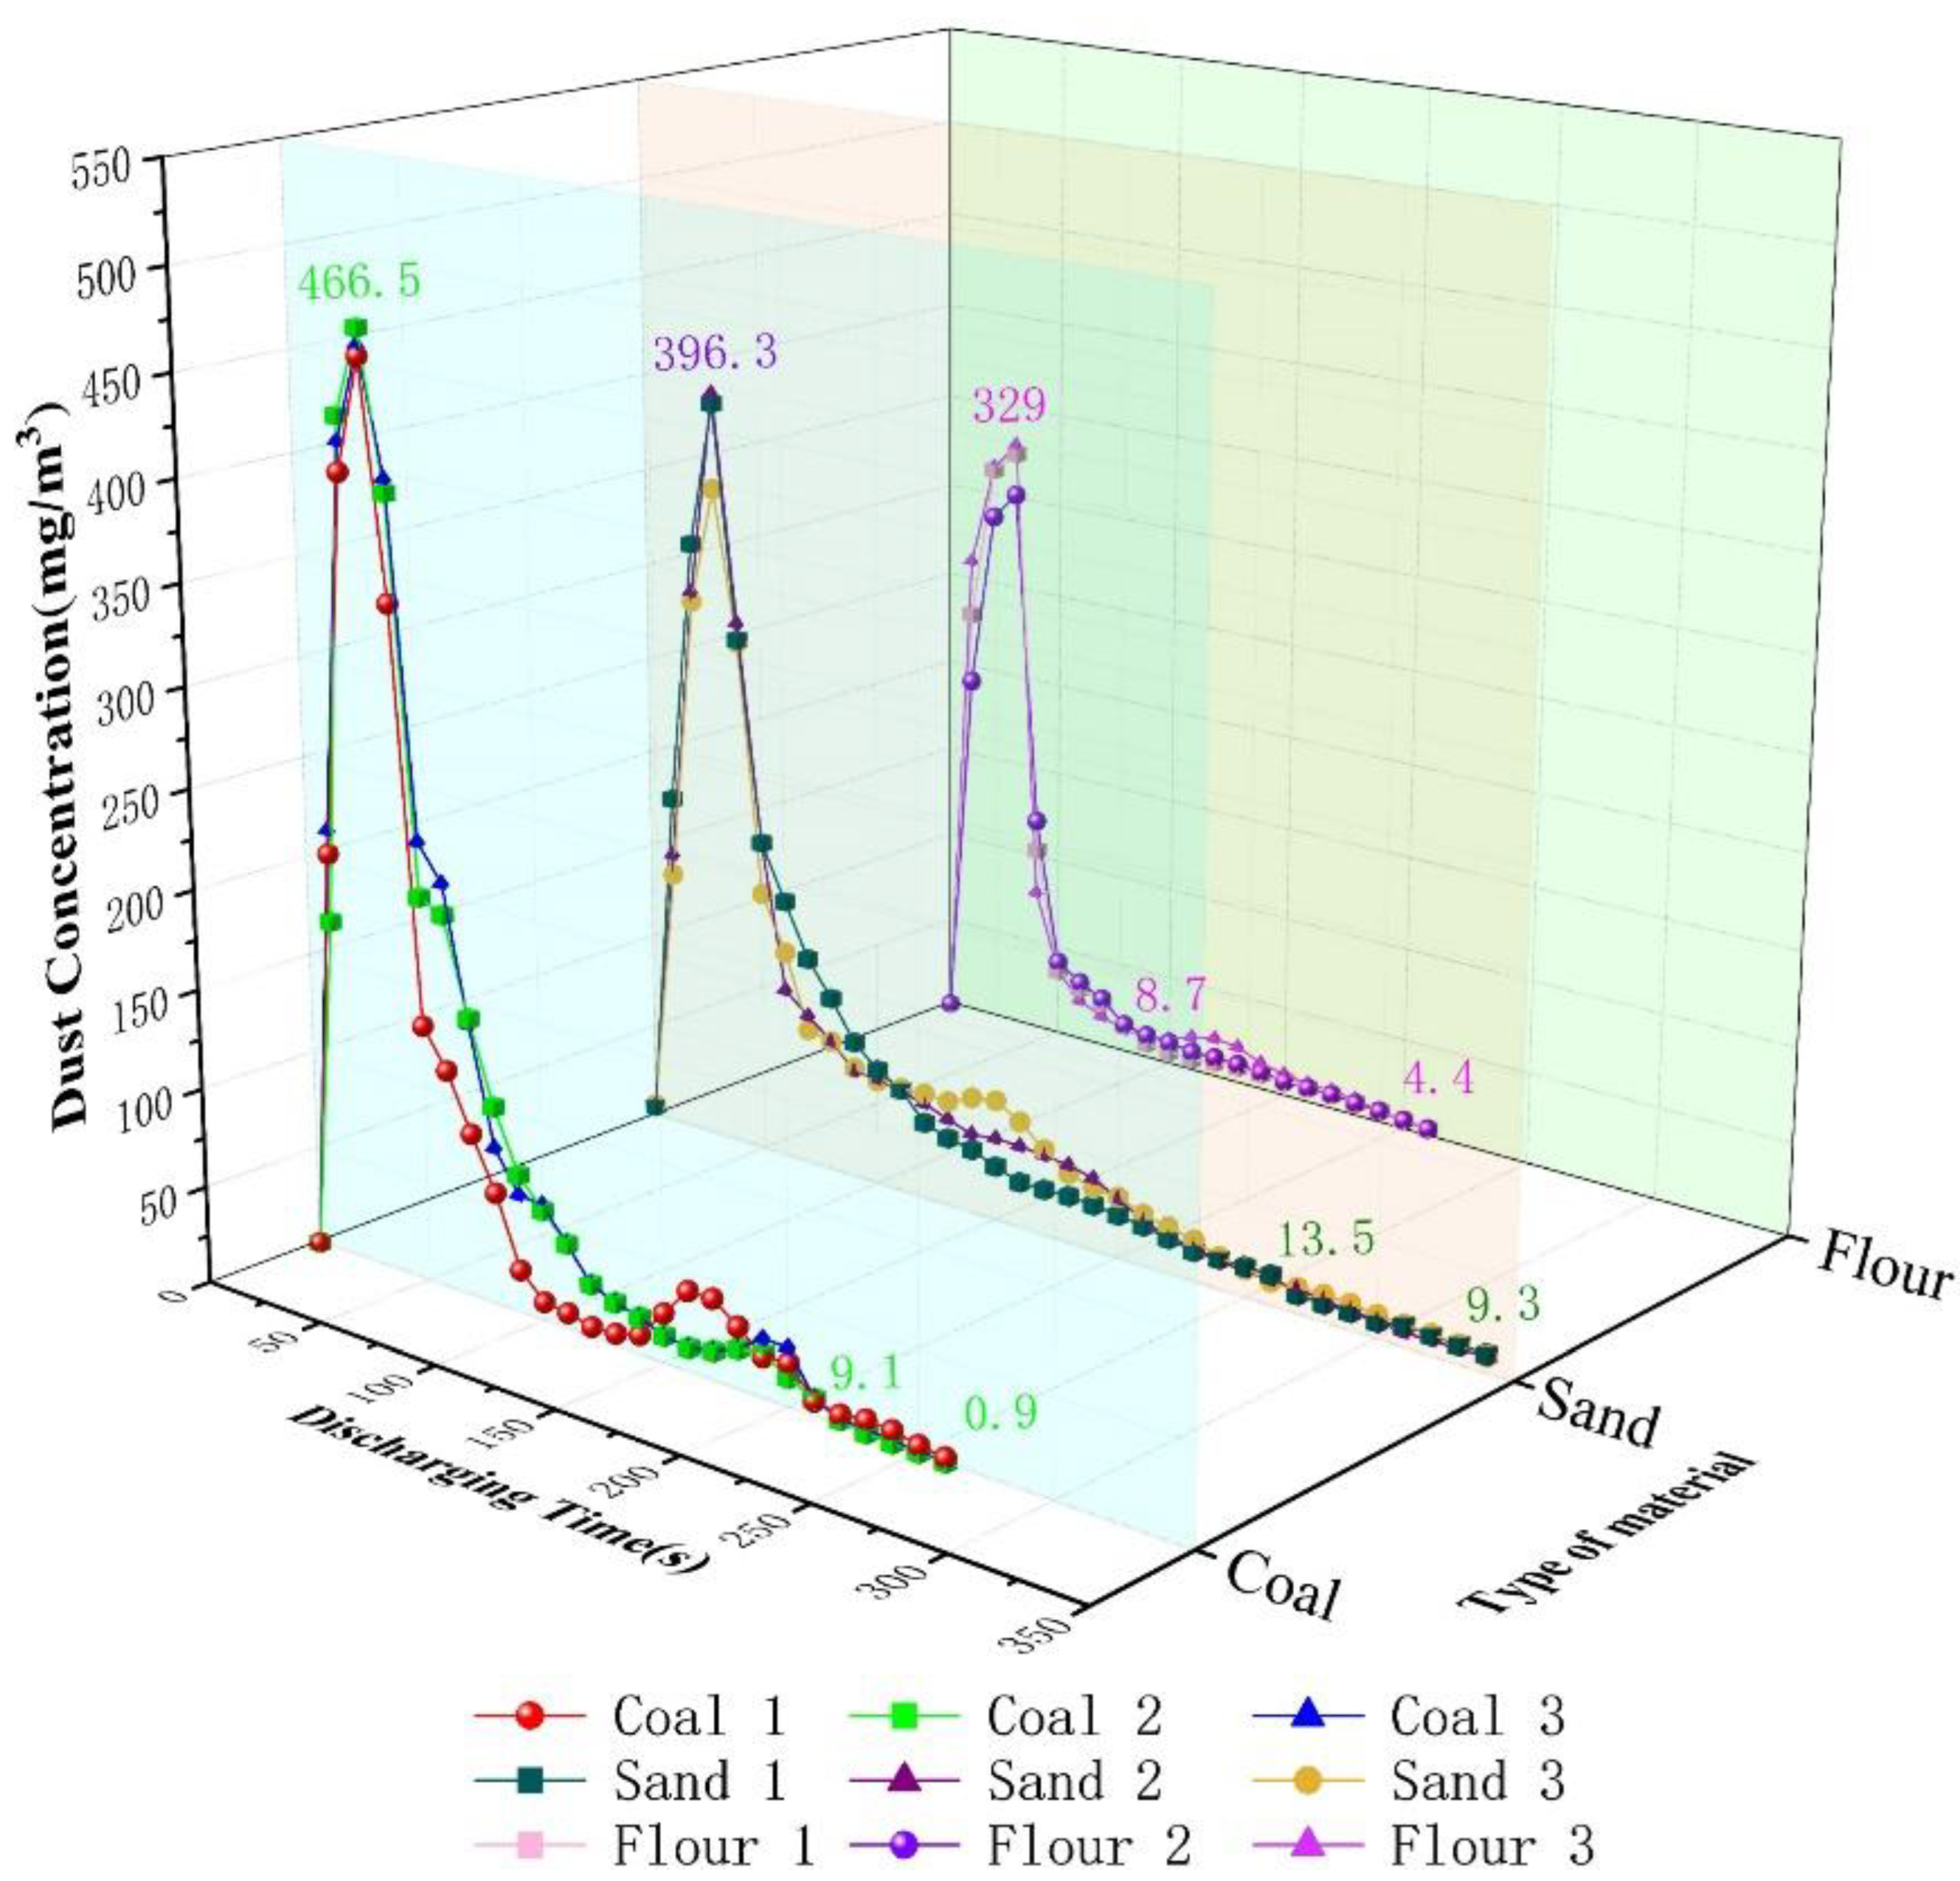
3.3. Variation Law of Dust Concentration during Unloading Process

The variation law of the dust concentration of each material at three measurement points during the unloading process was determined, and the variations in the dust concentration of different materials at the same position and the same material at different positions were compared. Multiple planning experiments were performed for each material and each measurement point, and three sets of data with the same law were obtained as the measurement results.
According to the loading and unloading characteristics of the grab and the corresponding law of unloading fugitive dust, the dust in the open area of the grab is easier to gather and diffuse, and the dust in the open area of the grab is low in concentration and weak in diffusion. In addition, the diffusion of dust above the grab is strong, and the law of dust diffusion above the grab needs to be further studied. Therefore, on the premise of not affecting the unloading of bulk materials, three typical measuring points are selected accordingly. The positions of the three measurement points are shown in Figure 7, where measurement points 1 and 3 are the midpoints of the width and length directions of the hopper mouth plane, respectively, and measurement point 2 is located 450 mm above measurement point 1. The three measuring points can, respectively, reflect the change law of dust concentration on the surface corresponding to the opening direction of the grab, the change law of dust concentration on the surface parallel to the opening direction of the grab, and the change and diffusion law of dust concentration above the grab. Three typical measuring points were used to comprehensively reflect the distribution of dust concentration and its change with time during the unloading process.
(1)
Variation law of dust concentration at measurement point 1.
As shown in Figure 7a, measurement point 1 was located at the midpoint of the width of the hopper mouth and could measure the variation law of the dust concentration of the corresponding surface in the opening direction of the grab.
As shown in Figure 8, during the unloading of coal, sand, and flour, the dust concentration rapidly increased and then slowly decreased, reaching a maximum value at 30 s, with dust concentrations of 850, 1874, and 1589.3 mg/m3, respectively. The dust concentrations of coal, sand, and flour during the 20–50 s, 10–130 s, and 10–120 s periods were greater than 100 mg/m3, indicating a high concentration state. In addition, the dust content of the coal dropped to approximately 4.9 mg/m3 at 150 s, then fluctuated slightly from 150–310 s, and finally dropped to 0 mg/m3, indicating that the dust settled completely at 150 s. The dust of flour dropped to approximately 62.6 mg/m3 at 220 s, then dropped slightly during 220–520 s, and dropped to 49.5 mg/m3 at 520 s. During this period, a small amount of dust was in a state of suspension, but most of the dust was completely settled, and it would be completely settled with time. For convenience of comparison, it can be considered that the dust was completely settled at 220 s. The dust of sand dropped to 62.1 mg/m3 at 370 s, then fluctuated slightly during 370–550 s, and the dust concentration at 550 s was about 61.4 mg/m3. During this period, a small amount of dust was in a state of suspension, but most of the dust completely settled, and it would completely settle with the passage of time. For convenience of comparison, it can be considered that the dust settled completely at 370 s.
The maximum concentrations in descending order are as follows: sand, flour, and coal. The duration of the high concentration in descending order is as follows: sand, flour, and coal. The settling times of the dust are in the following descending order: sand, flour, and coal.
(2)
Variation law of dust concentration at measurement point 2.
As shown in Figure 7b, measurement point 2 is located 450 mm above measurement point 1. This point is located above the grab and can measure the variation law of the dust concentration above the grab.
As shown in Figure 9, during the unloading process of coal, sand, and flour, the dust concentration rapidly increased and then slowly decreased, reaching a maximum value at 30 s, with dust concentrations of 220.5, 830.3, and 341.4 mg/m3, respectively. The dust concentrations of coal, sand, and flour during the periods 20–40 s, 10–80 s, and 10–30 s were greater than 100 mg/m3, indicating a high concentration state. In addition, the coal dust dropped to approximately 4.9 mg/m3 at 70 s, then fluctuated slightly from 70 s to ~250 s, and finally dropped to 0 mg/m3, so it can be considered to have settled completely at 70 s. The dust of flour dropped to approximately 23.5 mg/m3 at 40 s, then dropped slightly during 40–300 s, and dropped to 17 mg/m3 at 300 s. During this period, a small amount of dust was in a state of suspension, but most of the dust was completely settled, and the remaining would be completely settled as time passed. For convenience of comparison, it can be considered that the dust was completely settled at 40 s. The dust of sand dropped to 56.1 mg/m3 at 150 s, then fluctuated slightly during 150–300 s, and the dust concentration at 300 s was approximately 31 mg/m3. During this period, a small amount of dust was in a state of suspension, but most of the dust was completely settled, and the remaining would completely settle as time passed. For convenience of comparison, it can be considered that the dust settled completely at 150 s.
The maximum concentrations in descending order are as follows: sand, flour, and coal. The duration of the high concentration in descending order is as follows: sand, flour, and coal. The settling times of the dust are in the following descending order: sand, coal, and flour.
(3)
Variation law of dust concentration at measurement point 3.
As shown in Figure 7c, measurement point 3 was located at the midpoint in the length direction of the hopper mouth and could measure the variation law of the dust concentration of the corresponding surface parallel to the opening direction of the grab.
As shown in Figure 10, during the unloading process of coal, sand, and flour, the dust concentration rapidly increases and then slowly decreases, reaching the maximum value at 30 s, with dust concentrations of 466.5, 391.2, and 324.3 mg/m3, respectively. The dust concentrations of coal, sand, and flour during the 10–80 s, 10–70 s, and 10–40 s periods were greater than 100 mg/m3, indicating a high concentration state. In addition, the dust of coal dropped to approximately 9.1 mg/m3 at 210 s, then dropped slightly during 210–260 s, and finally dropped to 0.9 mg/m3; it can be considered that the dust settled completely at 210 s. The dust of flour dropped to approximately 8.7 mg/m3 at 90 s, then dropped slightly during 90–210 s, and dropped to 4.4 mg/m3 at 210 s; it can be considered that the dust completely settled at 90 s. The dust of sand dropped to 13.5 mg/m3 at 270 s, then dropped slightly during 270–340 s, and the dust concentration at 340 s is approximately 9.3 mg/m3. It can be considered that the dust settled completely at 270 s.
The maximum concentrations in descending order are as follows: coal, sand, and flour. The duration of high concentration in descending order is as follows: coal, sand, and flour. The settling times of the dust are in the following descending order: sand, coal, and flour.
As shown in Figure 11, by summarising the dust concentration-related characteristics of the three measurement points, the following conclusions can be drawn.
Measurement point 2 is located 450 mm above measurement point 1, which reflects the degree of dust diffusion in the height direction. The results showed that the maximum concentration, settling time, and duration of the high-concentration state of the three materials at measurement point 1 were much greater than those at measurement point 2. In other words, for measurement points with the same horizontal coordinates and higher positions, the maximum concentration of dust was low, the settling time was short, and the duration of the high-concentration state was short. The maximum concentrations of the three materials at the two measurement points in descending order are as follows: sand, flour, and coal.
The vertical coordinates of measurement points 1 and 3 were the same, and the horizontal positions were at the midpoint of the width direction (located on the corresponding surface in the opening direction of the grab) and the midpoint of the length direction (located on the corresponding surface parallel to the opening direction of the grab) of the hopper mouth plane. The results showed that the maximum dust concentration of the three materials at measurement point 1 was much higher than that at measurement point 3, where the dust concentration difference of sand was the largest, followed by that of flour and coal. The settling time and duration of the high-concentration states of sand and flour at measurement point 1 were greater than those at measurement point 3. The settling time and duration of the high-concentration state of the coal at measurement point 1 were similar to those at measurement point 3. The results showed that the dust content near the corresponding surface of the grab-opening direction was relatively large, the dust content near the corresponding surface parallel to the grab-opening direction was relatively small, and the dust was more likely to spread near the corresponding surface in the grab-opening direction.

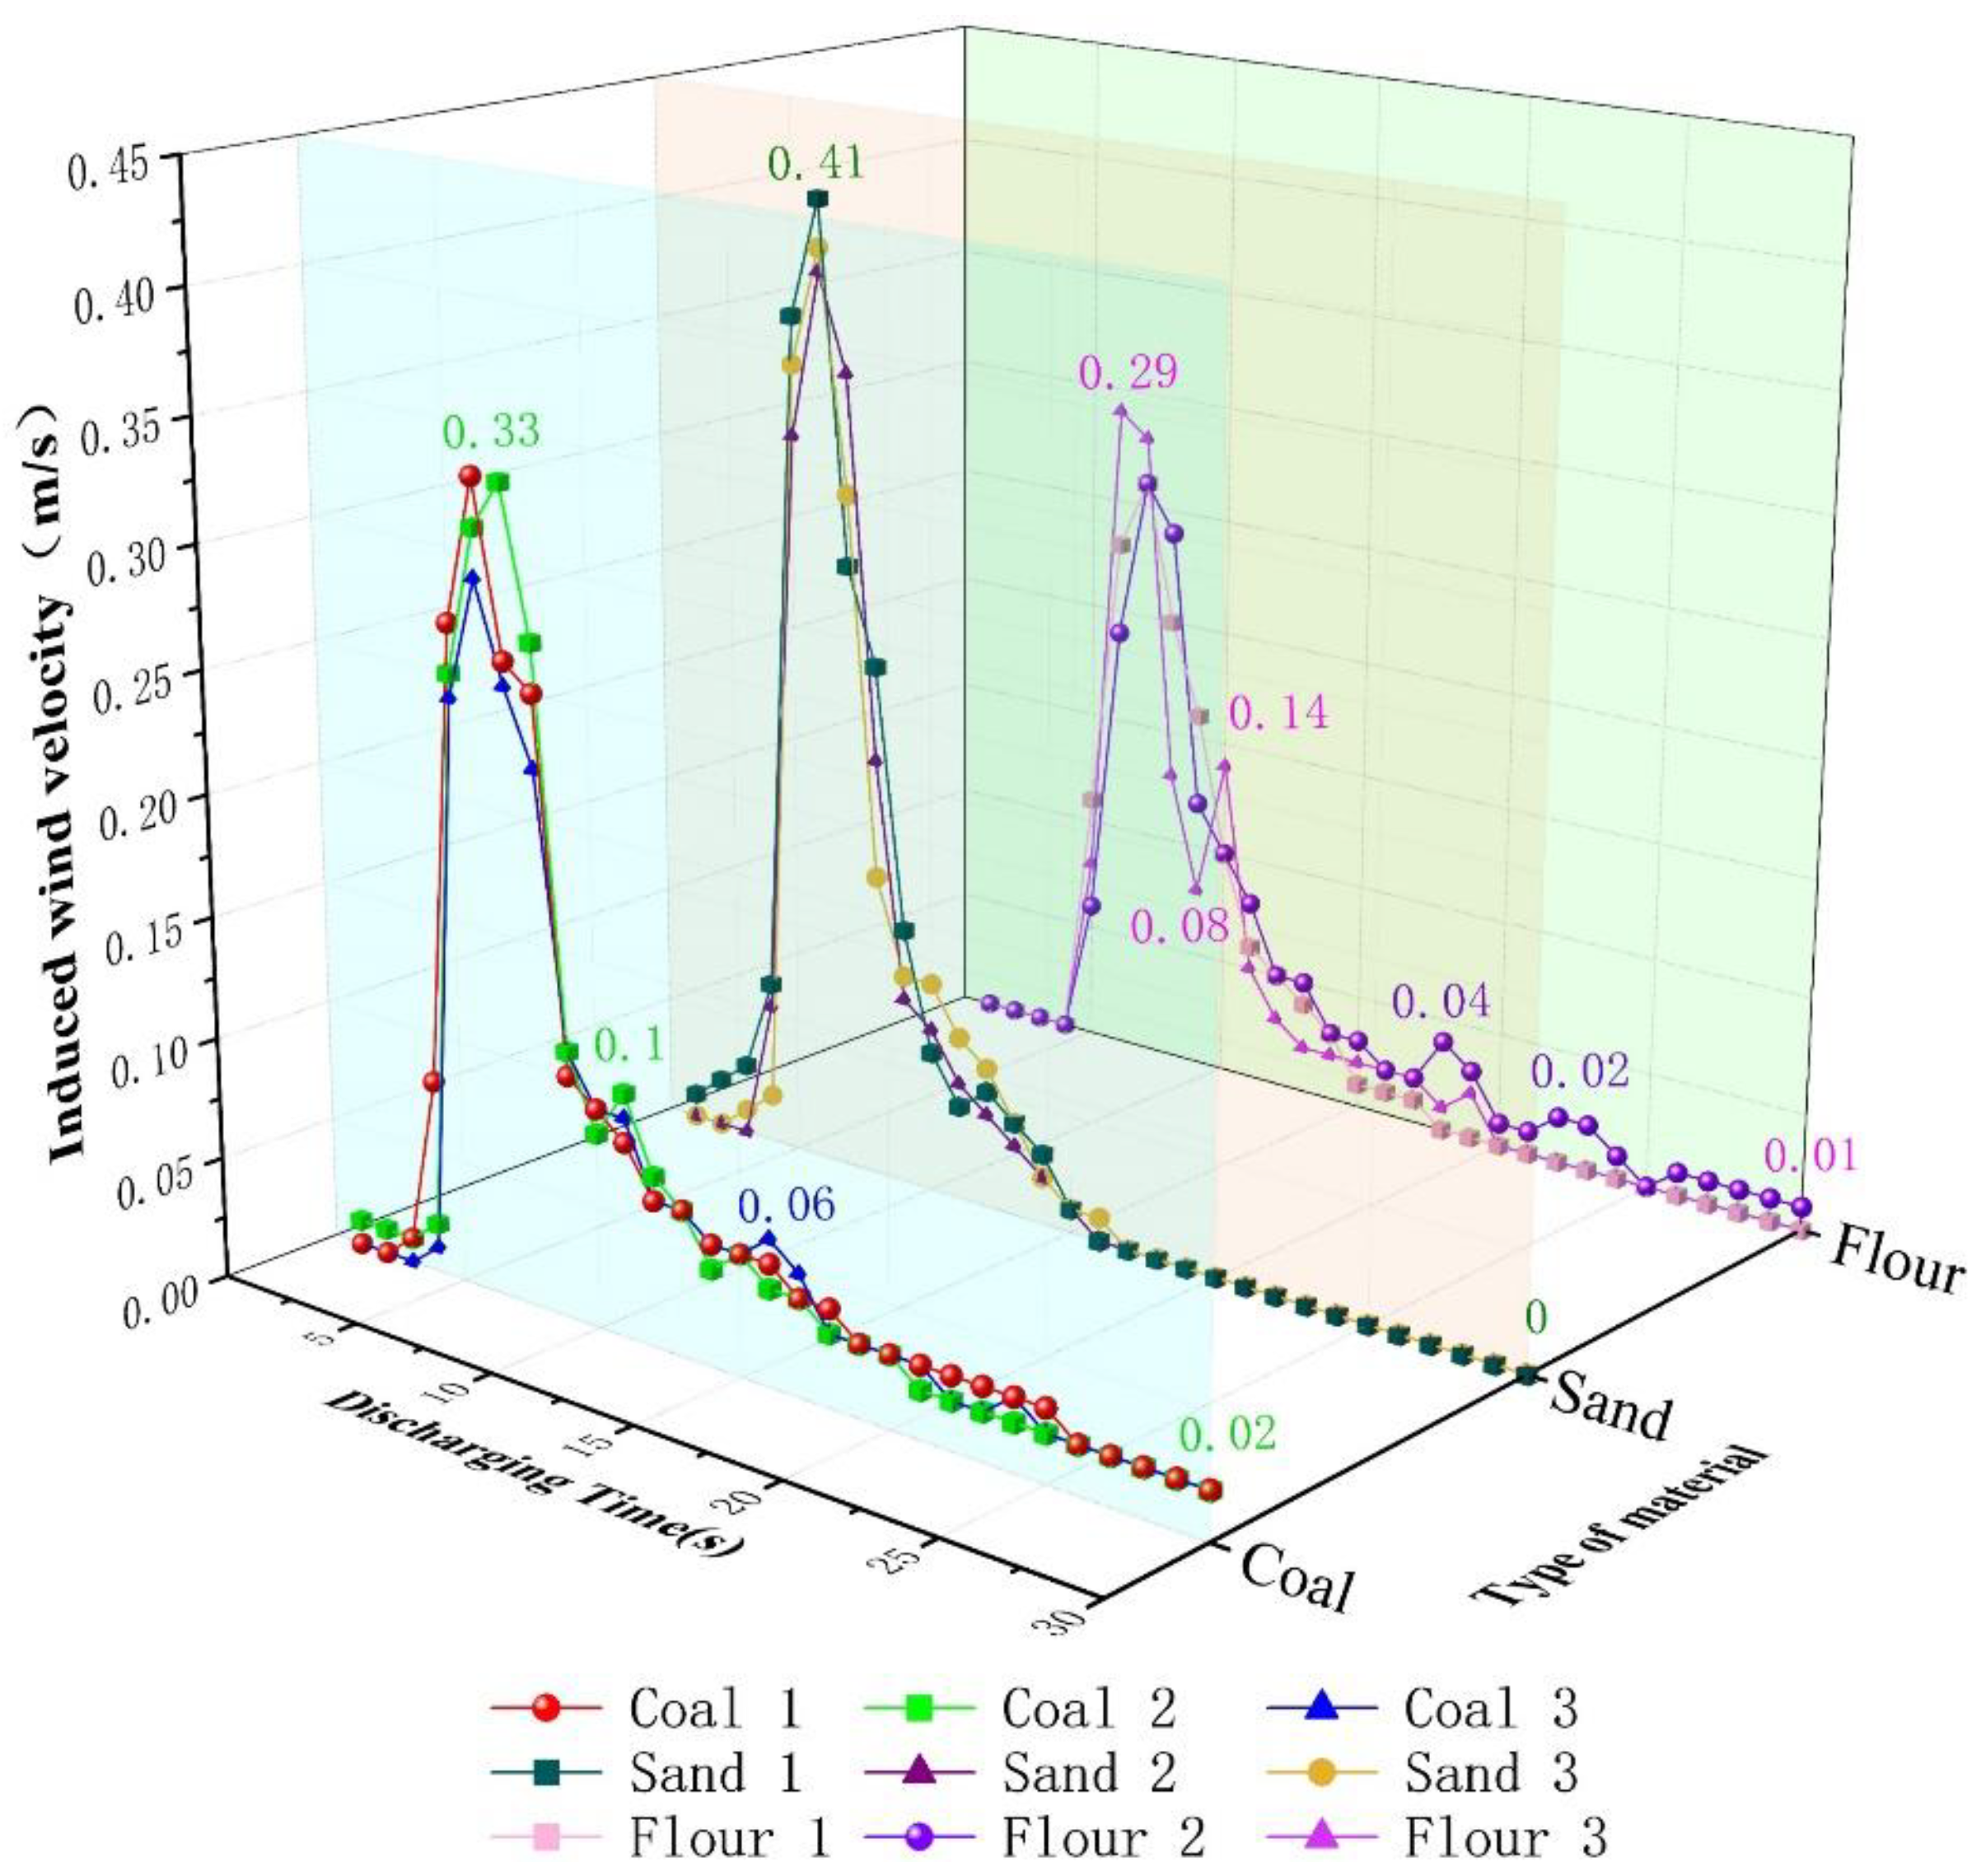
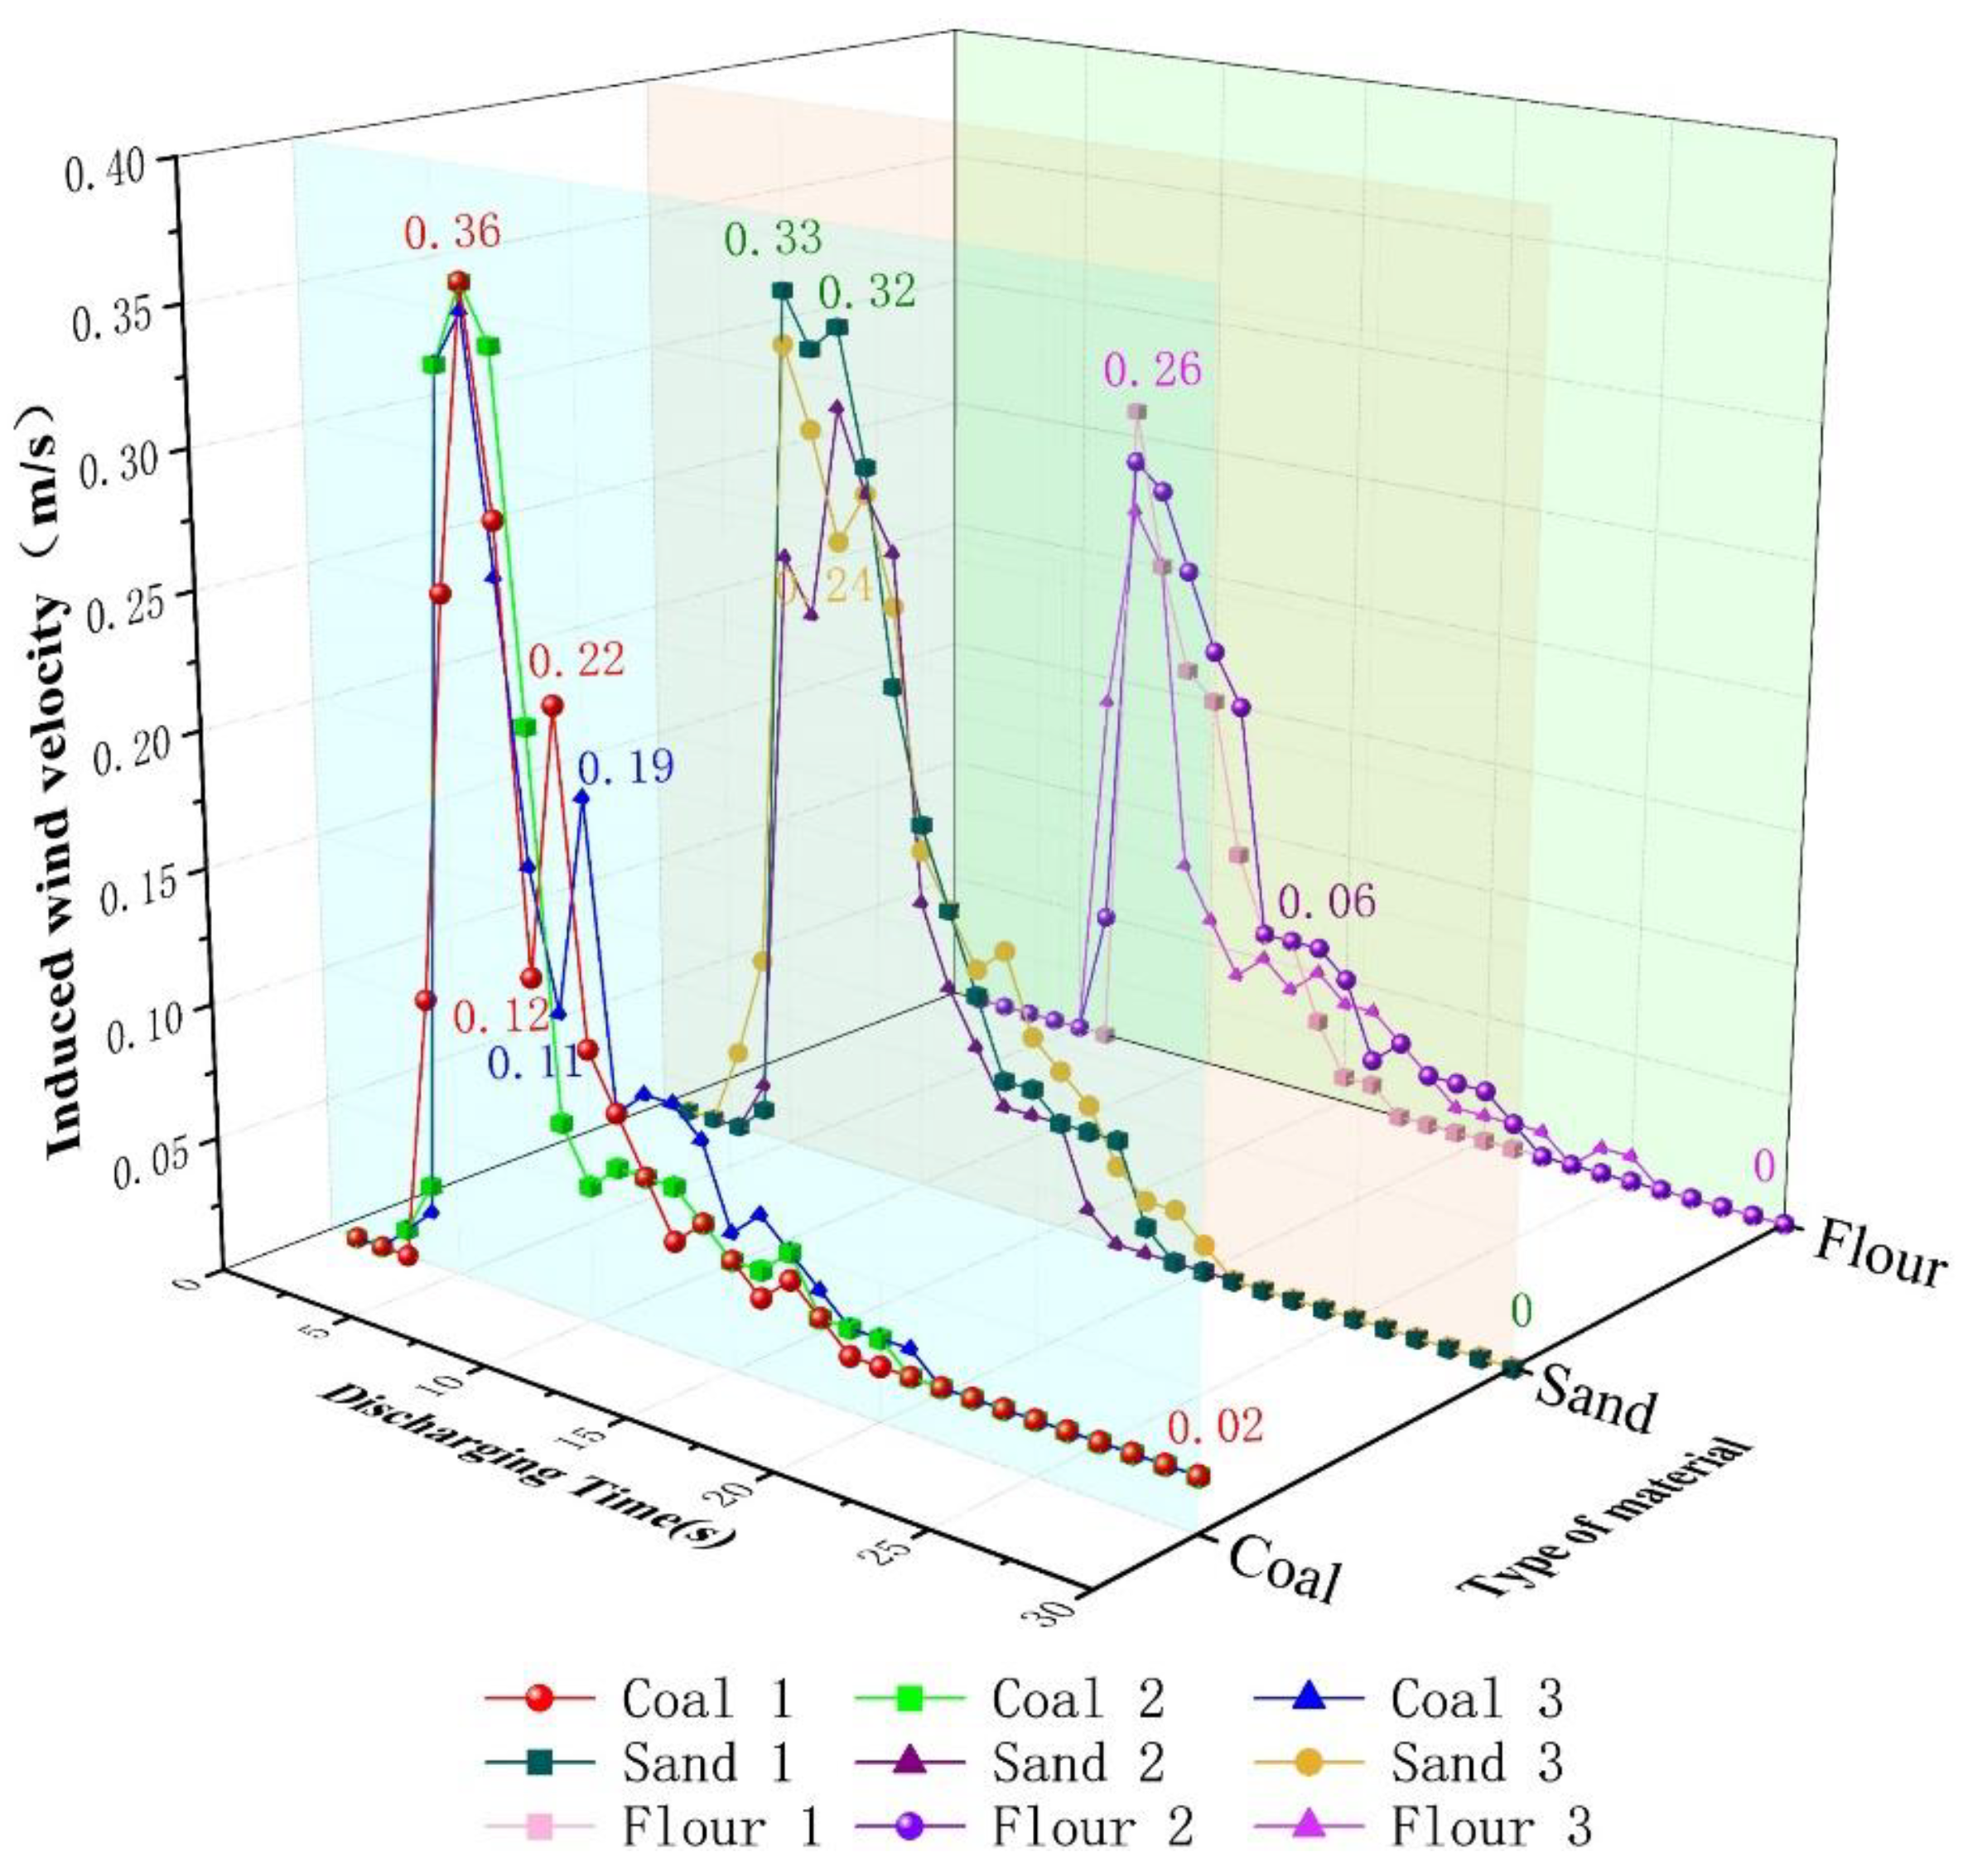
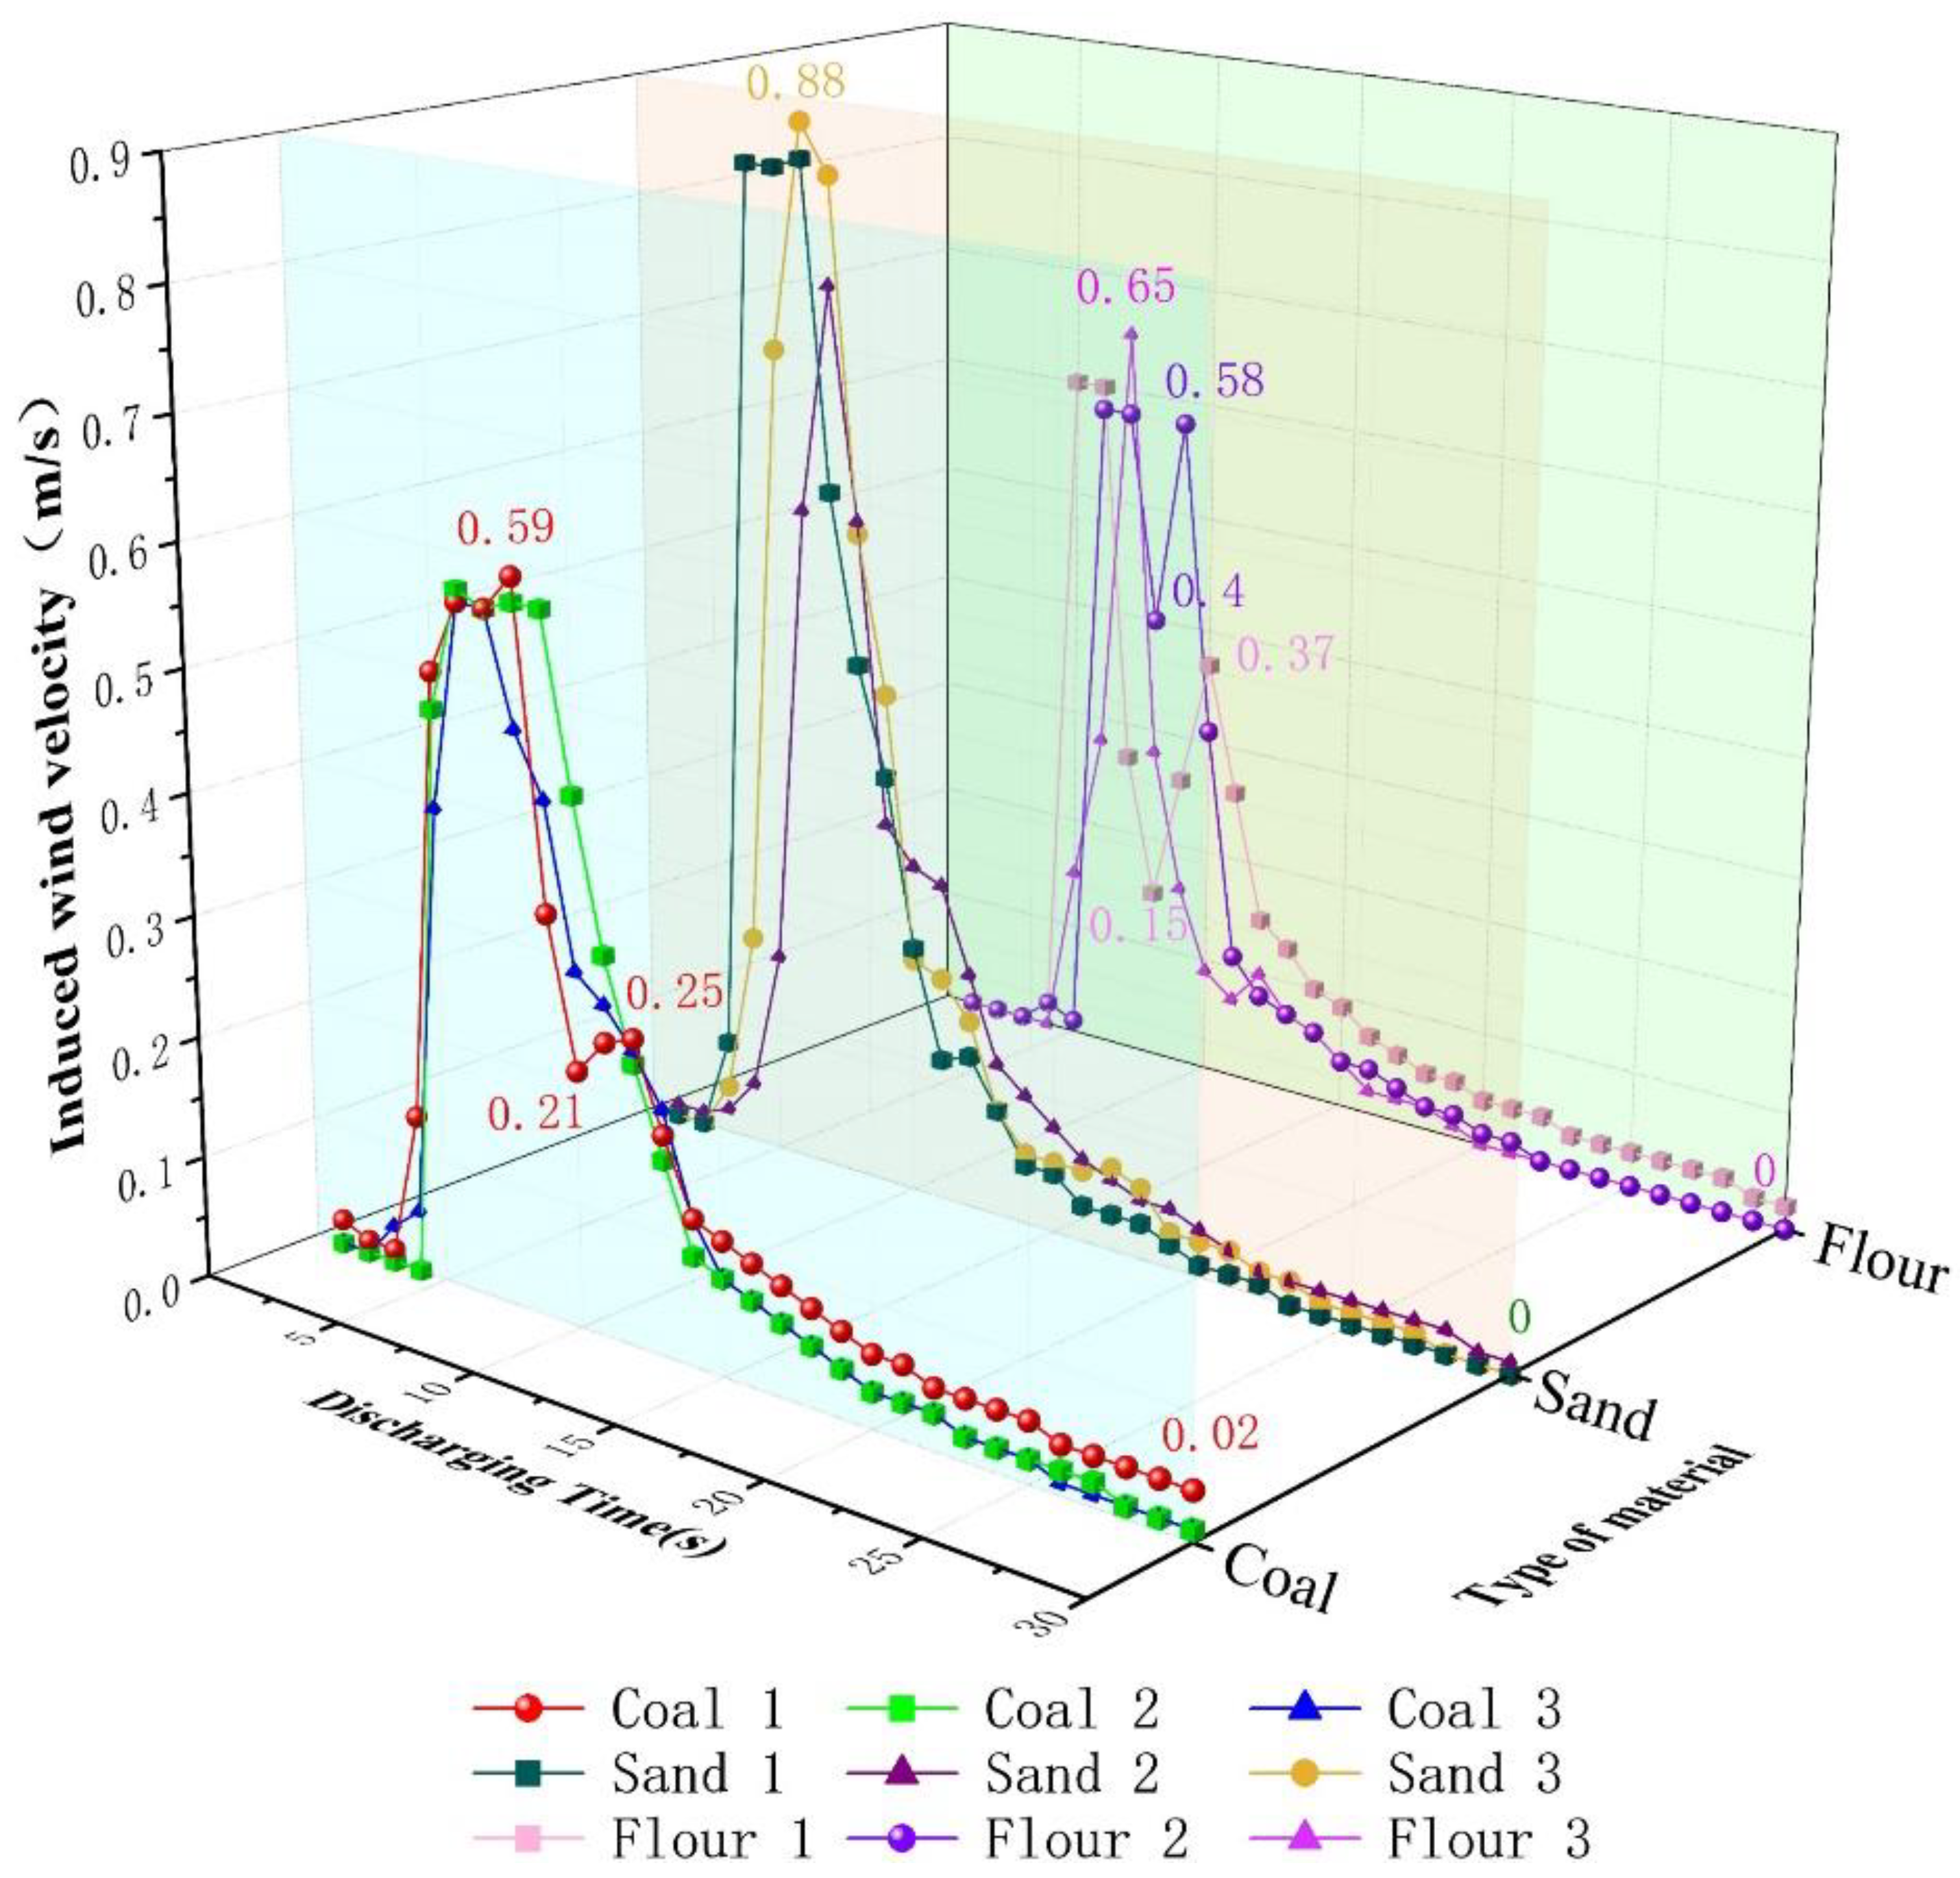
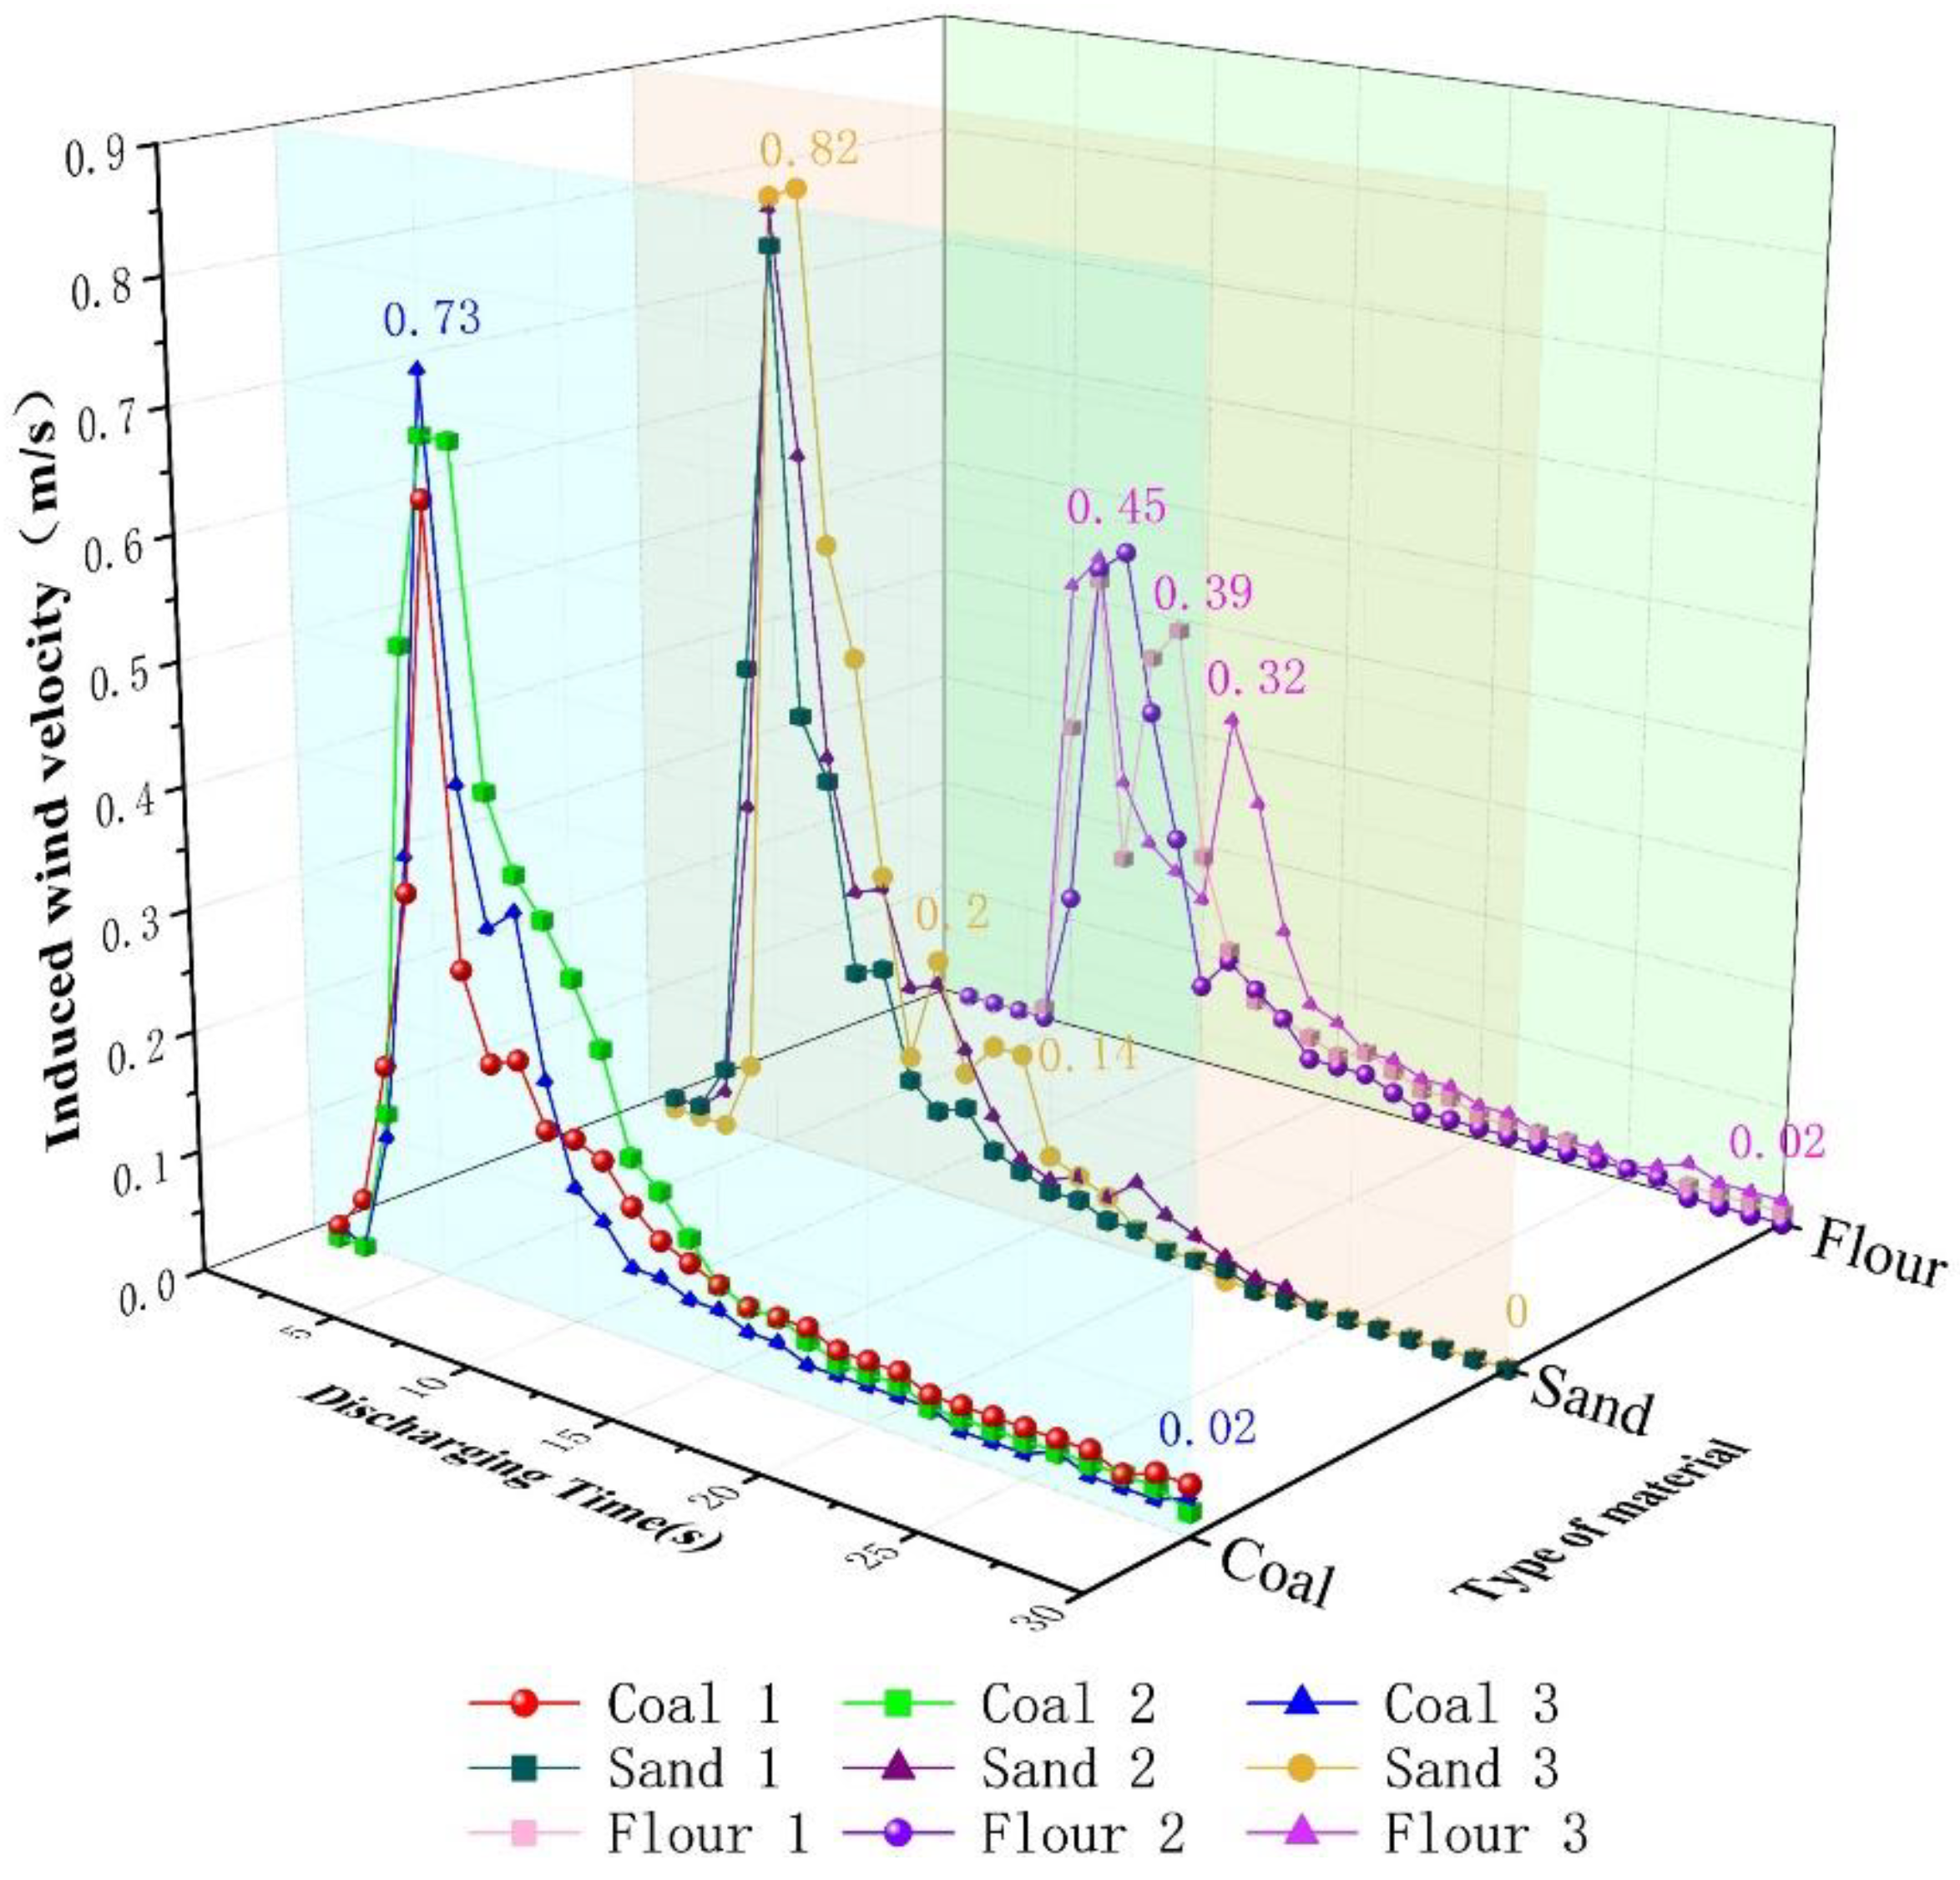
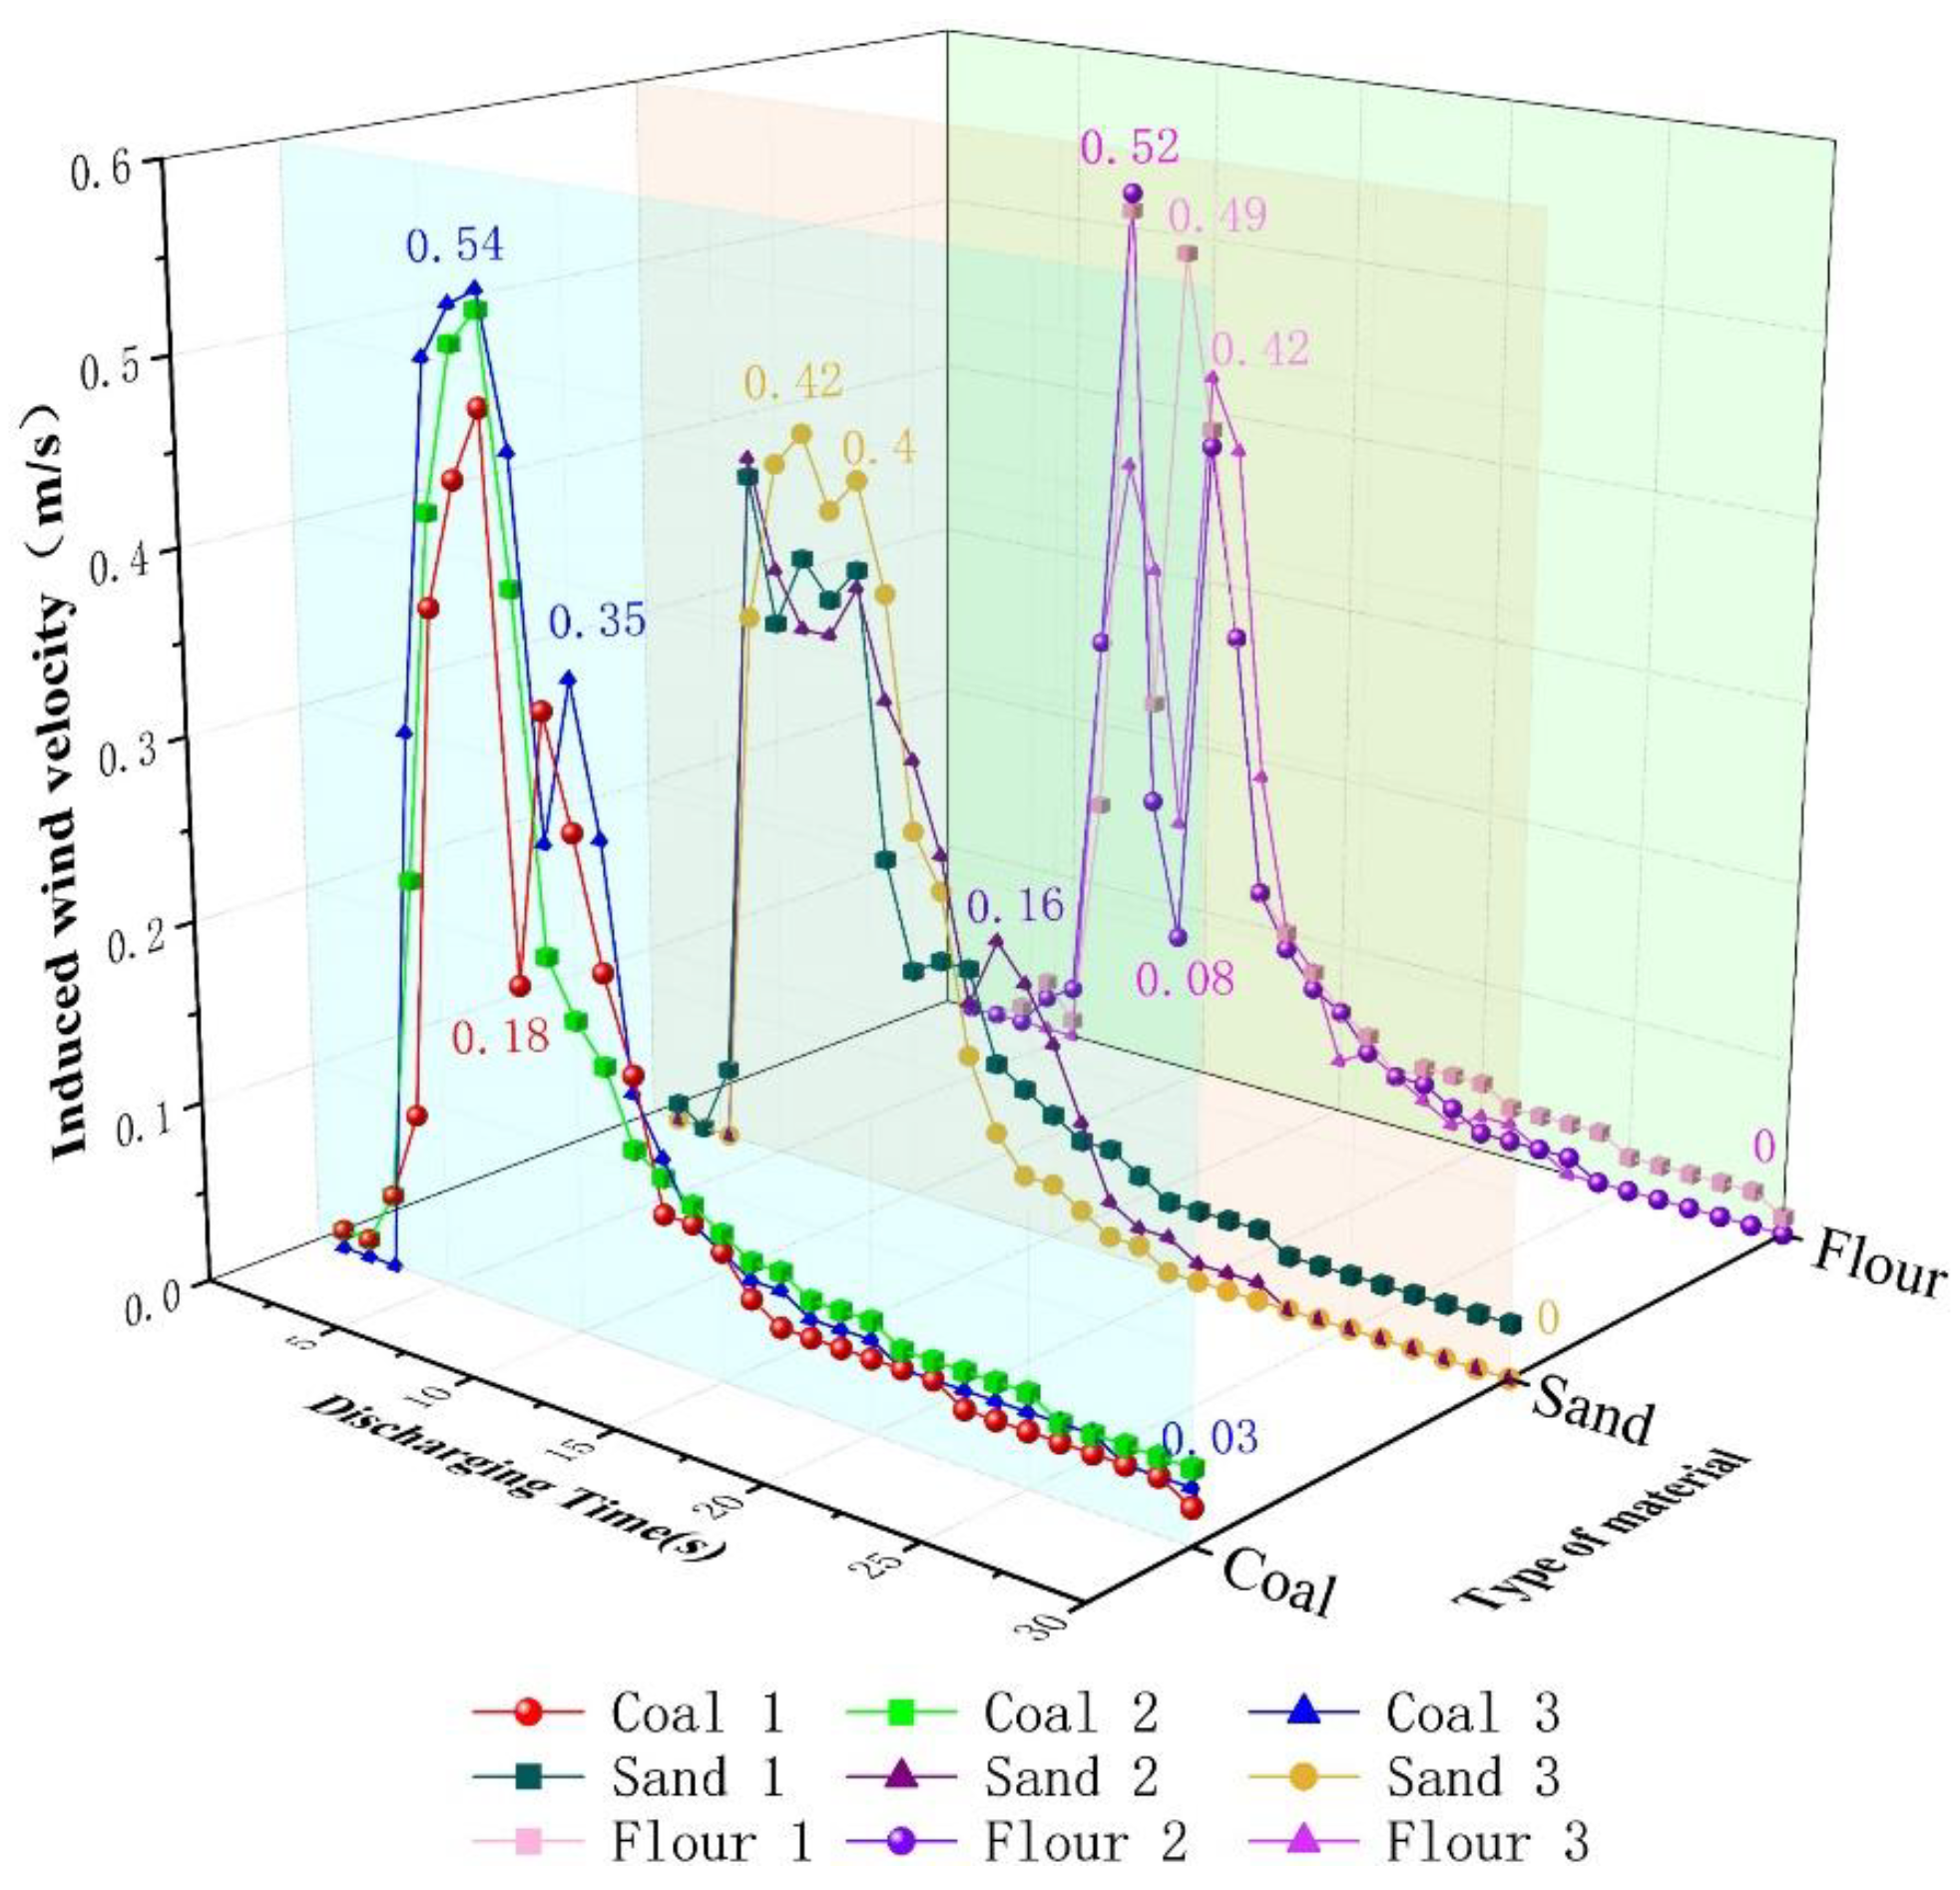
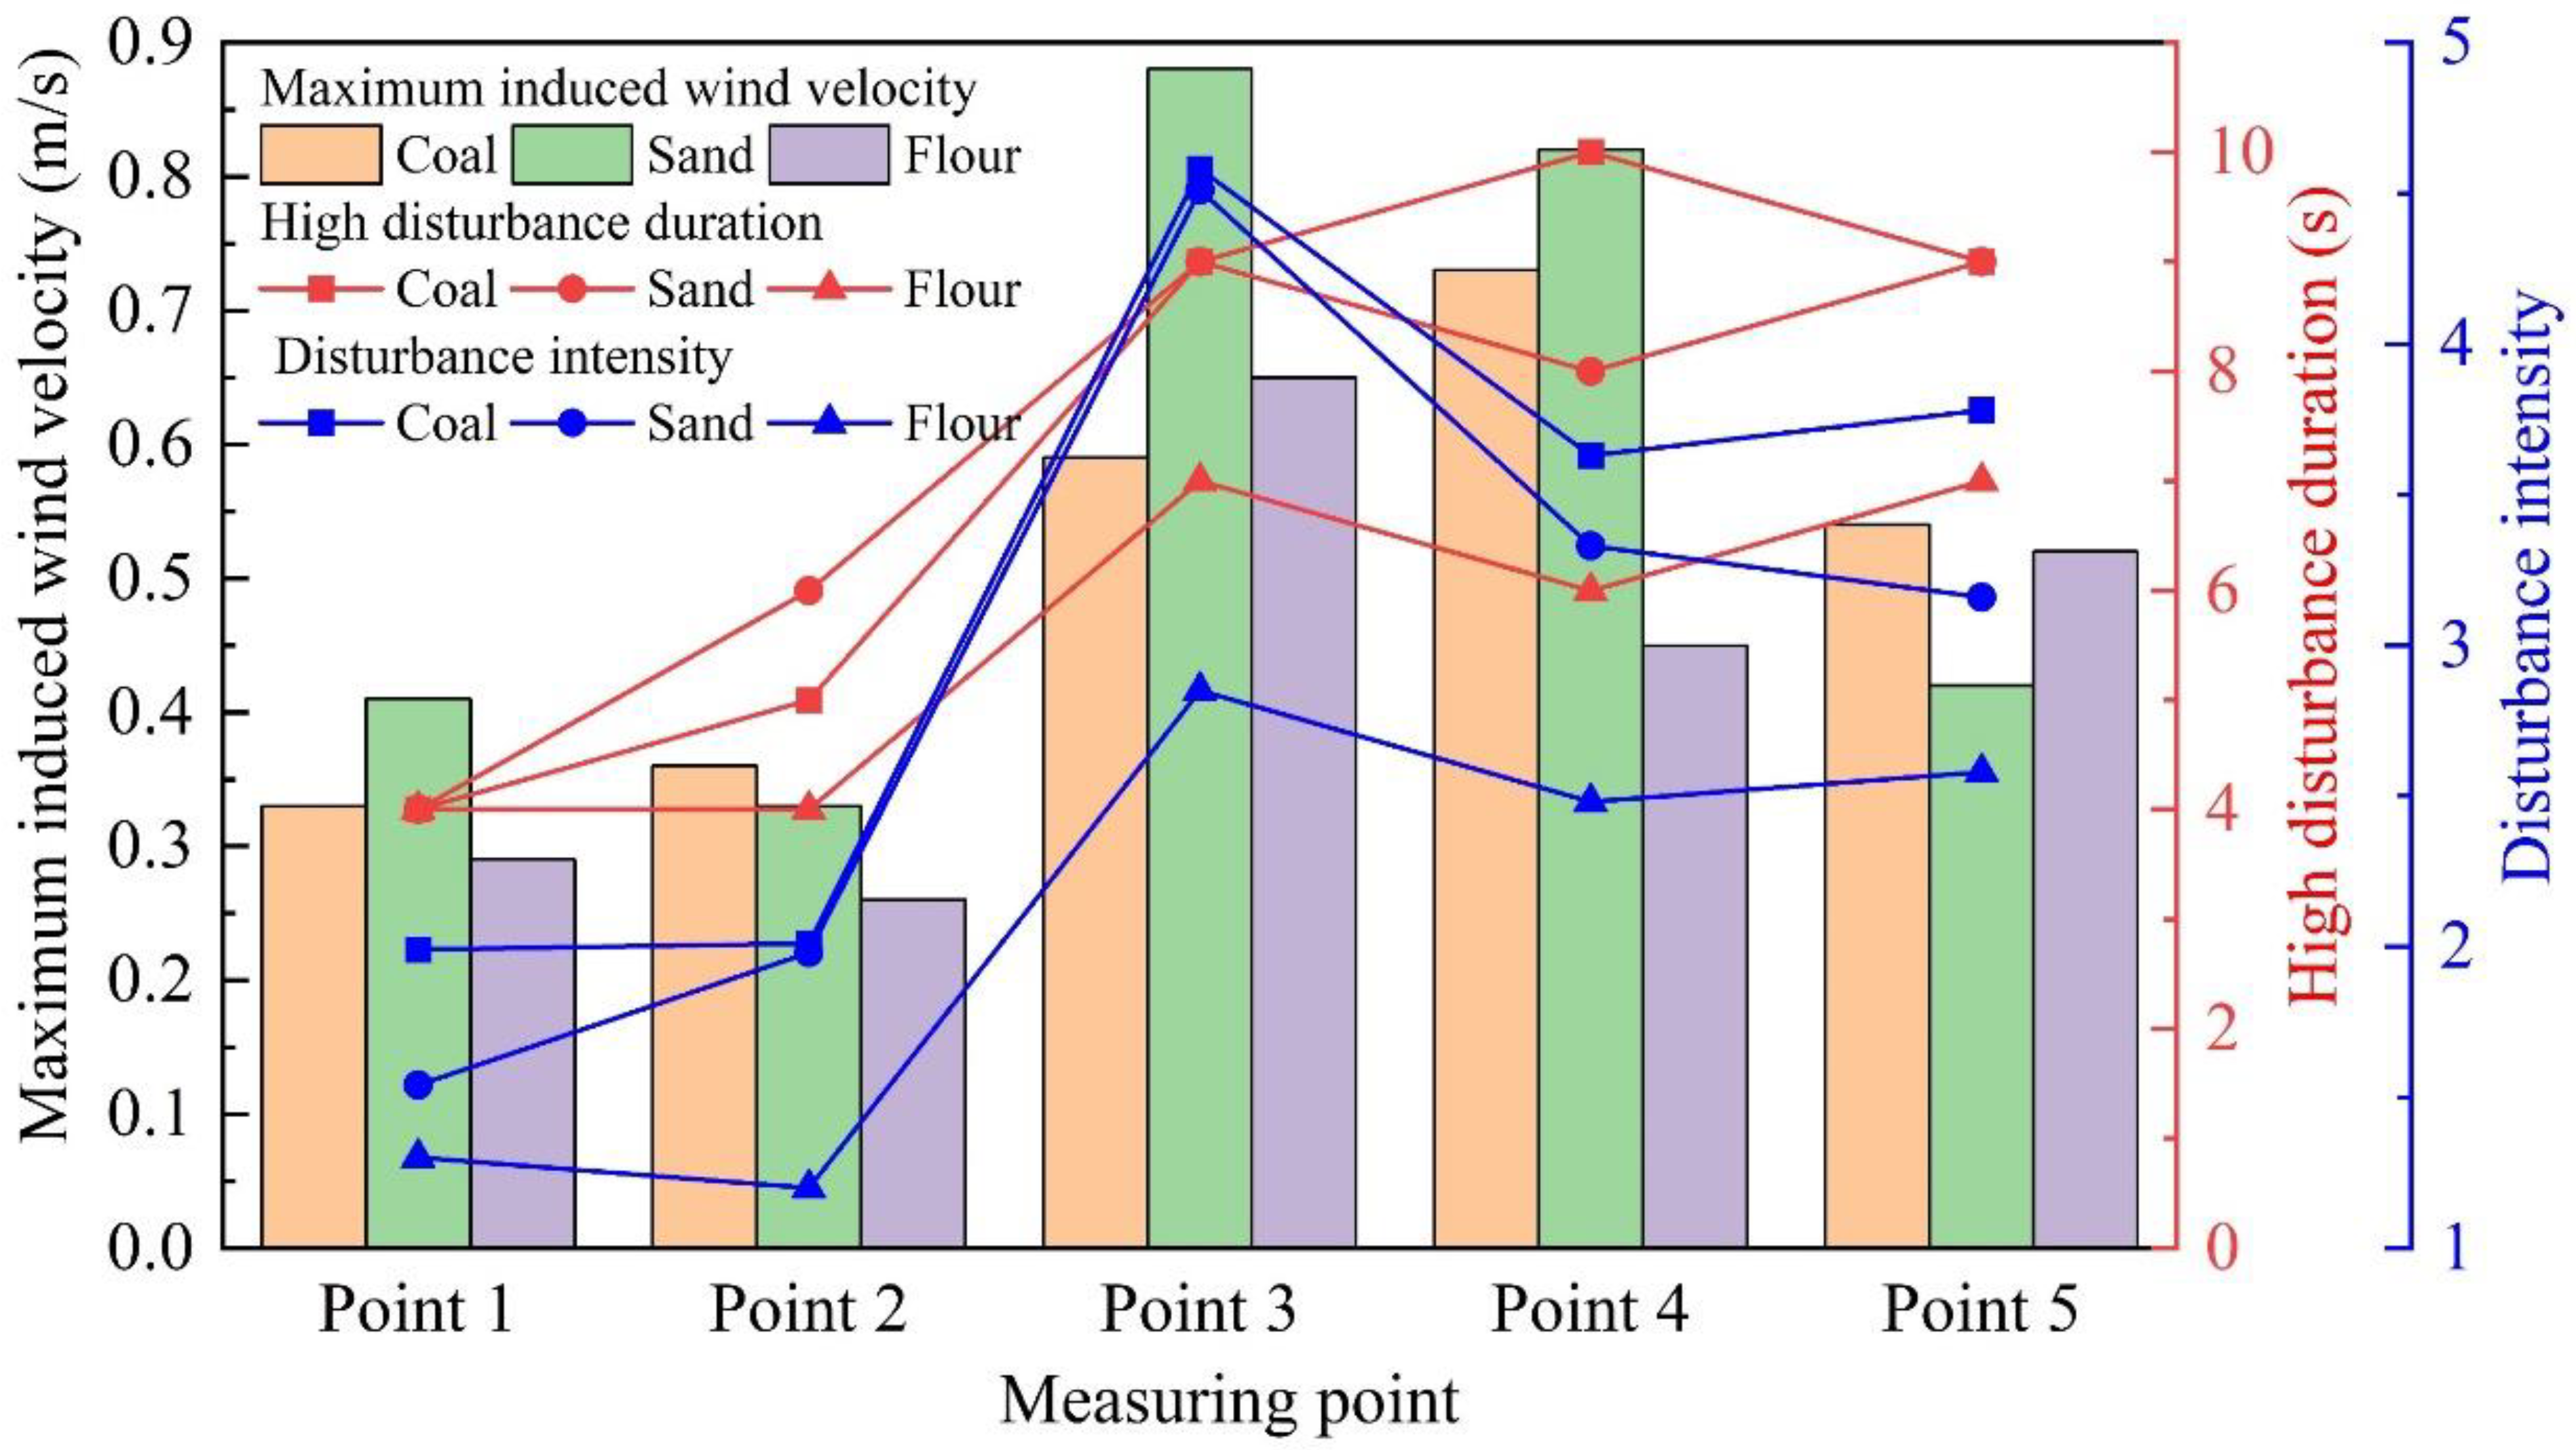
3.4. Variation Law of Induced Wind Velocity during Unloading Process

The grab was placed at the centre position directly above the hopper, and the falling material flow exhibited an axisymmetric distribution during the unloading process. To explore the variation law of the induced wind velocity of the hopper mouth plane and avoid the impact of the material flow on the anemometer during the unloading process, five measurement points were selected in the experiment, all of which were located in the hopper mouth plane. As shown in Figure 12, to eliminate the influence of the Coanda effect on the results, the measurement points were all located 50 mm away from the hopper wall. Multiple planning experiments were conducted for each material and measurement point, and three sets of data with the same law were obtained as measurement results.
(1)
Variation law of induced wind velocity at measurement point 1.
Measurement point 1 was located 50 mm inward from the midpoint of the length of the hopper mouth, and the induced wind velocities of the three types of materials at measurement point 1 were tested.
As shown in Figure 13, during the unloading process of coal, sand, and flour, the induced wind velocities rapidly increased and then slowly decreased, reaching a maximum value during 6–7 s, with maximum values of 0.33, 0.41, and 0.29 m/s, respectively. The induced wind velocities of coal, sand, and flour during the periods 5–9 s, 5–9 s, and 6–10 s were greater than 0.1 m/s and were at the time of a large disturbance. The integral of the induced wind velocities of coal, sand, and flour with time reflected the disturbance intensity of the dust, which was 1.99, 1.54, and 1.30, respectively.
(2)
Variation law of the induced wind velocity at measurement point 2
Measurement point 2 was located 50 mm inward from the midpoint of the width of the hopper mouth, and the induced wind velocities of the three types of materials at measurement point 2 were tested.
As shown in Figure 14, during the unloading process of coal, sand, and flour, the induced wind velocities rapidly increased and then slowly decreased, reaching their maximum values during 6–7 s, with maximum values of 0.36, 0.33, and 0.26 m/s, respectively. The induced wind velocities of coal, sand, and flour during the periods 5–10 s, 5–11 s, and 7–11 s were greater than 0.1 m/s and were at the time of a large disturbance. The integral of the induced wind velocities of coal, sand, and flour with time reflects the disturbance intensity of the dust, which was 2.01, 1.98, and 1.20, respectively.
(3)
Variation law of induced wind velocity at measurement point 3
Measurement point 3 was located at the corner of the hopper mouth, diagonally inward at 50 mm, and the induced wind velocities of the three types of materials at measurement point 3 were tested.
As shown in Figure 15, during the unloading process of coal, sand, and flour, the induced wind velocities rapidly increased and then slowly decreased, reaching their maximum value during 6–7 s, with maximum values of 0.59, 0.88, and 0.65 m/s, respectively. The induced wind velocities of coal, sand, and flour during the periods 5–14 s, 4–13 s, and 5–12 s were greater than 0.1 m/s and were at the time of a large disturbance. The integral of the induced wind velocities of coal, sand, and flour with time reflected the disturbance intensity of the dust, which was 4.58, 4.51, and 2.85, respectively.
(4)
Variation law of induced wind velocity at measurement point 4
Measurement point 4 was located 50 mm inward from the position of 1/4 of the length of the hopper mouth, and the induced wind velocities of the three types of materials at measurement point 4 were tested.
As shown in Figure 16, during the unloading of coal, sand, and flour, the induced wind velocities rapidly increased and then slowly decreased, reaching their maximum value during 5–6 s, with maximum values of 0.73, 0.82, and 0.45 m/s, respectively. The induced wind velocities of coal, sand, and flour during the periods 3–13 s, 4–12 s, and 5–11 s were greater than 0.1 m/s and were at the time of a large disturbance. The integral of the induced wind velocities of coal, sand, and flour with time reflected the disturbance intensity of the dust, which was 3.63, 3.33, and 2.48, respectively.
(5)
Variation law of induced wind velocity at measurement point 5
Measurement point 5 was located 50 mm inward from the position of 1/4 of the width of the hopper mouth, and the induced wind velocities of the three types of materials at measurement point 5 were tested.
As shown in Figure 17, during the unloading process of coal, sand, and flour, the induced wind velocities rapidly increased and then slowly decreased, reaching their maximum value during 4–7 s, with maximum values of 0.54, 0.42, and 0.52 m/s, respectively. The induced wind velocities of coal, sand, and flour during the periods 4–13 s, 4–13 s, and 6–13 s were, respectively, greater than 0.1 m/s, and were at the time of a large disturbance. The integral of the induced wind velocities of coal, sand, and flour with time reflected the disturbance intensity of the dust, which was 3.78, 3.16, and 2.58, respectively.
Comparing the induced wind velocity curves of the three materials at the five measurement points, it was found that the induced wind velocity curves of flour fluctuated greatly, whereas those of sand and coal fluctuated slightly. This was related to the viscosity and fluidity of the material. Materials with higher viscosity and poorer fluidity exhibit more fluctuations and jumps and greater amplitudes.
Summarising the induced wind velocity-related characteristics of the five measurement points, that is, the maximum induced wind velocity, duration of the larger disturbance, and disturbance intensity, as shown in Figure 18, the following can be observed:
(1)
The maximum induced wind velocity, duration of the larger disturbance, and disturbance intensity of the three materials at measurement points 3, 4, and 5 were generally higher, whereas the maximum induced wind velocity, duration of the larger disturbance, and disturbance intensity of the three materials at measurement points 1 and 2 were generally lower.
(2)
Comparing the three types of materials at the same measurement point, in terms of the maximum induced wind velocity and the disturbance intensity, the values of coal and sand are close and greater than that of flour; in terms of the duration of the large disturbance, coal and sand are close, whereas the duration of the large disturbance of flour lags behind and is short.

4. Numerical Simulation and Study of Law of Gas–Solid Two-Phase Flow Field during Grab Unloading

In the process of grab unloading, the interaction between the bulk materials, airflow field, and dust is a complex mechanical action. The interaction between the bulk material and airflow field cannot be considered using the discrete element method (DEM) alone, and dust particles cannot be added. Computational fluid dynamics (CFDs) alone cannot consider the influence of the bulk materials on the airflow field; they only consider the distribution of dust under the influence of the airflow field. Therefore, a gas–solid two-phase flow field based on CFD-DEM coupling was used to describe the motion state of the unloading process, and the movement and distribution of the dust were visually analysed.
Considering coal as the research object, the concentration distribution and diffusion law of dust in the unloading area, the motion trajectory and velocity distribution of the particle flow and airflow fields, and the air distribution law of the hopper opening plane were studied.
As shown in Figure 19, a three-dimensional model of a cuboid hopper and grab was established and imported into EDEM. As shown in Figure 20, a three-dimensional model of the fluid domain was established, and a fluid area model of unloading was imported into FLUENT. The fluid area included the grab, falling particle flow, and hopper areas; the top surface was set as the inlet, the side above the hopper was set as the outlet, and the remaining boundaries were set as the wall. The relative coordinates of the three-dimensional model in EDEM and the fluid domain model in FLUENT were consistent.

4.1. Grid Division and Independence Verification

Because the quantity and quality of the grids will affect the numerical simulation results, it is necessary to divide the grids into different quantities and qualities for independence verification under the premise of ensuring the accuracy of the results, ensuring the feasibility and accuracy of the numerical simulation, and improving the computational efficiency. Three different density grids were divided into “medium”, “good”, and “fine”, and the number of grids was 32,281, 53,176, and 78,125, respectively. All three grids satisfied the minimum orthogonal quality, which was greater than 0.1. The maximum skewness was less than 0.95, and the quality of the grids satisfied the requirements. In the computation results, 60 isometric-induced wind velocity measurement points were selected in the fluid region at the intersection line in the vertical direction about the YZ and XZ symmetric planes. A comparison of wind speeds at each measurement point in the three grids is shown in Figure 21.
The results showed that the induced wind velocity trends of the three grids exhibited strong consistency, and the results almost overlapped. The velocity simulation results of the “better” and “fine” grids were close, and the relative difference was within 15%. The “medium” grid deviated greatly from the “better” and the “fine” grids, and the maximum relative difference between the “fine” and “medium” grids reached 17.14%. Therefore, considering computation accuracy and simulation time, the “better” grid satisfies the independence requirements, and simulation results that satisfy the accuracy requirements can be calculated within a certain period of time.

4.2. Setting of Numerical Simulation Parameters

The fixed time steps in EDEM and FLUENT were set to 2 × 10⁻⁵ s and 4 × 10⁻⁴ s, respectively; that is, the time step in FLUENT was 20 times that in EDEM, which ensured the convergence of the simulation. The time step set by FLUENT was 250,000; that is, the coupling simulation time was 100 s.
The relevant parameters of the bulk material and equipment were set using the EDEM.2020 software. The bulk material was coal, and the grab and hopper materials were steel. The particle size distribution and characteristics of the bulk material, the material properties of the equipment, and the contact parameter properties are listed in Table 3.
The relevant parameters of the fluid were set in the FLUENT 18.0 software: the fluid model, boundary conditions, discrete phase parameters of coal dust, solver method, and turbulent diffusion model. The selected specific parameters are listed in Table 4.

4.3. Correctness Verification of Numerical Simulation

Figure 22 shows the numerical simulation of the dust concentration distribution and corresponding experimental results at T = 0.4 s, T = 0.8 s, T = 1.2 s, and T = 1.8 s, respectively.
When T = 0.4 s, the bulk material partially entered the hopper to form a vertical material column, the dust hardly spread in the horizontal direction, and the bulk material was relatively dispersed at the bottom of the material column.
When T = 0.8 s, the bulk material was partially dropped to the bottom of the hopper. The dust at the edge of the material column diffused irregularly in the radial direction, and the lower the material column, the more evident the dust diffusion. In addition, when the material fell to the bottom of the hopper, the collision and rebound effects at the bottom of the hopper aggravated the irregular diffusion of dust.
When T = 1.2 s, the bulk material continued to fall to the bottom of the hopper, and the dust spread from the bottom of the hopper to the left and right sides to form enrolling vortexes that spread upwards along the wall of the hopper. At this time, the dust concentration at the bottom of the hopper and on both sides of the left and right walls of the hopper was relatively high, and the dust concentration gradually decreased along the height of the hopper.
When T = 1.8 s, with continuous grab unloading, the dust diffused into the entire hopper and spread outside the hopper.
It can be observed from the dust concentration distribution diagram of the four moments that the dust distribution and diffusion range of the numerical simulation are consistent with the experimental results.
Measurement point 1 in Section 3.3 is selected as the measured point, and the numerical simulation results of the dust concentration are basically consistent with the experimental results, as shown in Figure 23. The variation trends were essentially the same, and the relative error in the dust concentration was within 15%. Considering the influence of field factors, the error was considered to be within an acceptable range, which verified the accuracy of the numerical simulation.

4.4. Analysis of Simulation Results

4.4.1. Motion Trajectory and Velocity Distribution of Particle Flow Field and Airflow Field

As shown in Figure 24, the motion trajectories and velocity distribution of particle and airflow fields (XZ symmetry plane and YZ symmetry plane) at T = 0.4 s, T = 0.8 s, T = 1.2 s, and T = 1.8 s, respectively, reflect the distribution law of flow field during the unloading process.
As can be noted from the figure, the velocity of the airflow field in the particle flow field and nearby areas is relatively large, and the maximum airflow field velocity is located inside the particle flow field, in which the highest velocities of the particle and airflow fields are 4.76 and 1.33 m/s, respectively. The velocity variation in the airflow field at the edge of the particle flow and in nearby areas is clear, which indicates that the airflow shear effect in this area is evident and dust is more easily generated. In other areas, the airflow velocity and gradient of the velocity are smaller but occupy a larger area. According to the velocity streamline diagram of the airflow field, the induced airflow moved downward with a decrease in the bulk material, with the direction nearly parallel to the vertical direction, and the diffusion degree of dust in the horizontal direction was weak. When the induced airflow meets the relatively stationary air below the hopper, it pushes and carries the dust and a lower airflow around the hopper. It then diffuses upward, and finally, part of the fugitive dust flows out from around the hopper, whereas the remaining fugitive dust forms vortexes near the particle flow field. Comparing the motion trajectories and velocity distribution diagrams of the airflow fields on the XZ and YZ symmetry planes, it can be observed that the airflow streamlines on the XZ symmetry plane form vortexes with the evident upward flow, whereas the airflow streamlines on the YZ symmetry plane are vertically downward, so no vortexes are formed and the upward flow is not evident. Due to the working characteristics of the grab, the bulk materials are more easily diffused from both sides of the open direction of the grab, and the bulk materials diffused on both sides have an obvious effect on the surrounding induced airflow.

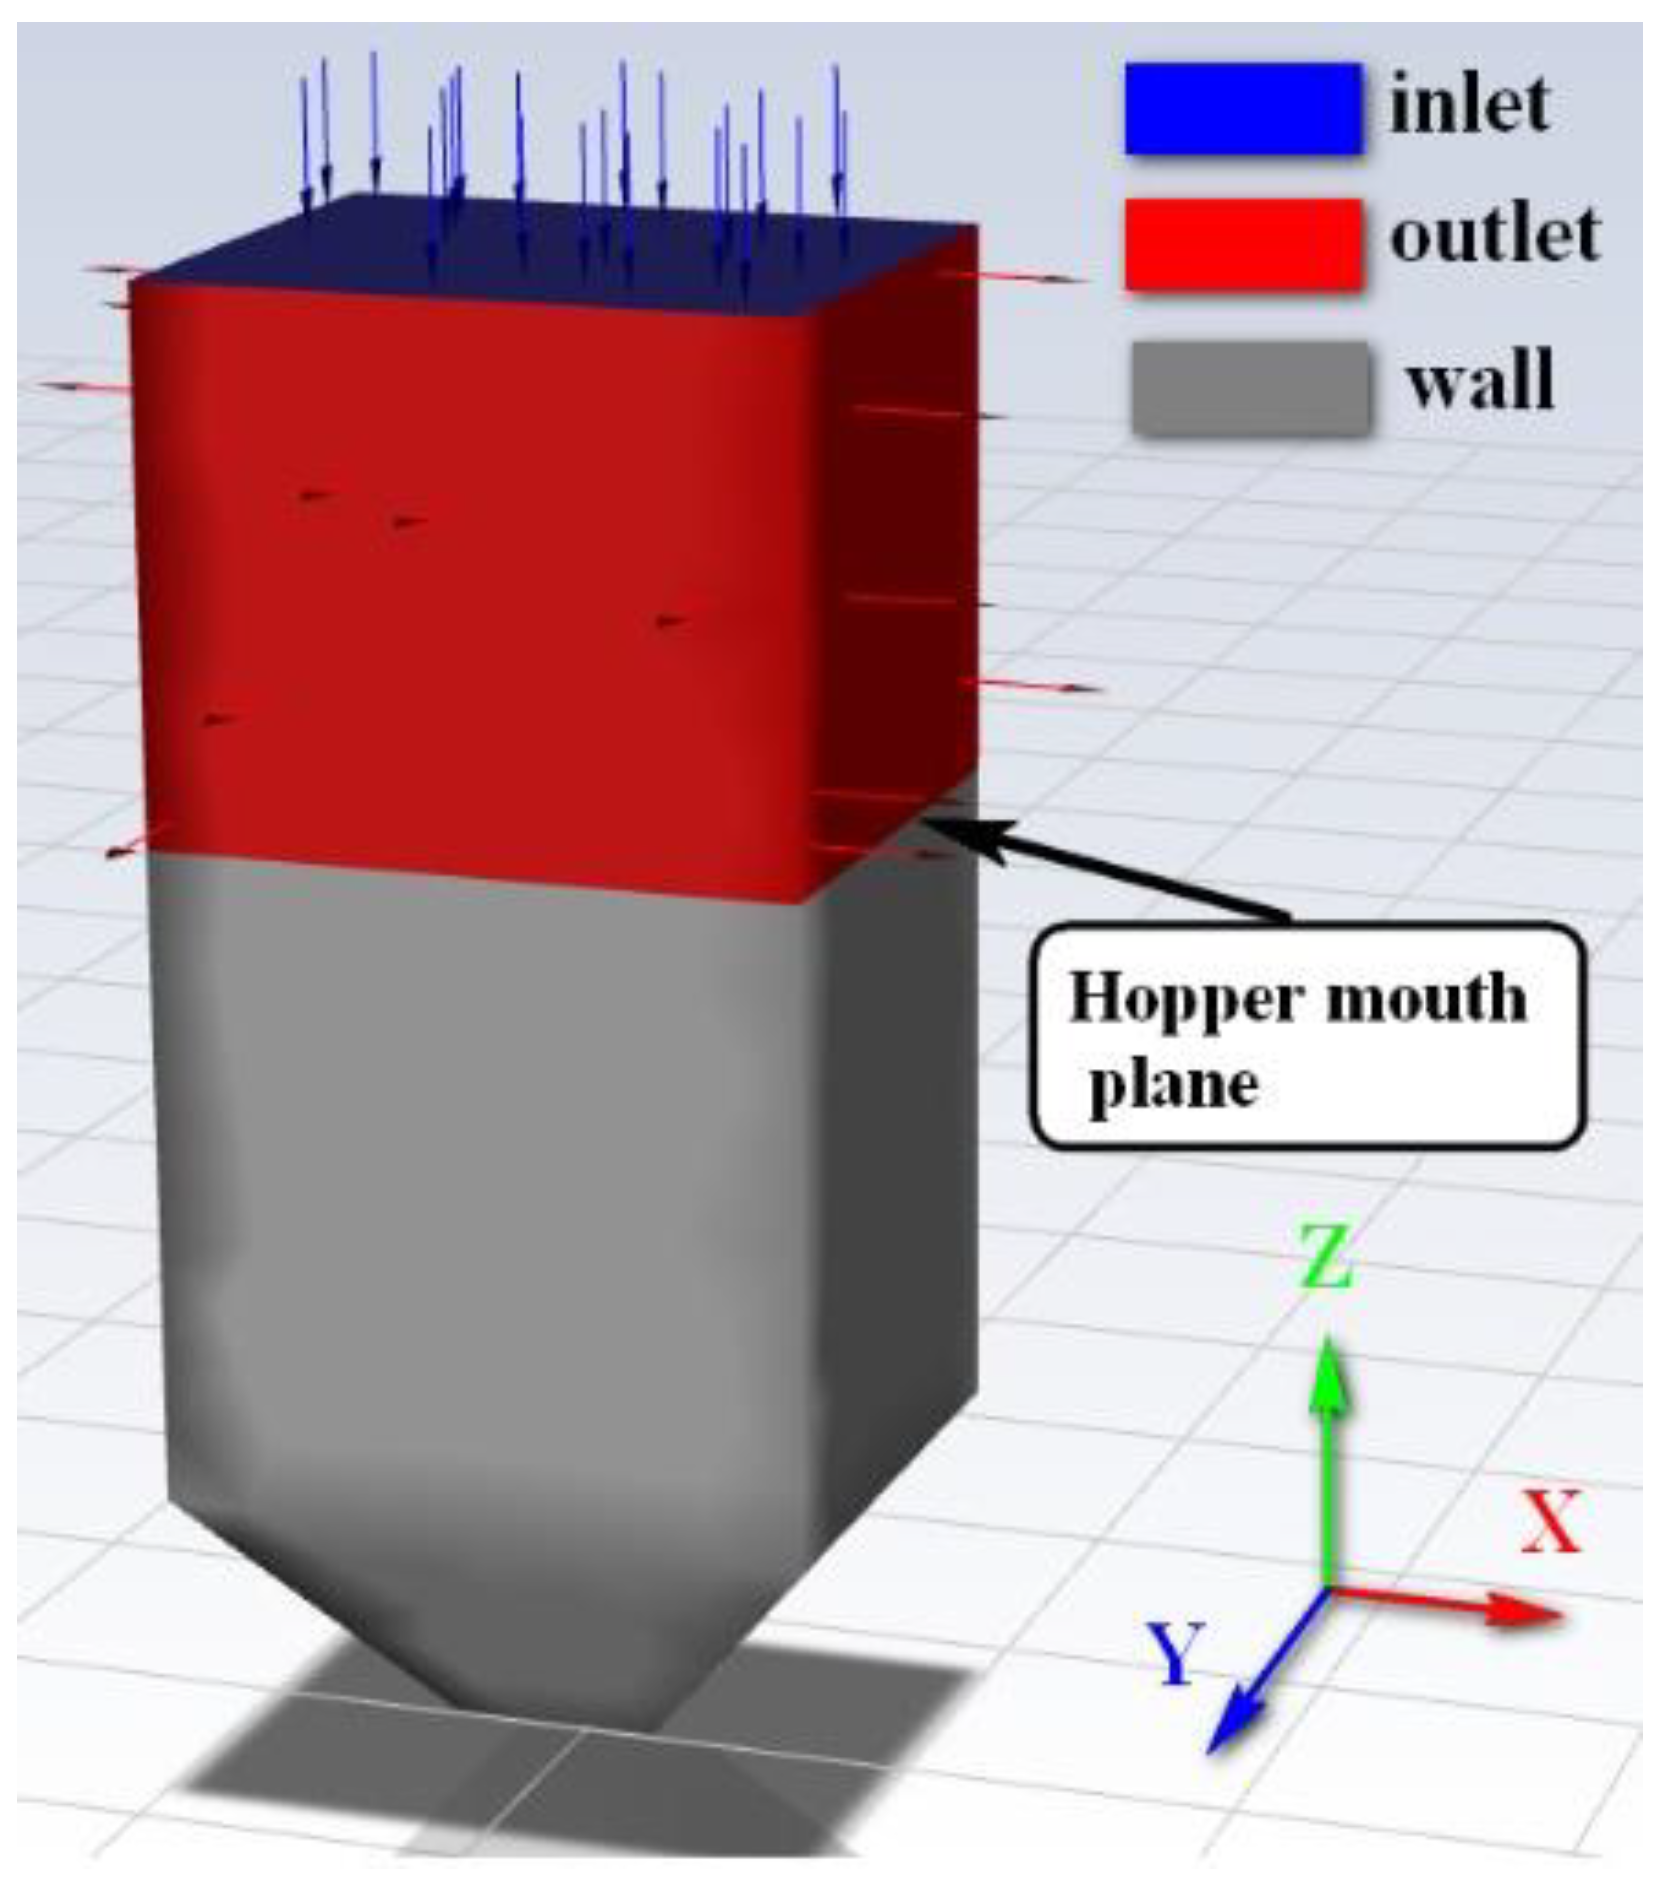
4.4.2. Research on the Airflow Distribution Law of the Hopper Opening Plane

Considering the hopper opening plane as a representative, the distribution law of the airflow velocity in the vertical direction of the plane was analysed, and the upward and downward movement areas and velocity distribution law of the airflow were obtained. During the unloading process, the upward movement area is the dust diffusion area, and the downward movement area drives the airflow into the inner area of the hopper. To reflect the whole unloading process, the times of T = 0.5 s, T = 2.2 s, T = 4.2 s, and T = 4.7 s in the four unloading stages were compared and analysed, respectively. As shown in Figure 25, a 3D colour-mapping surface diagram with a projection was drawn to represent the spatial variation trend of the airflow velocity on the hopper opening plane at four different times, where the airflow velocity was considered a positive value when moving upward.
Overall, the distribution law of airflow velocity in the vertical direction is as follows: symmetrical about X = 0.3 m and Y = 0.25 m planes, respectively, the airflow at the centre and nearby positions of the hopper moves downwards, while the airflow at the outside moves upwards. In addition, the variation trend of airflow velocity along the X = 0.3 m plane and Y = 0.25 m plane is the same, and the velocity gradually decays to 0 m/s from the centre to the periphery, then gradually increases and rapidly decreases to 0 m/s when it reaches the wall of the hopper. The projection of the area with a negative velocity value was oval, and the velocity was highest in the area near the four corners of the hopper mouth. In addition, the proportion of upward flow near the short side of the hopper mouth was relatively large, whereas the proportion of upward flow near the long side of the hopper mouth was relatively small, indicating that the dust driven by the airflow was more likely to spread along the short side of the hopper mouth. The simulation results are highly consistent with the experimental results for the induced wind velocity at the five measurement points in Section 3.4.
Summarising the relevant characteristics of the upward and downward airflows at the hopper mouth plane at the above-mentioned four moments, as shown in Figure 26 and Figure 27, respectively, it can be observed that, as the unloading time increased, the average and maximum velocity and mass flow of the upward and downward airflows first increased and then decreased, reaching the maximum value at T = 2.2 s. The area occupied by the upward airflow gradually decreased, whereas the area occupied by the downward airflow gradually increased, indicating that the interface between the upward- and downward-moving airflows continued to expand outwards with time, and the mass of the upward flow was basically the same as the mass of the downward flow at four moments.

5. Conclusions

The flow field characteristics of fugitive dust in open spaces can reflect its unstable and complex nonlinear dynamic processes. Studying and obtaining this characteristic is a key premise for realising a dust-suppression flow field. In this study, the flow field characteristics of fugitive dust from grab unloading in an open space were analysed, and the characteristics of dust diffusion and the variation law of induced wind velocity were obtained by experimental and numerical simulation methods of gas–solid two-phase flows. The main conclusions are as follows.
(1)
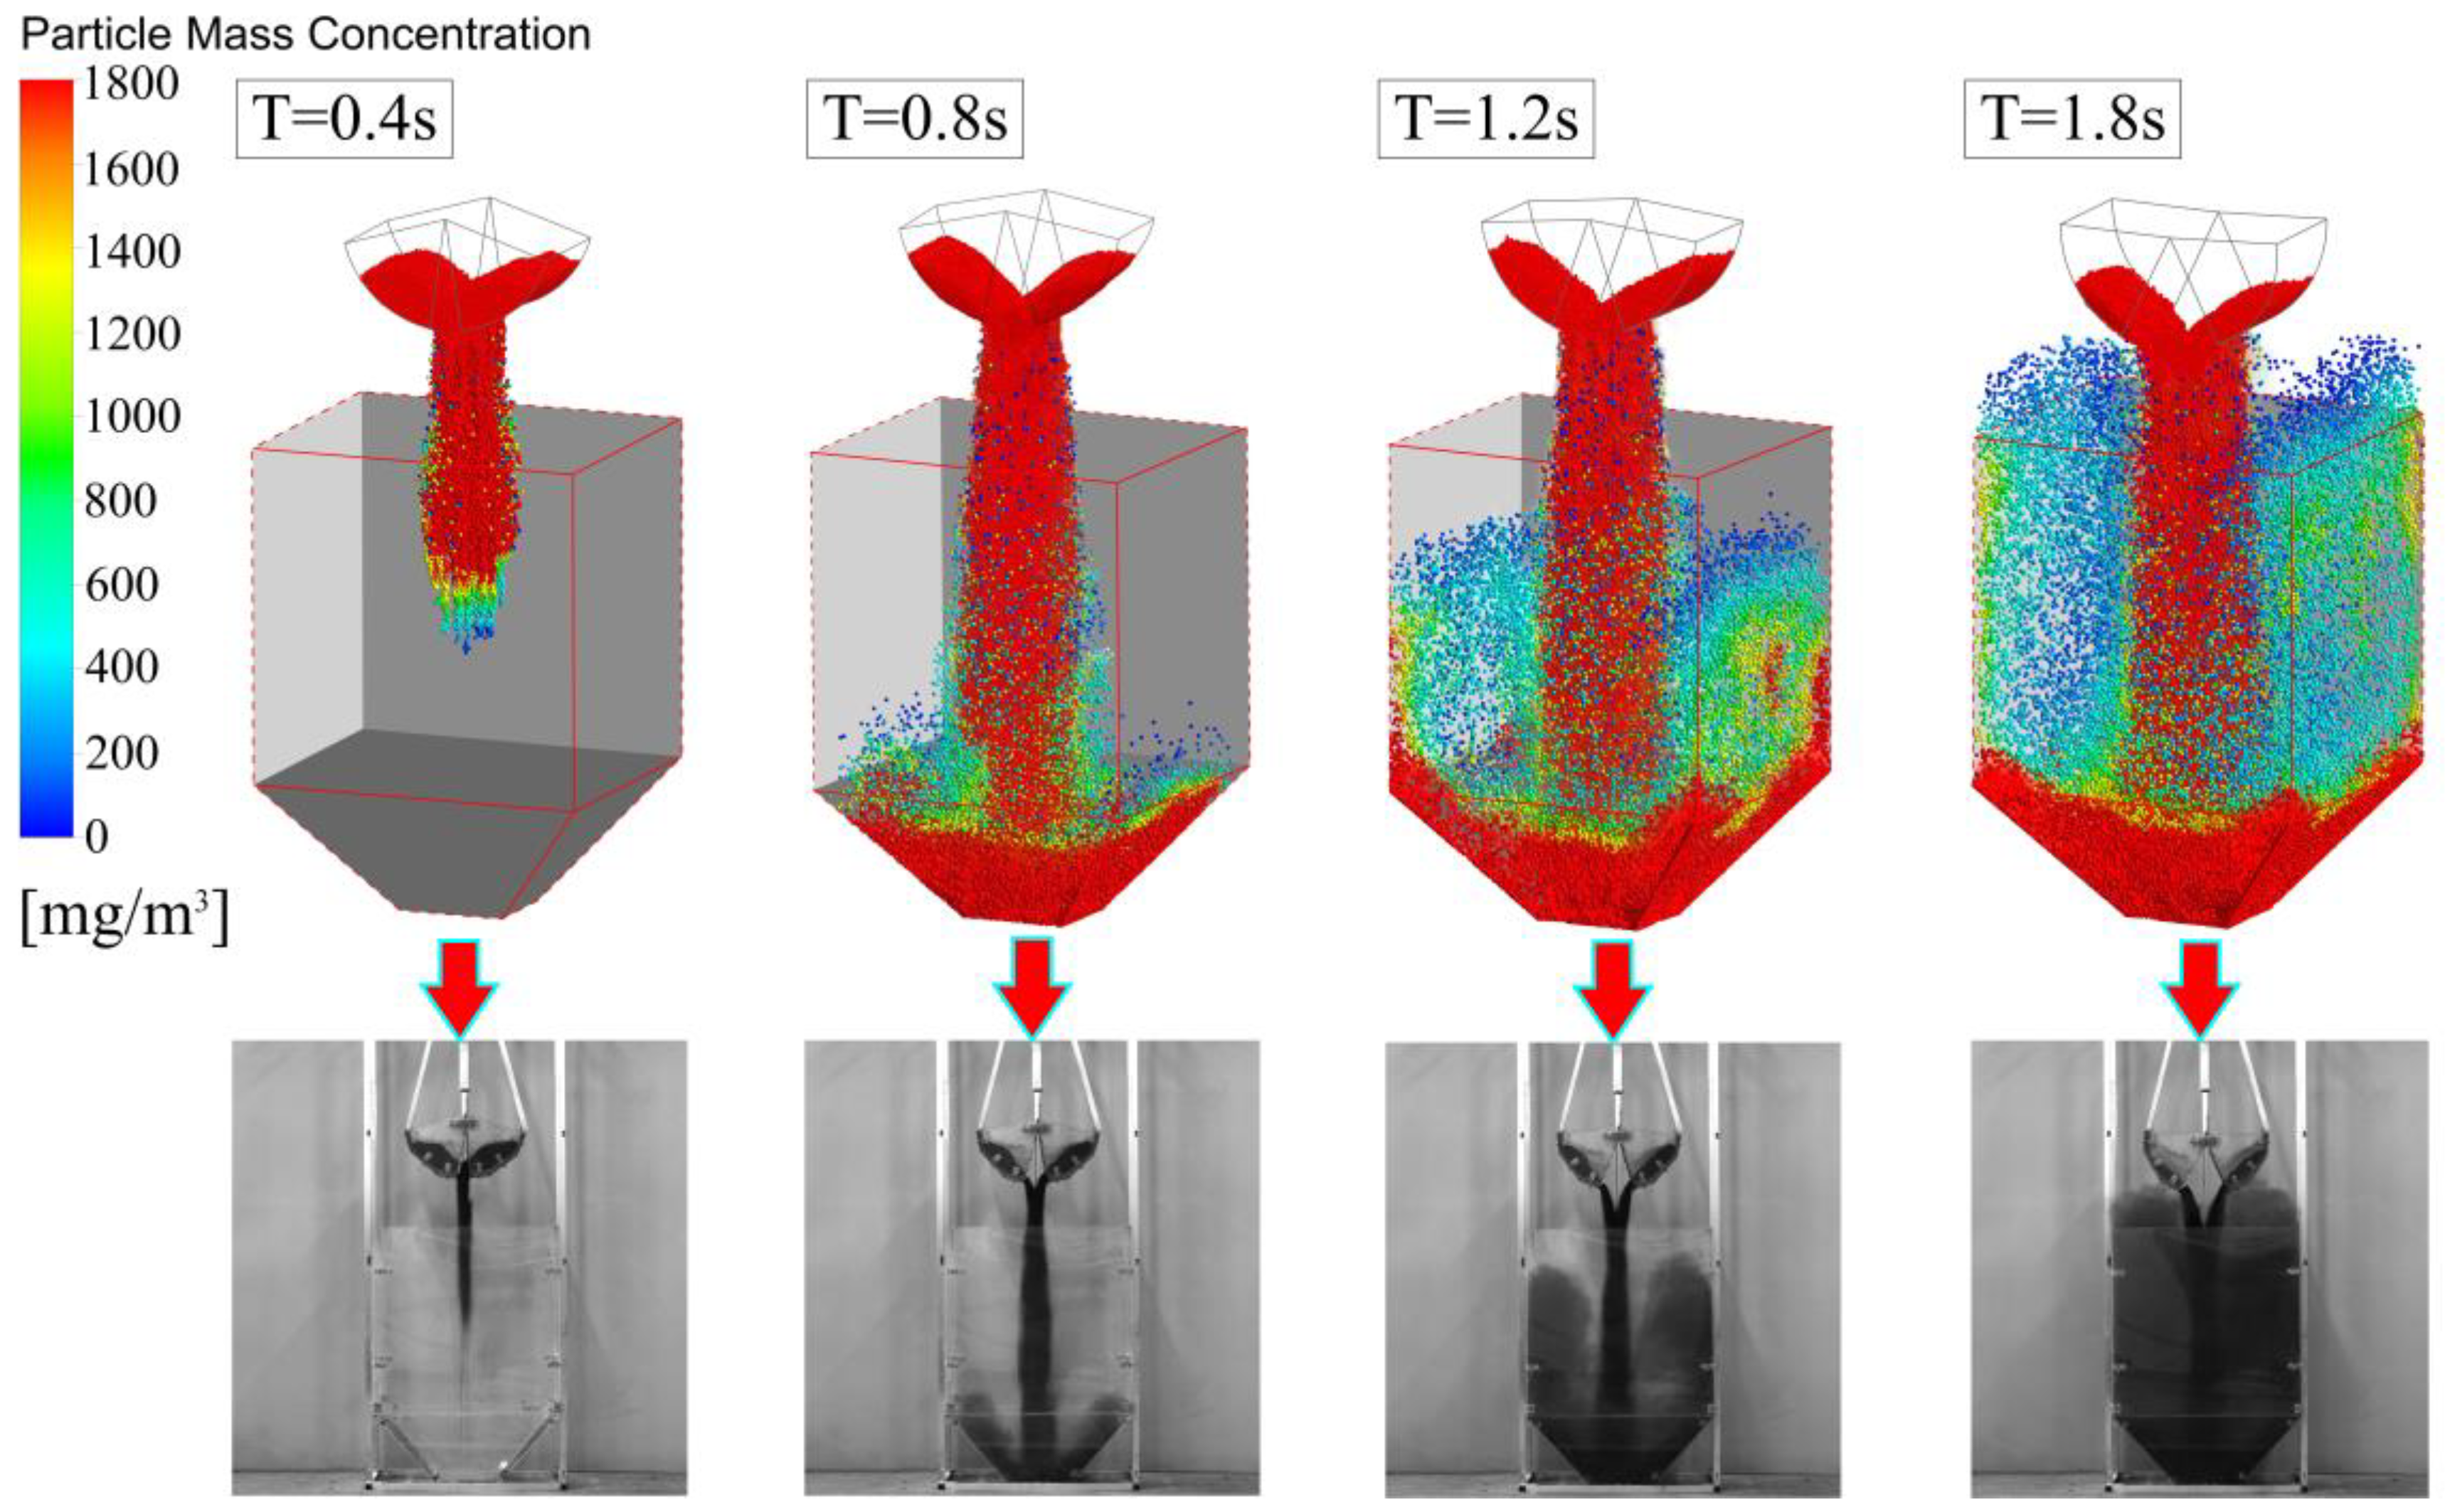
According to the parameter calibration of the bulk material and the grab-unloading experiment, for coal and sand, owing to the poor viscosity and high fluidity, the material flow on both sides of the grab was continuous, uniform, and symmetrical. The dust diffusion was relatively symmetrical at the beginning and showed evident disorderly diffusion with the progression of the unloading process. For flour, owing to its high viscosity and poor fluidity, the material flow on both sides of the grab was clearly different, and the material flow was unstable, forming multiple intermittent material flows, and the dust spread in disorder during the entire unloading process. For coal, sand, and flour, the duration of dust rising diffusion was 5.2, 6.5, and 5.3 s, respectively; the emptying times of materials in the grab were 5, 5.7, and 6.3 s, respectively; and the maximum diffusion ranges of dust were 956 mm × 1389 mm, 893 mm × 1540 mm, and 769 mm × 1450 mm, respectively.
(2)
The related characteristics of dust concentration were analysed, and the following conclusions were drawn: For measurement points with the same horizontal coordinates and higher positions, the maximum concentration of dust was low, the settling time was short, and the duration of the high-concentration state was short. The maximum concentrations of the three materials at two measurement points in descending order are as follows: sand, flour, and coal.
For measurement points with the same vertical coordinates, the horizontal positions were at the midpoint of the width direction (located on the corresponding surface in the opening direction of the grab) and the midpoint of the length direction (located on the corresponding surface parallel to the opening direction of the grab) of the hopper mouth plane. The results showed that the maximum dust concentration of the three materials at the midpoint of the width direction was much higher than that at the midpoint of the length direction of the hopper mouth plane. The dust concentration difference of sand was the largest, followed by that of flour and coal. The settling time and duration of the high-concentration states of sand and flour at the midpoint of the width direction were greater than those at the midpoint of the length direction of the hopper mouth plane, whereas those of coal at the midpoint of the width direction were close to those at the midpoint of the length direction of the hopper mouth plane. The results showed that the dust content near the corresponding surface of the grab-opening direction was relatively large, the dust content near the corresponding surface parallel to the grab-opening direction was relatively small, and the dust was more likely to spread near the corresponding surface of the grab-opening direction.
(3)
Analysis of the induced wind velocity-related characteristics of the three types of materials at five measurement points: The maximum induced wind velocity, the duration of the larger disturbance, and the disturbance intensity of the three materials at measurement points 3, 4, and 5 were generally larger, whereas the maximum induced wind velocity, the duration of the larger disturbance, and the disturbance intensity of the three materials at measurement points 1 and 2 were generally smaller. Comparing the three types of materials at the same measurement point, in terms of the maximum induced wind velocity and the disturbance intensity, the values of coal and sand were close and greater than that of flour. In terms of the duration of the large disturbance, coal and sand were close, whereas the duration of the large disturbance of flour was lagging behind and short.
(4)
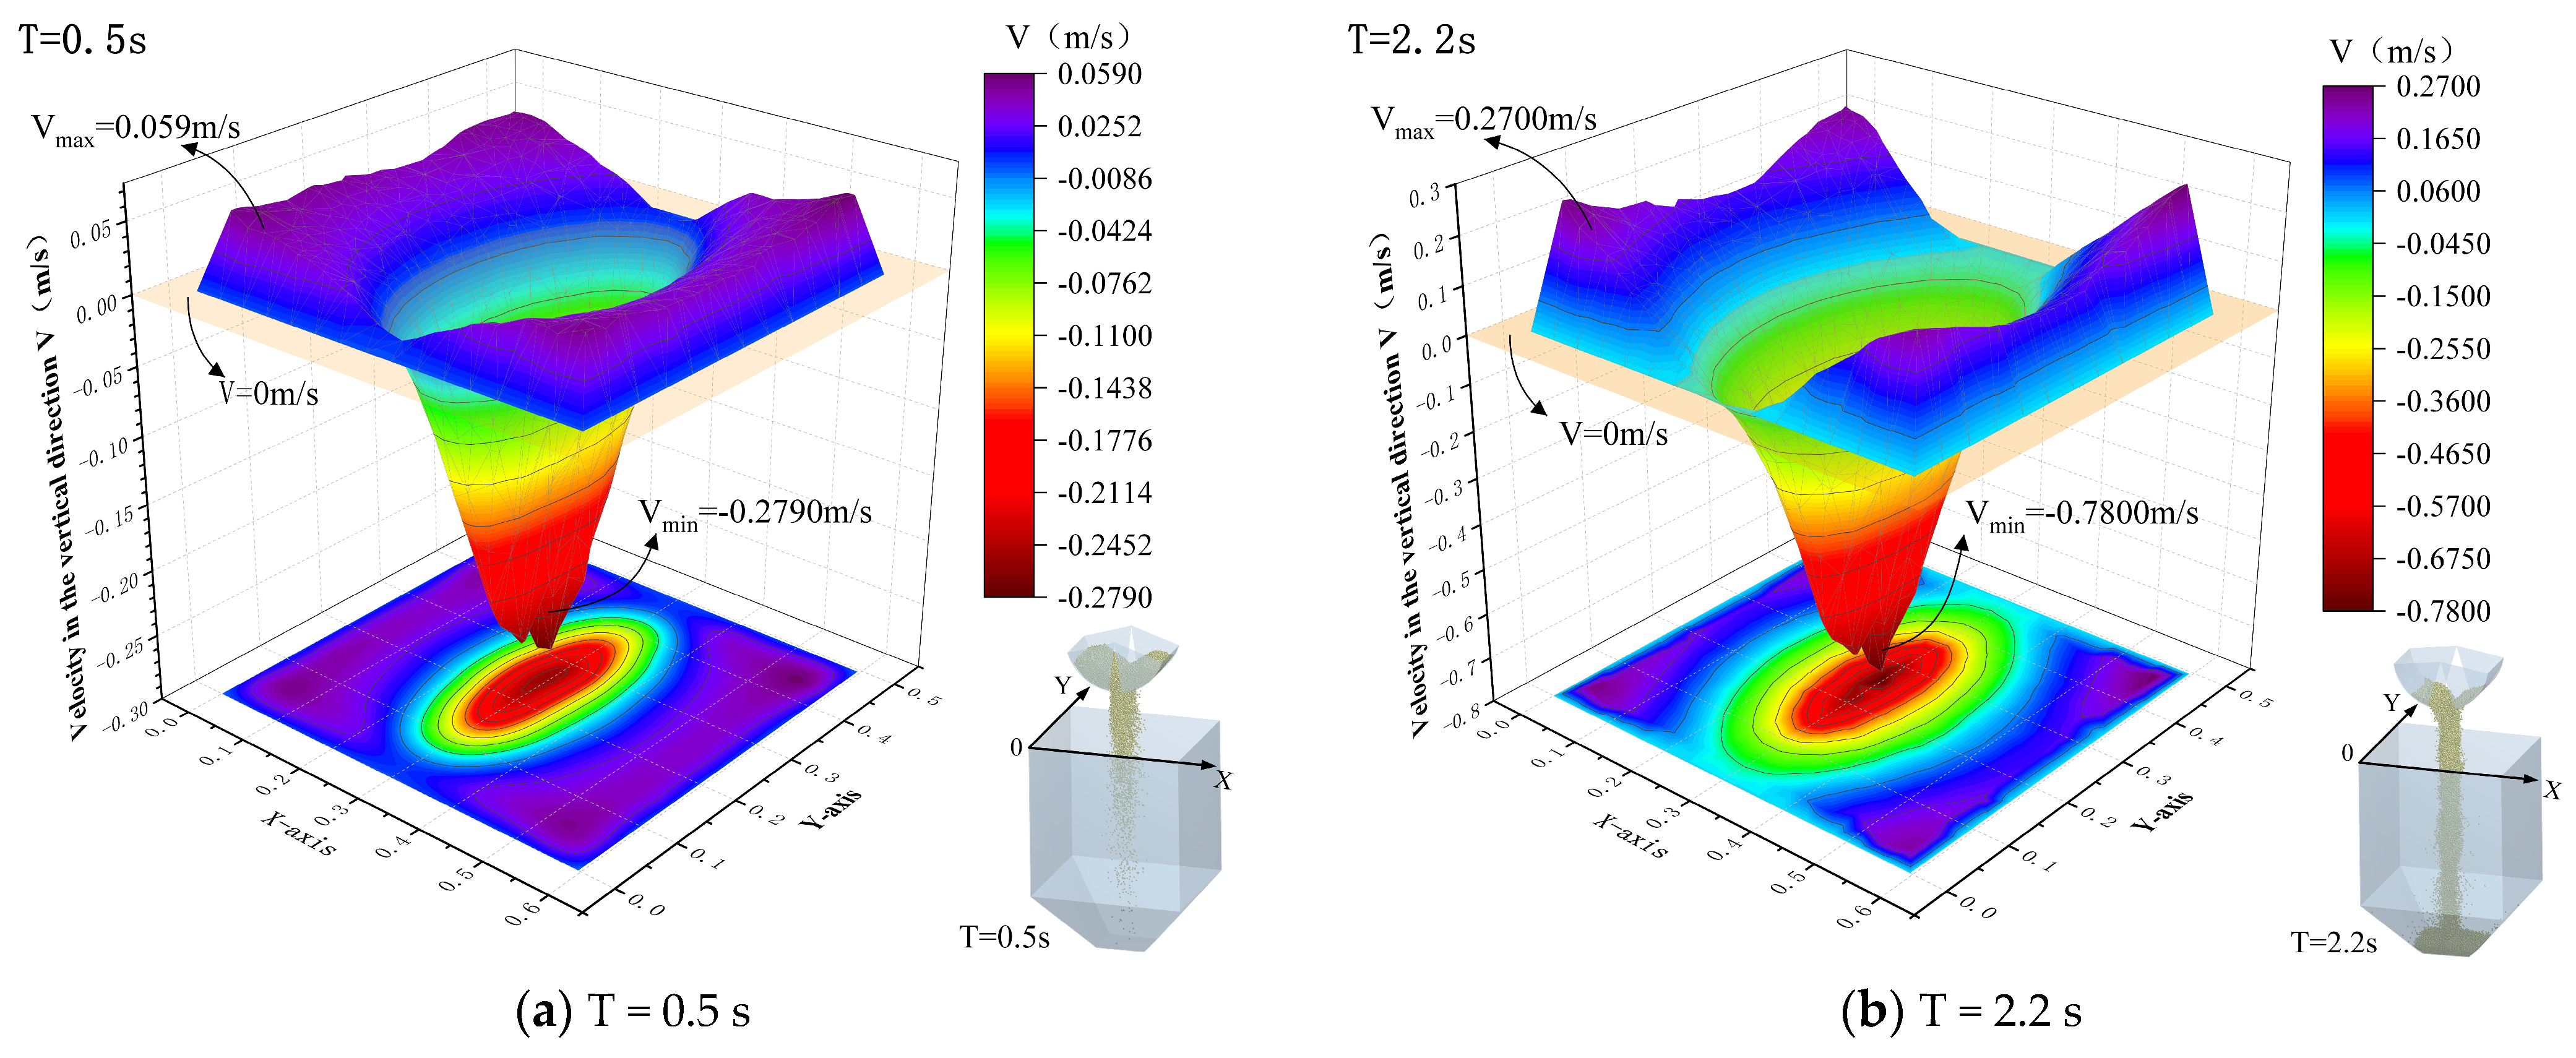
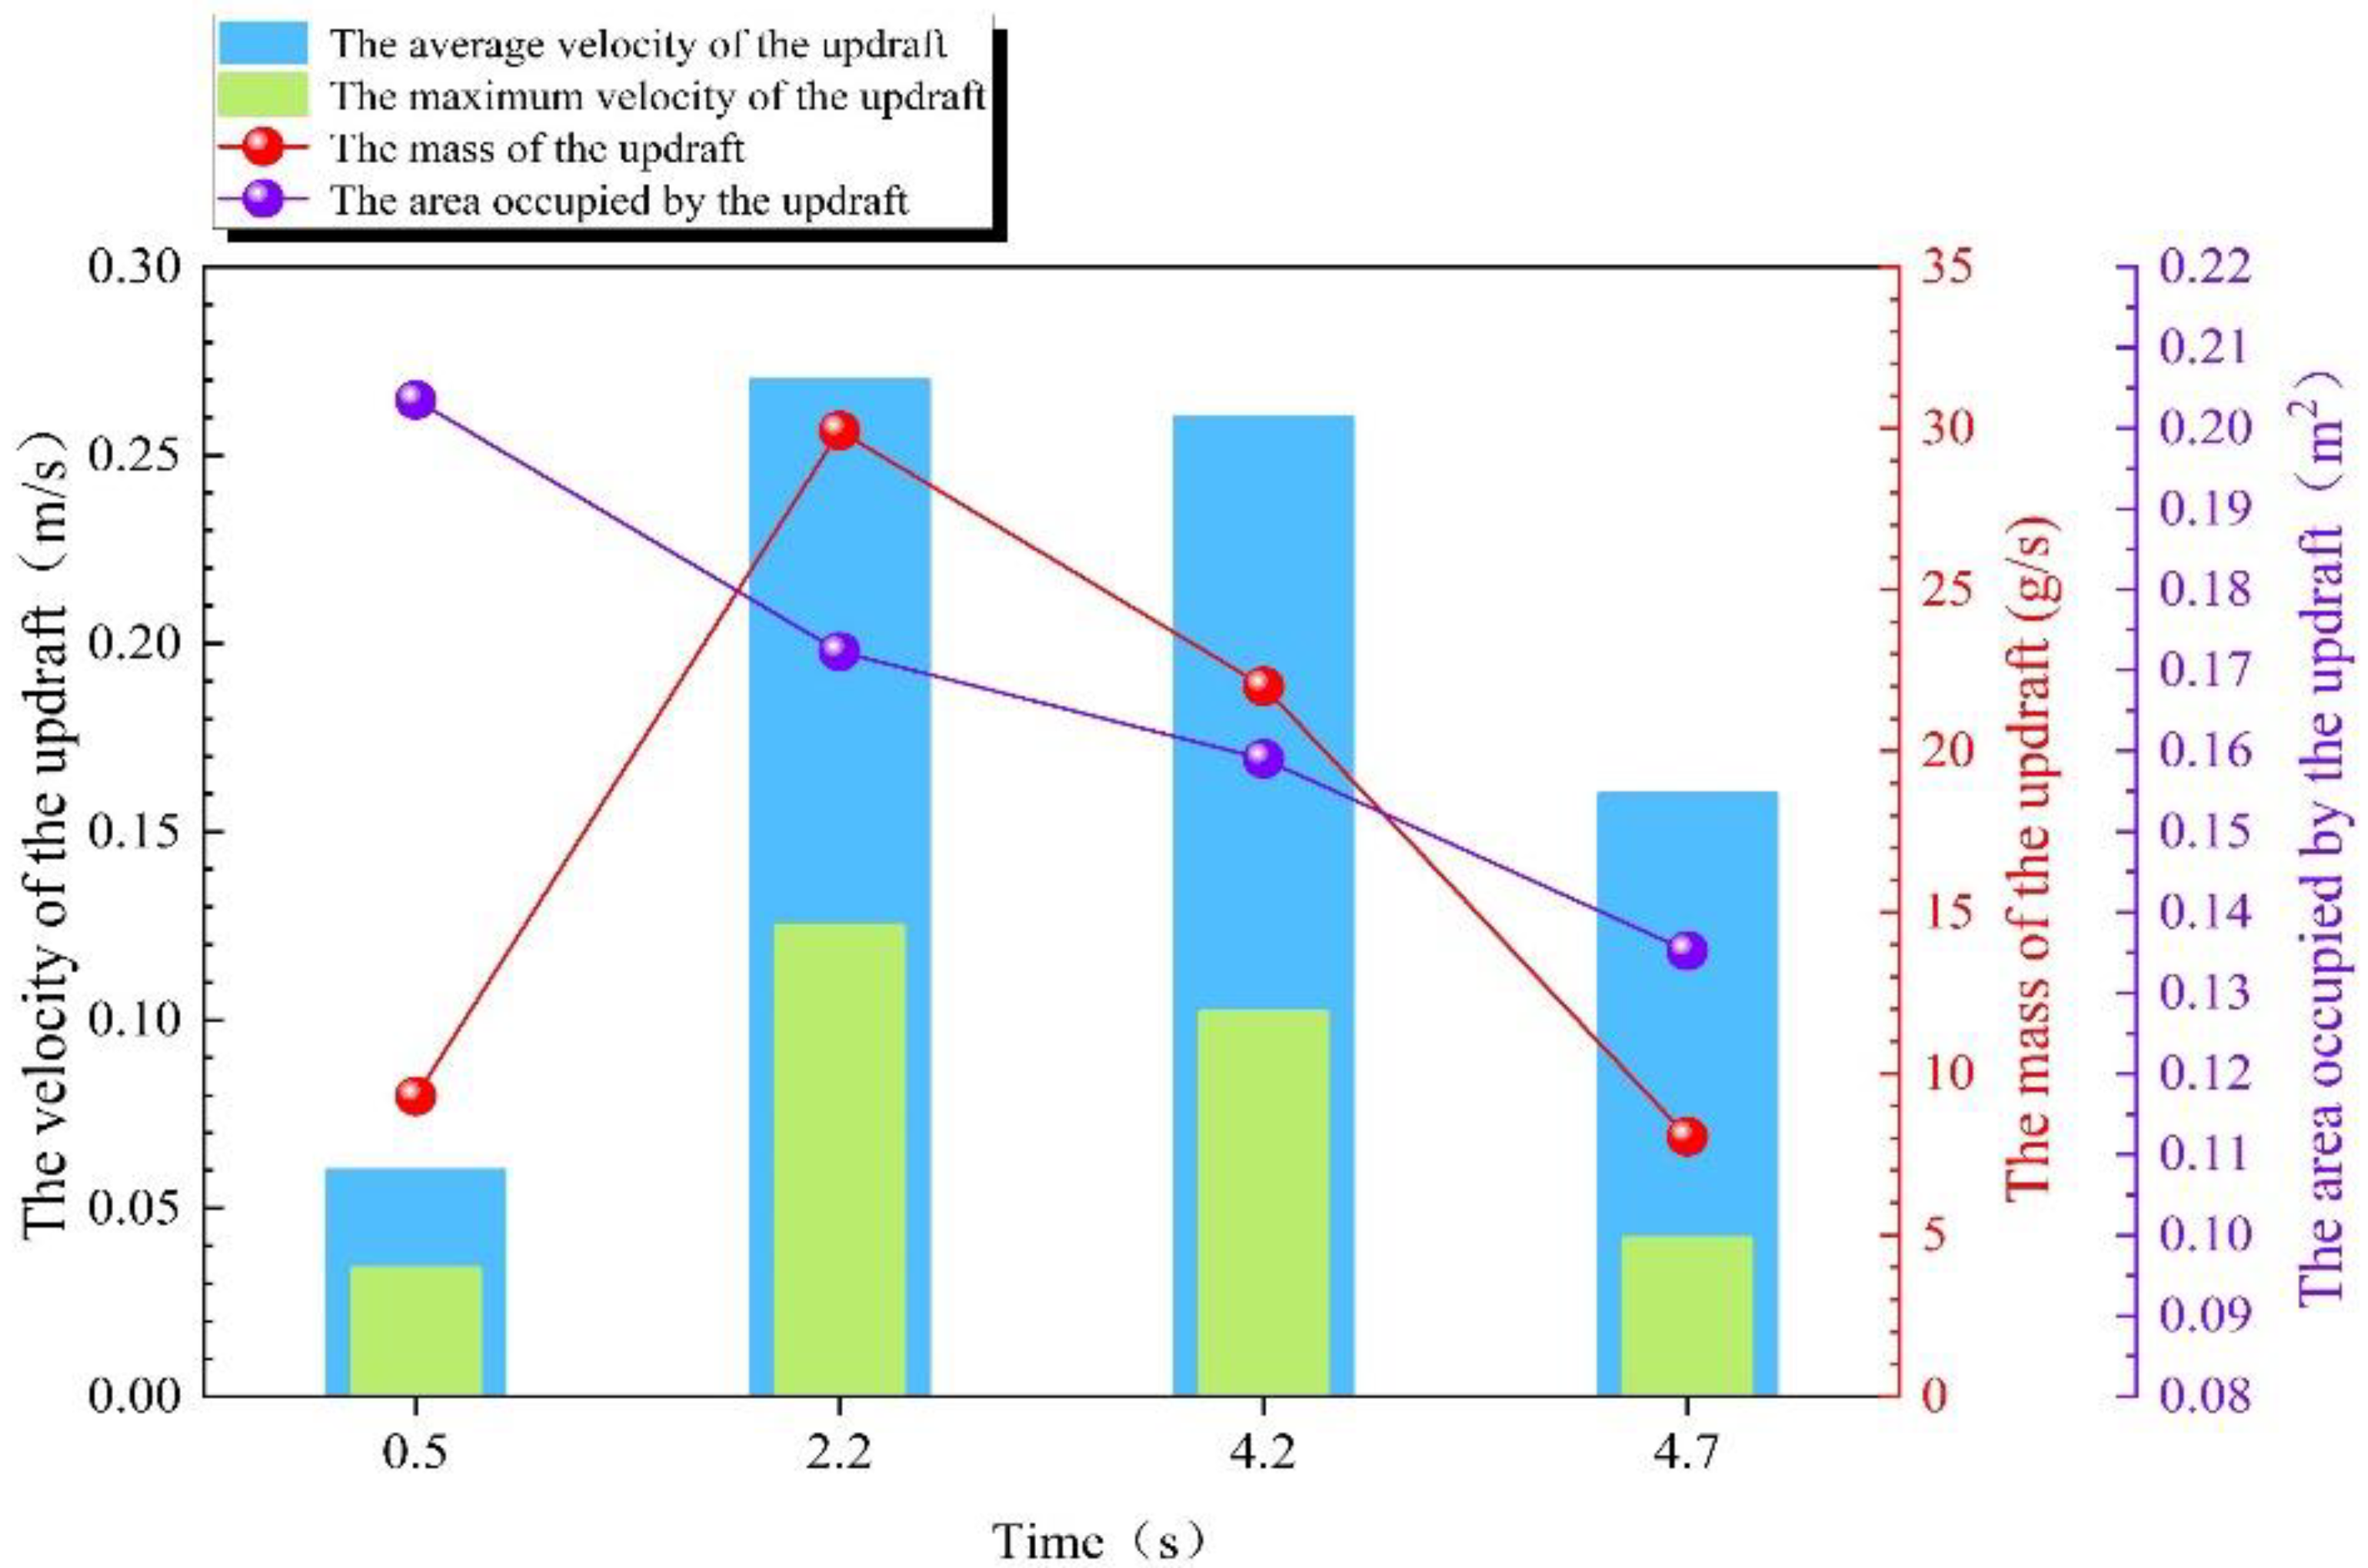
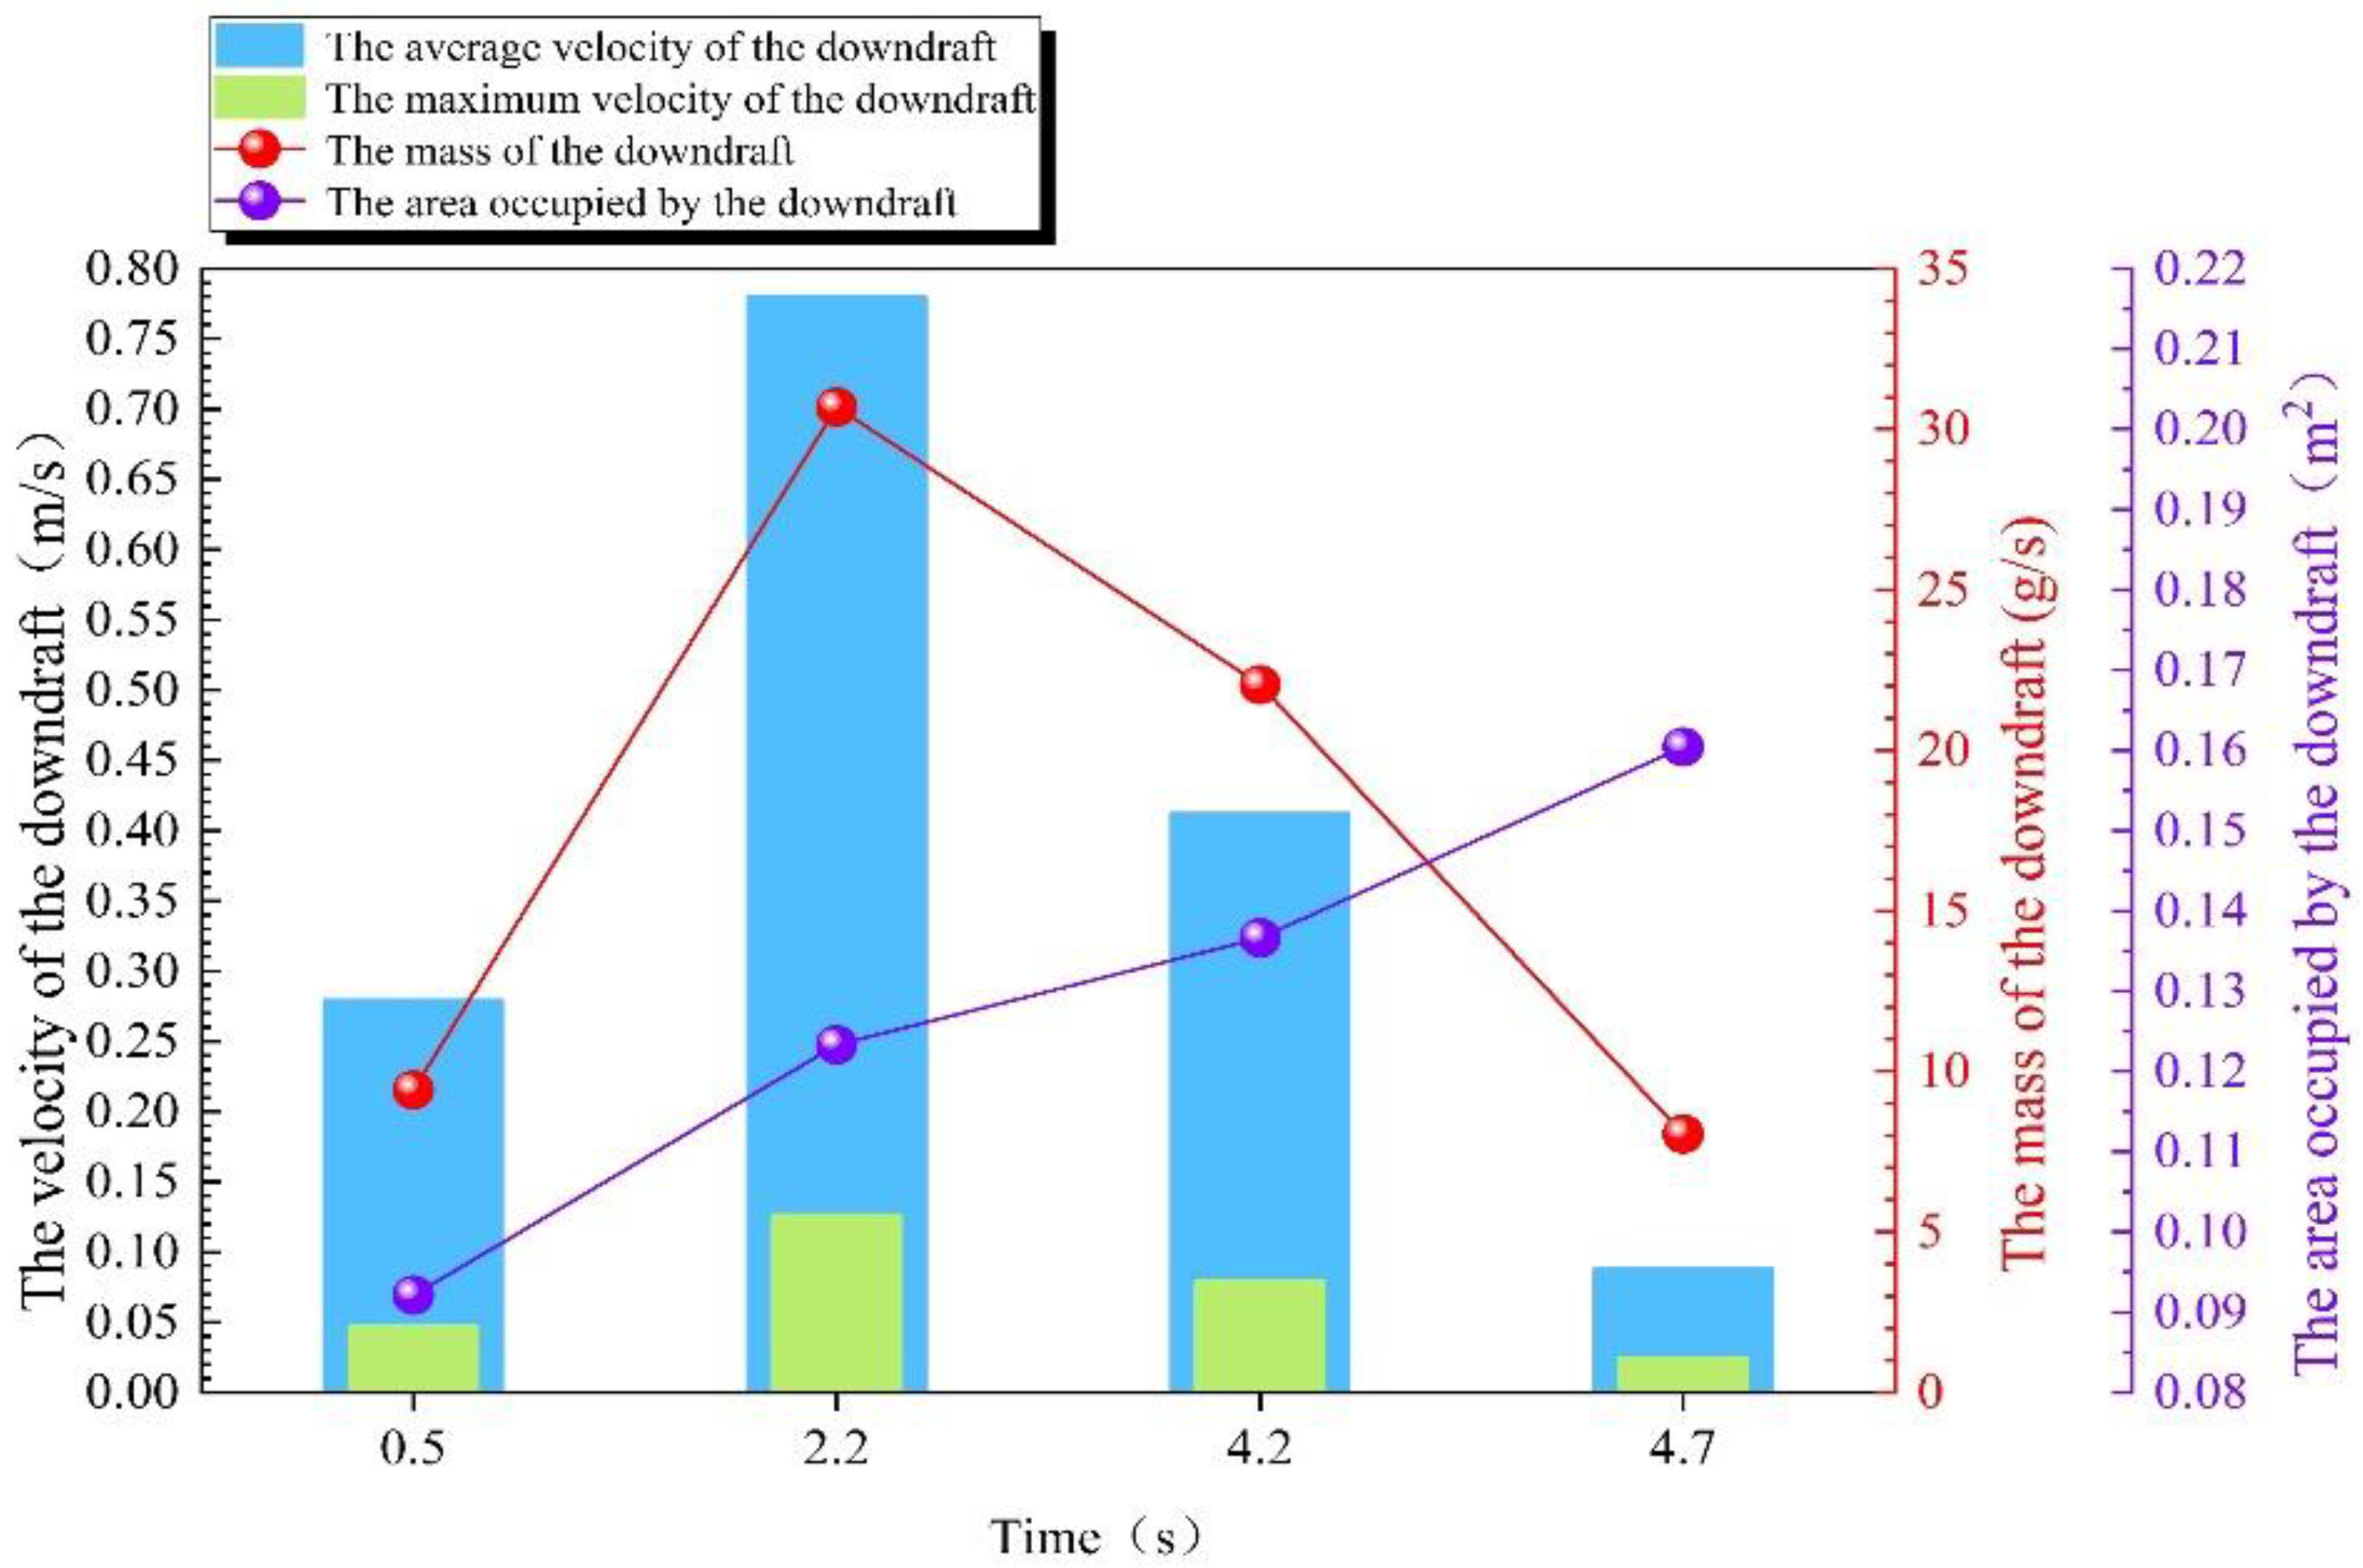
A gas–solid two-phase flow field based on the CFD-DEM coupling method was adopted, a DPM model of dust was established, and the interaction of the coal particle, coal dust, and airflow fields during the unloading process of the grab was further studied. The study found that the velocity of the airflow field in the particle flow field and nearby areas is relatively large, and the maximum airflow field velocity is located inside the particle flow field, in which the highest velocities of the particle flow field and the airflow field were 4.76 and 1.33 m/s, respectively. The velocity variation in the airflow field at the edge of the particle flow and in nearby areas was clear, which indicated that the airflow shear effect in this area was evident and dust was more easily generated. In other areas, the airflow velocity and gradient of the velocity were smaller but occupied a larger area. In addition, the distribution law of airflow velocity in the vertical direction of the hopper opening plane is as follows: the airflow velocity is symmetrically distributed on the two vertical symmetry planes of the hopper; the airflow at the centre and nearby positions of the hopper moves downwards, whereas the airflow outside moves upwards. In addition, the variation trend of airflow velocity along the two vertical symmetry planes exhibited the same trend, and the velocity gradually decayed to 0 m/s from the centre to the periphery, then gradually increased and rapidly decreased to 0 m/s when it reached the wall of the hopper. Summarising the relevant characteristics of the upward airflow and downward airflow at the hopper mouth plane, it can be observed that as the unloading time increased, the average and maximum velocity and mass flow of the upward and downward airflows first increased and then decreased, reaching the maximum value at T = 2.2 s. The area occupied by the upward airflow gradually decreased, whereas the area occupied by the downward airflow gradually increased, indicating that the interface between the upward- and downward-moving airflows continued to expand outwards with time, and the mass of the upward flow was basically the same as the mass of the downward flow at four moments.

Author Contributions

Conceptualisation, H.Z. and W.M.; methodology, H.Z. and B.Z.; software, H.Z.; validation, H.Z. and W.M.; formal analysis, H.Z. and Y.Y.; investigation, H.Z.; resources, W.M. and X.Y.; data curation, H.Z.; writing—original draft preparation, H.Z.; writing—review and editing, W.M. and X.Z.; visualisation, H.Z. and W.L.; supervision, H.Z.; project administration, W.M.; funding acquisition, W.M. All authors have read and agreed to the published version of the manuscript.

Funding

This research was financially supported by the National Natural Science Foundation of China (Grant No. 52075356), PhD research startup foundation of Taiyuan University of Science and Technology (Grant No. 20202030), Scientific and Technological Innovation Programs of Higher Education Institutions in Shanxi (Grant No. 2021L308), Technological Achievements Transformation Guidance Special Project (Grant No. 202204021301060), and Science and Technology Projects in Shanxi: Basic Research Program-Youth Project (Grant No. 202203021222212).

Data Availability Statement

Data are contained within the article.

Conflicts of Interest

The authors declare no conflict of interest.

References

  1. Luo, W.; Chen, S. Application of High efficiency Inhibitors in Nonferrous Metal Mines. China Mine Eng. 2017, 46, 19–25. [Google Scholar]
  2. Zhang, D.; Liu, B. Statistics and Prospect Analysis of Mine Occupational Diseases in China. Energy Environ. Prot. 2017, 39, 173–178. [Google Scholar]
  3. Chen, H. Dust Generation Mechanism of Bulk Cargo Unloading Process Based on CFD-DEM and Dust Suppression Method of Spiral Hopper; Wuhan University of Technology: Wuhan, China, 2019. [Google Scholar]
  4. Lu, X.; Lin, j. Can we develop a comprehensive theory of turbulence dynamics and the kinematics of granular materials. Sci. Bull. 2017, 62, 1115–1118. [Google Scholar]
  5. Levine, A.G. 125 Questions: Exploration and Discovery; The American Association for the Advancement of Science: Washington, DC, USA, 2021. [Google Scholar]
  6. Sun, X.; Zhao, Y.; Meng, W.; Zhai, Y. Research on average vertical velocity of rubber particles in vertical screw conveyor based on bp neural network. J. Mech. Sci. Technol. 2021, 35, 5107–5116. [Google Scholar]
  7. Li, X. Design of New Belt Conveyor Transfer Station; Taiyuan University of Science and Technology: Taiyuan, China, 2014. [Google Scholar]
  8. Jiang, Q. Non-Power Dust Suppression Design of Belt Conveyor Transfer Station; Taiyuan University of Science and Technology: Taiyuan, China, 2015. [Google Scholar]
  9. Meng, W.; Yin, X.; Jiang, Q. Discrete element analysis of material flow in unpowered dust suppression transfer station. China Powder Technol. 2016, 22, 82–88. [Google Scholar]
  10. Esmaili, A.; Donohue, T.; Wheeler, C.; McBride, W.; Roberts, A. On the analysis of a coarse particle free falling material stream. Int. J. Miner. Process. 2015, 142, 82–90. [Google Scholar] [CrossRef]
  11. Zeren, Z.; Neau, H.; Ansart, R.; Simonin, O.; Belut, E. 3D unstationary simulations of a free-falling particle jet using a granular-kinetic hybrid model. Ventilation 2012, 23, 1–6. [Google Scholar]
  12. Yuan, J.; Jin, C.; Ye, F.; Hu, Z.; Chen, H. Dust Suppression Analysis of a New Spiral Hopper Using CFD-DEM Simulations and Experiments. Processes 2020, 8, 783. [Google Scholar] [CrossRef]
  13. Liu, Z.Q.; Wu, Z.J.; Feng, Z.P. Experimental investigation of dust amount from free falling particle stream affected by deflector curvature of dust suppression. Adv. Mater. Res. 2014, 864–867, 1789–1792. [Google Scholar]
  14. Ansart, R.; Letourneau, J.-J.; de Ryck, A.; Dodds, J.A. Dust emission by powder handling: Influence of the hopper outlet on the dust plume. Powder Technol. 2011, 212, 418–424. [Google Scholar] [CrossRef]
  15. Chen, X.; Wheeler, C.; Donohue, T.; McLean, R.; Roberts, A. Evaluation of dust emissions from conveyor transfer chutes using experimental and CFD simulation. Int. J. Miner. Process. 2012, 110–111, 101–108. [Google Scholar] [CrossRef]
  16. Jaklič, M.; Kočevar, K.; Srčič, S.; Dreu, R. Particle size-based segregation of pharmaceutical powders in a vertical chute with a closed bottom: An experimental evaluation. Powder Technol. 2015, 278, 171–180. [Google Scholar] [CrossRef]
  17. Hamzeloo, E.; Massinaei, M.; Mehrshad, N. Estimation of particle size distribution on an industrial conveyor belt using image analysis and neural networks. Powder Technol. 2014, 261, 185–190. [Google Scholar] [CrossRef]
  18. Li, X.; Li, Q.; Zhang, D.; Jia, B.; Luo, H.; Hu, Y. Model for induced airflow velocity of falling materials in semi-closed transfer station based on similitude theory. Adv. Powder Technol. 2015, 26, 236–243. [Google Scholar] [CrossRef]
  19. Wang, Y.; Ren, X.; Zhao, J.; Chu, Z.; Cao, Y.; Yang, Y.; Duan, M.; Fan, H.; Qu, X. Experimental study of flow regimes and dust emission in a freefalling particle stream. Powder Technol. 2016, 292, 14–22. [Google Scholar] [CrossRef]
  20. Ren, X. Study on Diffusion and Dust Production Characteristics of Free Falling Particles; Xi’an University of Architectural Science and Technology: Xi’an, China, 2017. [Google Scholar]
  21. Li, X.; Li, Q.; Zhang, D. Factors affecting nonlinear variation of air flow induced by blanking at transfer point. Powder Metall. Mater. Sci. Eng. 2014, 19, 508–513. [Google Scholar]
  22. Wang, D.; Li, X. Study of airflow induced by regular particles in freefall through tubes. Adv. Powder Technol. 2020, 1, 169–180. [Google Scholar] [CrossRef]
  23. Wang, S.; Ge, S.; Chen, X. Experimental study on influencing factors of air flow induced by transfer point in coal preparation plant. China Sci. Technol. Prod. Saf. 2017, 13, 53–57. [Google Scholar]
  24. Li, Q. Study on the Law of Belt Falling Coal and Dust Based on the Dynamic Analysis of Induced Air Flow; China University of Mining and Technology: Beijing, China, 2014. [Google Scholar]
  25. Zhang, X.; Wang, H.; Chen, X.; Fan, C.; Tian, K.; Zhang, X. Experimental study on dust suppression at transhipment point based on the theory of induced airflow dust production. Build. Environ. 2019, 160, 106200. [Google Scholar] [CrossRef]
  26. Ergun, S. Fluid flow through packed columns. Chem. Eng. Prog. 1952, 48, 89–94. [Google Scholar]
  27. Wen, C.Y.; Yu, Y.H. Mechanics of fluidization. Chem. Eng. Prog. Symp. Ser. 1966, 62, 100–111. [Google Scholar]
  28. Sakai, M.; Takahashi, H.; Pain, C.C.; Latham, J.-P.; Xiang, J. Study on a large-scale discrete element model for fine particles in a fluidized bed. Adv. Powder Technol. 2012, 23, 673–681. [Google Scholar] [CrossRef]
  29. Ran, J.; Zhang, L.; Xin, M. Numerical simulation of gas-solid flow motion characteristics and deposition efficiency of particles in water-film cyclone separator. J. Chem. Ind. Eng. 2003, 54, 1391–1396. [Google Scholar]
  30. Wang, Z.; Ren, T. Investigation of airflow and respirable dust flow behaviour above an underground bin. Powder Technol. 2013, 250, 103–114. [Google Scholar] [CrossRef]
  31. Liu, Z.; Wang, X.; Cheng, Z.; Sun, R.; Zhang, A. Simulation of construction ventilation in deep diversion tunnels using Euler–Lagrange method. Comput. Fluids 2014, 105, 28–38. [Google Scholar] [CrossRef]
  32. Gui, C.; Geng, F.; Tang, J.; Niu, H.; Zhou, F.; Liu, C.; Hu, S.; Teng, H. Gas–solid two-phase flow in an underground mine with an optimized air-curtain system: A numerical study. Process Saf. Environ. Prot. 2020, 140, 137–150. [Google Scholar] [CrossRef]
  33. Benni, S.; Tassinari, P.; Bonora, F.; Barbaresi, A.; Torreggiani, D. Efficacy of greenhouse natural ventilation: Environmental monitoring and CFD simulations of a study case. Energy Build. 2016, 125, 276–286. [Google Scholar] [CrossRef]
  34. Colella, F.; Rein, G.; Verda, V.; Borchiellini, R. Multiscale modeling of transient flows from fire and ventilation in long tunnels. Comput. Fluids 2011, 51, 16–29. [Google Scholar] [CrossRef]
  35. Kurnia, J.C.; Sasmito, A.P.; Hassani, F.P.; Mujumdar, A.S. Introduction and evaluation of a novel hybrid brattice for improved dust control in underground mining faces: A computational study. Int. J. Min. Sci. Technol. 2015, 25, 537–543. [Google Scholar] [CrossRef]
  36. Guo, L.; Nie, W.; Yin, S.; Liu, Q.; Hua, Y.; Cheng, L.; Cai, X.; Xiu, Z.; Du, T. The dust diffusion modeling and determination of optimal airflow rate for removing the dust generated during mine tunneling. Build. Environ. 2020, 178, 106846. [Google Scholar] [CrossRef]
  37. Xiu, Z.; Nie, W.; Yan, J.; Chen, D.; Cai, P.; Liu, Q.; Du, T.; Yang, B. Numerical simulation study on dust pollution characteristics and optimal dust control air flow rates during coal mine production. J. Clean. Prod. 2020, 248, 119197. [Google Scholar] [CrossRef]
  38. Liu, Q.; Cheng, W.; Liu, L.; Hua, Y.; Guo, L.; Nie, W. Research on the control law of dust in the main ventilation system in excavated tunnels for cleaner production. Build. Environ. 2021, 205, 108282. [Google Scholar] [CrossRef]
  39. Liu, Q.; Nie, W.; Hua, Y.; Peng, H.; Liu, C.; Wei, C. Research on tunnel ventilation systems: Dust Diffusion and Pollution Behaviour by air curtains based on CFD technology and field measurement. Build. Environ. 2018, 147, 444–460. [Google Scholar] [CrossRef]
  40. Chen, Y.-S.; Hsiau, S.-S.; Lai, S.-C.; Chyou, Y.-P.; Li, H.-Y.; Hsu, C.-J. Filtration of dust particulates with a moving granular bed filter. J. Hazard. Mater. 2009, 171, 987–994. [Google Scholar] [CrossRef] [PubMed]
  41. Haider, A.; Levenspiel, O. Drag coefficient and terminal velocity of spherical and nonspherical particles. Powder Technol. 1989, 58, 63–70. [Google Scholar] [CrossRef]
  42. Morsi, S.A.; Alexander, A.J. An investigation of particle trajectories in two-phase flow systems. J. Fluid Mech. 1972, 55, 193–208. [Google Scholar] [CrossRef]
  43. Zeng, Z.; Zhou, L. A two-scale second-order moment particle turbulence model and simulation of dense gas–particle flows in a riser. Powder Technol. 2006, 162, 27–32. [Google Scholar] [CrossRef]
Figure 1. Photo of the grab-unloading operation site.
Processes 12 00049 g001
Figure 2. Grab-unloading experimental model.
Processes 12 00049 g002
Figure 3. Experimental measurement system.
Processes 12 00049 g003
Figure 4. Measurement and calculation of stacking angles.
Processes 12 00049 g004
Figure 5. Fugitive dust laws of different materials.
Processes 12 00049 g005
Figure 6. Maximum diffusion range of three different materials.
Processes 12 00049 g006
Figure 7. Selection of measurement points for dust concentration.
Processes 12 00049 g007
Figure 8. Variation law of dust concentration of three materials at measurement point 1.
Processes 12 00049 g008
Figure 9. Variation law of dust concentration of three materials at measurement point 2.
Processes 12 00049 g009
Figure 10. Variation law of dust concentration of three materials at measurement point 3.
Processes 12 00049 g010
Figure 11. The dust concentration-related characteristics at three measurement points.
Processes 12 00049 g011
Figure 12. The positions of five points on the plane of the hopper mouth.
Processes 12 00049 g012
Figure 13. Variation law of induced wind velocity by three types of materials at measurement point 1.
Processes 12 00049 g013
Figure 14. Variation law of induced wind velocity by three types of materials at measurement point 2.
Processes 12 00049 g014
Figure 15. Variation law of induced wind velocity by three types of materials at measurement point 3.
Processes 12 00049 g015
Figure 16. Variation law of induced wind velocity by three types of materials at measurement point 4.
Processes 12 00049 g016
Figure 17. Variation law of induced wind velocity by three types of materials at measurement point 5.
Processes 12 00049 g017
Figure 18. Variation law of induced wind characteristics at five measurement points.
Processes 12 00049 g018
Figure 19. Cuboid hopper and grab model.
Processes 12 00049 g019
Figure 20. Three-dimensional model of the fluid domain.
Processes 12 00049 g020
Figure 21. Grid independence verification.
Processes 12 00049 g021
Figure 22. Distribution of dust concentration at different times.
Processes 12 00049 g022
Figure 23. Comparison of dust concentration between simulation and experiment.
Processes 12 00049 g023
Figure 24. Motion trajectory and velocity distribution of particles and airflow fields.
Processes 12 00049 g024
Figure 25. Distribution curves of airflow velocity in hopper mouth plane at different times.
Processes 12 00049 g025aProcesses 12 00049 g025b
Figure 26. Relevant characteristics of upward airflow distribution in the hopper opening plane.
Processes 12 00049 g026
Figure 27. Relevant characteristics of downward airflow distribution in the hopper opening plane.
Processes 12 00049 g027
Table 1. Bulk material parameters.
Bulk MaterialBulk Material
Density (kg/m3)
Particle Size
Distribution (mm), Percentage of Weight
Moisture ContentStacking Angle (°)Type
Coal914Particle size     2, accounting for 43.7%,
Particle size     5.8, accounting for 56.3%.
0%30.36General material, granular and block combinations
Sand1567Particle size 2, accounting for 80.1%,
Particle size     5.8, accounting for 19.9%.
0%36.07Heavy material, granular
Flour643Particle size 0.106, accounting for 100%.12%42.71General material, dust
Table 2. Comparison of unloading processes of three different materials.
Bulk MaterialDuration of Dust Rising Diffusion (s)Emptying Time of Materials in the Grab (s)Maximum Diffusion Range of Dust (mm)
Transverse DimensionLongitudinal Dimension
Coal0–5.259531389
Sand0–6.55.78931540
Flour0–5.36.37691450
Table 3. EDEM parameters used in simulations.
NameTypeParameters
Bulk MaterialParticle diameter
distribution
Diameter (mm)5.8 and 1
Mass ratio56% and 44%
DistributionNormal distribution
Total mass of particles (kg)3.5
Particle Poisson ratio0.4
Particle density (kg/m3)1200
Particle Shear modulus (Pa)1.1 × 10⁷
Equipment MaterialGeometric Poisson ratio0.3
Geometric density (kg/m3)7850
Geometric Shear modulus (Pa)7.9 × 10¹⁰
InteractionParticle–particle restitution coefficient0.5
Particle–particle static friction coefficient0.6
Particle–particle rolling friction coefficient0.04
Particle–geometry restitution coefficient0.5
Particle–geometry static friction coefficient0.4
Particle–geometry rolling friction coefficient0.05
CalculationFixed Time Step (s)2 × 10⁻⁵
Total Time (s)100
Table 4. Fluent parameters used in simulations.
NameTypeParameters
GeneralTypePressure-based
TimeTransient
Gravity (m/s2)9.81
ModelsModelk-epsilon (2 eqn)
k-epsilon ModelRealizable
Near-Wall TreatmentStandard Wall Functions
Boundary ConditionsPressure inletGauge Pressure = 0
Pressure outletGauge Pressure = 0
WallWall MotionStationary Wall
DPMReflect
Solution MethodsSchemeCoupled
Discrete PhaseInjectionsCoal
Diameter DistributionRosin-Rammler
Dust ParticlesTotal Flow Rate (kg/s)0.0001
Min.Diameter (mm)8.5 × 10⁻⁴
Max.Diameter (mm)7.68 × 10⁻²
Mean.Diameter (mm)2.02 × 10⁻²
Spread Parameter3.5
Number of Diameters15
Stop Time (s)4.5
Turbulent DispersionDiscrete Random Walk Modelon
CalculationTime Step Size(s)4 × 10⁻⁴
Disclaimer/Publisher’s Note: The statements, opinions and data contained in all publications are solely those of the individual author(s) and contributor(s) and not of MDPI and/or the editor(s). MDPI and/or the editor(s) disclaim responsibility for any injury to people or property resulting from any ideas, methods, instructions or products referred to in the content.

