Abstract
This article presents the results of an experimental study on the effect of the selection of kinematic system for the drilling process on the cylindricity deviation, roundness deviation, diameter error and surface roughness of holes in brass alloy. Three different kinematic systems based on the dependence of the direction of rotation of the workpiece and the drill bit were used. The drill bit was mounted in an axially driven holder that allowed it to be put into motion. Cutting tests were conducted at three different spindle speeds and three different feed rates per revolution (27 tests in total). A static ANOVA analysis was used to evaluate the effect of each input parameter on each output parameter. The results of this work have practical applications in machining. The following input parameters of the drilling process should be used to obtain the smallest values of each output parameter: for CYL, n = 4775 rpm, fn = 0.14 mm/rev and KIN III; for RON, n = 4775 rpm, fn = 0.1 or 0.12 mm/rev and KIN II; for DE, n = 3979 rpm, fn = 0.1 mm/rev and KIN I; and for Rz, n = 4775 rpm, fn = 0.1 mm/rev and KIN II. This research work also used Grey Relational Analysis with which input parameter optimization was derived. The optimal drilling parameters are spindle speeds of 4775 rpm, a feed per revolution of 0.1 mm/rev and the use of the first kinematic system. This paper also includes equations for predicting each parameter that describes the dimensional and shape accuracy and roughness of the hole surface. Using the first kinematic system reduced the roughness of the hole surface by as much as 58%. The correct selection of kinematic system improved its dimensional accuracy by 15%. On the other hand, the roundness deviation of the hole improved by 33% and the cylindricity deviation of the hole by 6%.
1. Introduction
Brass materials are alloys consisting mainly of copper, zinc, lead, iron and nickel [1]. Lead is most often added to brass alloys because of its ability to improve the machinability of the alloys, providing excellent chip breakage and low tool wear [2,3]. However, this element is dangerous to living organisms, including humans, plants, animals and microorganisms, so its use is becoming increasingly restricted [4,5,6,7,8,9,10]. Brass alloys have applications in many industries including electronics, automotive, hydraulic and electrical [11,12,13].
Aized and Amjad [14] built a model in the form of a decimal logarithm equation considering spindle speed (n = 200; 500; 800 rpm), feed speed (f = 10; 15; 20 mm/min) and drilling methods (in several passes Q = 4; 8; 12 mm). They studied the effects of the above parameters on cylindricity deviation, roundness deviation, diameter error and the Rz parameter. The researchers in [15] presented only the roundness deviation of holes with the hole diameter as a function of feed rate (f = 56; 148; 278 mm/min) for three different cutting speeds (vc = 7; 21; 28 m/min). They showed that an increased feed per revolution improves the dimensional accuracy of the hole; however, it worsens the roundness deviation of the hole. Vipin and co-authors [16] proposed a model for predicting hole diameter errors, considering the following input parameters: tool material (M2 HSS; M35 HSS), tool diameter (d = 4; 8; 12 mm), spindle speed (n = 80; 160; 244 rpm), feed per revolution (fn = 0.1; 0.125; 0.15 mm/rev) and workpiece material (HCHCr High Carbon High Chromium, H11 Hot Die Steel and EN 31 die steels). They found that drill diameter had the greatest effect on surface roughness. For hole diameter error, the most influential parameters were the tool material and the workpiece material. An interesting approach was demonstrated by the researchers in [17], who developed models for predicting hole roundness deviation. They included three input parameters: feed rate (f = 5; 10; 15 mm/min, spindle speed (n = 2000; 3500; 5000 rpm) and coolant pressure (p = 2; 4; 6 bars). Spindle speed had a dominant effect on improving roundness compared to the other two process parameters. A low feed rate provided good hole roundness. Singh, Kumar and Saini [18] presented the effects of spindle speed (n = 800; 1200; 1600 rpm), feed per revolution (fn = 0.1; 0.14; 0.18 mm/rev) and tool tip angle (118°; 127°; 135°) on hole diameter error and hole surface roughness. They showed that the most influential input parameters were tip angle (32.7%) and spindle speed (28.6%). Aamir and his co-authors [19] did not present any mathematical model based on the results obtained for the roughness of the drilled holes. Perhaps this is because they took only feed per revolution (fn = 0.04; 0.08; 0.14 mm/rev) and spindle speed (n = 1007; 2015; 3025 rpm) as input parameters. Holes drilled in Al6061 alloy showed the lowest surface roughness due to the low silicon content. The highest surface roughness was obtained for holes drilled in Al5083 alloy. Spindle speed had a much greater effect than feed per revolution on surface roughness, regardless of alloy type. Researchers from Italy (Angelone et al.) observed the same results [20]. However, they found that spindle speed has a greater effect than feed per revolution. The lower the spindle speed, the lower the hole roughness obtained. In contrast, the researchers (Biermann et al.) in [21] presented only surface roughness, including only the Rz parameter for which the input parameter was only the tool. They concluded that an improvement in the Rz parameter could be obtained by using a suitable tool coating. A different approach was demonstrated by Khanna and co-authors [22], who examined only how the type of cooling (dry or cryogenic) affects the quality of the drilled hole. However, they did not change any of the input parameters. They found that cryogenic drilling significantly improves hole quality compared to dry drilling. A decrease in roundness deviation of 50–77%, cylindricity deviation of 13–51% and surface roughness of 47% was observed with cryogenic drilling. Several articles [23,24,25,26] examined how three different input parameters—spindle speed, feed per revolution and three different drilling strategies—affect cylindricity deviation, straightness deviation, roundness deviation and hole diameter error. The above studies show that the use of a suitable drilling strategy can significantly reduce the individual output parameters evaluated. An interesting approach was demonstrated by the researchers (Guba et al.) in [27]. They investigated the effect of vibration support during hole drilling on the Rz parameter (in three places at the entrance of the material’s middle and at the exit). The vibration support resulted in better chip breakage, which directly translated into better-drilled hole surfaces. Al-Tameemi and co-authors [28] studied the effects of drill coating (TiN/TiAlN, TiAlN and TiN), spindle speed (n = 1000; 2000; 3000 rpm) and feed rate (f = 50; 100; 150 mm/min) on the Rz parameter, Ra parameter, cylindricity deviation, roundness deviation, perpendicularity and hole dimension (at the bottom and at the top). They found that the worst dimension and roundness of the hole were obtained at low and medium spindle speeds and with TiN/TiAlN coatings. Tools with TiN/TiAlN coatings had the worst hole cylindricity of all coatings. Holes drilled with TiN-coated tools had the highest surface roughness. The researchers (Skrzyniarz et al.) in [29,30] examined how the relative displacement of the tool affects surface roughness. They also printed the drill using a direct metal laser melting method. After printing, the maximum surface height, Sz, was 67 μm. The parameter Sa was 7.74 μm. After grinding, both parameters were 11 μm and 0.86 μm, respectively. The authors in [31] studied hole accuracy against Si3N4 content (0%; 5%; 10%), drill diameter (d = 6; 8; 10 mm), feed per revolution (fn = 0.125; 0.575; 1.25 mm/rev) and spindle speed (n = 300; 580; 1160 rpm). They obtained the smallest values for the Ra parameter and hole cylindricity with a feed per revolution of 0.125 mm/rev, spindle speed of 300 rpm, drill diameter of 8 mm and Si3N4 content of 5%. The spindle speed had the greatest effect on the Ra parameter and the roundness of the hole. Bolat and co-authors [32] examined what effect different values of feed per revolution (fn = 0.05; 0.1; 0.2 mm/rev), cutting speed (vc = 15; 30; 45 m/min) and drill diameter (d = 3; 5 mm) and different types of tool (tip angle of drill 90°; 120°; 138°) have on hole surface roughness (parameter Sa). Their study shows that a tool with a tip angle of 120° significantly reduces the surface roughness. On the other hand, it increased with increasing cutting speed. Drilling with a 5 mm drill bit reduced surface roughness compared to a 3 mm drill bit. Aamir and co-authors [33] conducted metrological studies related to the diameter and circularity of the hole during dry machining with respect to varying technological parameters of the drilling process (n = 1500; 2500; 3500 rpm and fn = 0.04; 0.08; 0.14 mm/rev) and two drills (HSS; carbide). They showed that spindle speed has a non-significant effect on the parameters studied. Hole quality decreases with increasing feed per revolution. Ni et al. [34] checked how different values of technological parameters (n = 1000; 2000; 3000; 4000; 5000 rpm and f = 50; 100; 150; 200; 250 mm/min) affect surface roughness. The best surface quality was obtained when drilling with a high value of spindle speed and a low value of feed per revolution. An interesting approach was used by Jia et al. [35], who applied a nanosecond–millisecond laser pulse in the drilling of aluminum oxide ceramics. They showed that increasing the repetition rate of millisecond pulses improved the quality of drilling. Increasing the repetition rate of millisecond pulses improved hole diameters at the hole entrance. A very interesting article was the research of Wang et al. [36], who found that a method of producing patterned superhydrophobic surfaces can be achieved using femtosecond laser micromachining. This can produce a surface with very low surface roughness.
A review of the literature reveals the absence of any studies describing the combined effects of technological parameters and the choice of kinematic system on dimensional accuracy and hole surface roughness in CuZN40Pb2 brass. Most of the above studies focus on fixed technological parameters and one other selected input parameter such as tool coating, cutting fluid pressure or tool tip angle. Most of the studies focus only on single input parameters describing only surface roughness or cylindricity deviation. Therefore, we decided to measure as many as four parameters—cylindricity deviation, roundness deviation, diameter error and Rz parameter. The challenge in this research work was to arrange the experimental research methodology to be able to use different kinematic systems for the drilling process on a single station, which is presented later in this paper.
2. Materials and Methods
The material used in this study was CuZN40Pb2 brass. It shows good susceptibility to hot forming and forging. It is used in the manufacturing of complex parts, tubing, clamps and over-machined fittings. Figure 1a shows the points at which the current chemical composition of the material was measured. The measurement results are shown in Figure 1c. Figure 1b shows the Phenom XL scanning electron microscope used.
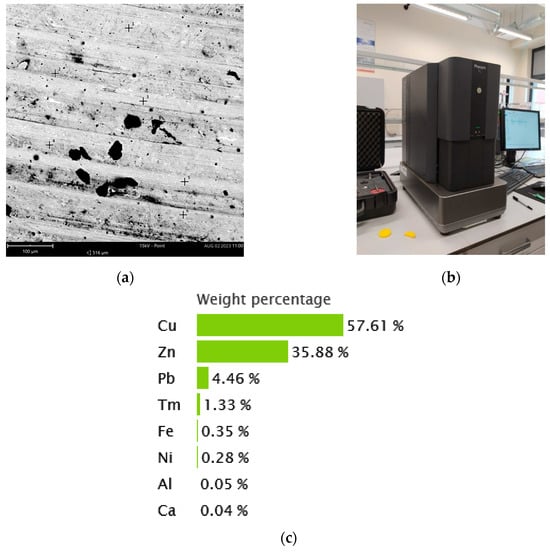
Figure 1.
(a) Measuring points on the SEM image; (b) Phenom XL scanning electron microscope; (c) weight-percent chemical composition of brass.
Testing of the drilling process was carried out on a Gildemeister (Bielefeld, Germany) model CTX alpha 500 turning center (Figure 2) located in the Laboratory of Numerically Controlled Machine Tools at the Kielce University of Technology. The machine tool had a twelve-position head with driven tools in VDI30 DIN 5480 (Sauter, Metzingen, Germany) standard (right side Figure 2), maximum spindle speed of 5000 rpm (left side Figure 2), drive power rating of 20 kW and torque of 2200 Nm. The machine, thanks to its design, has high rigidity, which provides stability to the machining processes. The machine tool also has a coolant-filtering station. A 6 mm diameter drill bit has been fixed in the driven tool head with an ER25 DIN 5480 collet (Orion, Ludwigsburg, Germany).
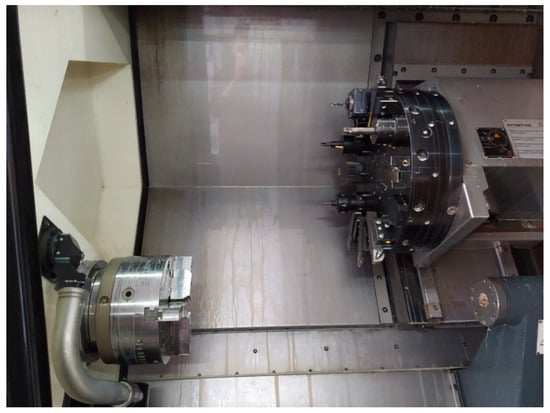
Figure 2.
View of the workspace of the CTX alpha 500 machine tool from DMG Gildemeister.
Before the drilling tests, 27 samples were prepared with a length and diameter of 30 mm (Figure 3a) so that the drilling depth divided by the drill diameter was 5 (to obtain deep through holes, L/d = 5). Figure 3b shows samples after drilling tests. Table 1 shows the three different applied values of each input parameter of spindle speed, feed per revolution and three different kinematic systems. The technological parameters were selected according to the drill manufacturer’s guidelines and book literature. The drilling process was carried out at a humidity of about 60% and an ambient temperature of 20 ℃. The kinematic system was mathematically described as the difference of tool speed and spindle speed (Equation (1)),
where KIN refers to the kinematic system, nn is tool speed and n is spindle speed.
KIN = nn − n
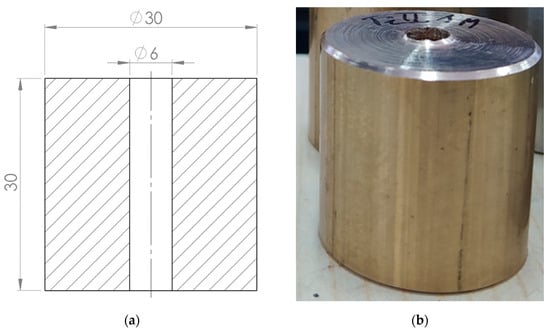
Figure 3.
(a) Technical drawing of samples; (b) sample after drilling tests.

Table 1.
Input parameters used in the drilling experiments.
Figure 4 shows the three kinematic systems used, depending on the direction of rotation of the tool and the spindle. In the first kinematic system (Figure 4a), the tool performs rotary motion, while the workpiece is stationary. In the second kinematic system (Figure 4b), the tool is stationary, while the workpiece performs rotary motion. In the third kinematic system (Figure 4c), the tool performs rotary motion, while the workpiece performs rotary motion in the opposite direction of the tool’s rotation.
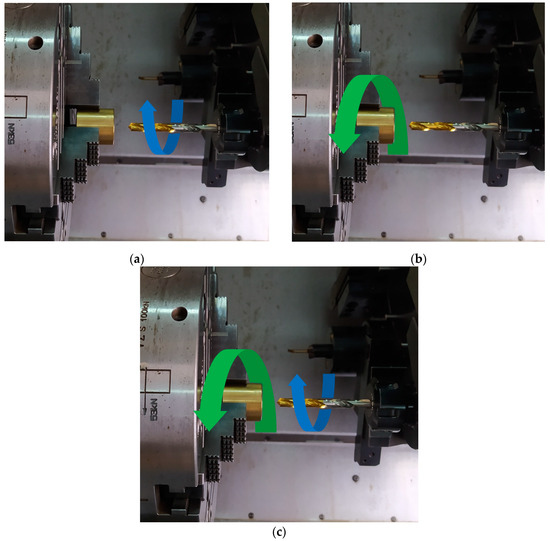
Figure 4.
(a) First kinematic system; (b) second kinematic system; (c) third kinematic system.
Metrological measurements of the parameters describing dimensional/form accuracy were performed on a Prismo Navigator coordinate measuring machine from Zeiss (Oberkochen, Germany). For this purpose, the stylus was armed with a ruby ball with a diameter of 1.5 mm. Measurements of roundness deviation and hole diameter error were taken at a speed of 5 mm/s, and 1500 measurement points were collected at five levels. For cylindricity deviation measurements, a cross-sectional measurement strategy was used, and a Gaussian filter was set at 15 UPR. Figure 5 shows an example of a sample measurement. The measurement of surface roughness, or more precisely, the sum of the height of the highest profile elevation and the depth of the lowest profile depression inside the elementary section (Rz), was performed on a Taylor Hobson Form Talysurf PGI 1230 contact profilometer using a diamond tip with a rounding radius of 2 µm at a speed of 0.5 mm/s. The parameter was calculated on an elementary section of 0.8 mm, and Gaussian filtration was set to 0.8. The sampling step was 0.125 µm.
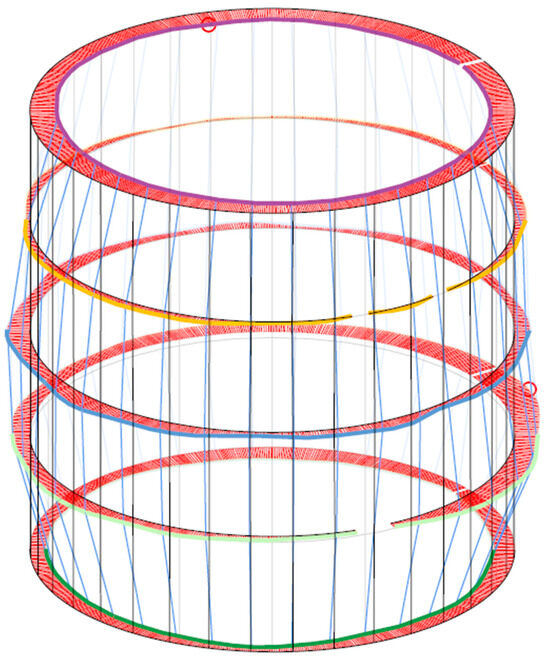
Figure 5.
Illustrated measurement result of the through hole.
3. Results
3.1. Measurement Results
The results of the metrological tests have been illustrated in order to clearly present the measurement data in relation to the tested input parameters (spindle speed, feed per revolution and kinematic system). Figure 6a shows that the smallest value of cylindricity deviation of 62.3 µm was obtained using the third kinematic system, a spindle speed of 4775 rpm and a feed per revolution of 0.14 mm/rev. It was noted that the smallest values in most cases were obtained using the third kinematic system, regardless of the technological parameters used. From Figure 6b, the smallest roundness deviation value of 3.2 µm was obtained using the second kinematic system, a spindle speed of 4775 rpm and two different feeds per revolution of 0.1 or 0.12 mm/rev. In this case, the use of the second kinematic system indicates that the smallest values of roundness deviation of the hole were obtained. In Figure 6c, the most accurate hole relative to the dimension was obtained with the first kinematic system using a spindle speed of 3979 rpm and a feed per revolution of 0.1 mm/rev. It was noticed that when the first kinematic system was used, regardless of the technological parameters, the most accurate hole relative to its nominal dimension was obtained. As shown in Figure 6d, the smallest Rz parameter value of 1.819 µm was obtained using the second kinematic system, a spindle speed of 4775 rpm and the smallest feed per revolution of 0.1 mm/rev. In this case, it can be seen that the highest value of hole roughness can be obtained with the third kinematic system.
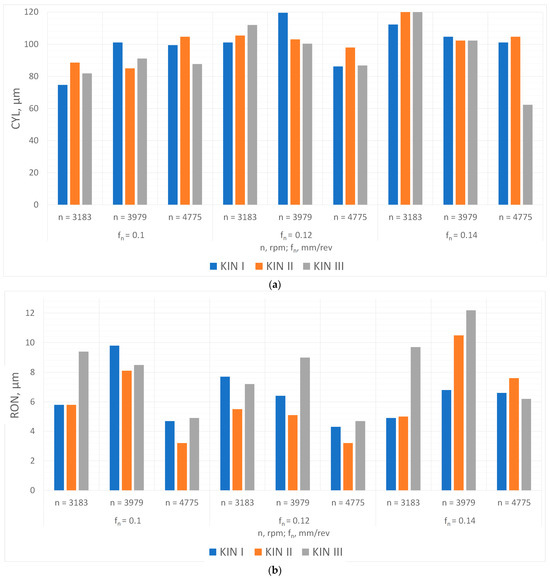
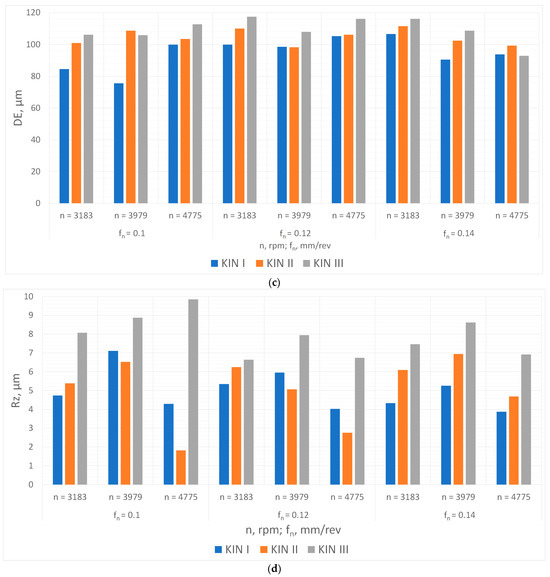
Figure 6.
Graphical representation of the metrological measurements for (a) cylindricity deviation; (b) roundness deviation; (c) diameter error; (d) parameter Rz.
3.2. ANOVA Analysis
Multivariate ANOVA statistical analysis was used to analyze the metrological results to determine the effect of the input parameters on the cylindricity deviation, roundness deviation, diameter error and Rz parameter of the hole. The analysis used a surface response model due to the inclusion of principal and higher orders for the predictors and the occurrence of all possible combinations of product predictors, as shown in Equation (2).
The analysis used a 95% confidence interval at the 5% significance level. In the analysis, the mean square and sum of square values were used to calculate F. The F value was checked using statistical tables to read the significance of a given analysis. In Table 2 and Figure 7a,b, it can be seen that feed per revolution achieved a 41.72% influence on hole cylindricity. Next, with almost the same influence, was spindle speed at 41.37%; the rest went to the kinematic system at 16.91%. In contrast, spindle speed had the greatest influence on the roundness of the hole at 56.6%, followed by feed per revolution at 26.99% and the kinematic system at 16.41%. Analyzing the data in Table 3 and Figure 7c,d, we found that feed per revolution achieved a 40.57% influence on hole diameter error. The next parameter was the kinematic system at 37.05%, and the rest went to spindle speed at 22.38%. For the Rz parameter, it can be seen that the influence of the kinematic system was the largest compared to that of the other parameters. It obtained an influence of 68.57% on the Rz parameter. Another influential input parameter was spindle speed at 25.32%, with a slight influence of feed per revolution at 6.11%.

Table 2.
ANOVA results for the process parameters and the type of kinematic system for the cylindricity deviation and roundness deviation.
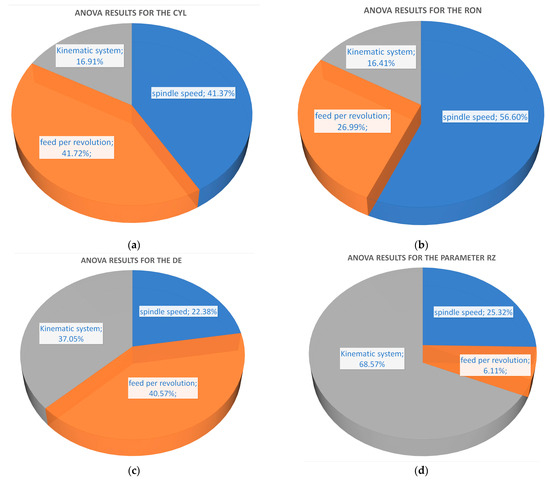
Figure 7.
Percentage influence of technological parameters and kinematic system for the (a) cylindricity deviation, (b) roundness deviation, (c) diameter error, (d) parameter Rz.

Table 3.
ANOVA results for the process parameters and the type of kinematic system for the diameter error and parameter Rz.
Figure 8 shows a comparison of the experimental and predictive values. As can be seen, these results are in very good correlation (R2 = 0.7011 for CYL, R2 = 0.6818 for RON, R2 = 0.7427 for DE and R2 = 0.8784 for Rz).
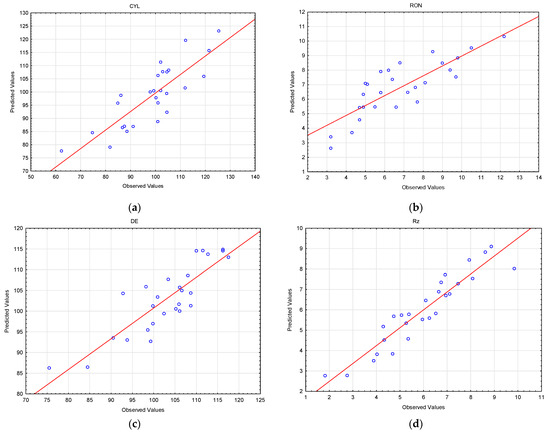
Figure 8.
Comparison of experimental and predictive values for the (a) cylindricity deviation, (b) roundness deviation, (c) diameter error, (d) parameter Rz.
From the data shown in Figure 9, it can be seen that when a spindle speed of 4775 rpm was used, the lowest value of cylindricity deviation of 92.3 µm was obtained. The most favorable feed rate per revolution, for which a cylindricity deviation value (CYL) of 90.4 µm was obtained, is 0.1 mm/rev. When kinematic system three was used in the drilling process of CuZN40Pb2 brass alloy, the smallest value of hole cylindricity deviation of 93.9 µm was obtained. It was noted that an increase in the value of spindle speed and a decrease in the value of feed per revolution resulted in a decrease in the value of hole cylindricity deviation in CuZN40Pb2 brass alloy.
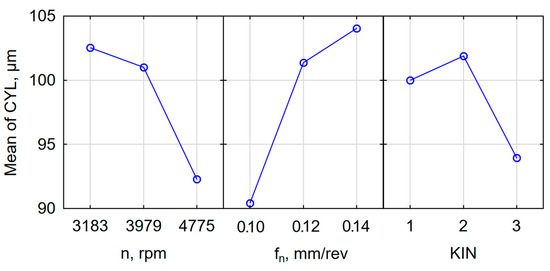
Figure 9.
Graphs of the main effects of cylindricity deviation in relation to the technological parameters used and kinematic system.
In Figure 10, it can be seen that when a spindle speed of 4775 rpm was used, the lowest roundness deviation value of 5 µm was obtained. The most favorable feed rate per revolution, for which a roundness deviation value (RON) of 5.9 µm was obtained, is 0.12 mm/rev. When kinematic system two was used in the drilling process, the smallest value of roundness deviation of the hole of 6 µm was obtained.
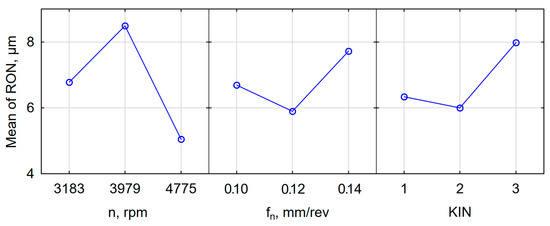
Figure 10.
Graphs of the main effects of roundness deviation in relation to the technological parameters used and kinematic system.
Figure 11 shows that when a spindle speed of 3979 rpm was used, the smallest diameter error value of 99.6 µm was obtained. The most favorable feed rate per revolution, for which a diameter error (DE) value of 99.7 µm was obtained, is 0.11 mm/rev. When CuZN40Pb2 brass alloy was used in the drilling process, the first kinematic system obtained the smallest hole diameter error value of 94.9 µm.
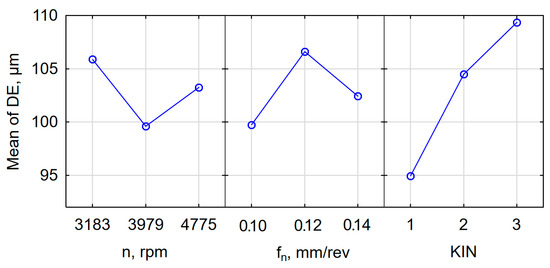
Figure 11.
Graphs of the main effects of diameter error in relation to the technological parameters used and kinematic system.
Figure 12 shows that when a spindle speed of 4775 rpm was used, the lowest value of the Rz parameter of 4.998 µm was obtained. The most favorable feed rate per revolution, for which an Rz parameter value of 5.637 µm was obtained, is 0.12 mm/rev. When the first kinematic system was used in the drilling process, the smallest value of the Rz parameter of 4.994 µm was obtained.
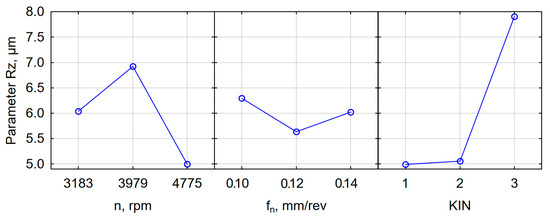
Figure 12.
Graphs of the main effects of parameter Rz in relation to the technological parameters used and kinematic system.
3.3. Simulation of the Rz parameter
The results of the ANOVA analysis showed that a very large effect of the kinematic system was noticed in the Rz parameter, so Equation (6) was simulated to illustrate the change in the value of the aforementioned parameter. Analyzing Figure 13a, for the first kinematic system, we found that when a feed per revolution of 0.12 mm/rev to 0.14 mm/rev and the highest value of spindle speed of 4775 rpm were used, the lowest value for the Rz parameter was obtained. The largest value of the Rz parameter was obtained when the smallest feed per revolution of 0.1 mm/rev and a spindle speed of 3775 rpm were used. Analyzing Figure 13b, for the second kinematic system, we found that when a feed per revolution of 0.1 mm/rev to 0.13 mm/rev and the highest value of spindle speed of 4775 rpm were used, the smallest value of the Rz parameter was obtained. In this case, changing the spindle speed drastically affects the change in the value of the Rz parameter. However, an increase in feed rate per revolution does not change the value of the above-mentioned parameter very much. In this case, the highest value of the studied parameter was obtained for the highest value of feed per revolution of 0.14 mm/rev and a spindle speed from 3500 rpm to 3900 rpm. It was deduced from Figure 13c that for the third kinematic system, when a feed per revolution of 0.11 mm/rev to 0.14 mm/rev and a spindle speed value of 3183 rpm or 4775 rpm were used, the smallest value of the Rz parameter was obtained. The largest value of the tested parameter was obtained using the same parameters as for the first kinematic system.
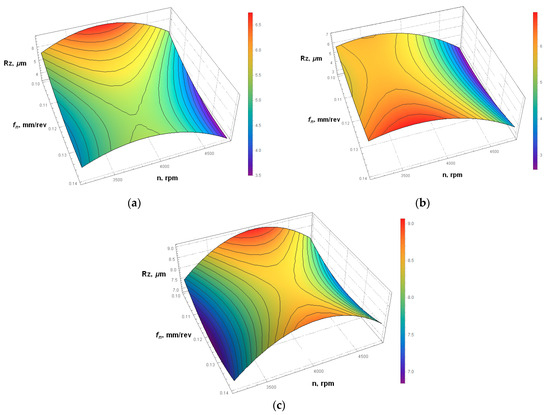
Figure 13.
Simulation of Equation (6) for parameter Rz (a) using the first kinematic system; (b) using the second kinematic system; (c) using the third kinematic system.
3.4. Grey Relational Analysis
Grey Relational Analysis (GRA) was used to select the most optimal process-input parameters. Grey Relational Analysis is a multi-criteria optimization that allows the optimization of input parameters against the obtained experimental results. In the above analysis, the complex multi-response optimization problem can be simplified to a single-response GRA optimization. There are three optimization methods: smaller better, nominal better and larger better. In this case, we are interested in obtaining the smallest possible output values; therefore, the first optimization (smaller better) was used [37,38]. The first step in this optimization is to normalize the data and put them in an orthogonal table (L27, Table 4). The values of cylindricity deviation, roundness deviation, diameter error and Rz parameter were normalized and given values from 0 to 1 using Equation (7).

Table 4.
Normalized data Grey Relational Analysis.
In the next step, sequences of deviations were calculated using Equation (8). In order to calculate the coefficients and the degree of gray relationship, a discriminant coefficient of 0.5 was selected in Equation (9). If an experiment obtains the highest gray relationship score with the reference sequence, it means that the comparison sequence is most similar to the reference sequence and that this experiment would be the best choice. The results of the gray-relationship coefficients and their evaluation are shown in Table 5. This table shows that the smallest values of all parameters tested can be obtained using the 20th experiment (n = 4775 rpm; fn = 0.1 mm/rev and the second kinematic system).

Table 5.
Coefficients of gray relational and their evaluation with rank.
The effect of each value of spindle speed, feed per revolution and kinematic system is summarized in Table 6 and shown in Figure 14. The higher the GRA value, the better the performance. Figure 14 shows that the smallest average values of cylindricity deviation, roundness deviation, diameter error and parameter Rz were obtained for a spindle speed of 4775 rpm, a feed per revolution of 0.1 mm/rev and using the first kinematic system.

Table 6.
The main influence of factors on the grey relational grade.
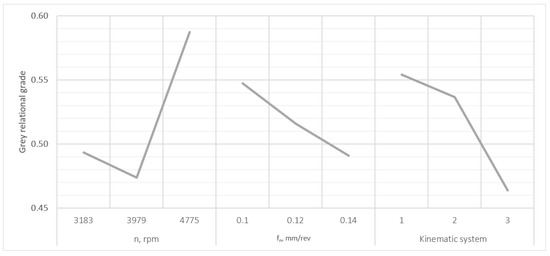
Figure 14.
Extracted response for each input parameter value of the drilling process for main GRA values.
4. Conclusions
Drilling tests conducted on CuZN40Pb2 brass in different kinematic systems facilitated the determination of the influence of each input parameter (n, fn, KIN) on output parameters (CYL, RON, DE, Rz). The authors present the practical application of the above studies in the production of various components in order to optimize the input parameters relative to the output parameters.
The main conclusions of the study are listed below:
- Using the correct kinematic system reduced the roughness of the hole surface by as much as 58%. The correct choice of kinematic system improved its dimensional accuracy by 15%. On the other hand, the roundness deviation of the hole improved by 33%, and the cylindricity deviation of the hole improved by 6%;
- Equations (3)–(6) describe the values of the output parameters very well (R2 = 0.7011 for CYL, R2 = 0.6818 for RON, R2 = 0.7427 for DE and R2 = 0.8784 for Rz);
- ANOVA analysis presented the input parameters that were the most influential on the output parameters; for CYL, it was fn = 41.72%; for RON, it was n = 56.6%; for DE, it was fn = 40.57% and for Rz, it was KIN = 68.57%;
- In order to obtain the smallest values for the individual output parameters, use the following input parameters for the drilling process: for CYL, n = 4775 rpm, fn = 0.14 mm/rev and KIN III; for RON, n = 4775 rpm, fn = 0.1 or 0.12 mm/rev and KIN II; for DE, n = 3979 rpm, fn = 0.1 mm/rev and KIN I; for Rz, n = 4775 rpm, fn = 0.1 mm/rev and KIN II;
- From the grey-relationship analysis, the smallest average values for cylindricity deviation, circularity deviation, diameter error and parameter Rz were obtained with a spindle speed of 4775 rpm, a feed per revolution of 0.1 mm/rev and using the first kinematic system;
- Future work will include surveys of the height and width of the burrs at the entrance and exit of the holes. These will reduce additional operations, which will translate into direct costs.
Author Contributions
Conceptualization, M.B. and S.L.; methodology, M.B. and B.K.; software, M.B. and B.K.; formal analysis, M.B. and S.L.; investigation, M.B.; resources, M.B.; data curation, M.B. and B.K.; writing—original draft preparation, M.B.; writing—review and editing, M.B. and S.L. All authors have read and agreed to the published version of the manuscript.
Funding
This research received no external funding.
Data Availability Statement
Data are contained within the article.
Conflicts of Interest
The authors declare no conflicts of interest.
Nomenclature
| spindle speed, rpm | |
| nn | tool speed, rpm |
| feed per revolution, mm/rev | |
| KIN | kinematic system |
| SS | sum of squares |
| DF | degrees of freedom |
| MS | mean square |
| CYL | cylindricity deviation, µm |
| RON | roundness deviation, µm |
| DE | diameter error, µm |
| UPR | undulations per revolution |
| p | significance |
| PC | percentage contribution |
References
- Vilarinho, C.; Davim, J.P.; Soares, D.; Castro, F.; Barbosa, J. Influence of the chemical composition on the machinability of brasses. J. Mater. Process. Technol. 2005, 170, 441–447. [Google Scholar] [CrossRef]
- Gane, N. The effect of lead on the friction and machining of brass. Philos. Mag. A 1981, 43, 545–566. [Google Scholar] [CrossRef]
- Nobel, C.; Klocke, F.; Lung, D.; Wolf, S. Machinability Enhancement of Lead-free Brass Alloys. Procedia CIRP 2014, 14, 95–100. [Google Scholar] [CrossRef]
- Juncker, J.-C. Commission Regulation (EU) 2015/62. Off. J. Eur. Union 2015, L11, 37–43. [Google Scholar]
- Buzek, J.; Györi, E. Directive 2011/65/EU on restriction of the use of certain hazardous substances in electrical and electronic equipment. Off. J. Eur. Union 2011, L54, 88–110. [Google Scholar]
- Schultheiss, F.; Johansson, D.; Bushlya, V.; Zhou, J.; Nilsson, K.; Ståhl, J.-E. Comparative study on the machinability of lead-free brass. J. Clean. Prod. 2017, 149, 366–377. [Google Scholar] [CrossRef]
- Tascioglu, E.; Zoghipour, N.; Sharif, S.; Kaynak, Y. Machining-induced Surface Integrity in Brass Alloys. Procedia CIRP 2022, 108, 654–659. [Google Scholar] [CrossRef]
- Mudipalli, A. Lead hepatotoxicity & potential health effects. Indian J. Med. Res. 2007, 126, 518–527. [Google Scholar]
- Mushak, P. Perspectives in Environmental Research. Environ. Sci. Technol. 1992, 59, 281–309. [Google Scholar]
- Rosner, D. A Lead Poisoning Crisis Enters Its Second Century. Health Aff. 2016, 35, 756–759. [Google Scholar] [CrossRef][Green Version]
- Zoghipour, N.; Celik, F.; Tascioglu, E.; Kaynak, Y. Development of an artificial neural network model for criticizing the burr formation during flat bottom drilling of CuZn38As brass alloy considering cutting tool geometry. Procedia CIRP 2023, 117, 396–401. [Google Scholar] [CrossRef]
- Zoghipour, N.; Tascioglu, E.; Atay, G.; Kaynak, Y. Machining-induced surface integrity of holes drilled in lead-free brass alloy. Procedia CIRP 2020, 87, 148–152. [Google Scholar] [CrossRef]
- Johansson, J.; Persson, H.; Ståhl, J.-E.; Zhou, J.-M.; Bushlya, V.; Schultheiss, F. Machinability Evaluation of Low-Lead Brass Alloys. Procedia Manuf. 2019, 38, 1723–1730. [Google Scholar] [CrossRef]
- Aized, T.; Amjad, M. Quality improvement of deep-hole drilling process of AISI D2. Int. J. Adv. Manuf. Technol. 2013, 69, 2493–2503. [Google Scholar] [CrossRef]
- Szwajka, K.; Zielińska-Szwajka, J. Wpływ wybranych parametrów skrawania na dokładność obróbki w procesie wiercenia stopu Ti6Al4V. Zesz. Nauk. Politech. Rzesz. 2019, 299, 79–92. [Google Scholar] [CrossRef]
- Kant, S.; Jawalkar, C.S. Parametric Modeling in Drilling of Die Steels using Taguchi Method based Response Surface Analysis. Mater. Today Proc. 2018, 5, 4531–4540. [Google Scholar] [CrossRef]
- Prasanna, J.; Karunamoorthy, L.; Raman, M.V.; Prashanth, S.; Chordia, D.R. Optimization of process parameters of small hole dry drilling in Ti–6Al–4V using Taguchi and grey relational analysis. Measurement 2014, 48, 346–354. [Google Scholar] [CrossRef]
- Singh, P.K.; Kumar, K.; Saini, P. Optimization of surface roughness and hole diameter accuracy in drilling of EN-31 alloy steel—A TGRA based analysis. Mater. Today Proc. 2020, 26, 2961–2971. [Google Scholar] [CrossRef]
- Aamir, M.; Tolouei-Rad, M.; Giasin, K.; Vafadar, A. Machinability of Al2024, Al6061, and Al5083 alloys using multi-hole simultaneous drilling approach. J. Mater. Res. Technol. 2020, 9, 10991–11002. [Google Scholar] [CrossRef]
- Angelone, R.; Caggiano, A.; Improta, I.; Nele, L.; Teti, R. Roughness of composite materials: Characterization of hole quality in drilling of Al/CFRP stacks. Procedia CIRP 2020, 88, 473–478. [Google Scholar] [CrossRef]
- Biermann, D.; Heilmann, M.; Kirschner, M. Analysis of the Influence of Tool Geometry on Surface Integrity in Single-lip Deep Hole Drilling with Small Diameters. Procedia Eng. 2011, 19, 16–21. [Google Scholar] [CrossRef]
- Khanna, N.; Agrawal, C.; Gupta, M.K.; Song, Q. Tool wear and hole quality evaluation in cryogenic Drilling of Inconel 718 superalloy. Tribol. Int. 2020, 143, 106084. [Google Scholar] [CrossRef]
- Bronis, M.; Miko, E.; Nozdrzykowski, K. Drilling Strategies to Improve the Geometrical and Dimensional Accuracy of Deep through Holes Made in PA6 Alloy. Materials 2023, 16, 110. [Google Scholar] [CrossRef] [PubMed]
- Bronis, M.; Miko, E.; Nowakowski, L.; Bartoszuk, M. A Study of the Kinematics System in Drilling Inconel 718 for Improving of Hole Quality in the Aviation and Space Industries. Materials 2022, 15, 5500. [Google Scholar] [CrossRef] [PubMed]
- Bronis, M.; Miko, E.; Nowakowski, L. Influence of the Kinematic System on the Geometrical and Dimensional Accuracy of Holes in Drilling. Materials 2021, 14, 4568. [Google Scholar] [CrossRef] [PubMed]
- Bronis, M.; Miko, E.; Nowakowski, L. Analyzing the Effects of the Kinematic System on the Quality of Holes Drilled in 42CrMo4 + QT Steel. Materials 2021, 14, 4046. [Google Scholar] [CrossRef]
- Guba, N.; Schumski, L.; Paulsen, T.; Karpuschewski, B. Vibration-assisted deep hole drilling of the aluminum material AlMgSi0.5. CIRP J. Manuf. Sci. Technol. 2022, 36, 57–66. [Google Scholar] [CrossRef]
- Al-Tameemi, H.A.; Al-Dulaimi, T.; Awe, M.O.; Sharma, S.; Pimenov, D.Y.; Koklu, U.; Giasin, K. Evaluation of Cutting-Tool Coating on the Surface Roughness and Hole Dimensional Tolerances during Drilling of Al6061-T651 Alloy. Materials 2021, 14, 1783. [Google Scholar] [CrossRef]
- Skrzyniarz, M.; Nowakowski, L.; Miko, E.; Borkowski, K. Influence of Relative Displacement on Surface Roughness in Longitudinal Turning of X37CrMoV5-1 Steel. Materials 2021, 14, 1317. [Google Scholar] [CrossRef]
- Skrzyniarz, M.; Nowakowski, L.; Blasiak, S. Geometry, Structure and Surface Quality of a Maraging Steel Milling Cutter Printed by Direct Metal Laser Melting. Materials 2022, 15, 773. [Google Scholar] [CrossRef]
- Vinay, K.B.; Prakash, G.V.N.; Gowda, D.S.R.; Nithyananda, B.S.; Ranjith, K.; Srikantamurthy. The Effect of Process Parameters on Quality Characteristics in the Drilling of Aluminium–Metal Matrix Composites. Eng. Proc. 2023, 59, 53. [Google Scholar]
- Bolat, Ç.; Karakılınç, U.; Yalçın, B.; Öz, Y.; Yavaş, Ç.; Ergene, B.; Ercetin, A.; Akkoyun, F. Effect of Drilling Parameters and Tool Geometry on the Thrust Force and Surface Roughness of Aerospace Grade Laminate Composites. Micromachines 2023, 14, 1427. [Google Scholar] [CrossRef] [PubMed]
- Aamir, M.; Sharif, A.; Zahir, M.Z.; Giasin, K.; Tolouei-Rad, M. Experimental Assessment of Hole Quality and Tool Condition in the Machining of an Aerospace Alloy. Machines 2023, 11, 726. [Google Scholar] [CrossRef]
- Ni, J.; Zeng, X.; Al-Furjan, M.S.H.; Zhao, H.; Guan, L.; Cui, Z.; Han, L. Effect of Drilling Parameters on Machining Performance in Drilling Polytetrafluoroethylene. Materials 2022, 15, 6922. [Google Scholar] [CrossRef]
- Jia, X.; Chen, Y.; Wang, H.; Zhu, G.; Zhu, X. Experimental study on nanosecond-millisecond combined pulse laser drilling of alumina ceramic with different spot sizes. Opt. Laser Technol. 2020, 130, 106351. [Google Scholar] [CrossRef]
- Wang, C.; Ding, K.; Song, Y.; Jia, X.; Lin, N.; Duan, J. Femtosecond laser patterned superhydrophobic surface with anisotropic sliding for droplet manipulation. Opt. Laser Technol. 2024, 168, 109829. [Google Scholar] [CrossRef]
- Adin, M.S.; İşcan, B.; Baday, S. Machining fiber-reinforced glass-epoxy composites with cryo-treated and untreated HSS cutting tools of varying geometries. Mater. Today Commun. 2023, 37, 107301. [Google Scholar] [CrossRef]
- Nagendra, J.; Yadav, G.P.K.; Srinivas, R.; Gupta, N.; Bandhu, D.; Fande, A.; Saxena, K.K.; Djavanroodi, F.; Saadaoui, S.; Iqbal, A.; et al. Sustainable shape formation of multifunctional carbon fiber-reinforced polymer composites: A study on recent advancements. Mech. Adv. Mater. Struct. 2023, 30, 1–35. [Google Scholar] [CrossRef]
Disclaimer/Publisher’s Note: The statements, opinions and data contained in all publications are solely those of the individual author(s) and contributor(s) and not of MDPI and/or the editor(s). MDPI and/or the editor(s) disclaim responsibility for any injury to people or property resulting from any ideas, methods, instructions or products referred to in the content. |
© 2024 by the authors. Licensee MDPI, Basel, Switzerland. This article is an open access article distributed under the terms and conditions of the Creative Commons Attribution (CC BY) license (https://creativecommons.org/licenses/by/4.0/).