Abstract
The pursuit of low-energy-consumption CO2 capture technology has promoted the renewal and iteration of absorbents for chemical absorption. In order to evaluate the regeneration energy consumption of absorbents and obtain the distribution of energy consumption, a coupling method combining rigorous energy balance and simple estimation is proposed in this study. The data regarding energy balance and material balance from process simulation are transformed into the model parameters required in the simple estimation model. Regenerative energy consumption and distribution are determined by the empirical estimation formula. Two CO2 capture processes of an MEA aqueous solution and MEA–n-propanol aqueous solution (phase-change absorbent) were used to verify the feasibility and applicability of the coupling method. The effects of n-propanol concentration, CO2 loading in the lean solution, and temperature on energy consumption were discussed. The results show that the energy consumption of 30 wt% MEA aqueous solution is the lowest at 3.92 GJ·t−1-CO2 when CO2 load in the lean solution is 0.2 mol CO2·mol−1-MEA, and the reaction heat Qrec, sensible heat Qsen, and latent heat Qlatent were 1.97 GJ·t−1-CO2, 1.09 GJ·t−1-CO2, and 0.86 GJ·t−1-CO2, respectively. The lowest energy consumption of the phase-change absorbent with CO2 loading of 0.35 mol CO2·mol−1-MEA in the lean solution is 2.32 GJ·t−1-CO2. Qrec, Qsen, and Qlatent were 1.9 GJ·t−1-CO2, 0.29 GJ·t−1-CO2, and 0.14 GJ·t−1-CO2, respectively. This study provides a simple and meaningful method for accurately assessing absorber performance and process improvement, which can accelerate the development of economically viable, absorption-based CO2 capture processes.
1. Introduction
For an extended duration, the reliance of industrial growth on fossil fuels has led to substantial CO2 emissions, resulting in numerous environmental problems [1]. The focus on carbon emission reduction has become a global consensus, and CO2 capture, utilization, and storage is one of the most direct and effective ways to achieve carbon emission reduction [2]. CO2 capture technologies encompass chemical absorption, physical adsorption, membrane separation, and cryogenic separation [3,4]. Chemical absorption, with the advantages of its high capture efficiency, superior adaptability, and mature technology, has been extensively studied. However, the high energy consumption of the CO2 desorption process with single-component amine absorbents leads to elevated costs, which restrict the wider application of CO2 capture technology by chemical absorption [5]. The 30 wt% monoethanolamine (MEA) solution has generally been used as a reference absorbent for comparison of the performance of various CO2 absorbents [6]. Ethylenediamine (EDA) has two amine groups that can increase the CO2 capture capacity per unit of solvent [7], whereas N-methyldiethanolamine (MDEA) and piperazine (PZ) have a higher absorption capacity and an improved rate of absorption. The novel absorbents including composite amines, sterically hindered amines, and phase-change absorbents have been developed to simultaneously satisfy the requirements for a high absorption rate, large absorption capacity, and low energy consumption during regeneration [8].
The primary or secondary amine and the tertiary amine are mixed in a certain proportion to form a composite amine absorbent, serving as the absorbent for industrial applications. An MDEA–PZ composite amine absorbent of 30% MDEA and 20% PZ solutions was used for post-combustion CO2 capture in a power plant, and the regeneration energy consumption of the composite amine absorbent was 27.7% lower than that of the 30% MEA solution [9]. The regeneration energy consumption of a composite amine absorbent composed of 3.0 mol·L−1 MEA, 2.5 mol·L−1 MDEA, and 0.5 mol·L−1 PZ demonstrated superior performance with approximately a 50% reduction compared to the conventional 5 mol·L−1 MEA [10]. The absorption rates of benzylamine (BZA) in combination with N,N-diethylethanolamine (DEEA) and 1-dimethylamino-2-propanol (1DMA2P) were similar to MEA, and the regeneration heat load of BZA-1DMA2P was 44.7% of the MEA aqueous solution [11]. The saturated absorption capacity of the composite adsorbent with a mass ratio of 1:1 between triethylene tetramine (TETA) and 2-Amino-2-methyl-1-propanol (AMP) was nearly 100% greater than that of the single-component AMP absorbent [12]. The CO2 absorption capacity of the composite adsorbent consisting of a 30% MEA solution and a 10% 1,8-diazabicyclo[4,5,0]undec-7-en-imidazole ([HDBU][Im]) mixture reached 0.1453 g CO2 per gram of composite amine absorbent. Furthermore, the viscosity of the composite absorbent was significantly reduced compared to the ionic liquid absorbent [13]. The main composite amine absorbents are summarized in Table 1.

Table 1.
Absorption performance of composite amine absorbents.
The phase-change CO2 capture using phase-change solvents was developed to reduce the latent heat consumption for vaporization in CO2 capture. After the phase-change solvent captured CO2, a substantial amount of water and the phase-separated solvent were partitioned into the lean phase; thus, the water content in the rich phase was reduced, ultimately leading to a decrease in the desorption energy consumption. A significant reduction in the regeneration energy consumption was achieved by using a phase-change solvent consisting of 50% DEEA and 25% hydroxyethyl ethylenediamine (AEEA) from 4.8 GJ·t−1-CO2 of the conventional 30% MEA solvent to 2.58 GJ·t−1-CO2 [17]. A summary of the main phase-change absorptions is provided in Table 2.
Table 2.
Absorption performance of phase-change absorbents.
One of the main motivations for developing the new absorbents is to solve the bottleneck of CO2 desorption energy consumption, which requires a simple and accurate calculation method for evaluating the regeneration energy consumption. These methods can be categorized into the rigorous energy balance methods from process simulation and the simplified estimation methods from solvent properties. The rigorous energy balance methods are dependent on the physical properties of software systems and the absorption–desorption process model to obtain the energy consumption. Abu-Zahra et al. [28] studied the influence of the MEA concentration, CO2 loading of the lean solution, and the pressure and temperature on desorption heat using Aspen Plus. When the lean loading was 0.3 mol CO2·mol−1 MEA, MEA concentration was 40%; the desorption tower operating pressure was 210 kPa and desorption heat reached 3.01 GJ·t−1-CO2 accompanied by a power consumption of 182 kWh·t−1 CO2. Similar research has been carried out by Alie [29], Jassim [30], and Sigh [31] who employed either Aspen Plus V11.1 or Hysys V7.0 software, which proved the feasibility of the rigorous energy balance calculation model. However, the rigorous energy balance methods from process simulation cannot directly determine the energy consumption distribution of the regeneration process, while the energy distribution is crucial for identifying the bottlenecks of energy consumption.
The energy consumption distribution of the regeneration process can be determined by the simplified estimation methods from solvent properties. The regeneration energy consumption of the CO2 capture process is divided into four parts, including the sensible heat (Qsen), CO2 desorption reaction heat (Qrec), latent heat (Qlatent) of vaporization, and heat loss [32]. The heat loss was predominantly influenced by the insulation efficiency, and constituted a relatively minor portion of the total energy consumption [33] and could be ignored. The sensible heat can be calculated via a straightforward enthalpy balance relationship, while the heat of reaction can be precisely estimated by employing the Gibbs–Helmholtz equation and vapor–liquid equilibrium (VLE) data. Leites et al. [34] derived a direct estimation formula from the fundamental principles of thermodynamics to analyze the effects of the mass concentration of the absorbent and the regeneration degree of the solution on the desorption process. The estimation formula was applied to the annual production of 1 million tons of CO2 capture, and the result showed a total energy consumption of 4.7 GJ·t−1-CO2, including 1.45 GJ·t−1-CO2 of sensible heat, 1.92 GJ·t−1-CO2 of reaction heat, and 1.32 GJ·t−1-CO2 of latent heat [35]. Compared to the rigorous energy balance method, the simplified estimation method generally exhibited simplicity and good computational efficiency. However, some empirical coefficients or parameters were involved, leading to a calculation accuracy that was inferior to the rigorous energy balance method.
Based on the advantages of the above two methods, a coupled method that takes into account total regeneration energy consumption and the energy distribution was proposed based on the merits of both approaches. Two CO2 capture processes of the MEA aqueous solution and MEA–n-propanol aqueous solution (phase-change absorbent) were used to verify the feasibility and applicability of the coupling method. The effects of n-propanol concentration, CO2 loading in the lean solution, and temperature on energy consumption were also discussed.
2. Methodology
The fundamental concept of the coupled approach consisted of three stages, as illustrated in Figure 1: Initially, a rigorous absorption and desorption process model was developed using process simulation software. This was in order to obtain energy balance and material balance data to better explain the material transfer and heat transfer mechanisms, which can help to optimize the operating conditions. The absorption and desorption processes were simulated under various operating conditions, such as different temperatures, pressures, etc., in order to evaluate their impact on the performance of the CO2 capture process. Subsequently, the unknown data required in the simplified estimation model, including parameters, such as the molar amount of CO2 per ton of CO2 product (M) and the molar amount of water vapor per ton of CO2 product (mw), was derived from process model. Finally, the parameters were incorporated into the corresponding formula of regeneration energy consumption and energy distribution to realize the coupling of the rigorous process model and the quick calculation of the regeneration energy consumption and energy distribution. MEA is the most widely used, industrially mature absorbent, while the phase-change absorbent has great energy-saving advantages; therefore, the two typical absorbents were selected for the case study.
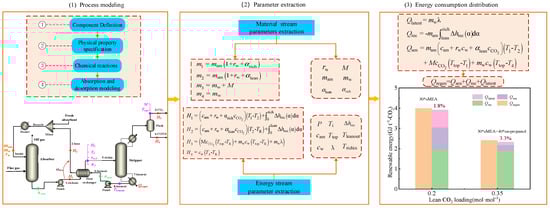
Figure 1.
Schematic illustration of the computational algorithm integrating the coupled approach of rigorous energy balance and simplified estimation.
2.1. Process Modeling
The detailed flue gas composition and operating parameters employed in this study are comprehensively presented in Table 3. The process models including component definition, physical method selection, and chemical reactions in the absorption and desorption processed were built in the simulation platform Aspen Plus V11.
Table 3.
Composition of flue gas and operational conditions.
The study employed two absorbent systems, namely, a 30% MEA aqueous solution and a 30% MEA + 40% n-propanol aqueous solution. Ionic species such as MEA+, MEACOO−, and H3O+, in addition to conventional neutral components, were involved in the process. In view of the presence of ionic components within the weak electrolyte system, the liquid and gas properties were typically computed by the ELECNRTL or ENRTL-RK methods. The ENRTL-RK model and the PC-SAFT equation of state were chosen to calculate the liquid-phase and gas-phase properties. CO2, O2, and N2 were employed as Henry’s gases, with Henry’s law was employed for the calculations. The rate-based model was thereby closer to the actual process than the equilibrium model, providing a comprehensive consideration of reaction thermodynamics and kinetics. The CO2 capture by MEA involved a two-step mechanism: (1) MEA, a primary amine, initially reacted with CO2 to generate the amphoteric ion MEAH+COO−, which served as the rate-controlling step. (2) The amphoteric ion reacted with MEA to produce the carbamate (MEACOO−) and the protonated amine MEAH+, via an acknowledged transient reaction. The chemical reactions pertinent to the absorption and desorption process can be found in the Supplementary Materials.
In the present study, the conventional CO2 capture process with the 30% MEA aqueous solution is depicted in Figure 2. In addition to the names used to simplify the associated thermal and mass terminology, numbers have been assigned to process streams around the stripper heat exchanger in Figure 2. The operational conditions of the absorber were 1.1 bar and 40–60 °C, while the operational conditions of the desorber were 1.1 bar and 90–130 °C. The pressure loss in the desorber was negligible. A high concentration of CO2 was obtained at the top of the desorber, and the desorbed lean liquid was collected at the bottom, feeding into the subsequent cycle. A rich–poor liquid heat exchanger was installed to maximize the heat exchange between the hot and cold streams. The main heat exchanger possessed a ΔTMTA of 10 °C. The CO2 capture rate was slated to achieve 90%, along with a CO2 purity of 90%.
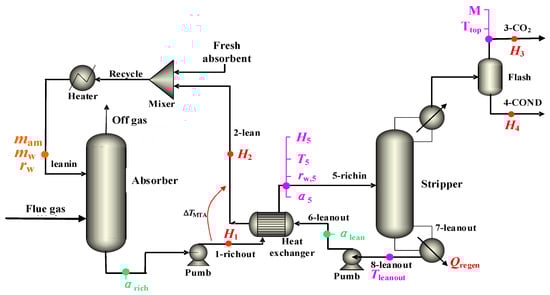
Figure 2.
CO2 capture process with 30% MEA aqueous solution. (Hi (kJ·mol−1) as the mole enthalpy of amines in the ith stream for i = 1 and 2 and the stream itself for i = 3 and 4; Ti (K) denotes the temperature of the stream at i = 1–8; Trichin= T5, Ttop = T3, and αi denotes CO2 loading as moles of CO2 per mole of amine; rw is molar ratio of water to amine in unloaded solvent; M (mol·t−1 CO2) denotes molar amount of CO2 per ton of CO2 product).
The phase-change CO2 capture process is illustrated in Figure 3. The physical property methods and chemical reactions were identical to those of the conventional CO2 capture process. The primary distinction was in the presence of the phase separation phenomenon unique to the phase-change process, which was characterized in the process model by the utilization of a Sep phase separator. The two-phase solution was formed in the phase separator, with the upper phase representing the lean phase and the lower phase representing the rich phase. N-propanol in the lean phase does not participate in the reaction and is directly integrated into the circulation with the supplemented fresh amine and the circulating lean solution, flowing into the absorption tower. The rich phase (an aqueous solution enriched with carbon dioxide) was transported to the tower of desorption after the heat exchange.
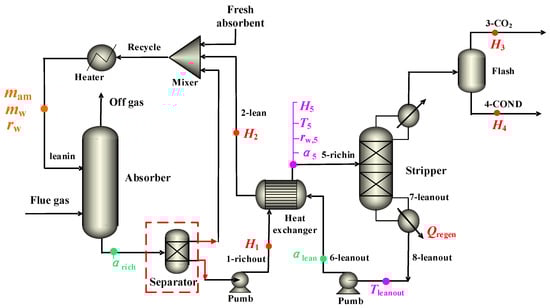
Figure 3.
Phase-change CO2 capture process with 30% MEA + 40% n-propanol aqueous solution. (Hi (kJ·mol−1) as the mole enthalpy of amines in the ith stream for i = 1 and 2 and the stream itself for i = 3 and 4; Ti (K) denotes the temperature of the stream at i = 1–8; Trichin = T5, Ttop = T3, and αi denotes CO2 loading as moles of CO2 per mole of amine; rw is molar ratio of water to amine in unloaded solvent; M (mol·t−1 CO2) denotes molar amount of CO2 per ton of CO2 product).
2.2. Parameter Extraction
The material and heat balance data can be extracted from the stream information, including the information on eight streams, including a rich stream from the bottom of the absorber tower, a desorber outlet stream through the heat exchanger, a product stream from the top of the desorber, water flowing back from the top of the desorber, a rich stream entering the desorber, a lean stream at the bottom of the desorber, streams entering and exiting the reboiler at the bottom of the desorber, and a lean stream heated by the reboiler, as shown in Figure 2 and Figure 3.
We define mam (mol·t−1 CO2) as the molar amount of amines in the circulating solvent streams per ton of CO2 product. In addition, let us define rw as the molar ratio of water to amines in the unloaded solvent. The mass balance parameters of the relevant flow streams in the absorption and desorption towers are used to derive the regeneration energy equation, as illustrated in Equations (1)–(4).
The calculation of the regeneration energy consumption is based on the energy balance parameters derived from the relevant flow streams of the absorption and desorption towers, as illustrated in Equations (5)–(8).
where λ (kJ·mol−1) denotes the latent heat of water and Ttop = T3. Note that the heat capacity, c is molar based and has the unit of kJ·mol−1·K−1.
2.3. Energy Consumption Distribution
The energy consumption, denoted as Qregen, of the reboiler is articulated as follows:
If the heat of reaction, Δhrec (kJ·mol−1 of CO2), is a function of CO2 loading and the reference states associated with the four streams in Equation (9) are the unloaded liquid solvent, gaseous CO2, and liquid water. The total energy consumption for regeneration can be fundamentally divided into three components: sensible heat, reaction heat, and latent heat. Consequently, the overall energy consumption for regeneration can be represented as follows:
The distributions of the three energy terms are represented as follows:
In Equation (11), T2 − T1 is defined as ΔTMTA (the lowest temperature approach value), which minimizes Qsen. The value of Δhrec can be derived from the following Gibbs–Helmholtz equation:
2.4. Determination of CO2 Loading
The lean CO2 loading is a crucial factor influencing the energy consumption in CO2 capture by chemical absorbents [36,37,38]. The formula for CO2 loading is presented in Equation (15).
The investigation of the conventional process with the MEA aqueous solution, focusing on the main heat exchanger and the reboiler, reveals significant disparities in the energy distribution of αlean value for different values below and above 0.2 mol CO2·mol−1 MEA. This means that the energy balance methods are discussed with respect to the center point of 0.2, as shown below:
The energy balance equation for αlean > 0.2 is presented in Equation (16).
Of these, H1 and H2 are listed above and the remaining enthalpies are calculated as follows:
The tower pressure varies only slightly from top to bottom, and the top pressure (Ptotal) can be determined by Equation (19).
T6 can be determined from Equation (19), so that Equation (16) has three unknowns, T5, rw,5l, and α5l, which can be determined using the following two relations:
The energy balance equation for αlean < 0.2 is presented in Equation (22).
Of these, H6 is given above and H7 and H8 are as follows:
The reboiler energy consumption varies greatly when the lean loading is less than 0.2, and the pressure change affects the lean loading; the top pressure is re-specified in Equation (25)
2.5. Case Analysis
2.5.1. Case I: CO2 Capture Process with 30% MEA Aqueous Solution
The mass balance of the CO2 capture process with 30% MEA aqueous solution was calculated based on the process models delineated in Section 2.1, and the results are presented in Table 4. The key model parameters for CO2 capture with 30% MEA aqueous solution can be extracted from Table 4 and then transformed based on the models delineated in Section 2.2, and the results are shown in Table 5. The energy consumption distribution can be calculated by incorporating solvent properties and parameters from Table 5 into the simplified estimation models. The renewable energy consumption for CO2 capture with 30% MEA aqueous solution is 3.92 GJ·t−1-CO2 with values of the heat of reaction (Qrec) of 1.97 GJ·t−1-CO2, sensible heat (Qsen) of 1.09 GJ·t−1-CO2, and latent heat (Qlatent) of 0.86 GJ·t−1, respectively. The discrepancy with the rigorous balance method’s value of 3.99 GJ·t−1-CO2 is 1.8%, as shown in Figure 4.
Table 4.
Critical stream data for CO2 capture with 30% MEA aqueous solution.
Table 5.
Solvent properties and parameters for CO2 capture with 30% MEA aqueous solution.
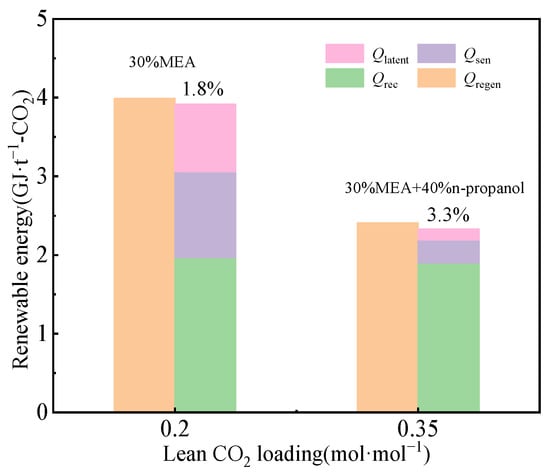
Figure 4.
Energy consumption distribution with 30% MEA aqueous solution and 30% MEA + 40% n-propanol aqueous solution.
2.5.2. Case II: Phase-Change CO2 Capture Process
The mass balance of the CO2 capture process with 30% MEA + 40% n-propanol aqueous solution was calculated based on the process models delineated in Section 2.1, and the results are presented in Table 6. The key model parameters for CO2 capture with 30% MEA + 40% n-propanol aqueous solution can be extracted from Tab le 6 and transformed based on the models delineated in Section 2.2, and the results are shown in Table 7.
Table 6.
Key stream data for CO2 capture with 30% MEA + 40% n-propanol aqueous solution.
Table 7.
Solvent properties and parameters for CO2 capture with 30% MEA + 40% n-propanol aqueous solution.
The energy consumption distribution can be calculated by incorporating solvent properties and parameters in Table 7 into the simplified estimation models. The renewable energy consumption for CO2 capture with 30% MEA + 40% n-propanol aqueous solution is 2.33 GJ·t−1-CO2 with values of Qrec = 1.9 GJ·t−1-CO2, Qsen = 0.29 GJ·t−1-CO2, and Qlatent = 0.14 GJ·t−1-CO2, respectively. The discrepancy with the rigorous balance method’s value of 2.41 GJ·t−1-CO2 is 3.3%, as shown in Figure 4. Compared to the conventional CO2 capture process with 30% MEA aqueous solution, the liquid–liquid phase separation behavior in the phase-change CO2 capture process is expected to significantly reduce the water content of rich liquid. This contributes to the reduction in the latent heat of water evaporation by 0.72 GJ·t−1-CO2 and sensible heat required to warm the liquid by 0.80 GJ·t−1-CO2. The aforementioned examples corroborate the efficacy of the proposed method in this study.
3. Results and Discussions
3.1. Impact of n-Propanol on Energy Consumption
The CO2 capture process with a phase-change absorbent has been proposed to decrease energy consumption for desorption. The conceptual model of an MEA-based phase-change absorbent is illustrated in Figure 5. As the CO2 absorption reaction proceeds, the ionic species, including carbamate, and protonated MEA are formed. The concentration of hydrophilic carbamate and protonated MEAH+ gradually increases, leading to the gradual evolution of more water clusters around them, and n-propanol molecules are repelled by water and form clusters. The occurrence of phase separation is triggered when the concentration of carbamate and protonated MEA reaches a specific value due to immiscibility between the hydrophilic carbamate and the hydrophobic n-propanol. This results in the enrichment of n-propanol in the upper layer and the accumulation of CO2 in the lower phase [39]. The potential benefits of phase-change absorbents not only include a reduced liquid flow rate entering the desorption tower but also an enhanced CO2 recycling capacity, which leads to a significant reduction in the energy consumption for regeneration.
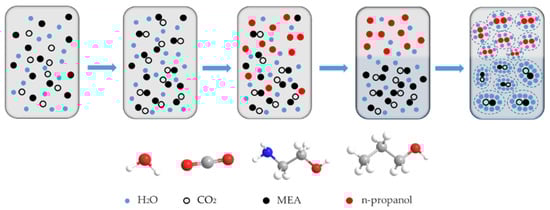
Figure 5.
Conceptual model of CO2 phase-change solvent capture.
The n-propanol concentration ascertains the phase separation performance, as depicted in Figure 6. A rise in the initial concentration of n-propanol leads to an increase in the CO2 loading of the lower phase, while the CO2 loading of the upper phase remains constant, indicating the CO2 partition coefficient is augmented. The total regeneration energy consumption initially decreased and then increased with the n-propanol concentration rising from 20 to 60 wt%, and the minimum was observed at 40 wt%, as shown in Figure 7. The composition ratio of 3/4/3 for MEA/n-propanol/water in the phase-change absorbent is a more rational composition ratio.
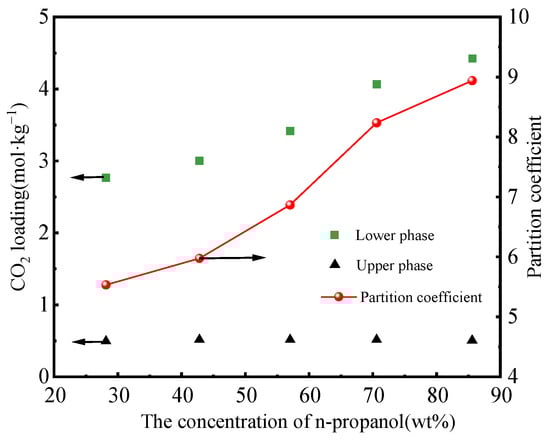
Figure 6.
CO2 loading and partition coefficients for phase-change absorbers [38].
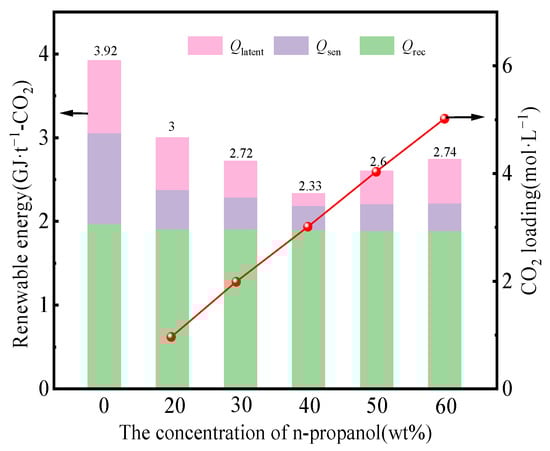
Figure 7.
Energy consumption and CO2 loading at different n-propanol concentrations.
3.2. Impact of CO2 Loading in the Lean Liquid on Energy Consumption
The CO2 loading of the lean solution is a crucial factor influencing the energy consumption of the desorption tower. The variation in regeneration energy consumption with respect to the lean CO2 loading at varying regeneration pressures is depicted in Figure 8. The dashed line in Figure 8 indicates the parameter points that are infeasible due to the constraint of solution degradation temperature. With an increase in the lean CO2 loading rate, the regeneration energy consumption exhibits the consistent trends that firstly decrease and then increase, achieving its minimum value at a CO2 loading of 0.2 mol·mol−1 for the MEA aqueous solution and 0.35 mol·mol−1 for the phase-change absorbent, respectively. This is consistent with the findings of Alie et al. [29].
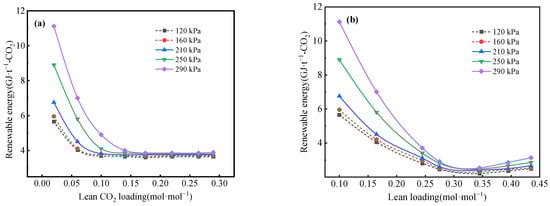
Figure 8.
Regeneration energy consumption versus lean CO2 loading for (a) MEA aqueous solution and (b) phase-change solution at different pressures.
Temperature is another factor that affects the CO2 loading of the lean solution, as shown in Figure 9. In the conventional absorption process, Ttop and Trichin exhibit similar characteristics within the αlean > 0.2 domain. For αlean < 0.2, additional heat is supplied to the reboiler in order to enhance CO2 expulsion via elevating the reboiler temperature. In the phase-change CO2 capture process, with the increase in lean CO2 loading, Ttop, Trichin, and Tleanout decreased. Ttop changes significantly compared with Trichin; when CO2 loading in the lean liquid is greater than 0.25 mol·mol−1, Trichin will be greater than Ttop.
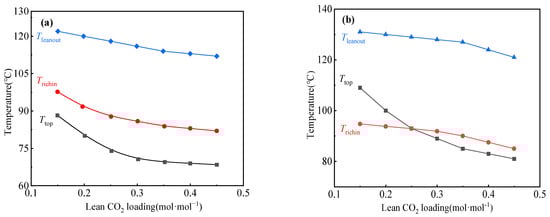
Figure 9.
Temperature versus lean CO2 loading for (a) aqueous MEA solution and (b) phase-change solution.
The variation in the energy consumption with the lean CO2 loading is depicted in Figure 10. This is based on the rigorous energy balance method and coupled methods, and the effects of the lean CO2 loading on the three energy terms (Qrec, Qsen, and Qlatent). The quantity of Qrec remains virtually unaltered within the contemplated range of αlean. In the CO2 capture process with the 30% MEA aqueous solution, the value of Qlatent augments when αlean is less than 0.2, and the corresponding increment in Qsen is observed with the elevation of αlean. In the phase-change CO2 capture process with the 30% MEA + 40% n-propanol aqueous solution, the value of Qrec remains approximately unchanged within the contemplated range of αlean. This is consistent with the traditional CO2 capture process with the 30% MEA aqueous solution. Both Qsen and Qlatent firstly decreased with the increase in CO2 load in the lean solution, achieving its minimum value at a CO2 loading of 0.35 mol·mol−1.
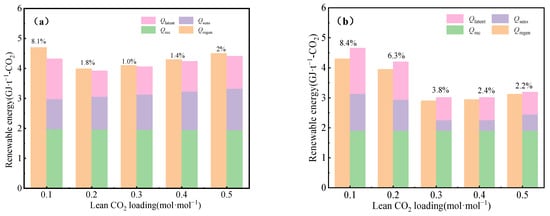
Figure 10.
Distribution of regeneration energy consumption of (a) MEA aqueous solution and (b) phase-change solution.
3.3. Economic Analysis
The process operation cost includes the equipment investment cost and labor operation costs. The equivalent abatement cost of the equipment investment cost is approximately 18.2 CNY·t−1-CO2 and the annual labor running cost is approximately 71.3 CNY·t−1-CO2. The supplemental cost of MEA is 28 CNY·t−1-CO2, and the supplemental cost of n-propanol is 23 CNY·t−1-CO2 [40,41]. The energy costs incurred per ton of CO2 recovered are mainly generated by steam heating in the desorption tower. In general, the combustion of 0.034 g of standard coal produces 1 kJ of heat. The thermal efficiency for coal combustion is reported as 70%, while steam heating exhibits efficiencies of 50% [42,43]. In total, 3.92 GJ·t−1-CO2 costs 346.6 CNY·t−1-CO2, and 2.33 GJ·t−1-CO2 costs 205.9 CNY·t−1-CO2. Therefore, the phase-change absorption process is 40.6% less expensive than conventional MEA in terms of the steam energy cost for the desorption process.
4. Conclusions
Combining the advantages of a rigorous energy balance and simple estimation, a methodology is proposed to address the total renewable energy consumption and energy distribution. The minimized energy consumption for CO2 capture via an MEA aqueous absorbent is 3.92 GJ·t−1- CO2 at αlean = 0.2, with values of Qrec = 1.97 GJ·t−1-CO2, Qsen = 1.09 GJ·t−1-CO2, and Qlatent = 0.86 GJ·t−1. The discrepancy with the rigorous balance method’s value of 3.99 GJ·t−1-CO2 is 1.8%. The minimized energy consumption for CO2 capture via the 30% MEA + 40% n-propanol aqueous solution at αlean = 0.35, with values of Qrec = 1.9 GJ·t−1-CO2, Qsen = 0.29 GJ·t−1-CO2, and Qlatent = 0.14 GJ·t−1-CO2. The discrepancy with the rigorous balance method’s value of 2.41 GJ·t−1-CO2 is 3.3%. The liquid–liquid phase separation behavior in the phase-change CO2 capture process reduces the water content of rich liquid, contributing to the reduction in the latent heat of water evaporation and sensible heat from warming the liquid.
This study enables more reliable solvent screening with minimal experimental data and clearly indicates the direction of energy consumption reduction. At the industrial level, this study provides a simple and meaningful method to accurately assess absorber performance and process improvements, and it can accelerate the development of economically viable, absorption-based CO2 capture processes.
Supplementary Materials
The following supporting information can be downloaded at: https://www.mdpi.com/article/10.3390/pr12010187/s1, Table S1. Capture system process parameters. Table S2. Reaction equations in MEA–H2O–CO2 system. Table S3. Stoichiometric coefficient of equilibrium constant from [44,45]. Table S4. Reaction kinetic parameters Ai and Ei in finite rate reactions.
Author Contributions
Conceptualization, D.W. and L.L.; methodology, D.W.; software, H.Z., Y.Y. and J.X.; validation, J.X.; formal analysis, D.W. and L.L.; investigation, D.W. and L.L.; resources, D.W. and L.L.; writing—original draft preparation, L.L.; writing—review and editing, D.W.; supervision, D.W.; project administration, X.F.; funding acquisition, D.W. All authors have read and agreed to the published version of the manuscript.
Funding
The authors would like to give thanks for the financial support received from the Joint Funds of the National Natural Science Foundation of China (No. U22A20415), the Basic Research Innovation Group Project of Gansu Province (No. 22JR5RA219), and the Key Research and Development Program of Gansu Province (No. 22YF7GA160).
Data Availability Statement
The data presented in this study are available on request from the first author.
Conflicts of Interest
Xueying Fan was employed by the company Lanzhou Petrochemical Company of PetroChina. The remaining authors declare that the research was conducted in the absence of any commercial or financial relationships that could be construed as a potential conflict of interest.
Nomenclature
| AEEA | Ethylenediamine |
| AMP | 2-Amino-2-methyl-1-propanol |
| CCUS | Carbon dioxide capture, utilization and storage |
| COND | Condensate |
| CNY | Chinese Yuan |
| c | Heat capacity, kJ·mol−1·K−1 |
| DEEA | N,N-diethylethanolamine |
| EDA | Ethylenediamine |
| Hi | Mole enthalpy of amines in the ith stream for i = 1 and 2 and the stream itself for i = 3 and 4 Enthalpy per mole of amine in the stream and mole of the stream itself |
| [HDBU][Im] | 1,8-diazabicyclo[5,4,0]undec-7-en-imidazole |
| MDEA | N-methyldiethanolamine |
| MEA | Monoethanolamine |
| M | Molar amount of CO2 per ton of CO2 product, mol·t−1 CO2 |
| mi | Molar flow rate in the flow stream, mol·t−1 CO2 |
| mam | Molar amount of amine in the circulating solvent stream per ton of CO2 Product, mol·t−1 CO2 |
| mw | Molar amount of water vapor per ton of CO2 product, kJ·mol−1 |
| (T, α) | CO2 vapor pressure, kPa |
| PZ | Piperazine |
| Qlatent | Heat of evaporation of water, GJ·t−1-CO2 |
| Qrec | Heat t of desorption reaction, GJ·t−1-CO2 |
| Qregen | Energy consumption of the reboiler, GJ·t−1-CO2 |
| Qsen | Sensible heat required to warm the absorber, GJ·t−1-CO2 |
| rw | Molar ratio of water to amine in unloaded solvent |
| TETA | Triethylene tetramin |
| T | Absolute temperature, K |
| 1DMA2P | 1-dimethylamino-2-propanol |
| α | CO2 loading as moles of CO2 per mole of amine |
| αlean | Lean liquid CO2 loading as moles of CO2 per mole of amine |
| αrich | Rich liquid CO2 loading as moles of CO2 per mole of amine |
| λ | Latent heat of water, kJ·mol−1 |
| ΔTMTA | Minimum heat transfer temperature difference |
References
- Jiang, H.; Liu, Y.; Feng, Y. Analysis of power generation technology trend in 14th Five-Year Plan under the background of carbon peak and carbon neutrality. Power Gener. Technol. 2022, 43, 54–64. [Google Scholar] [CrossRef]
- Zhang, Z.; Wang, T.; Blunt, M. Advances in carbon capture, utilization and storage. Appl. Energy 2020, 278, 115627. [Google Scholar] [CrossRef]
- Peng, Z.; Zhao, Y.; Huang, C. Recent advances in amine-based solid sorbents for post-combustion CO2 capture system. Chem. Ind. Eng. Prog. 2018, 37, 610–620. [Google Scholar] [CrossRef]
- Zhang, W.; Li, J.; Wang, Q. Review on membrane wettability of membrane CO2 absorption method from coal-fired flue gas. Chem. Ind. Eng. Prog. 2019, 38, 3866–3873. [Google Scholar] [CrossRef]
- Liu, B.; Wu, L.; Dong, X. Experimental study on the recycling of a variety of organic amine absorbers. Sci. Technol. Chem. Ind. 2017, 25, 20–25. [Google Scholar]
- Lu, S.; Gong, Y.; Liu, L. Research status and future development direction of CO2absorption technology for organic amine. Clean. Coal Technol. 2022, 28, 44–54. [Google Scholar] [CrossRef]
- Josselyne, A.; Villarroel, A.; Alfredo, V.; Marvin, R. Kinetic and Thermodynamic Analysis of High-Pressure CO2 Capture Using Ethylenediamine: Experimental Study and Modeling. Energies 2021, 14, 6822. [Google Scholar] [CrossRef]
- Zhang, S.; Shen, Y.; Wang, L. Phase change solvents for post-combustion CO2 capture: Principle, advances, and challenges. Appl. Energy 2019, 239, 876–897. [Google Scholar] [CrossRef]
- Zhao, B.; Liu, F.; Cui, Z. Enhancing the energetic efficiency of MDEA/PZ-based CO2 capture technology for a 650 MW power plant: Process improvement. Appl. Energy 2017, 185, 362–375. [Google Scholar] [CrossRef]
- Zhang, R.; Zhang, X.; Yang, Q. Analysis of the reduction of energy cost by using MEA-MDEA-PZ solvent for post-combustion carbon dioxide capture (PCC). Appl. Energy 2017, 205, 1002–1011. [Google Scholar] [CrossRef]
- Chen, Y. CO2 Absorption and Desorption Performance of BZA-DEEA/DMEA/1DMA2P /AMP Binary Blended Amines; Xiangtan University: Xiangtan, China, 2019. [Google Scholar]
- Sun, L.; Lian, S.; Wang, K. Research on aqueous TETA/AMP solution for CO2 capture. Clean. Coal Technol. 2020, 26, 58–63. [Google Scholar] [CrossRef]
- Wang, K.; Li, T.; Li, Y. Efficiently CO2capture by superbase ionic liquid-amine-water blending solvents. Chin. J. Chem. Eng. 2023, 23, 781–789. [Google Scholar]
- Lv, B.; Yang, K.; Zhou, X. 2-Amino-2-methyl-1-propanol based non-aqueous absorbent for energy-efficient and non-corrosive carbon dioxide capture. Appl. Energy 2020, 264, 114703. [Google Scholar] [CrossRef]
- Tao, M.; Gao, J.; Zhang, W. A novel phase-changing nonaqueous solution for CO2 capture with high capacity, thermostability, and regeneration efficiency. Ind. Eng. Chem. Res. 2018, 57, 9305–9312. [Google Scholar] [CrossRef]
- Guo, H.; Li, C.; Shi, X. Nonaqueous amine-based absorbents for energy efficient CO2 capture. Appl. Energy 2019, 239, 725–734. [Google Scholar] [CrossRef]
- Wang, T.; Liu, F.; Fang, M. Research Progress in Biphasic Solvent for CO2 Capture Technology. Proc. CSEE 2021, 41, 1186–1196. [Google Scholar] [CrossRef]
- Zhang, W.; Zhou, W.; Wang, Q. Recent developments of phase-change absorption technology for CO2 capture from flue gas. Chem. Ind. Eng. Prog. 2022, 41, 2090–2101. [Google Scholar] [CrossRef]
- Zhang, W.; Jin, X.; Tu, W. A novel CO2 phase change absorbent: MEA/1-propanol/H2O. Energy Fuels 2017, 31, 4273–4279. [Google Scholar] [CrossRef]
- Wang, L.; Zhang, Y.; Wang, R. Advanced monoethanolamine absorption using sulfolane as a phase splitter for CO2 capture. Environ. Sci. Technol. 2018, 52, 14556–14563. [Google Scholar] [CrossRef]
- Li, Y.; Liu, C.; Parnas, R. The CO2 absorption and desorption performance of the triethylenetetramine+N,N-diethylethanolamine + H2O system. Chin. J. Chem. Eng. 2018, 26, 2351–2360. [Google Scholar] [CrossRef]
- Zhang, S.; Shen, Y.; Shao, P. Kinetics, thermodynamics, and mechanism of a novel biphasic solvent for CO2 capture from flue gas. Environ. Sci. Technol. 2018, 52, 3660–3668. [Google Scholar] [CrossRef] [PubMed]
- Kierzkowska-Pawlak, H.; Soabla, K. Heat of absorption of CO2 in aqueous solutions of DEEA and DEEA + MAPA blends—A new approach to measurement methodology. Int. J. Greenh. Gas. Control 2020, 100, 103102. [Google Scholar] [CrossRef]
- Mannisto, M.; Uusi-Kyyny, P.; Richon, D. Study of CO2 absorption into phase change solvents MAPA and DEEA. J. Chem. Eng. Data 2017, 62, 2261–2271. [Google Scholar] [CrossRef]
- Liu, F.; Fang, M.; Yi, N. Biphasic behaviors and regeneration energy of a 2-(diethylamino)-ethanol and 2-((2-aminoethyl) amino) ethanol blend for CO2 capture. Sustain. Energy Fuels 2019, 3, 3594–3602. [Google Scholar] [CrossRef]
- Zhang, J.; Yu, Q.; Wang, W. Development of an energy-efficient CO2 capture process using thermomorphic biphasic solvents. Energy Procedia 2013, 37, 1254–1261. [Google Scholar] [CrossRef]
- Chen, Z.; Jing, G.; Lu, B. An efficient solid-liquid biphasic solvent for CO2 capture: Crystalline powder product and low heat duty. ACS Sustain. Chem. Eng. 2020, 8, 14493–14503. [Google Scholar] [CrossRef]
- Abu-Zahra, M.; Schneiders, L.; Niederer, J. CO2 capture from power plants. Part I. A parametric study of the technical performance based on monoethanolamine. Int. J. Greenh. Gas. Control 2007, 1, 37–46. [Google Scholar] [CrossRef]
- Alie, C.; Backham, L.; Croiset, E.; Douglad, P. Simulation of CO2 capture using MEA scrubbing: A flowsheet decomposition method. Energy Convers. Manag. 2005, 46, 475–487. [Google Scholar] [CrossRef]
- Jassim, M.; Rochelle, G. Innovative absorber/stripper configuration for CO2 capture by aqueous monoethanolamine. Ind. Eng. Chem. Res. 2006, 45, 2465–2472. [Google Scholar] [CrossRef]
- Sigh, D.; Croiset, E. Techno-economic study of CO2 capture from an existing coal-fired power plant: MEA scrubbing vs. O2/CO2 recycle combustion. Energy Convers. Manag. 2003, 44, 3073–3091. [Google Scholar] [CrossRef]
- Meldon, J.H. Amine screening for flue gas CO2 capture at coal-fired power plants: Should the heat of desorption be high, low or in between? Curr. Opin. Chem. Eng. 2011, 1, 55–63. [Google Scholar] [CrossRef]
- Sakwattanapong, R.; Aroonwilas, A.; Veawab, A. Behavior of reboiler heat duty for CO2 capture plants using regenerable single and blended alkanolamines. Ind. Eng. Chem. Res. 2005, 44, 4465–4473. [Google Scholar] [CrossRef]
- Leites, I.; Sama, D.; Lior, N. The theory and practice of energy saving in the chemical industry: Some methods for reducing thermodynamic irreversibility in chemical technology processes. Energy 2003, 28, 55–97. [Google Scholar] [CrossRef]
- Zhang, K.; Liu, Z.; Wang, Y.; Li, Y. Analysis and calculation of the desorption energy consumption of CO2 capture process by chemical absorption method. Chem. Ind. Eng. Prog. 2013, 32, 3008–3014. [Google Scholar]
- Wang, D.; Xie, J.; Zhou, H. Parameters analysis and energy integration in flue gas SO2 capture process based on MDEA. CIESC J. 2021, 72, 1521–1528. [Google Scholar] [CrossRef]
- Rochekke, G. Amine scrubbing for CO2 capture. Science 2009, 325, 1652–1654. [Google Scholar] [CrossRef]
- Zhou, H.; Meng, W.; Wang, D. A novel coal chemical looping gasification scheme for synthetic natural gas with low energy consumption for CO2 capture: Modelling, parameters optimization, and performance analysis. Energy 2021, 225, 120249. [Google Scholar] [CrossRef]
- Wang, D.; Li, J.; Meng, W.; Jian, W. Integrated Process for Producing Glycolic Acid from Carbon Dioxide Capture Coupling Green Hydrogen. Processes 2022, 10, 1610. [Google Scholar] [CrossRef]
- Zhao, H.; Wang, S.; Zhang, M. Research on low energy consumption CO capture technology and thermal economy of coal-fired units. Mod. Chem. Ind. 2021, 41, 210–214. [Google Scholar]
- Man, Y.; Yang, S.; Zhang, J.; Qian, Y. Conceptual design of coke-oven gas assisted coal to olefins process for high energy efficiency and low CO2 emission. Appl. Energy 2014, 133, 97–205. [Google Scholar] [CrossRef]
- Zhao, R.; Zhao, L.; Deng, S. Techno-economic Comparison of Solar-Assisted Power Plant for Emission Reduction. J. Eng. Thermophys. 2015, 36, 2547–2550. [Google Scholar]
- Adefarati, T.; Bansal, R. Reliability, economic and environmental analysis of a microgrid system in the presence of renewable energy resources. Appl. Energy 2019, 236, 1089–1114. [Google Scholar] [CrossRef]
- An, X.; Zuo, Y.; Zhang, Q. Methanol synthesis from CO2 hydrogenation with a Cu/Zn/Al/Zr fibrous catalyst. Chin. J. Chem. Eng. 2009, 17, 88–94. [Google Scholar] [CrossRef]
- Lim, H.; Park, M.; Kang, S.; Chae, H.; Bae, J.; Jun, K. Modeling of the kinetics for methanol synthesis using Cu/ZnO/Al2O3/ZrO2 catalyst: Influence of carbon dioxide during hydrogenation. Ind. Eng. Chem. Res. 2009, 48, 10448–10455. [Google Scholar] [CrossRef]
Disclaimer/Publisher’s Note: The statements, opinions and data contained in all publications are solely those of the individual author(s) and contributor(s) and not of MDPI and/or the editor(s). MDPI and/or the editor(s) disclaim responsibility for any injury to people or property resulting from any ideas, methods, instructions or products referred to in the content. |
© 2024 by the authors. Licensee MDPI, Basel, Switzerland. This article is an open access article distributed under the terms and conditions of the Creative Commons Attribution (CC BY) license (https://creativecommons.org/licenses/by/4.0/).