Article

Simulation Experiment Design and Control Strategy Analysis in Teaching of Hydrogen-Electric Coupling System

1
College of Automation, Nanjing University of Posts and Telecommunications, Nanjing 210023, China
2
Institute of Advanced Technology for Carbon Neutrality, Nanjing University of Posts and Telecommunications, Nanjing 210023, China
*
Author to whom correspondence should be addressed.
Processes 2024, 12(1), 138; https://doi.org/10.3390/pr12010138
Submission received: 3 December 2023 / Revised: 28 December 2023 / Accepted: 3 January 2024 / Published: 5 January 2024
(This article belongs to the Special Issue Advances in Renewable Energy Systems)

Abstract

:
Hydrogen energy, as a clean and green energy medium, is characterized by large capacity, extended lifespan, convenient storage, and seamless transmission. On the one hand, in the power system, hydrogen can be prepared by the electrolysis of water using the surplus power from intermittent new energy generation, such as photovoltaic and wind power, to increase the space for new energy consumption. On the other hand, it can be used to generate electricity from the chemical reaction between hydrogen and oxygen through the fuel cell and be used as a backup power source when there is a shortage of power supply. In this paper, based on the teaching practice, the conversion mechanism and coupling relationship between various forms of energy, such as photovoltaic energy, hydrogen energy, and electric energy, were deeply analyzed. Further, a hydrogen-electricity coupling digital simulation experimental system, including photovoltaic power generation, fuel cell, and electrolysis hydrogen system, was formed. Simultaneously, considering the synergy between hydrogen production and electricity generation businesses, as well as the demand for the efficient utilization and flexible regulation of multiple energy sources, eight sets of simulation experimental scenarios were designed. A cooperative control strategy for the hydrogen-electric coupling system was proposed and validated through simulation on the MATLAB/SIMULINK-R2023a platform. This study shows that the simulation system has rich experimental scenarios and control strategies, and can comprehensively and accurately demonstrate the multi-energy complementary and cooperative control characteristics of the hydrogen-electric coupling system.

1. Introduction

Hydrogen energy, characterized by its cleanliness, high efficiency, large capacity, long lifespan, and ease of storage and transportation, has been extensively applied in diverse fields such as industrial production, energy storage, and transportation. Particularly noteworthy is the capabilities of hydrogen as a chemical energy storage medium, playing a significant role in energy systems. Its elevated specific energy density provides three times greater energy per unit mass compared to gasoline combustion, which offers significant advantages for efficient energy storage and utilization [1]. Meanwhile, as the proportion of wind power and photovoltaic (PV) power in the power system continues to increase, their intermittency, randomness, and volatility have brought challenges and impacts on the security and stability of the power system [2]. By the end of 2022, China’s installed wind power capacity reached 760 million kilowatts, accounting for 30% of the total installed capacity for power generation; the PV installed capacity reached 390 million kilowatts, with a year-over-year increase of 28.1%. The increased integration of high proportions of intermittent renewable energy generation has made China’s power structure greener and lower in carbon content but has also increased the demand for flexible regulation in the power system. In this context, hydrogen energy, with its flexible characteristics in production, storage, and utilization, has been regarded as a potential flexible regulation resource in the new power system. Comparatively, the traditional gas-thermal power coupling system primarily relies on the conversion and utilization of natural gas, considering the supply demands of both thermal and electrical energy. Natural gas is coupled with the power system in the form of combined heat and power generation, which, to some extent, meets the requirements for the complementary utilization of various forms of energy. However, natural gas is a non-renewable primary energy source, and its combustion process results in carbon dioxide emissions. For hydrogen, the hydrogen-based gas-electric coupling system offers several advantages. Hydrogen can be continuously produced using surplus wind and solar power, and, acting as a crucial industrial product, can be utilized. Additionally, leveraging its characteristics of power generation, heat production, and ease of storage, hydrogen can actively participate in the operation, flexibility, and adjustment of both power and thermal systems. Currently, research on hydrogen energy technologies mainly focuses on fuel cells and electrolysis devices. The literature [3] shows that changing the way hydrogen is produced through renewable electricity can enhance hydrogen–electricity conversion and expand the application range of hydrogen. The literature [4] develops the dynamic modeling and control of proton exchange membrane fuel cells (PEMFCs) and controls the interface components to deliver power to the grid, evaluating the performance of stand-alone power systems. The literature [5] discusses the coupling issue of PEMFCs in scenarios connected to the grid and its impact on efficiency. It analyzes the optimal efficiency conditions and dynamic operational controls using integrated models and iterative algorithms. The literature [6] proposes a power regulation system to ensure high-quality grid injection, applicable to Modified-Y-Source fuel cell inverters. It utilizes LCL filters and PR controllers to optimize the grid injection current quality through parameter adjustment, and simulation experiments demonstrate the effectiveness of the proposed method. Water electrolysis for hydrogen production has advantages such as high current density, high purity, and small footprint [7]. The literature [8] conducted a detailed comparative study on different hydrogen production sources and systems, and its comparisons indicated that photonic options have the highest environmental performance ranking. The literature [9] analyzes two different large-scale electrolytic water technologies for hydrogen production while considering the simulation and determining operational strategies in the market. It compares the levelized hydrogen cost of water electrolysis with SMR factories, evaluating the technical and economic feasibility of water electrolysis in specific regions. The literature [10] presents a hybrid system for hydrogen production, and the modeling simulation is performed in MATLAB to minimize system losses and maximize hydrogen production. The literature [11] introduces a study on a proton exchange membrane electrolysis cell system directly coupled to a 10 kW PV array for hydrogen production. The above literature describes the prospects and technical routes of hydrogen production using renewable energy generation and emphasizes that hydrogen energy will be a key component of the clean energy transition. Further, it also conducts research on the application scenarios, operational characteristics, and operational efficiency improvement methods of hydrogen energy conversion and utilization subsystems, targeting proton exchange membrane fuel cells and electrolytic hydrogen production systems. However, the current research mainly focuses on the energy conversion and utilization technology of hydrogen energy itself, represented by fuel cells and electrolytic hydrogen production systems. There is relatively little research on the coupling modes and synergistic operation mechanisms of hydrogen energy and other energy forms, such as light energy, wind energy, and electric energy.
Therefore, this paper concentrates on the multi-energy complementary and coordinated control characteristics of hydrogen-electric coupling systems, deeply analyzing the conversion mechanisms and coupling relationships among various forms of energy, such as solar energy, hydrogen energy, and electrical energy. A hydrogen-electric coupled digital simulation experimental system was established, which included photovoltaic power generation, fuel cells, and electrolysis hydrogen production systems. Simultaneously, taking into account the synergy between hydrogen production and electricity generation businesses, with goals such as efficient utilization of multiple energy sources, mitigation of power fluctuations, and grid dispatch control, eight sets of simulation experimental scenarios were designed. Corresponding coordinated control strategies for the hydrogen-electric coupling system were proposed, and simulations were conducted using the MATLAB/SIMULINK platform for validation.

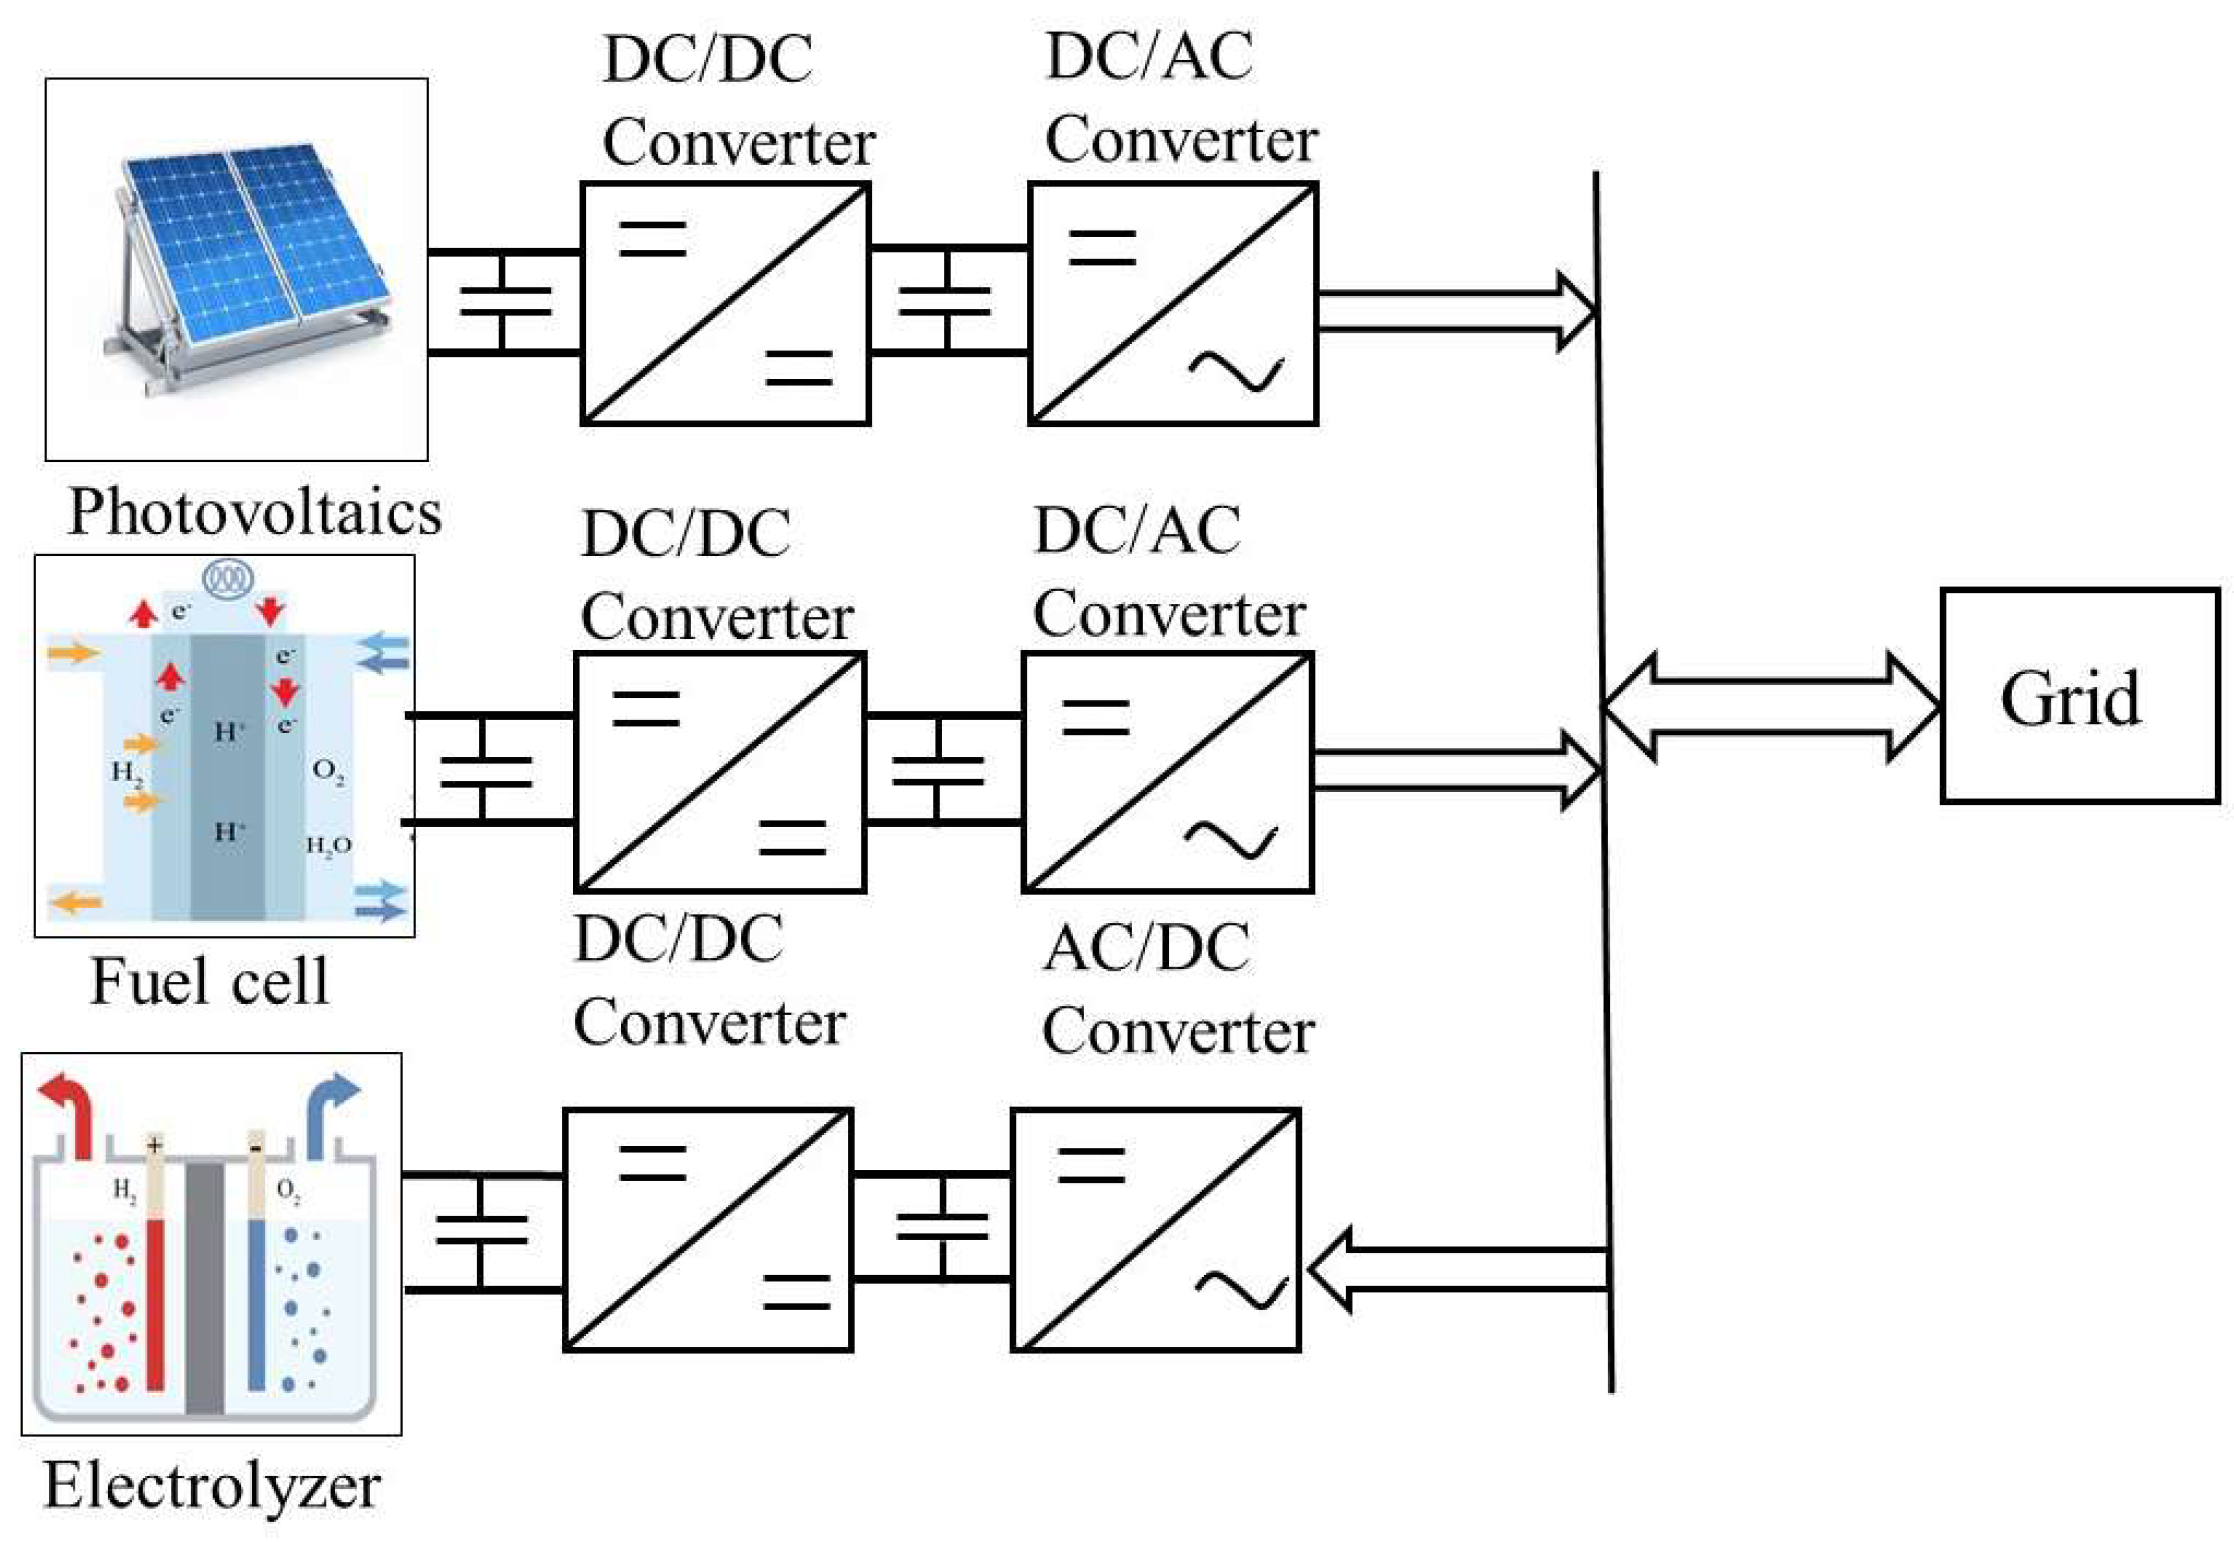
2. Typical Structure of Hydrogen-Electric Coupling System

This section presents the design of a typical structure for a hydrogen-electric coupling system that supports the flexible operation of photovoltaic power generation, as shown in Figure 1. In this system, fuel cells and electrolytic hydrogen production devices are used as carriers for hydrogen energy conversion and utilization and are connected in parallel with photovoltaic power generation to the public power grid. When there is an excess of electric energy generated by photovoltaic power generation, it can be converted into hydrogen energy and stored in a hydrogen storage tank through electrolysis. Conversely, when the electricity generated by photovoltaic power generation is insufficient, the hydrogen energy stored in the hydrogen storage tank can be converted back into electricity using a fuel cell. At the same time, because the fuel cell and electrolytic hydrogen production are power electronic interface devices, they have fast dynamic adjustment characteristics. Therefore, they can also be used to suppress the instantaneous fluctuation of photovoltaic power generation output caused by the change of light resources and to execute the instantaneous dispatching control instructions of the superior power grid.

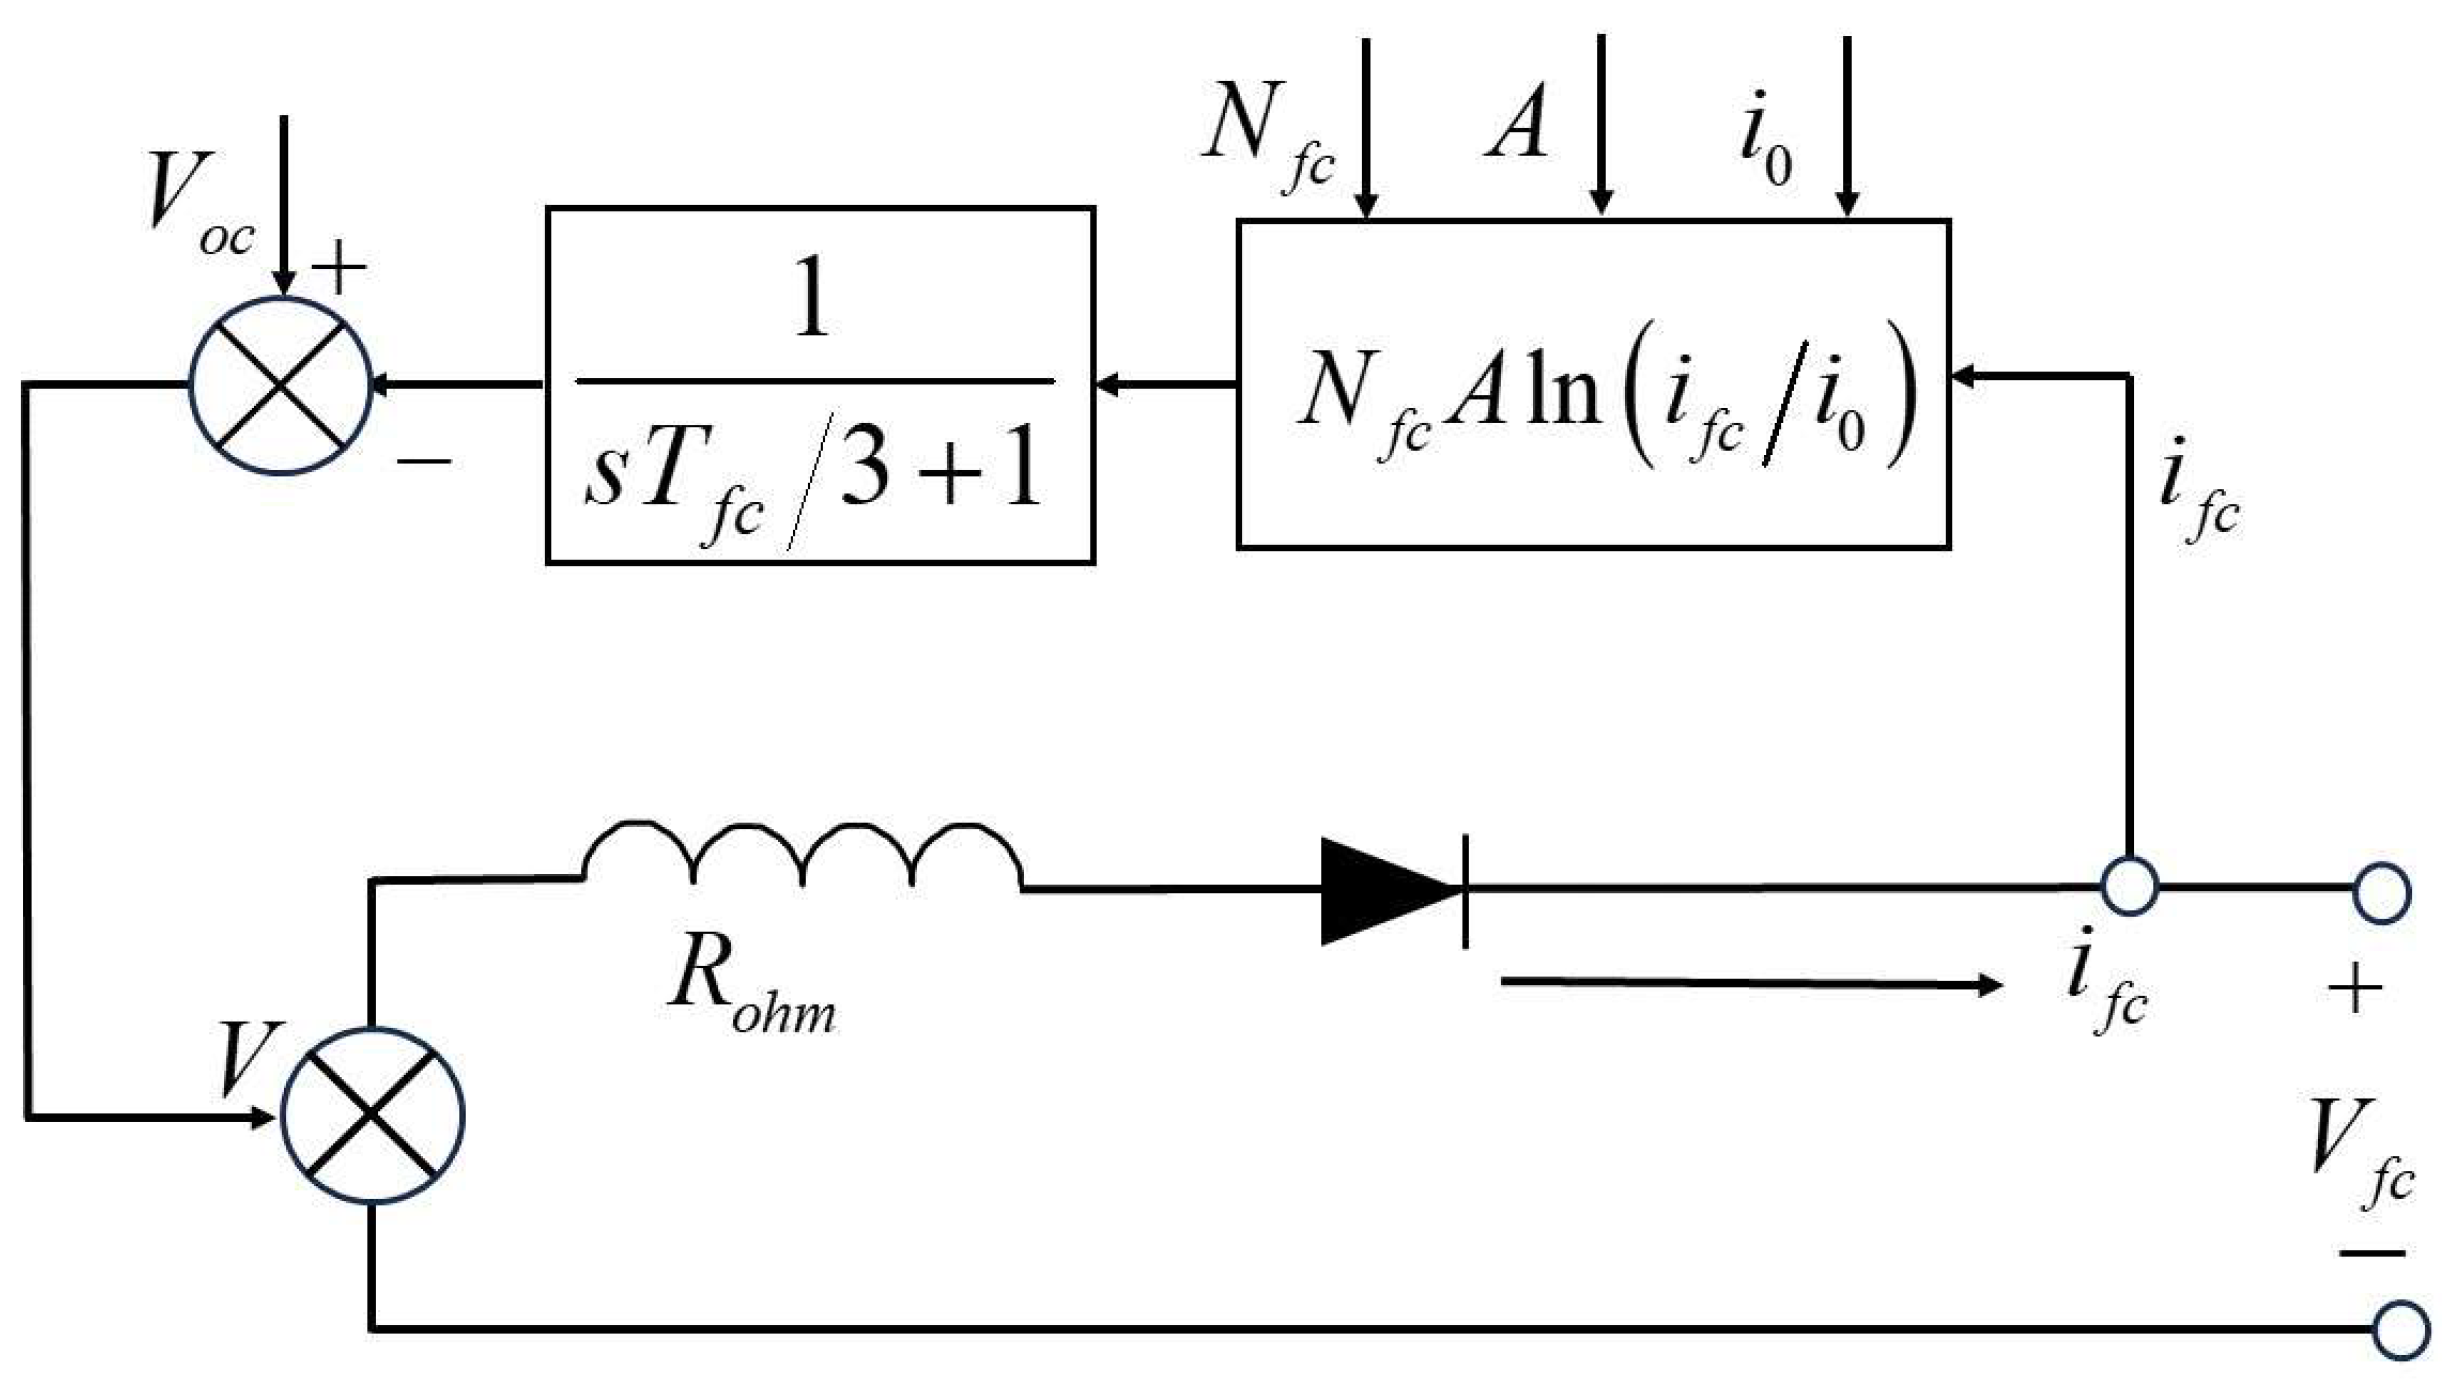
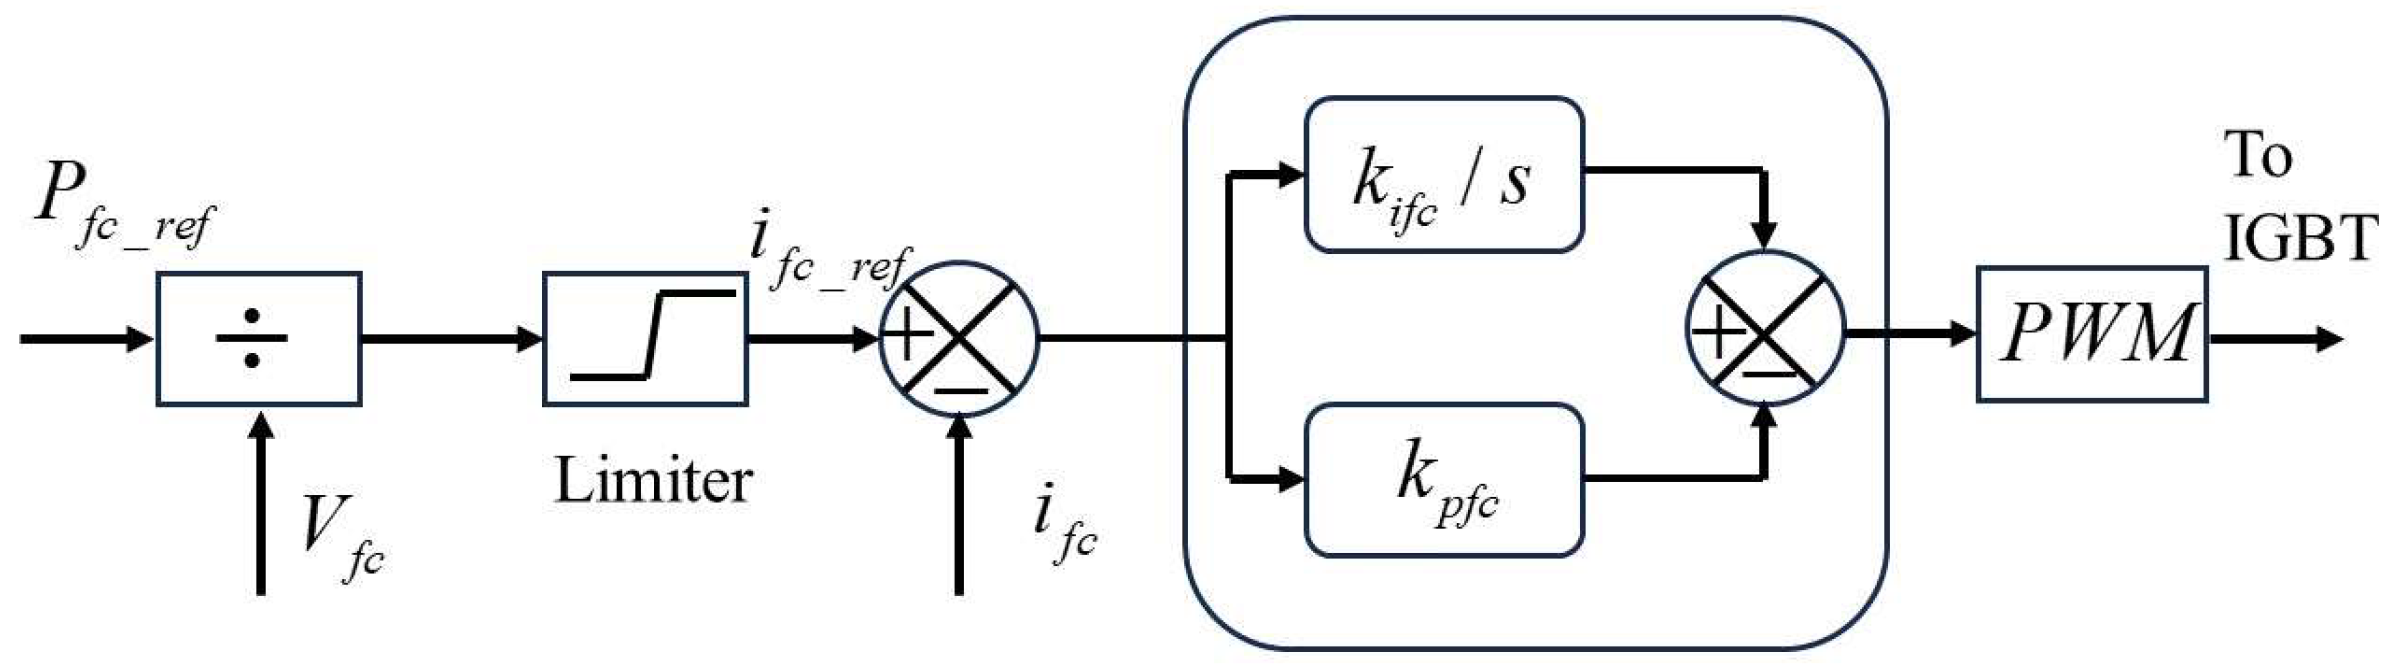
3. Simulation Model of Fuel Cell Power Generation

A fuel cell is a device that converts chemical energy into electricity by electrochemical reactions of hydrogen and oxygen [12]. Taking proton exchange membrane fuel cells (PEMFC) as an example, it supplies hydrogen to the anode and air to the cathode, achieving the separation of hydrogen ions and electrons through the proton exchange membrane. The chemical energy is converted into electrical energy by transferring hydrogen ions from the anode to the cathode via the proton exchange membrane. Simultaneously, electrons travel through an external circuit to the cathode, where they engage in a reaction with oxygen to produce water molecules. The electrochemical reaction formula is as follows:
H 2 2 H + + 2 e
1 2 O 2 + 2 e + 2 H + H 2 O
2 H 2 + O 2 2 H 2 O
In this paper, a 50 kW PEMFC was taken as an object to establish its dynamic simulation model, as shown in Figure 2. The figure includes two feedback circuits for current feedback and voltage feedback [13,14]. In the figure, response time T f c is used to model the “charge double layer” phenomenon resulting from charge accumulation at the electrode/electrolyte interface [15].
The output voltage of the PEMFC stack is [16]:
V f c = V o c V o h m V a c t
where: V f c represents the output voltage of the fuel cell; V o c is the open circuit voltage of the fuel cell; V o h m is the ohmic overvoltage loss; and V a c t represents the absolute polarization voltage loss.
The V o c is [13,16]:
V o c = K c · E 0 + ( T f 298 ) 44.43 z F + R T f c z F ln ( P H 2 P O 2 1 / 2 P H 2 O )
where: K c represents the voltage constant under nominal working conditions; E 0 is the electromotive force under standard pressure; T f represents the operating temperature of fuel cell; z is the number of moving electrons; F is Faraday constant; R is gas constant; P H 2 is the partial pressure of hydrogen in the reactor; P O 2 represents the partial pressure of oxygen in the reactor; and P H 2 O is the partial pressure of water vapor in the reactor.
Considering the ohmic loss caused by electrode and electrolyte resistance, the ohmic overvoltage loss is:
V o h m = R o h m · i f c
where: R o h m represents the equivalent internal resistance and i f c is the fuel cell current.
Considering the loss caused by slow chemical reaction on the electrode surface, the absolute polarization voltage loss is [15]:
V a c t = N f c A ln ( i f c i 0 ) 1 s T f c / 3 + 1
where: N f c represents the number of fuel cells; A is the Tafel slope; i 0 represents the exchange current; and T f c is the response time.
In Equation (7), i 0 and A are [16]:
i 0 = z F k ( P H 2 + P O 2 ) R h exp ( Δ G R T )
A = R T z α F
where: Δ G is the activation barrier; k represents the Boltzmann constant; α is the charge transfer coefficient; and h is the Planck constant.
Based on the above model, the fuel cell V-I and P-I characteristics are illustrated in Figure 3:
The specific parameters of PEMFC are shown in Table 1:

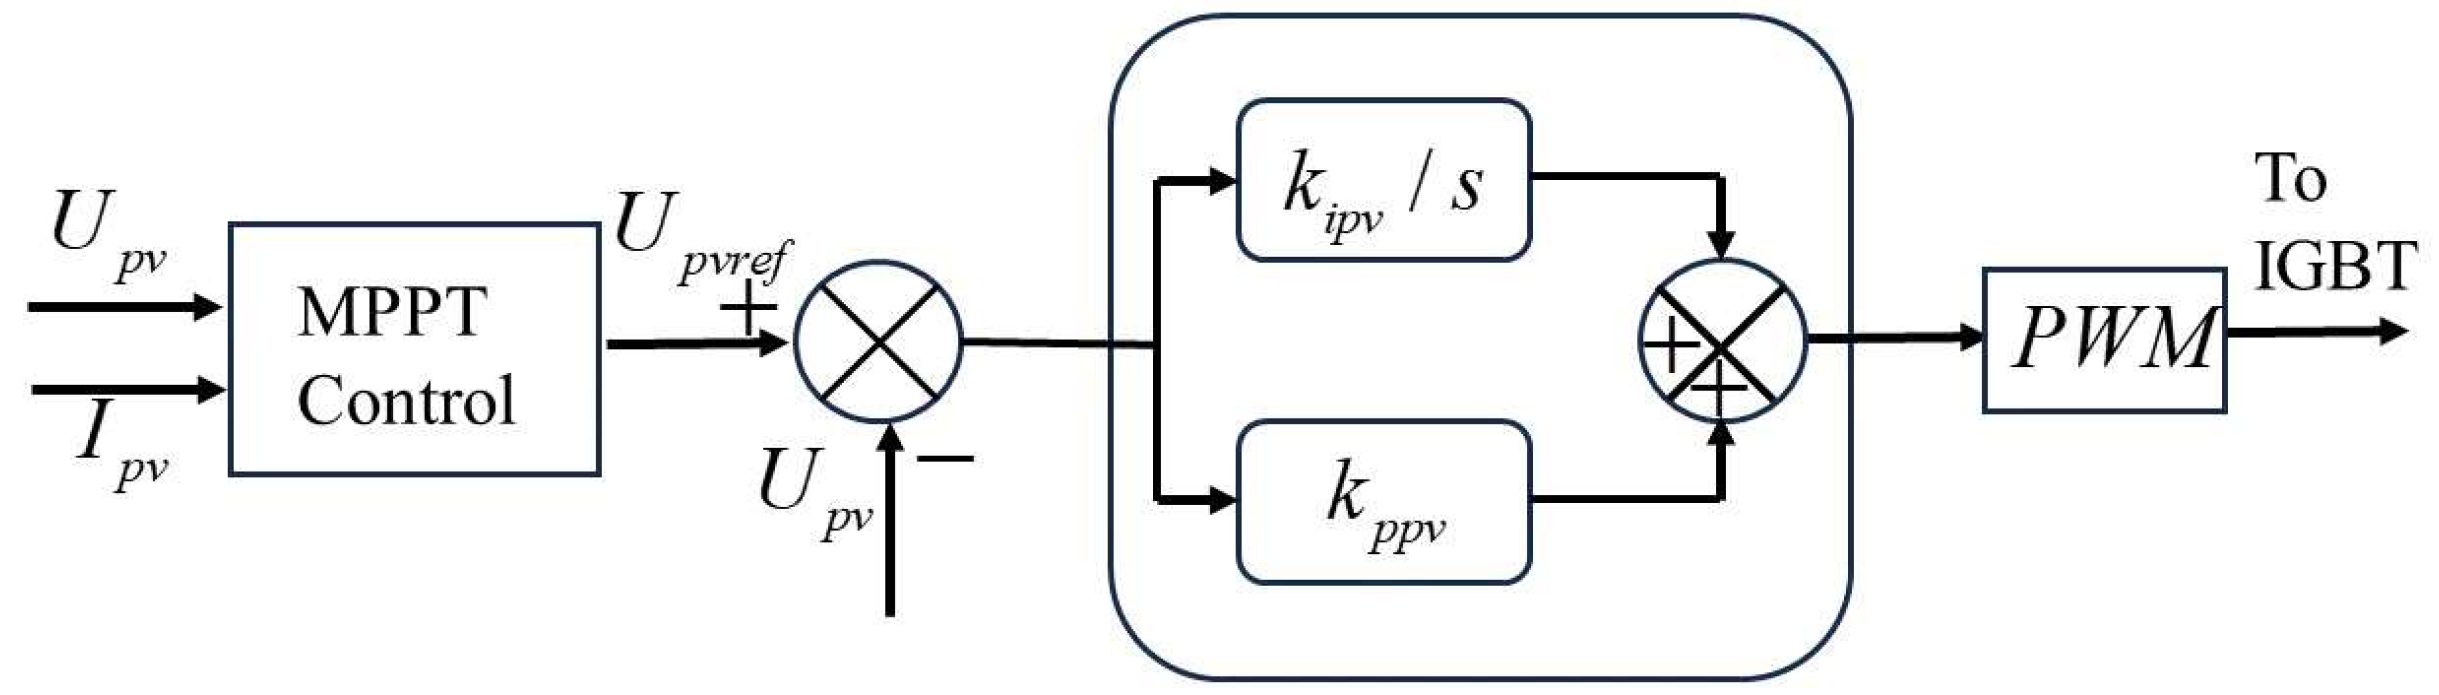
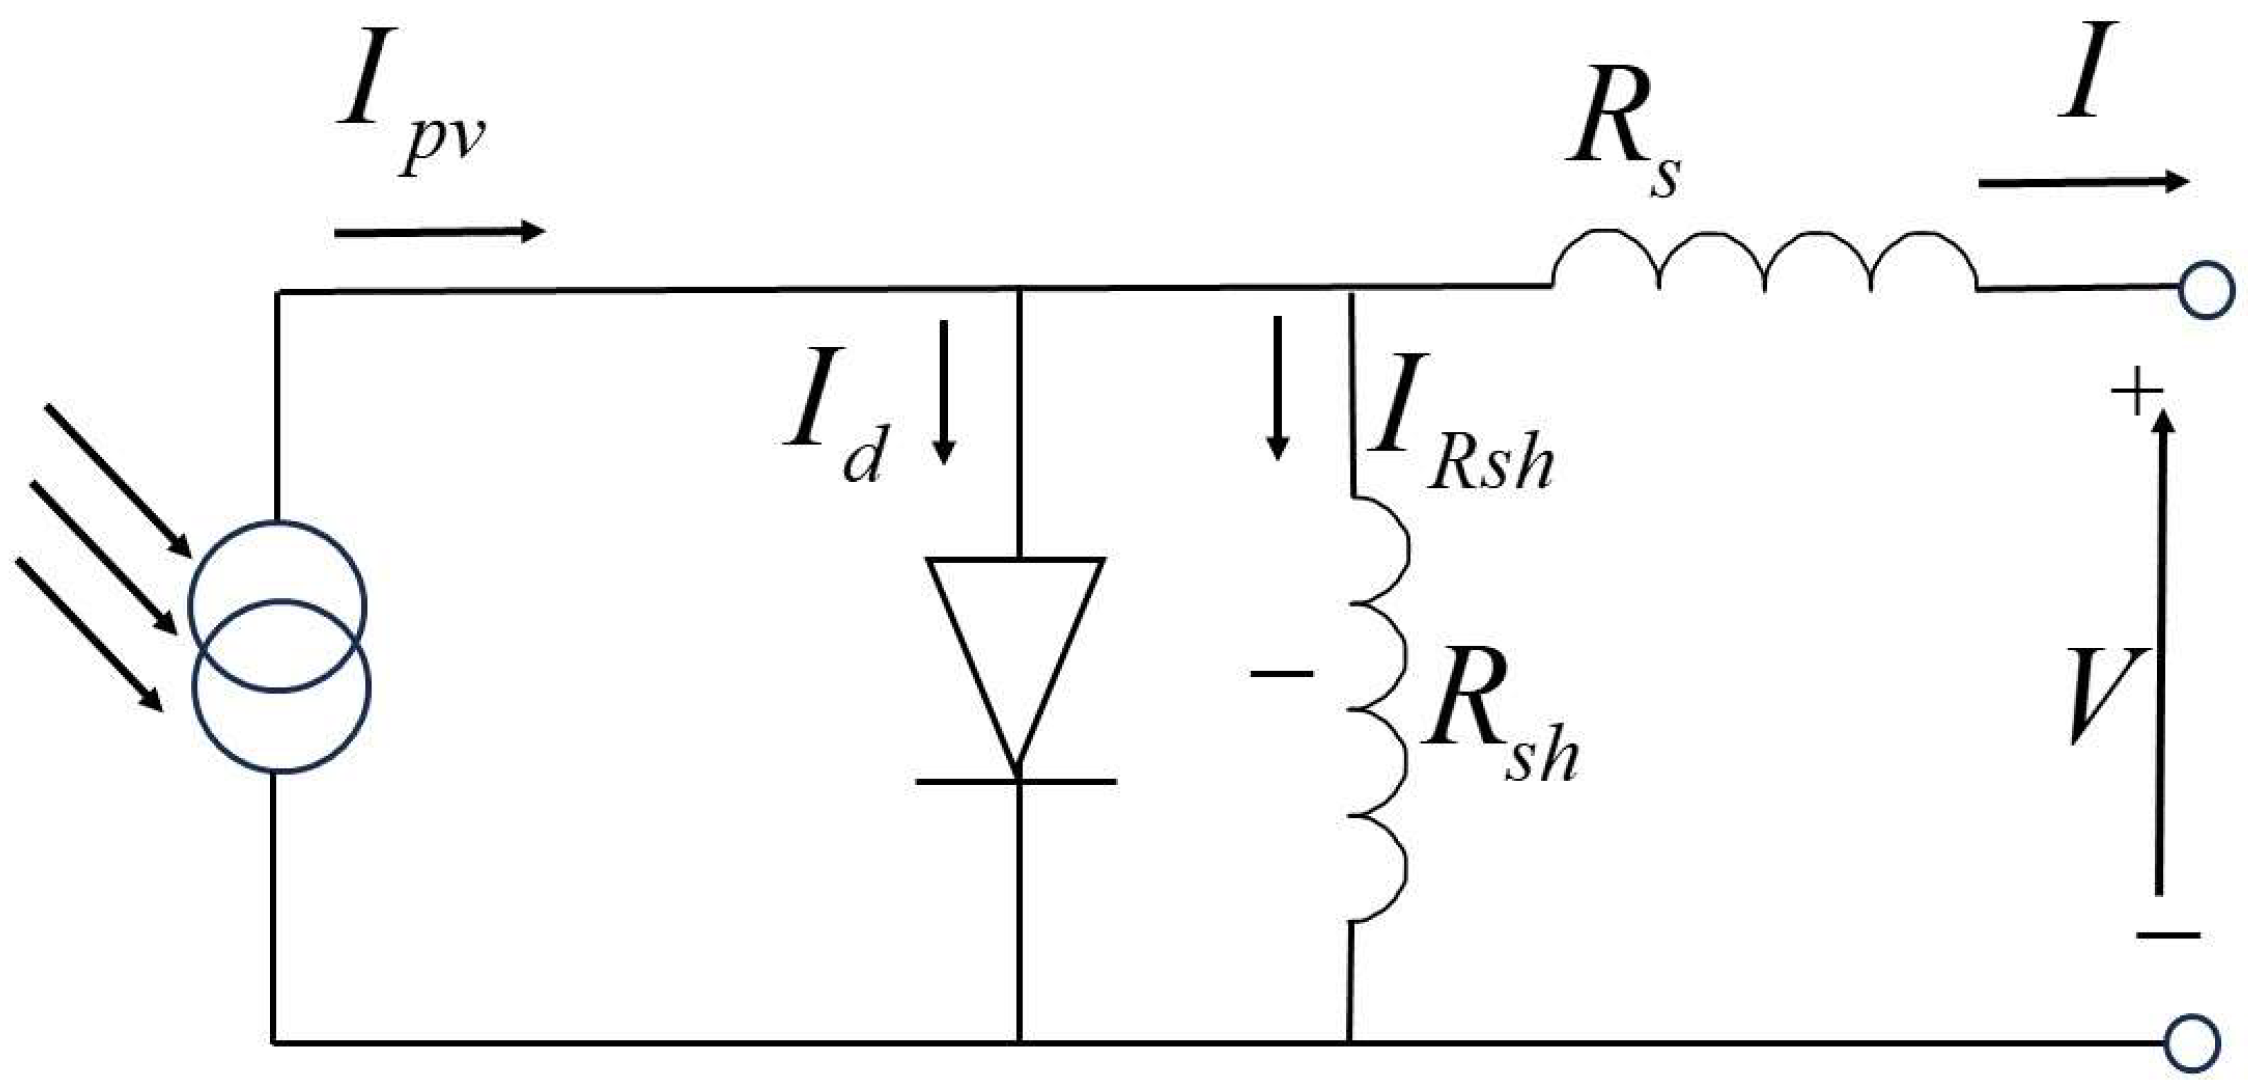
4. Simulation Model of Photovoltaic Power Generation

Photovoltaic power generation is a technology that employs the photovoltaic effect to convert solar energy into electrical energy [17]. The current and power output characteristics of photovoltaic systems are influenced by the intensity of illumination and the battery temperature. Photovoltaic cells function similarly to PN junction diodes. Photovoltaic arrays consist of numerous photovoltaic components connected in series and parallel, and their equivalent circuit is depicted in Figure 4.
Based on the equivalent circuit of the photovoltaic array, the relationship between its output voltage V and current I can be expressed as [18,19]:
I = I p v I d I R s h
I d = I 0 exp ( q ( V + I R S ) α 0 ) 1
where: I p v represents the current generated by the photovoltaic cell due to solar irradiation; I 0 is the saturation current; I represents the load current; V is the output voltage of the photovoltaic cell; R S represents the series impedance of the photovoltaic cell; and α 0 is the time factor.
Since I R s h is small and can be approximated as 0 [10], Equation (10) can be simplified as follows:
I = I p v I 0 exp ( q ( V + I R S ) α ) 1
The specific parameters of the PV are shown in Table 2:

5. Simulation Model of Electrolytic Hydrogen Production

The electrolyzer is a device that utilizes electricity to separate water into hydrogen and oxygen [20,21]. The electrolysis process utilizes an electric current to decompose water molecules into hydrogen and oxygen atoms [22,23]. The electrolyzer is used in the process of electrolyzing water to produce hydrogen. The hydrogen evolution reaction occurs on the cathode side, while the oxygen evolution reaction occurs on the anode side. The cathode and anode undergo the following chemical reactions [24]:
H 2 O 2 H + + 1 2 O 2 + 2 e
2 H + + 2 e H 2
From a circuit perspective, an electrolyzer is equivalent to a voltage-sensitive nonlinear DC load. Due to the highly nonlinear characteristics of current and voltage, curve fitting is generally used to simulate them, which is applicable to the electrical field. At this point, the voltage-current equation of a single electrolyzer can be calculated [25,26]:
U e l = U r + r 1 + r 2 T e l A e l I e l + s log ( k T 1 + k T 2 T e l + k T 3 T e l 2 A e l I e l + 1 )
where: U e l represents the working voltage of a single electrolyzer; U r is the reversible voltage; A e l is the electrode area; T e l represents the temperature; I e l is the current; r 1 and r 2 represent the ohmic resistance parameters; and s , k T 1 , k T 2 , and k T 3 are the coefficient of overvoltage.
The current and voltage characteristics of an electrolyzer are influenced by the operational temperature. In accordance with Faraday’s law, the rate of hydrogen production in an electrolytic cell is directly related to the rate of electron transfer at the electrode [27]:
N H 2 = η e N e I e l z F
I e = P e N e U e
where N H 2 represents the rate of hydrogen production, η e is the electrolyzer efficiency; N e represents the Number of electrolytic cells; and P e is the power consumption.
The process of electrolyzing water in an electrolyzer generates hydrogen and oxygen, which are then compressed and stored in a high-pressure hydrogen storage tank. The mathematical model explores the relationship between the pressure of the hydrogen storage tank and its capacity for storing hydrogen [28]:
M H 2 = t 1 t 2 N H 2 N o u t d t
P h = R T e l V M H 2
where M H 2 represents the storage capacity of hydrogen; P h is the pressure in the hydrogen storage tank; N o u t represents the molar hydrogen consumption rate; V is the volume of the hydrogen storage tank; and t 1 and t 2 represent the starting and ending points of hydrogen production.
The modeling data of the electrolysis hydrogen production module are shown in Table 3.

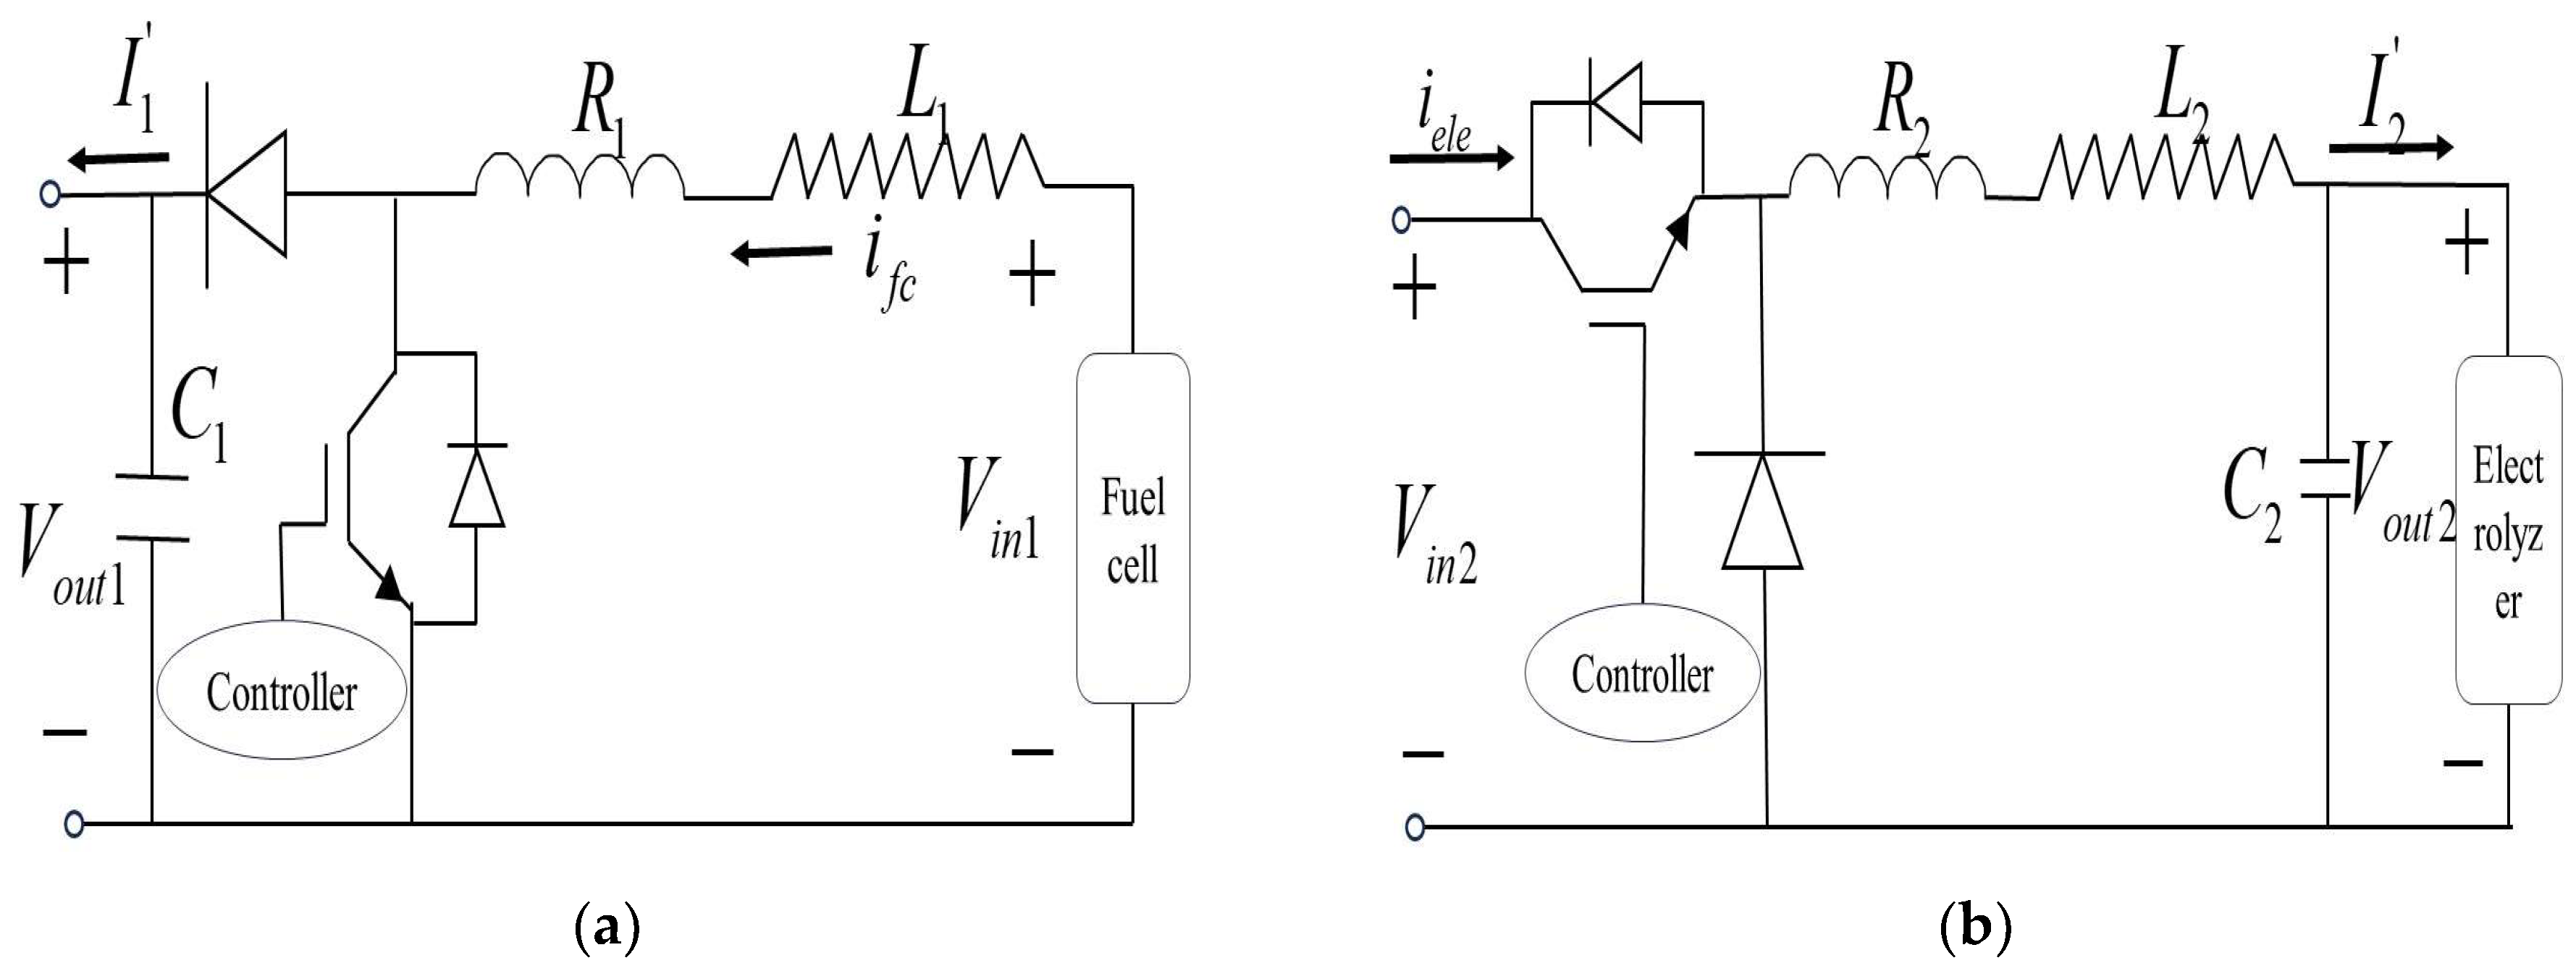
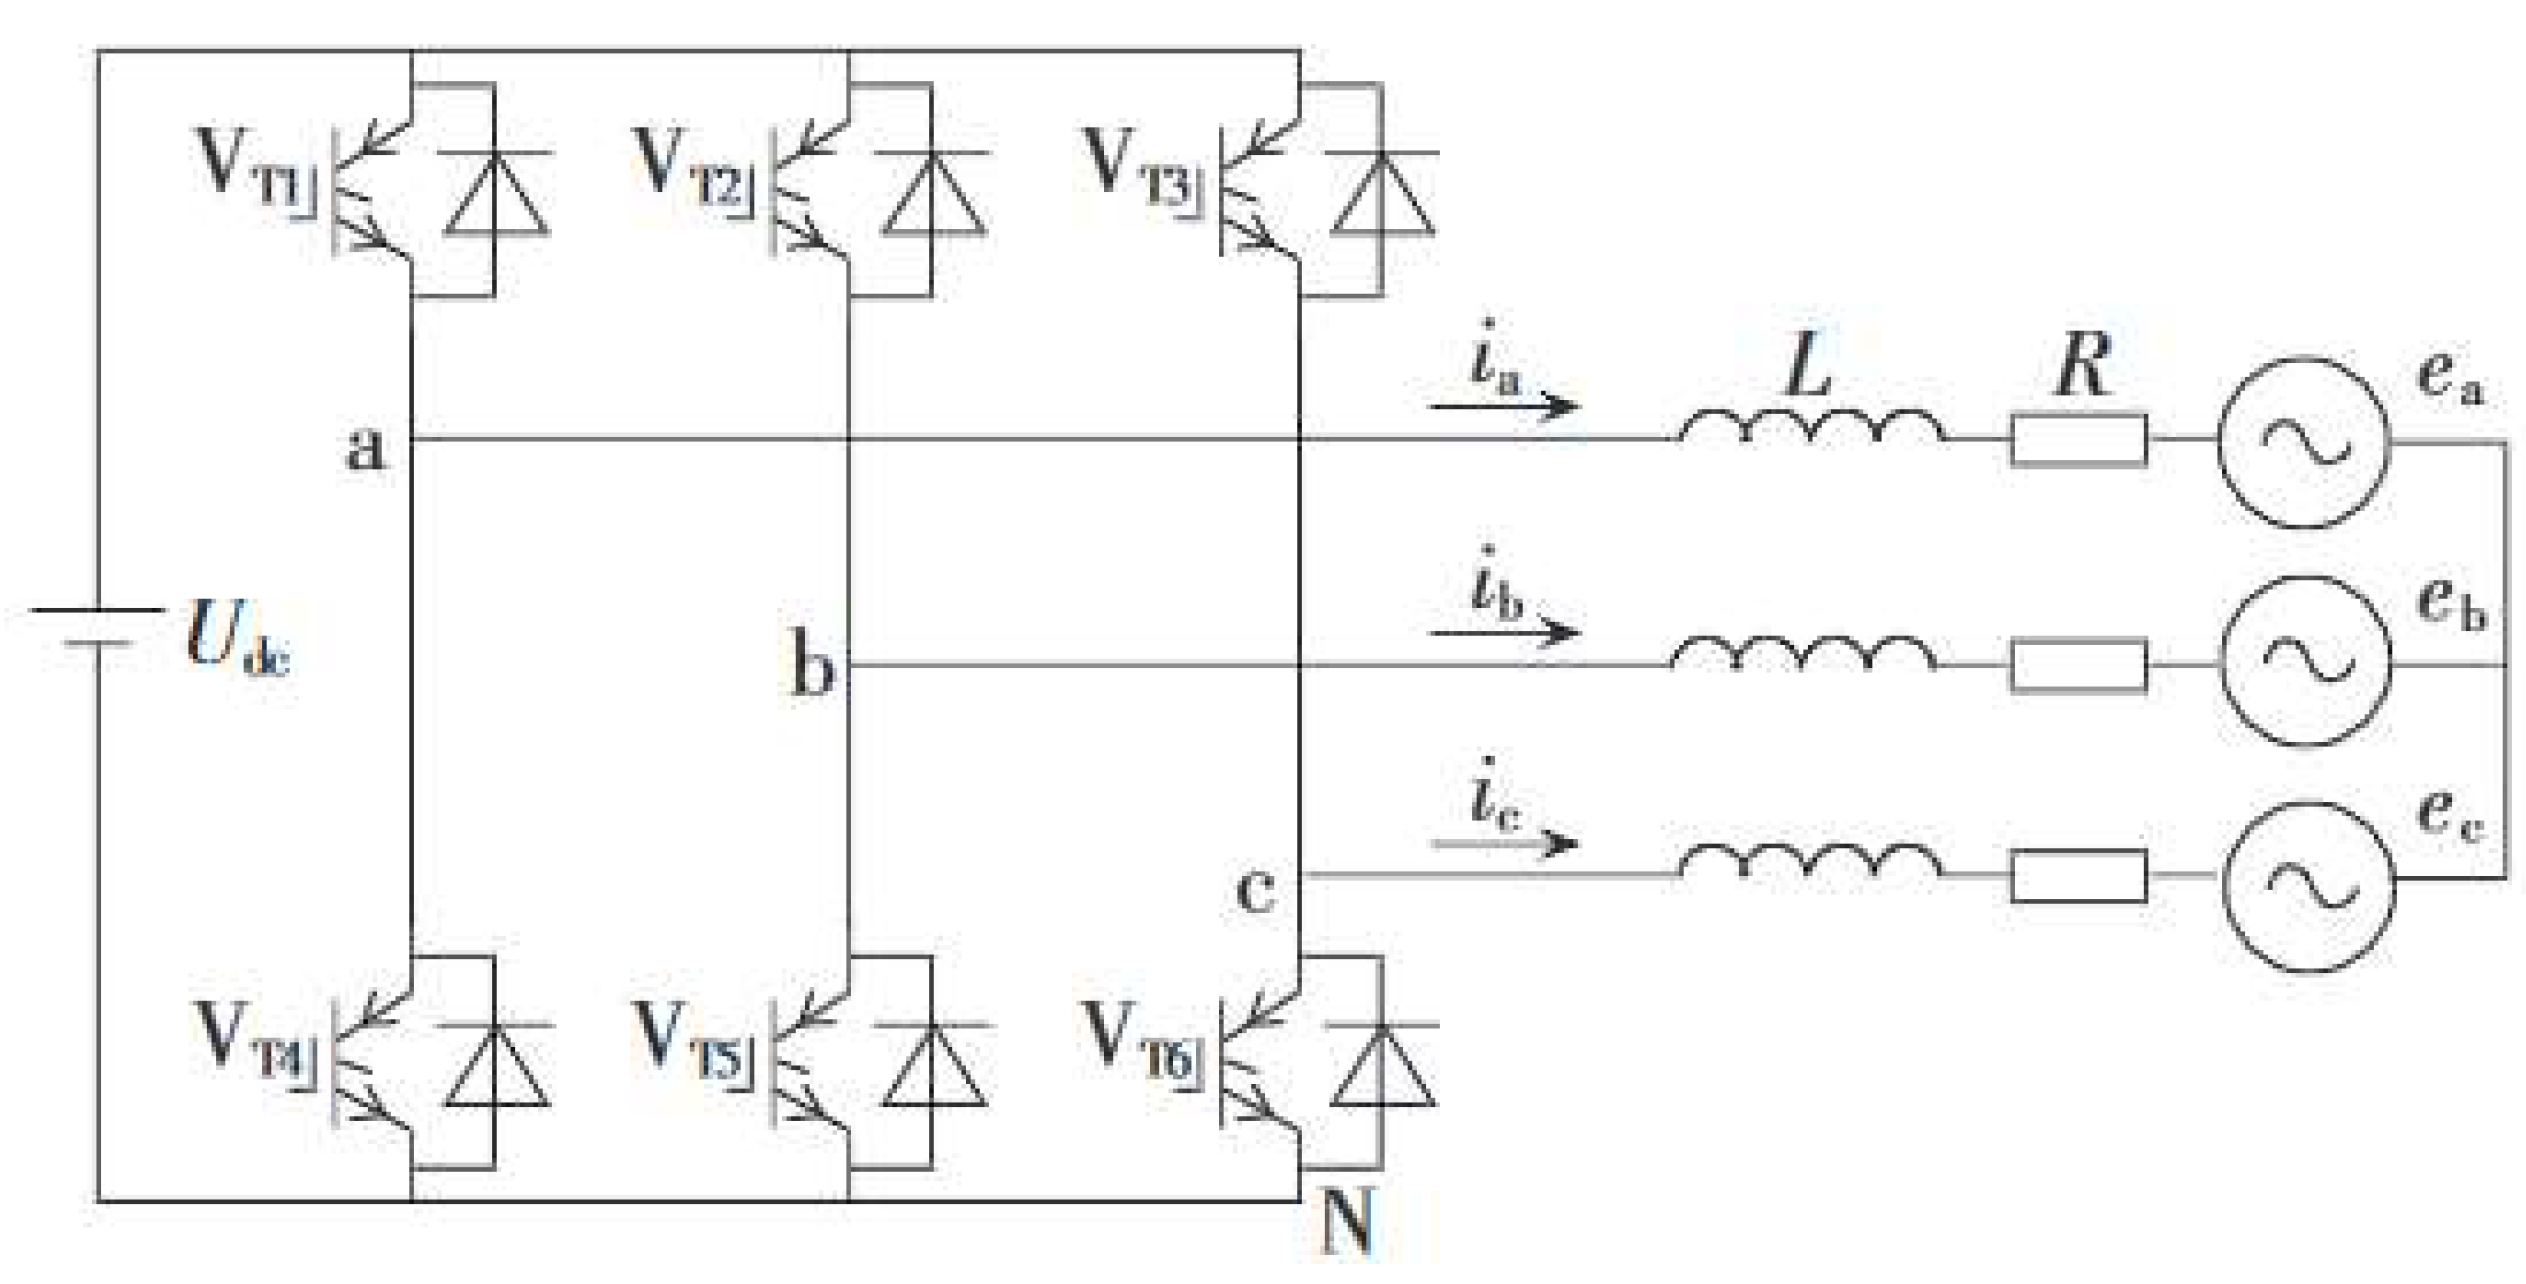
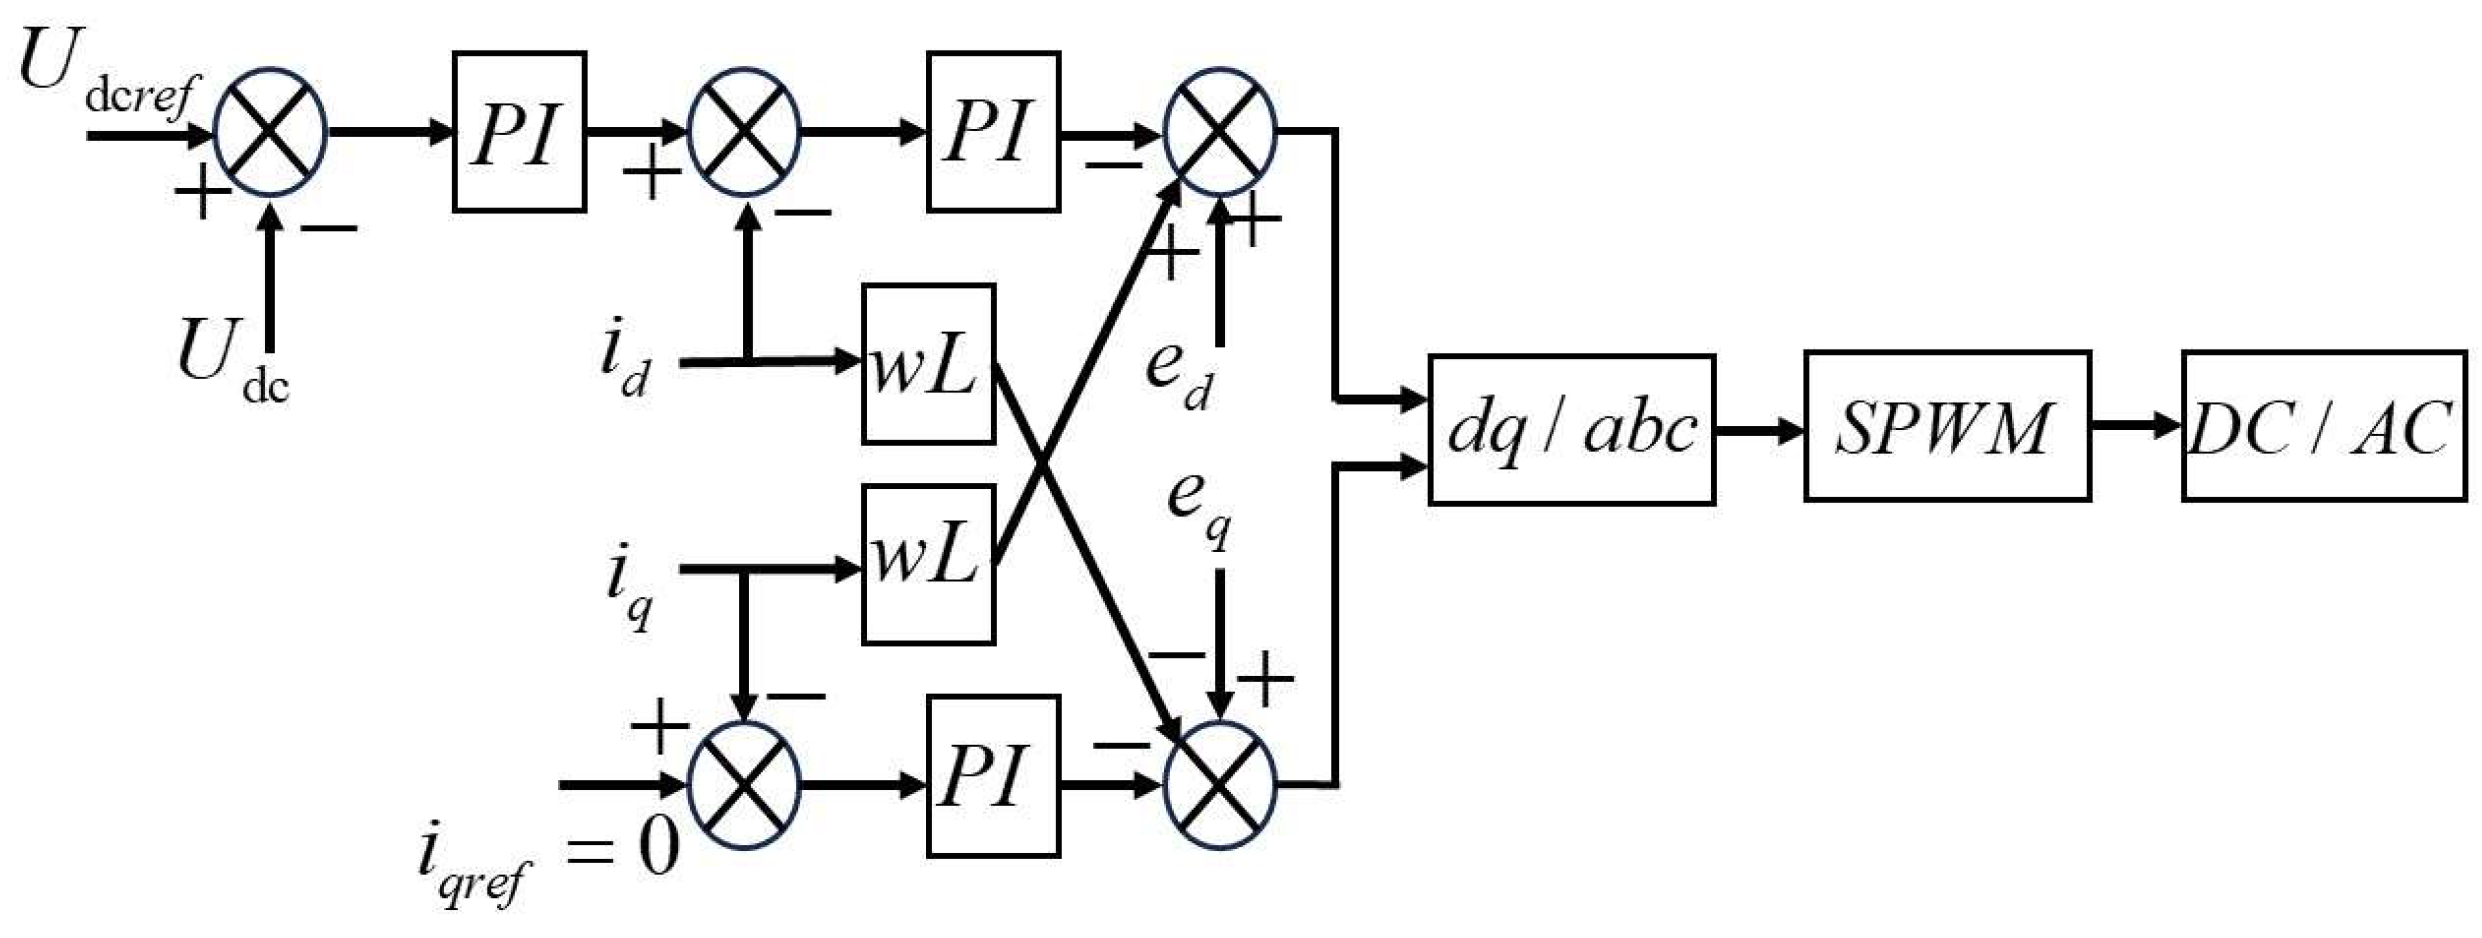
6. Modeling of the Power Electronic Converter

Photovoltaic array, fuel cell, and electrolytic cell grid connection need to use the power electronic converter to realize the transformation of power AC/DC form, to exchange energy and power with the power grid [29]. Because the output voltage of the fuel cell has soft characteristics, its output voltage is affected by the load current, and the photovoltaic power generation has volatility. Therefore, the DC side is required to stabilize the voltage output of the DC side. The Boost circuit topology is shown in Figure 5a. According to the literature [30,31], in terms of complexity, reliability, and cost, the traditional non-isolated DC/DC converter is superior. However, the DC link voltage is typically too high for the electrolytic cell to operate normally. To address this, a Buck circuit is utilized to reduce the voltage to the required operating level. The topology of the Buck circuit is depicted in Figure 5b [30,31].
The mathematical model of the Boost circuit can be described using the following differential equation [32]:
d i f c d t d V o u t 1 d t = R 1 L 1 ( 1 D 1 ) L 1 ( 1 D 1 ) C 1 I 1 V o u t 1 C 1 i f c V o u t 1 + 1 L 1 0 V i n 1 , y = 0 1 i f c V o u t 1
where: i f c represents the inductance current; V o u t 1 is the output voltage; V i n 1 is the input voltage; and D 1 represents the control signal.
The mathematical model of the Buck circuit can be described as [32] using the following differential equations:
d i e l e d t d V i n 2 d t = R 2 L 2 d L 2 d C 2 I 2 V i n 2 C 2 i e l e V i n 2 1 L 2 0 V o u t 2 , y = 0 1 i e l e V i n 2 ,
where: i e l e is the inductive current; V i n 2 represents the input voltage; V o u t 2 is the output voltage; and d represents the control signal.
The inverter and rectifier can be classified according to the voltage source and current source. Due to the similar structure of the inverter and the rectifier in this paper, only the inverter is described, and the inverter topology diagram is shown in Figure 6. The voltage source and inverter in the DC side parallel capacitor are utilized to ensure the DC bus voltage stability. The current source converter is in a series of large inductors on the DC side. Since large inductance reduces the dynamic response of the system, the voltage source inverter is used in this paper.
The grid-type inverter can accurately track the voltage and frequency of the grid to avoid interference with the grid and to ensure that it operates within the normal range. The mathematical model of the inverter in the three-phase coordinate system is shown as follows [33,34]:
U a N = R i a + L d i a d t + e a U b N = R i b + L d i b d t + e b U c N = R i c + L d i c d t + e c
where: U a N , U b N , and U c N represent the three-phase output voltage; i a , i b , and i c are the AC side current of the three-phase inverter; R represents the three-phase equivalent resistance; L represents three-phase filter inductance; and e a , e b , and e c are the three-phase power grid voltage.
The three-phase inverter is inconvenient in designing the inverter control technology. Therefore, it is transformed into the two-phase coordinate system which synchronously rotates at the frequency of the power grid base wave, to facilitate the design of the inverter controller. In the three-phase circuit, the three-phase current is mutually balanced and symmetrical. Based on the principle of power conservation, the current equation of the inverter in the two-phase coordinate system is as follows:
L d i d d t = u d e d R i d + w L i q L d i q d t = u q e q R i q w L i d
where: i d and i q represent the current components of the d and q axis; E d and E q are the network side voltage components d and q axis; u d and u q represent the AC output voltage components of the d and q axis; and w is the angular frequency.
The specific parameters of Converter are shown in Table 4:

7. Simulation Scenarios and Control Strategy Design

7.1. Hydrogen-Electric Coupling System Simulation Scenario

To meet the efficient consumption and flexible regulation requirements for grid-connected photovoltaic power generation, this section uses a common AC bus structure based on a hydrogen energy system. Eight simulation scenarios of hydrogen-electric coupling systems are proposed, as shown in Figure 7, where: P P V represents the output power of photovoltaic power generation, P l o a d denotes the power demand of the load, P s represents the surplus power, P g r i d represents the power demand from the grid, P f c represents the output power of fuel cell generation, and P e l e represents the power consumption of the electrolysis cell.
Scenario 1: When photovoltaic power generation can meet the load demand, but not the grid demand, the fuel cell serves as a backup power source to provide the required energy, and the electrolysis cell ceases operation.
Scenario 2: When photovoltaic power generation can simultaneously meet both load and grid demands, the fuel cell stops operating, and the surplus energy is utilized for hydrogen production in the electrolysis cell.
Scenario 3: When photovoltaic power generation satisfies the load demand without grid demand, the fuel cell stops operating, and the surplus energy is used for hydrogen production in the electrolysis cell.
Scenario 4: When photovoltaic power generation meets the load demand and there is an excess of grid electricity, the fuel cell stops operating, and the surplus energy is directed toward hydrogen production in the electrolysis cell.
Scenario 5: When photovoltaic power generation cannot meet both the load and grid demands, the fuel cell serves as a backup power source to provide the required energy, and the electrolysis cell ceases operation.
Scenario 6: When photovoltaic power generation can meet the load demand without grid demand, the fuel cell serves as a backup power source to provide the required energy, and the electrolysis cell stops operating.
Scenario 7: When photovoltaic power generation cannot meet the load demand with an excess of grid electricity in the system and both sources together can meet the load demand, the fuel cell stops operating, and the surplus energy is directed towards hydrogen production in the electrolysis cell.
Scenario 8: When photovoltaic power generation cannot meet both load and grid demands with an excess of grid electricity in the system and the combined operation is still insufficient to meet the load demand, the fuel cell serves as a backup power source to provide the required energy, and the electrolysis cell ceases operation.

7.2. Cooperative Control Strategy of Fuel Cell and Photovoltaic Power Generation

The photovoltaic array adopts the maximum power point tracking (MPPT) technology, and its basic principle is shown in Figure 8 where U p v is the photovoltaic voltage and I p v is the photovoltaic current. After the MPPT control, the reference voltage U p v r e f of the maximum power operating point is the output, which is compared with the actual photovoltaic voltage to generate the switching signal of the boost converter.
In the MPPT control algorithm, the incremental conductance method calculates the maximum power point tracking by comparing the instantaneous conductance of photovoltaic power generation with the variation of conductance. It has the characteristics of anti-interference in the external environment, can respond to changes smoothly and quickly, reduce voltage oscillation, and improve control effect and stability. The flow chart is shown in Figure 9 where: U k and I k are the real-time values of photovoltaic voltage and current, d I is the change of current, d U is the change of voltage, d I / d U is the conductance increment, and U r e f is the reference voltage.
The fuel cell system is used as a backup power generation system for the operating conditions when the new energy output cannot meet the load and grid demand.
The V-I and P-I characteristics of the fuel cell, as depicted in Figure 3, show that the port voltage and output power of the fuel cell stack can be adjusted. This is achieved by changing the output current of the fuel cell stack [35].
The fuel cell grid-connected control is mainly divided into power control and inverter control. Figure 10 is the fuel cell grid-connected power control strategy. The basic principle is to compare the reference current with the actual current and use PI control to generate the switching signal of the boost converter, where: P f c _ r e f is the reference value of the fuel cell output power; V f c is the actual voltage value of the fuel cell; i f c _ r e f is the reference value of the fuel cell output current; i f c is the actual current of the fuel cell; and k i f c and k p f c are the PI control parameters of the fuel cell power.
In Figure 11, the fuel cell grid-connected inverter control strategy is adopted. The basic principle is to use voltage and current double closed-loop control and complete the current inner loop feedforward decoupling control with the help of traditional PI control. The voltage outer loop control aims at the output voltage of the DC side, stabilizes the DC bus voltage, and provides the current reference value for the inner loop control. In this figure: U d c r e f is the reference value of DC bus voltage; U d c is the actual DC bus voltage; and i q r e f is the reference value of q-axis current.

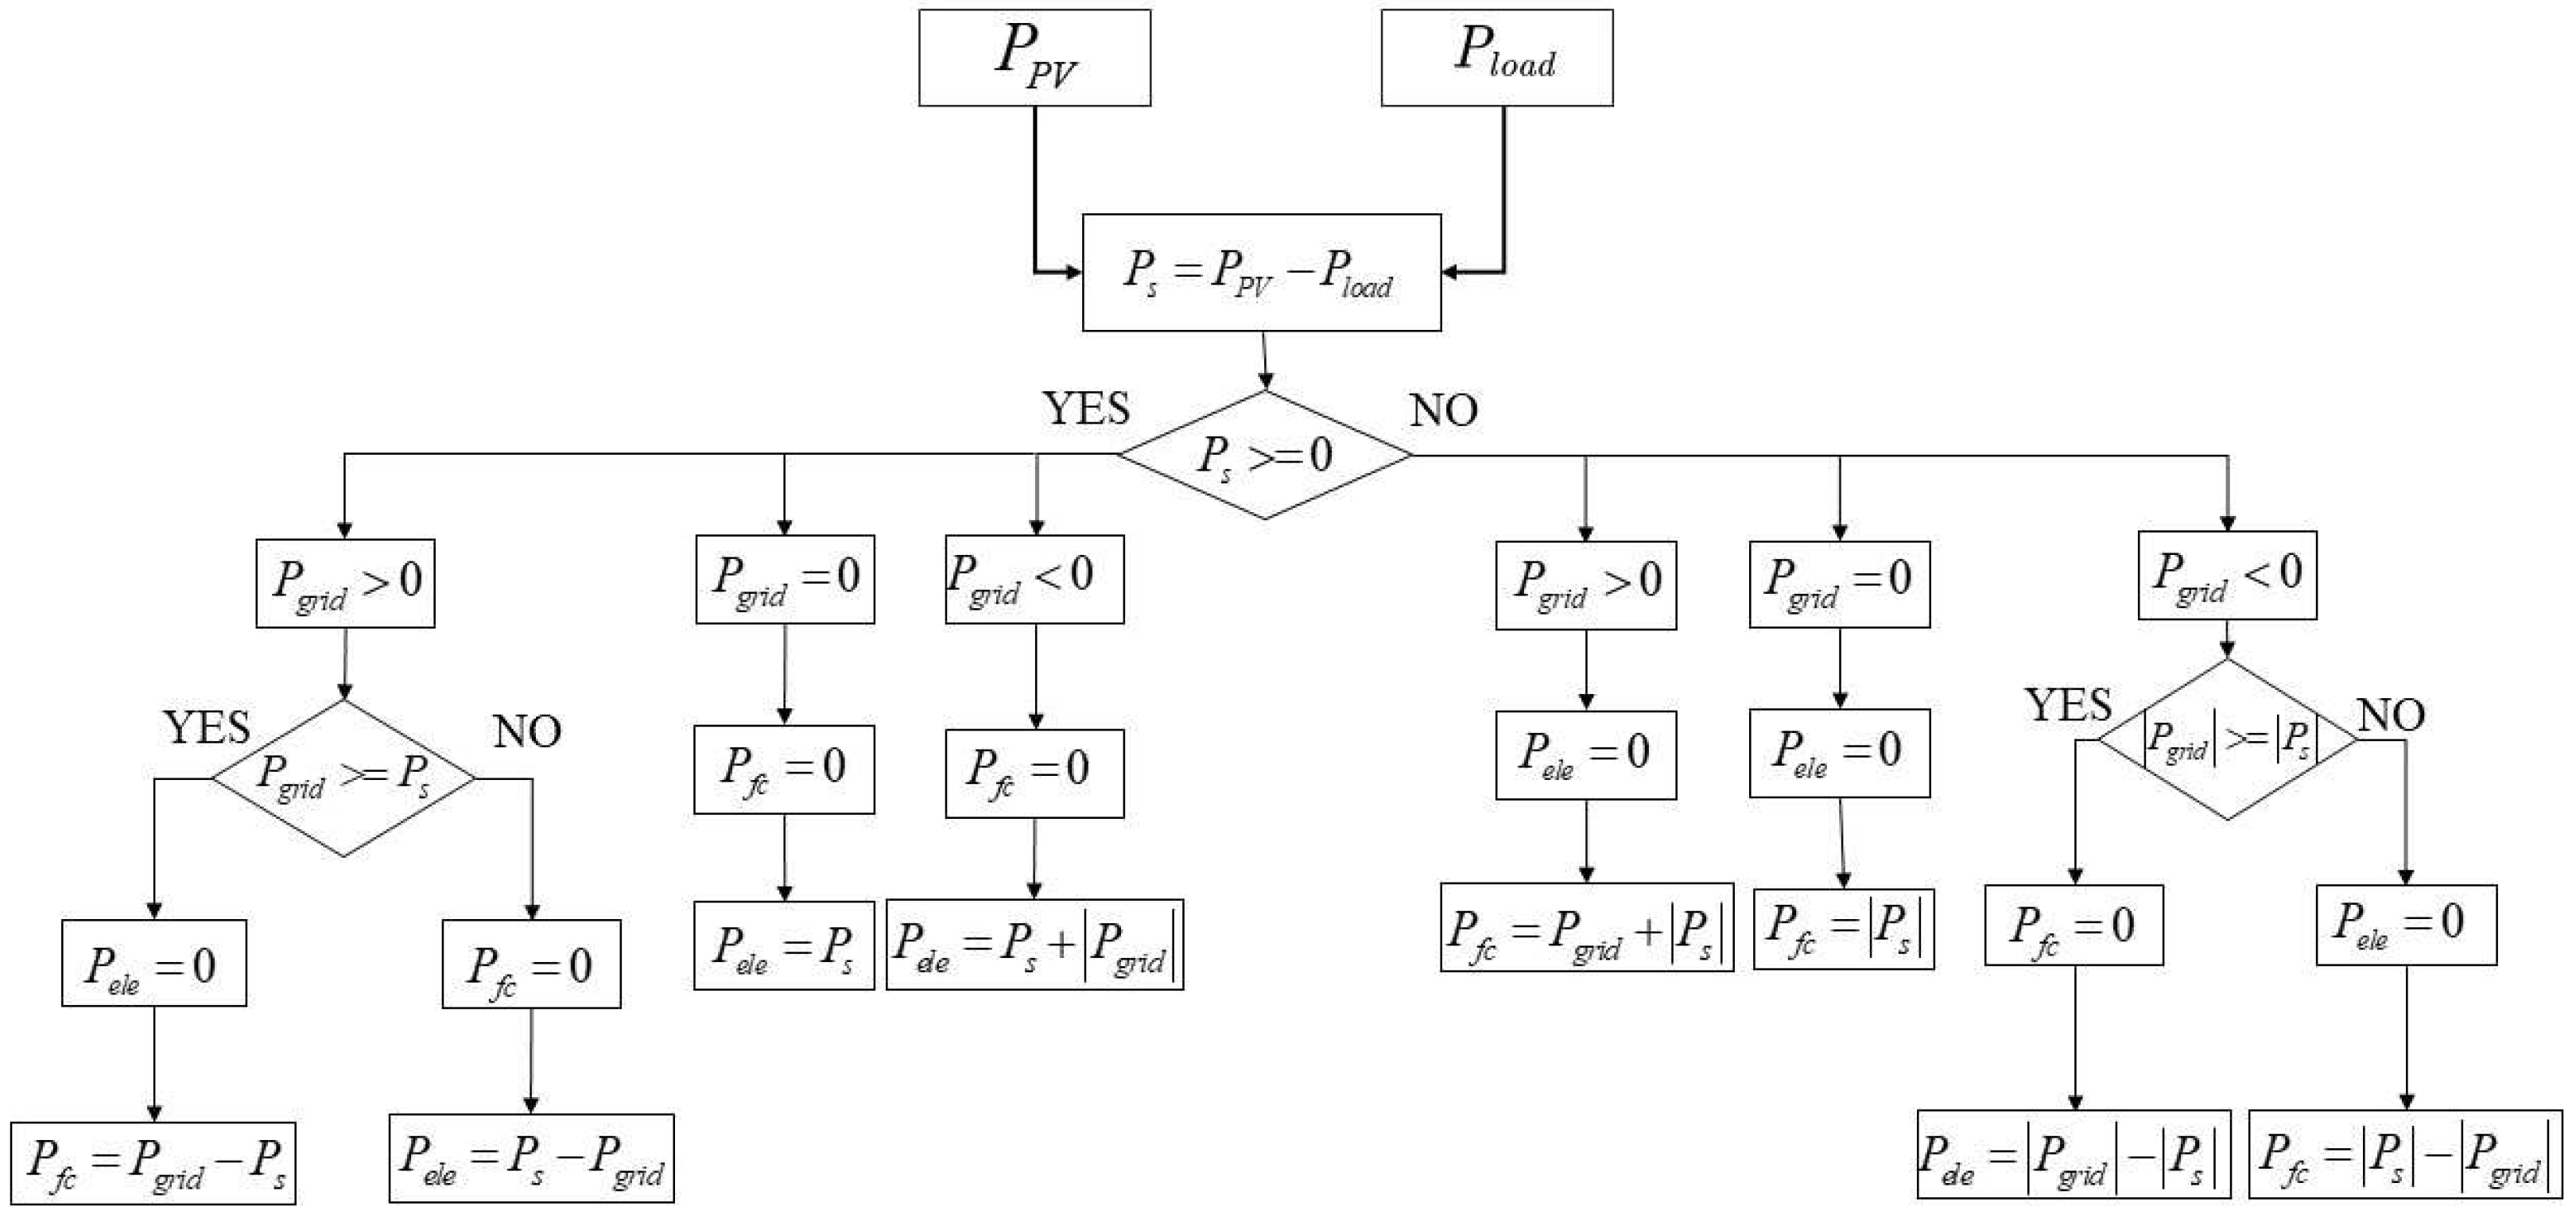
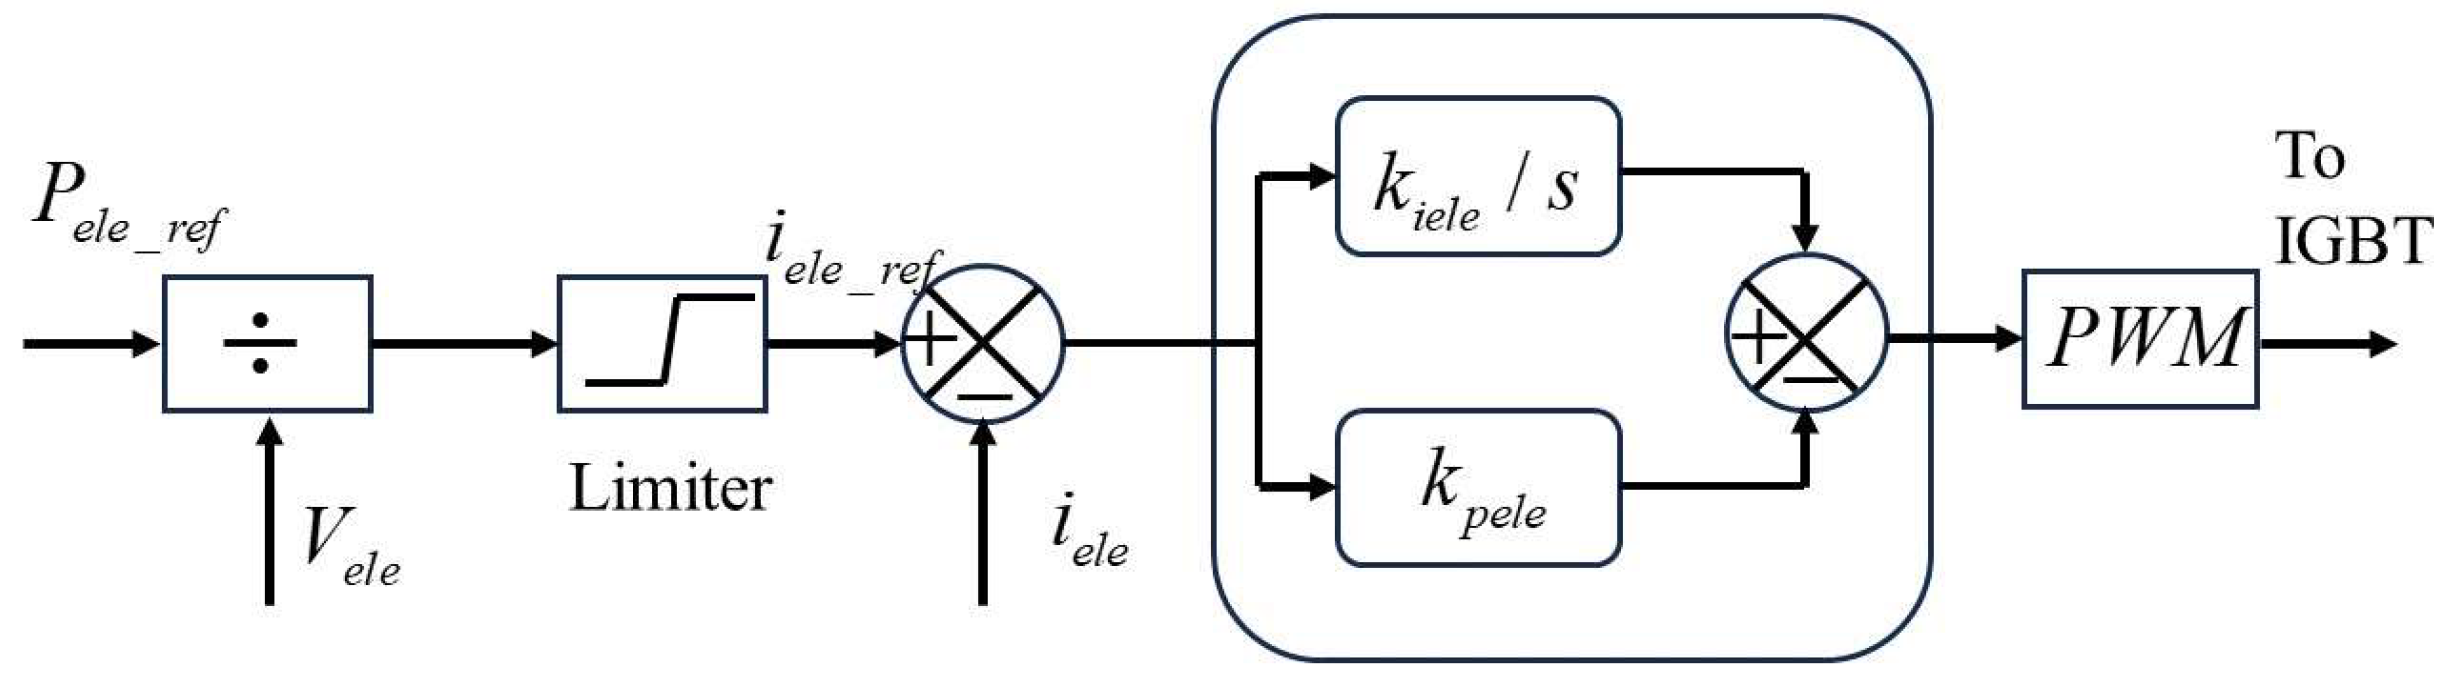
7.3. The Collaborative Control Strategy for Electrolytic Hydrogen Production and Photovoltaic Power Generation

According to the supply and demand situation, the operation of the water electrolysis hydrogen production equipment must be adjusted. When there is abundant electricity and excess supply, the extra electricity will be supplied to the water electrolysis equipment to increase hydrogen production and improve energy utilization. When the electricity supply is tight or even insufficient, the water electrolysis equipment will reduce or suspend hydrogen production. The hydrogen production system in the electrolytic cell converts the excess electricity into hydrogen energy through a power electronic converter, providing fuel for hydrogen fuel cells to achieve regulatory purposes.
The control strategies for hydrogen production through water electrolysis mainly include rectification control and power control. From Figure 10 and Figure 12, it can be seen that both fuel cells and electrolytic cells use the same control principle, but the current direction is different, so both use the same control parameters where: P e l e _ r e f is the reference value of power consumption for electrolytic hydrogen production; V e l e is the Actual voltage value of electrolytic hydrogen production; i e l e _ r e f is the reference value of input current for electrolytic hydrogen production; i e l e is the actual current of electrolytic hydrogen production; and k i e l e and k p e l e are the pi control parameters for electrolytic hydrogen production power.

8. Simulation Analysis

In order to verify the applicability of the established simulation model and the control strategy in different experimental scenarios, and to analyze the dynamic regulation and response characteristics of the hydrogen-electric coupling system, a hydrogen-electric coupling simulation and experimental system containing the above-mentioned model and the control strategy is established based on the MATLAB/Simulink-R2023a platform in this section, as shown in Figure 13. In this system, the rated capacity of the photovoltaic power generation is 50.73 kW, the rated capacity of the fuel cell is 50 kW, the rated capacity of the electrolysis hydrogen plant is 50 kW, and the hydrogen-electricity coupling system is converged through the AC bus, with a rated voltage of 380 V, and connected to the public power grid with rated frequency of 50 Hz.

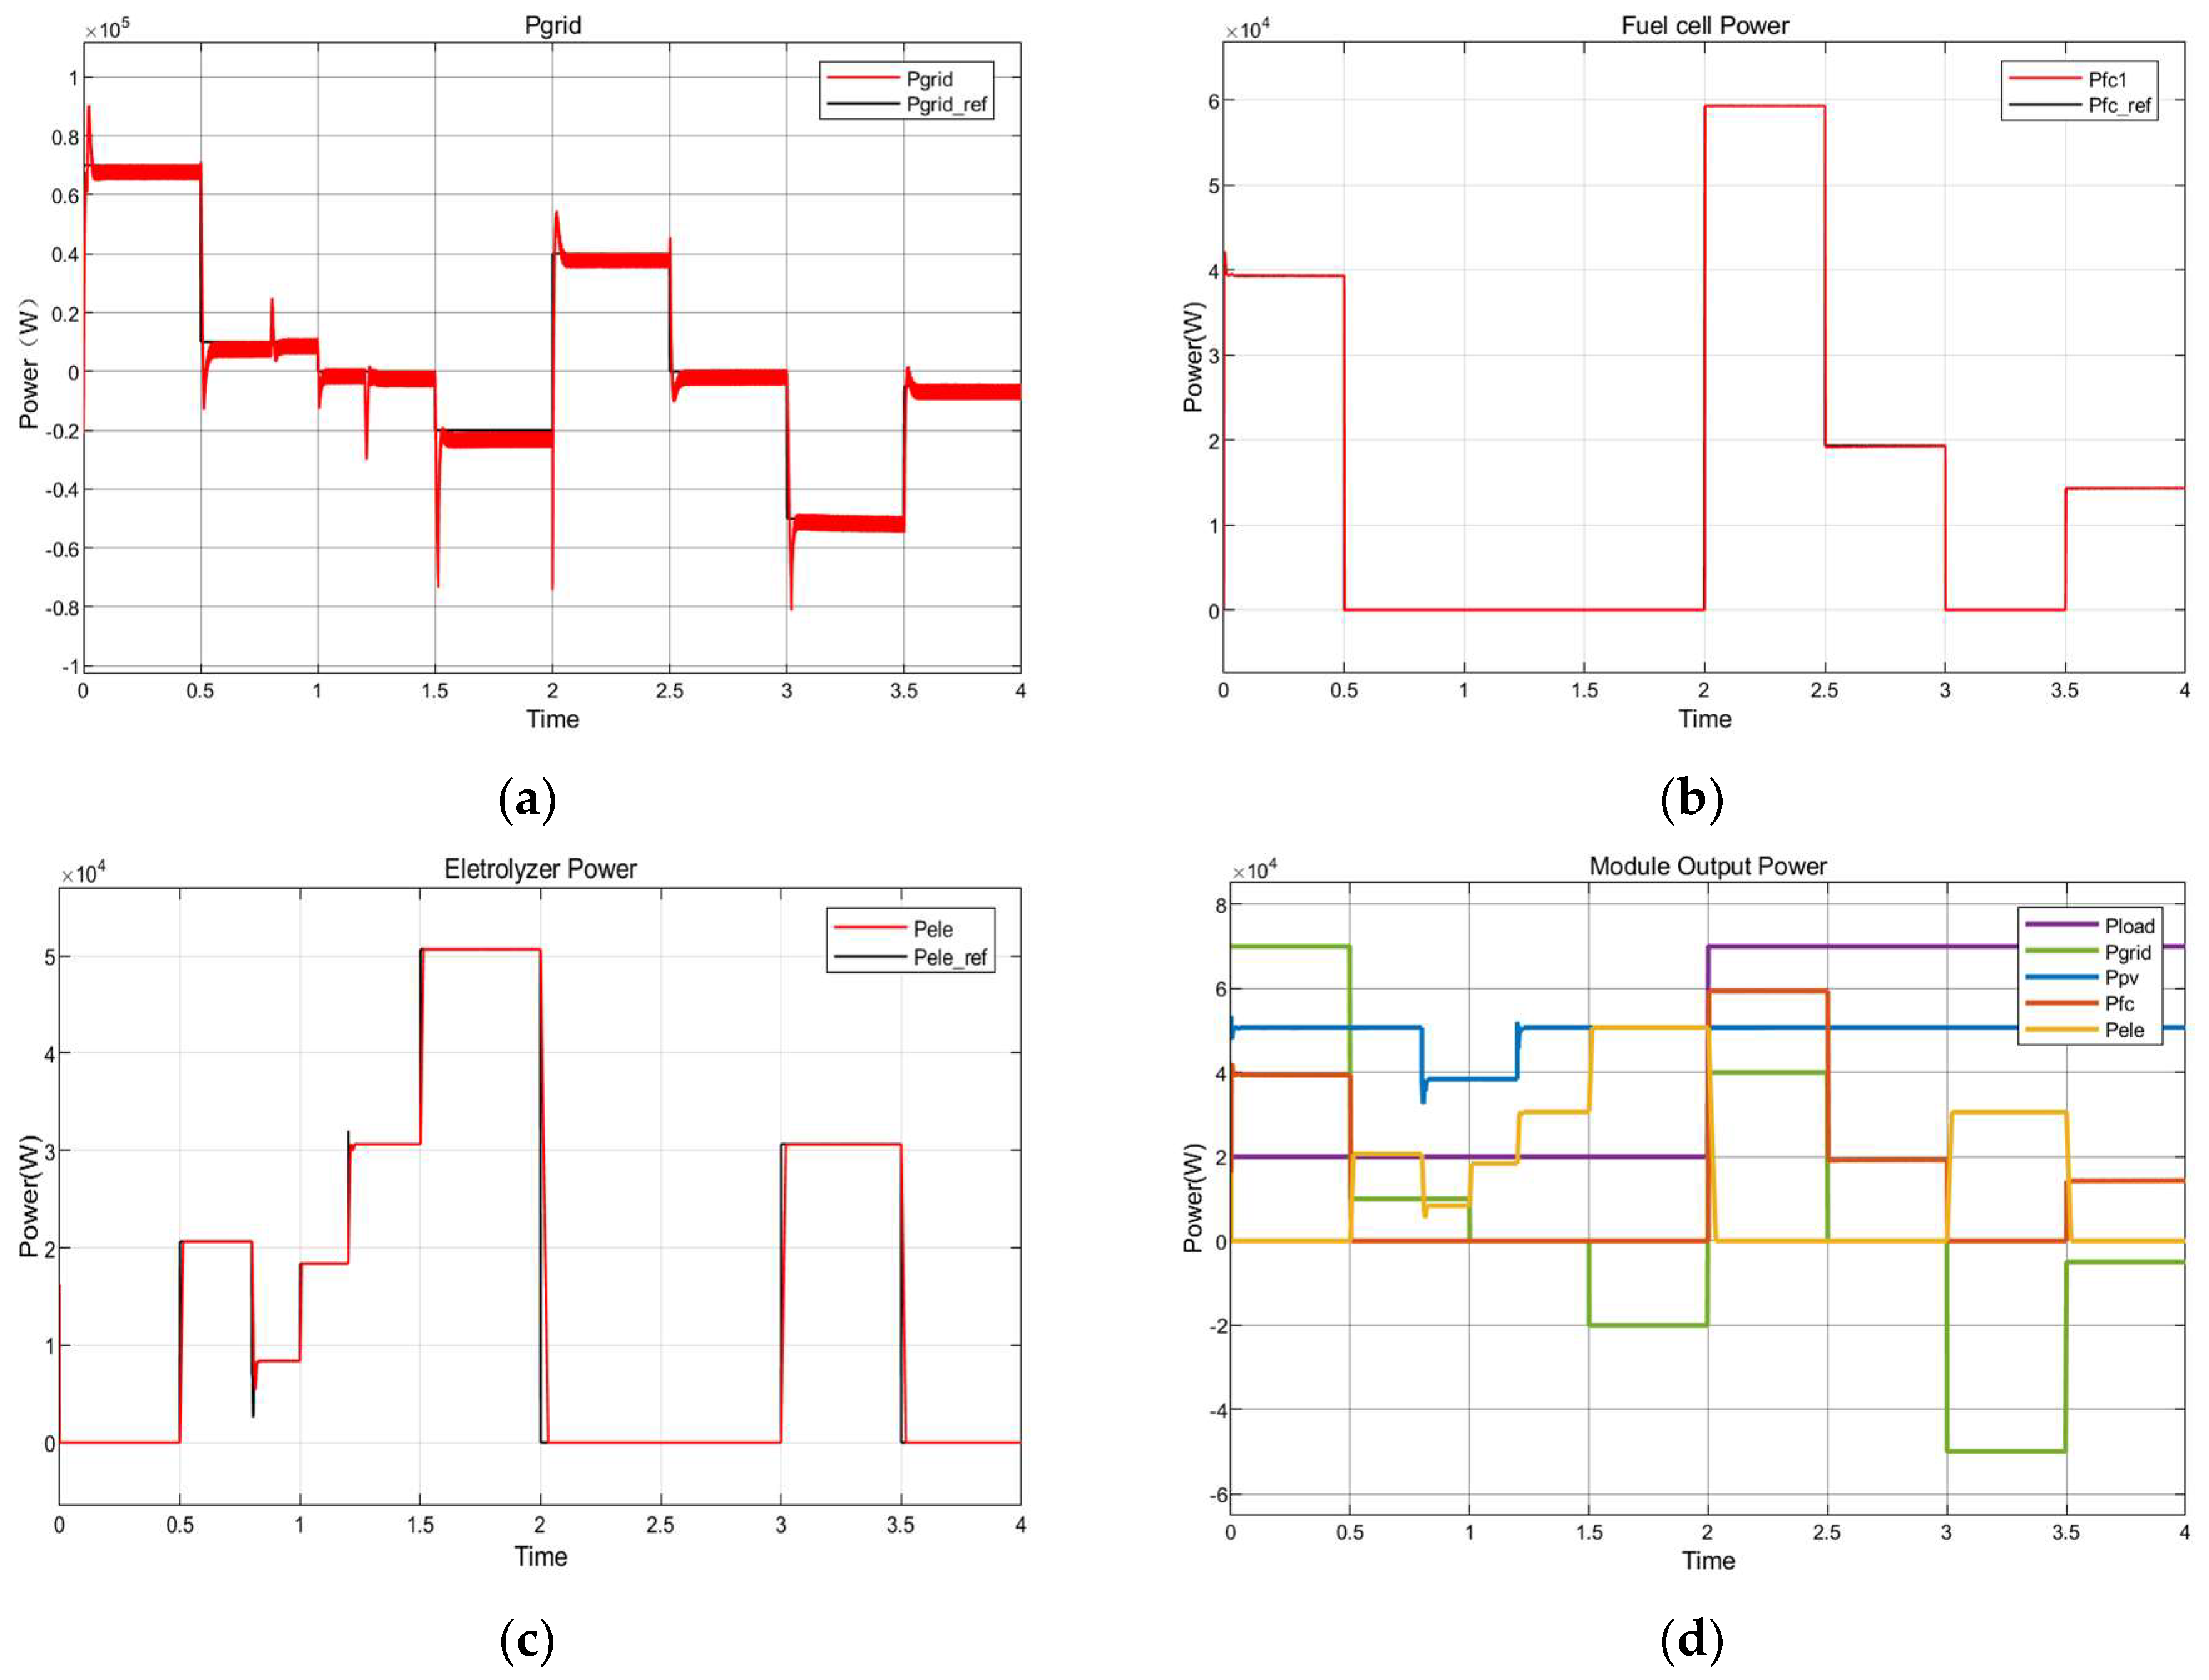
8.1. System Response Characteristics under Different Simulation Scenarios

As depicted in Figure 14a–c, the black line represents the reference value, while the red line corresponds to the actual output value. In Figure 14d, the initial load demand was set to 20 kW, and the load increased to 70 kW at t = 2 s. The initial PV output power was 50.73 kW, and the PV output power decreased to 38.395 kW at t = 0.8 s and increased to 50.73 kW at t = 1.2 s.
In the system illustrated in Figure 14d, photovoltaic (PV) and hydrogen systems operate synergistically to achieve optimal performance under different conditions. When surplus electrical energy is generated by a PV, it can be utilized for electrolytic hydrogen production, converting electrical energy into hydrogen, which is stored in the hydrogen storage tank. Conversely, when the electricity generated by a PV is insufficient, a fuel cell can be employed to convert stored hydrogen back into electrical energy. This coupling of hydrogen and electrical systems ensures the complementary utilization of energy forms among solar energy, hydrogen energy, and electrical energy.
At t = 0 s, the grid-connected power was initially set to 70 kW. At this time the system was working in simulation scenario 1. It was difficult to maintain stable operation of the system when only relying on the PV output, and the reference value of the given output power of the fuel cell rose from 0 kW to 39.27 kW.
When t = 0.5 s, the grid power was reduced to 10 kW. At this time, the system was working in simulation scenario 2. Due to the reduced demand for grid connection, the reference value of electrolytic hydrogen consumption power rose from 0 kW to 20.73 kW, and the reference value of the output power of the fuel cell was reduced to 0 kW.
At t = 0.8 s, the grid-connected power remained unchanged and the PV output power dropped to 38.395 kW. At this time, the system was still working in simulation scenario 2, and, due to the reduction of PV output power, the given reference value of electrolytic hydrogen consumption power was reduced from 20.73 kW to 8.395 kW.
At t = 1 s, the grid-connected power decreased to 0 kW. At this time, the system was working in simulation scenario 3, and the given reference value of electrolytic hydrogen consumption power increased from 8.395 kW to 18.395 kW due to the decrease in grid-connected demand.
At t = 1.2 s, the grid power remained unchanged and the PV output power rose to 50.73 kW. At this time, the system was still working in simulation scenario 3, and, due to the rise of the PV output power, the reference value of the given electrolytic hydrogen consumption power rose from 18.395 kW to 30.73 kW.
At t = 1.5 s, the grid-connected power dropped to −20 kW, and then the system worked in simulation scenario 4. The given reference value of electrolytic hydrogen consumption power rose from 30.73 kW to 50.73 kW due to the excess power in the grid.
At t = 2 s, the grid power rose to 40 kW and the load demand rose to 70 kW. At this time, the system was working in simulation scenario 5. Due to the rise in both the grid demand and the load demand, the PV output was not enough to meet the demand, and the reference value of the given fuel cell output power rose from 0 kW to 59.27 kW.
At t = 2.5 s, the grid-connected power decreased to 0 kW. At this time, the system worked in simulation scenario 6. Due to the decrease in the grid-connected demand, the reference value of the given fuel cell output power decreased from 59.27 kW to 19.27 kW.
At t = 3 s, the grid-connected power was reduced to −50 kW. At this time, the system worked in simulation scenario 7, and the reference value of the given electrolytic hydrogen consumption power rose from 0 kW to 30.73 kW due to the surplus power of the grid.
At t = 3.5 s, the grid-connected power rose to −5 kW. At this time, the system worked in simulation scenario 8, and the reference value of the given fuel cell output power rose from 0 kW to 25.27 kW due to the insufficiency of PV output and the surplus of grid power to meet the load demand.
From the above analysis, it can be seen that the fuel cell and electrolyzer could quickly track the demand for flexible regulation of the PV grid-connected system in different scenarios, and accurately respond to the power regulation commands in different scenarios, thus, highlighting the flexible and highly efficient operation of the whole hydrogen-electric coupling system.

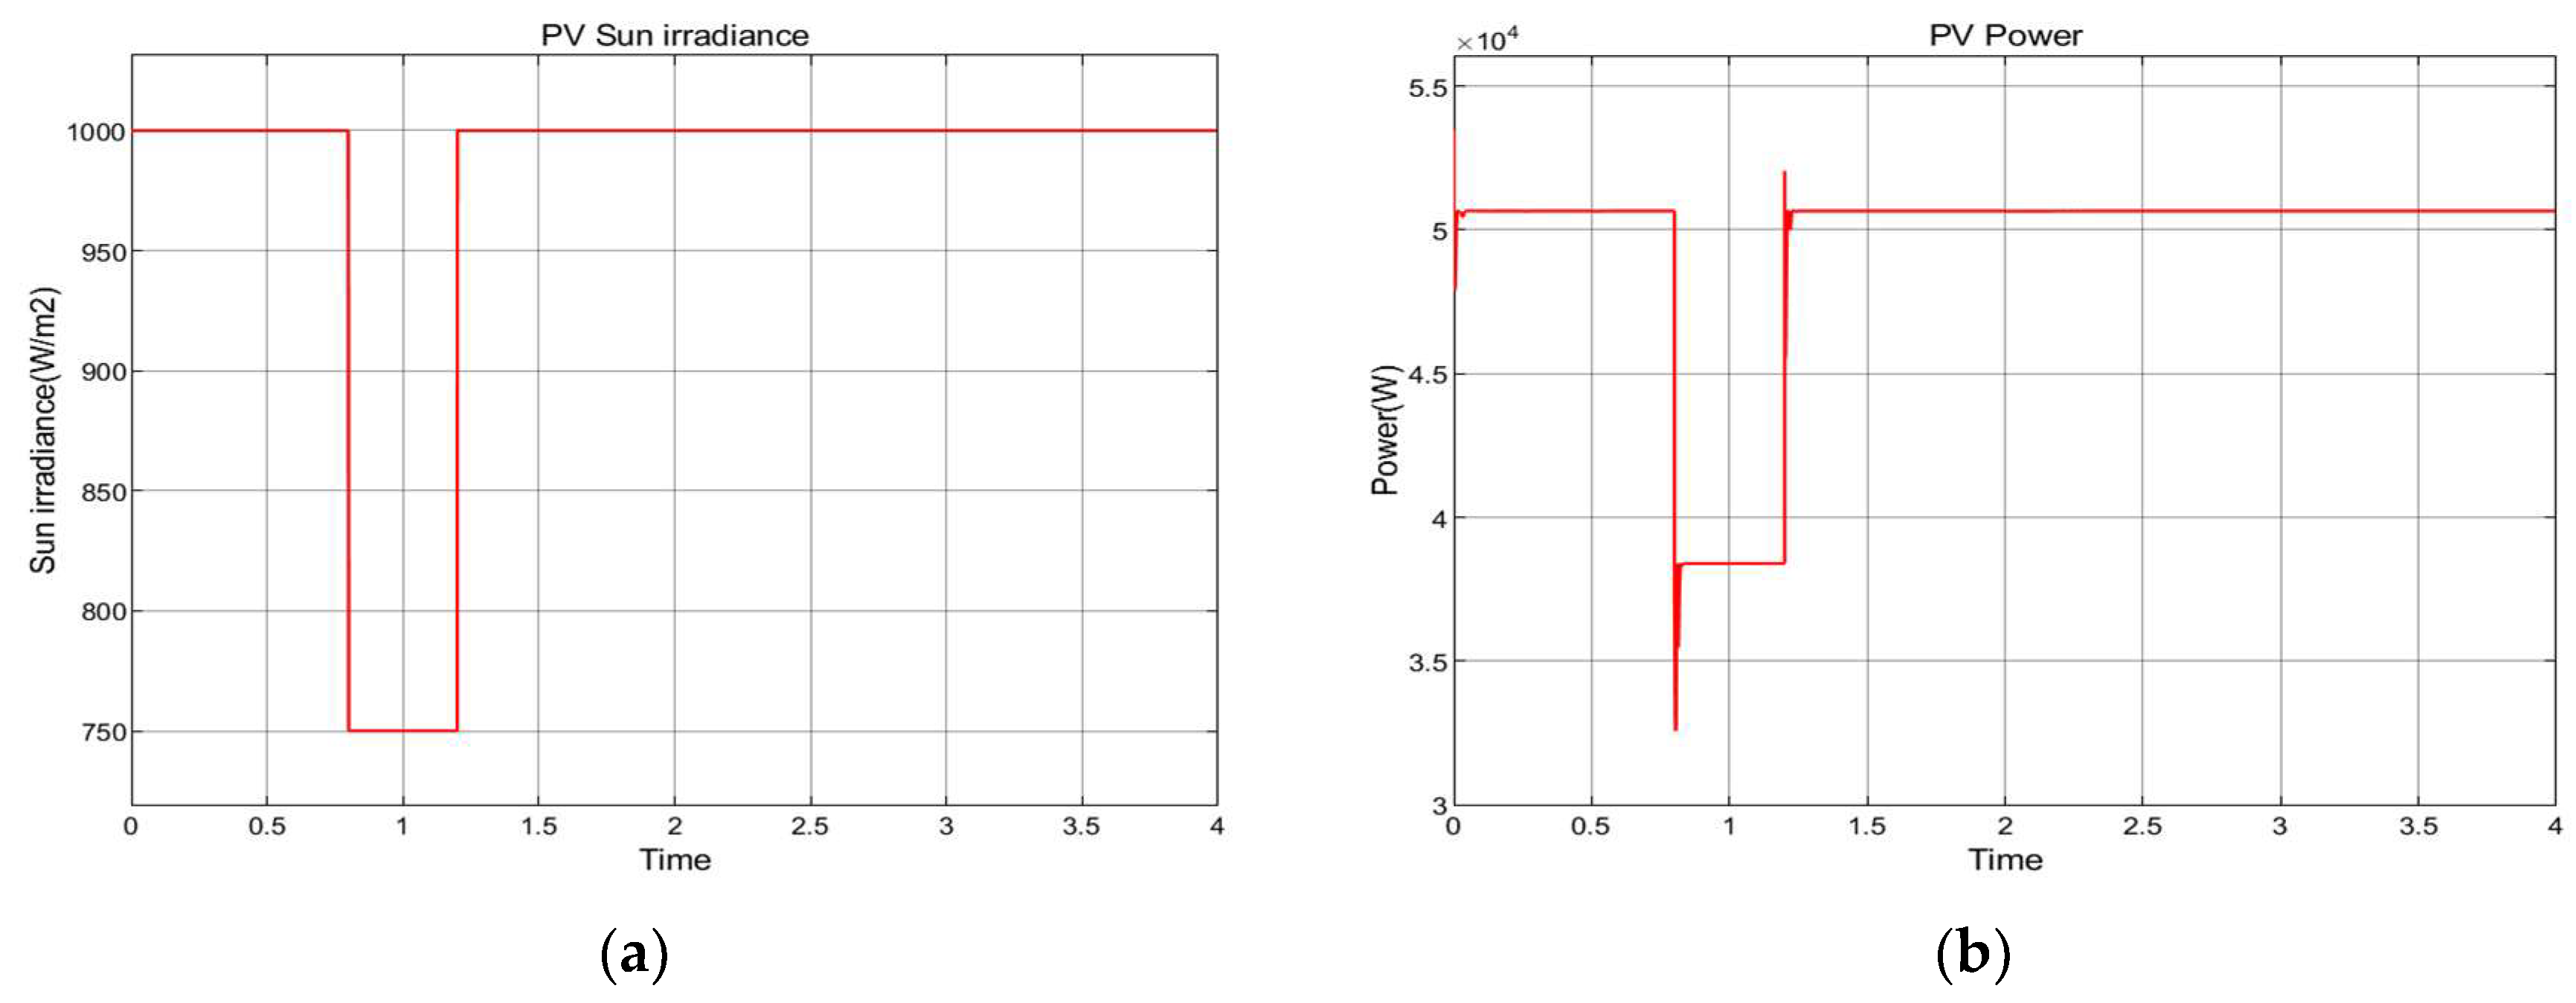
8.2. Photovoltaic Cells Energy Conversion

The PV irradiation intensity setting curve and its PV output variation curve are shown in Figure 15.
As depicted in Figure 15a, the PV irradiation intensity was initially set to 1000 ( W / m 2 ), the PV irradiation intensity decreased to a value of 750 ( W / m 2 ) at t = 0.8 s, and the PV irradiation intensity rose to 1000 ( W / m 2 ) at t = 1.2 s. In Figure 15, the power emitted by the PV rises and falls as the light intensity increases and decreases. At the same temperature, the PV power is consistent with the change in light intensity.

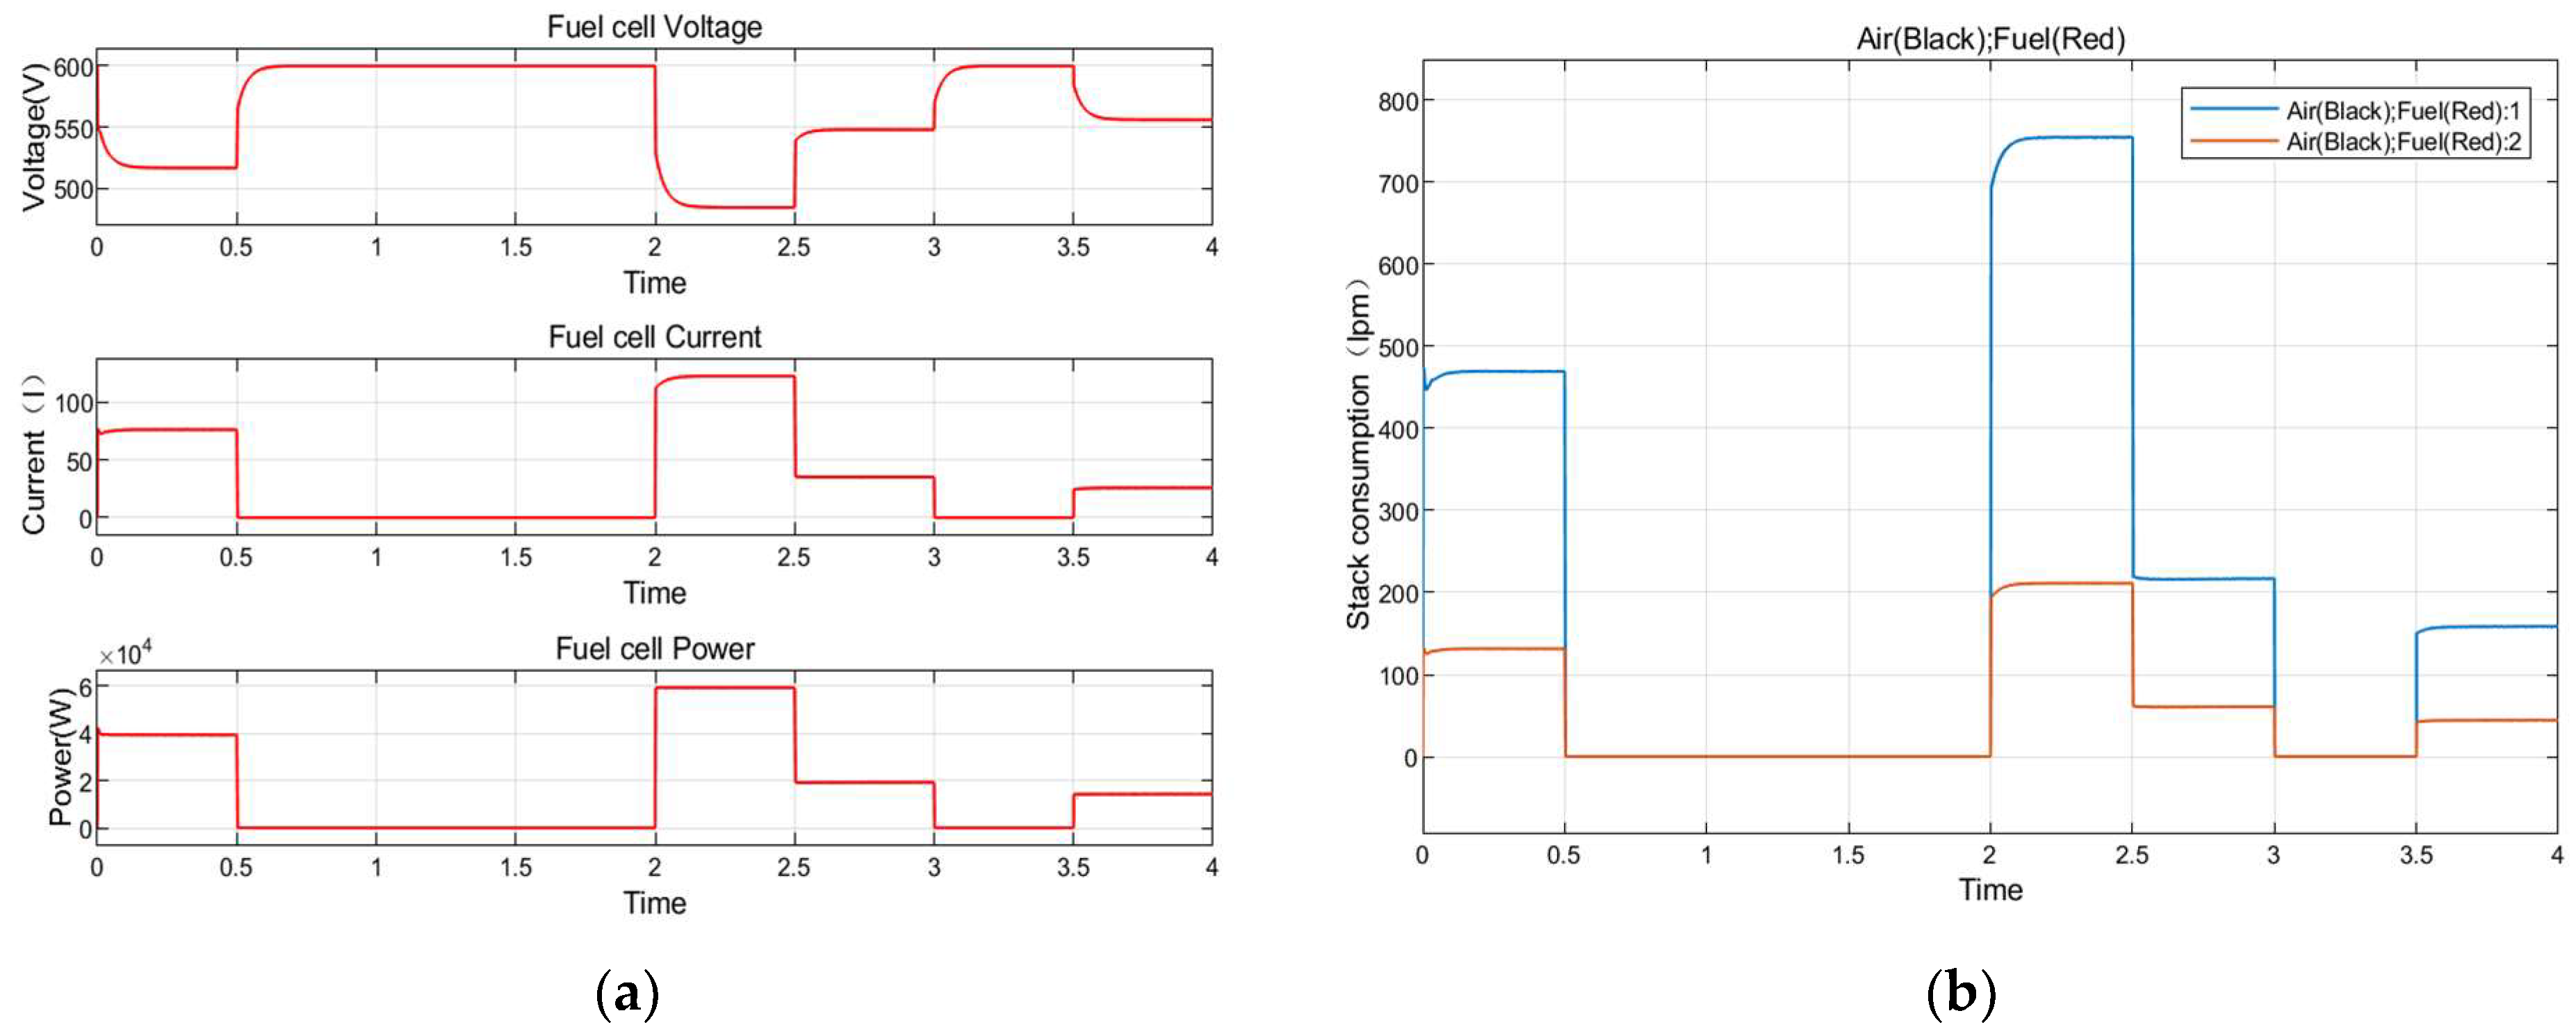
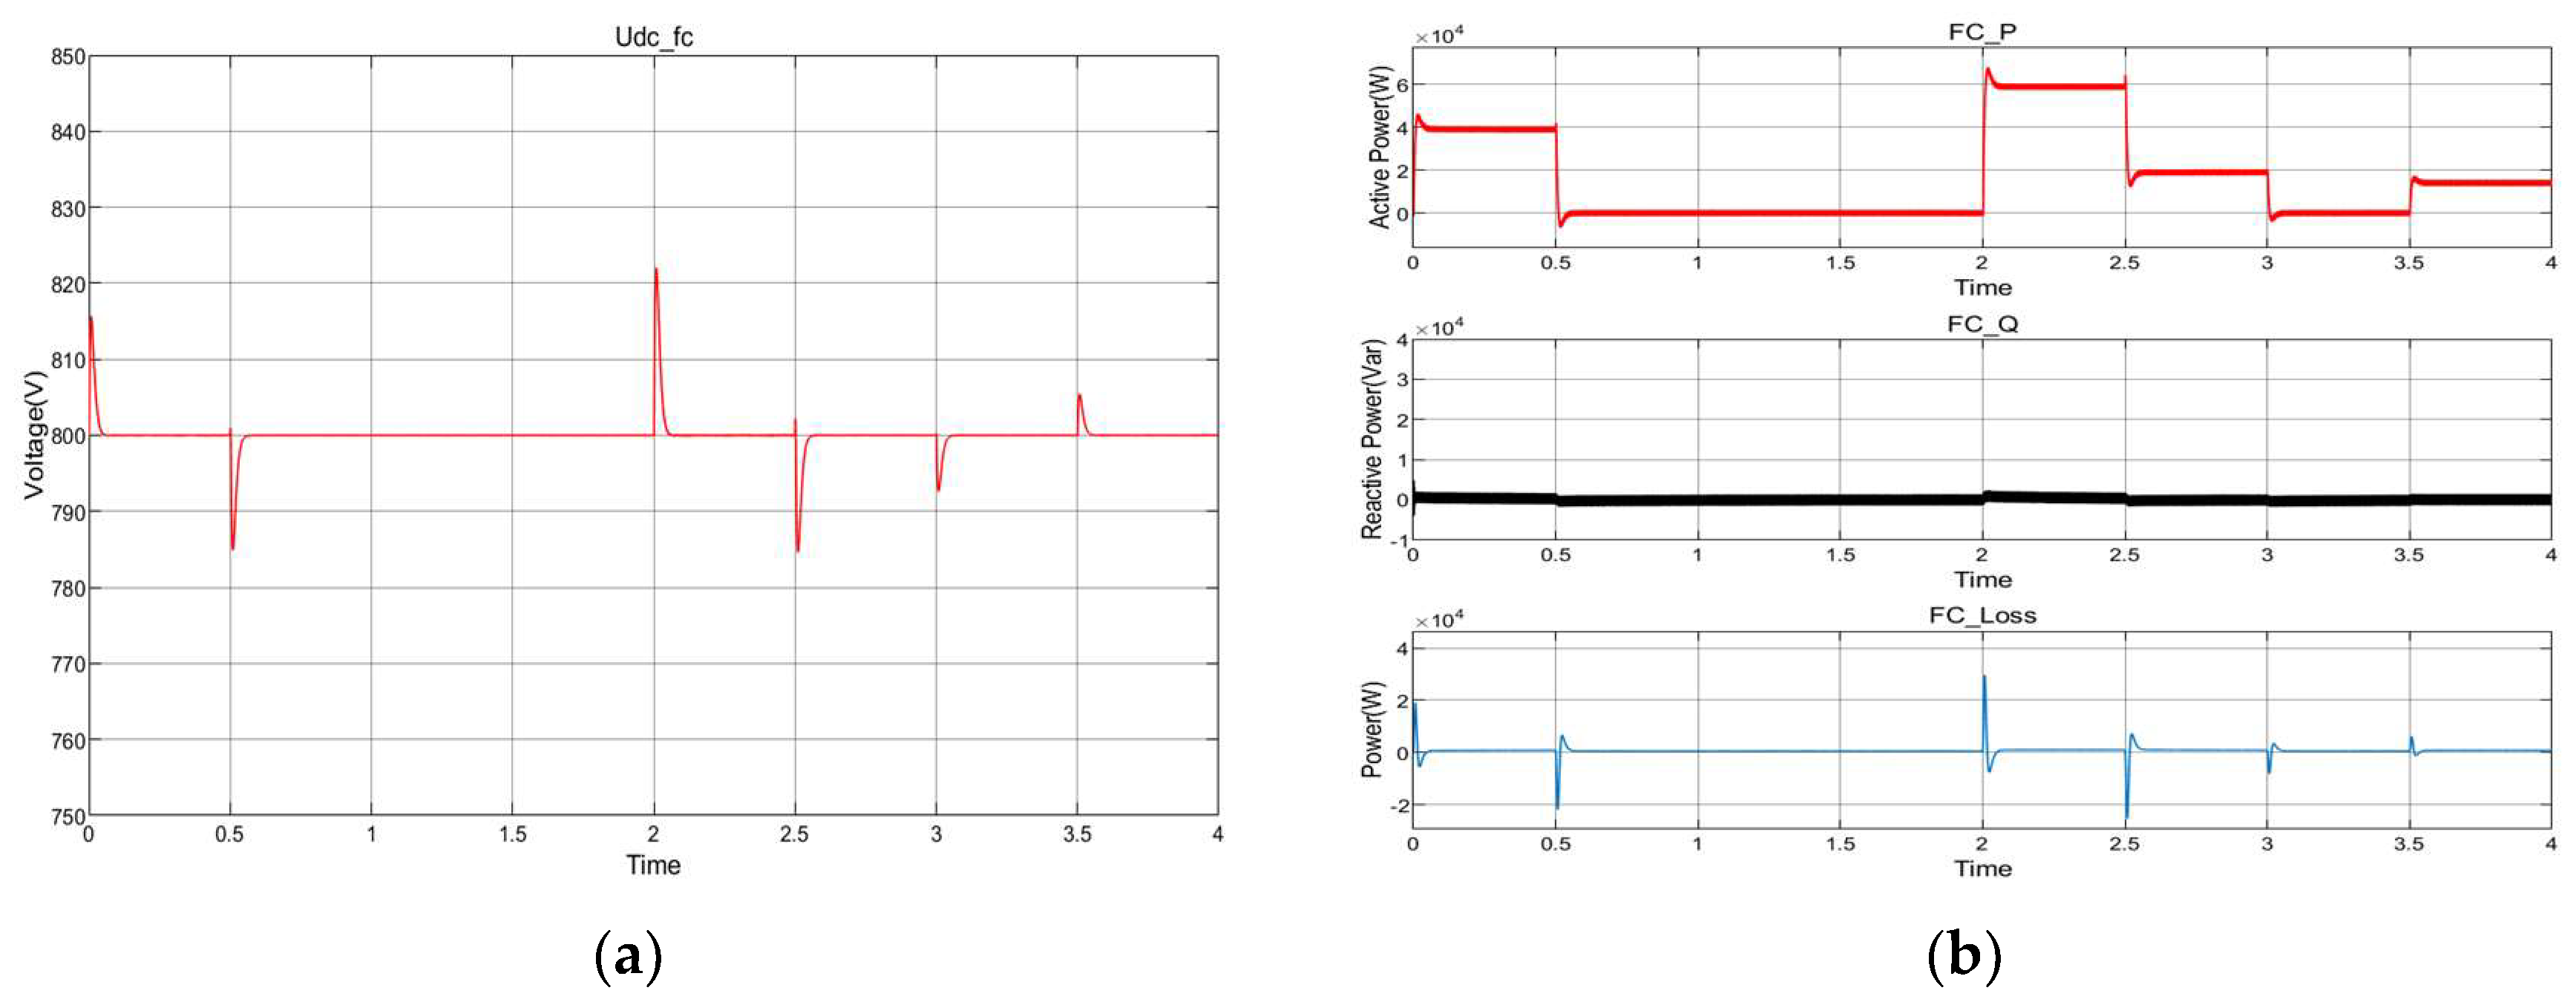
8.3. Fuel Cell Energy Conversion

As shown in Figure 16a, during the dynamic changes of the fuel cell, due to its dynamic characteristics, there will be a certain lag in the process of sudden changes, but it can still enter a steady state within 0.1 s. The dynamic characteristics of the fuel cell voltage were observed at 0 s, 0.5 s, 2 s, 2.5 s, 3 s, and 3.5 s, while the dynamic characteristics of the fuel cell current and power were observed at 0 s and 2 s. Compared to the fuel cell voltage, its current change sensitivity is higher, and the current response is faster. As shown in Figure 16b, the fuel consumption curve of the fuel cell shows a positive correlation with the power curve.

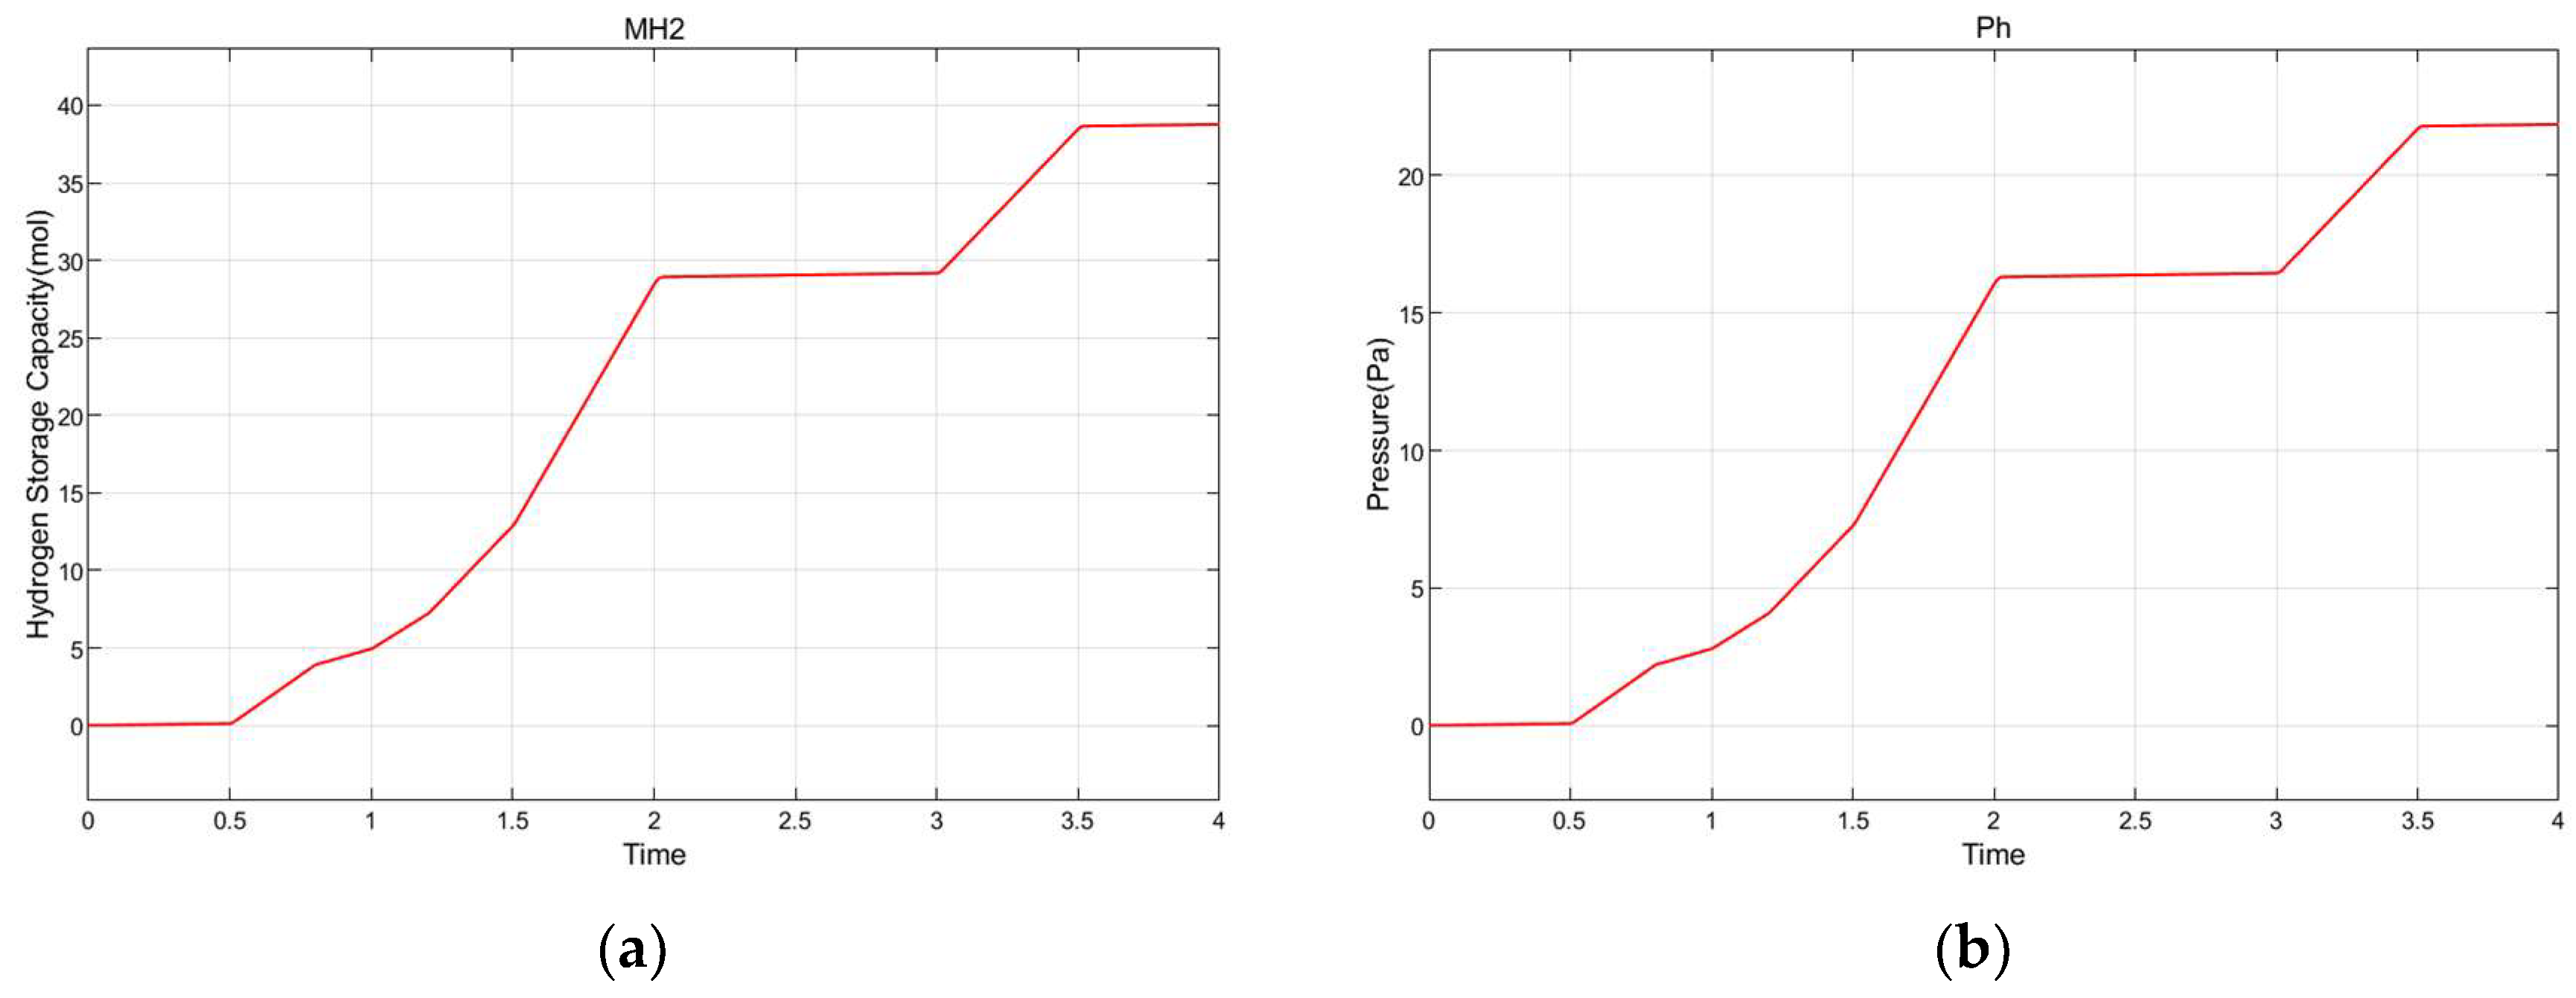
8.4. Electrolysis to Hydrogen Energy Conversion

The rate change curve of electrolytic hydrogen production is shown in Figure 17. When t = 0.5 s, during the startup of the electrolytic hydrogen production unit, the hydrogen production rate increased from 0 ( mol / s ) to 6.4 ( mol / s ). When t = 0.8 s, the hydrogen production rate decreased to 2.6 ( mol / s ). When t= 1 s, t = 1.2 s and t = 1.5 s, the hydrogen production increased to 5.7 ( mol / s ), 9.5 ( mol / s ) and 15.6 ( mol / s ). When t = 1.5 s, the hydrogen production rate reached its maximum value. When t = 2 s and t = 3.5 s, the electrolysis hydrogen production device stopped running and the hydrogen production rate dropped to 0 ( mol / s ). When t = 3 s, due to the restart of the electrolysis hydrogen production device, the hydrogen production rate rose again from 0 ( mol / s ) to 9.5 ( mol / s ).
Figure 18 illustrates the hydrogen production and storage capacity of the electrolyzer, as well as the pressure of the hydrogen storage tank. By comparing these two figures, their changing trends were consistent, and their upward slope was related to the hydrogen production rate. Between 2–3 s and 3.5–4 s, the hydrogen production rate was 0, while the hydrogen storage capacity and hydrogen storage tank pressure remained unchanged. Between 0.5–2 s and 3–3.5 s, the higher the hydrogen production rate, the greater the hydrogen storage capacity and the slope of pressure rise in the hydrogen storage tank. Assuming that the hydrogen produced by electrolytic hydrogen generation in this paper, after meeting the backup demand of fuel cells, remains surplus, it can be sold as an industrial product and applied in other fields.

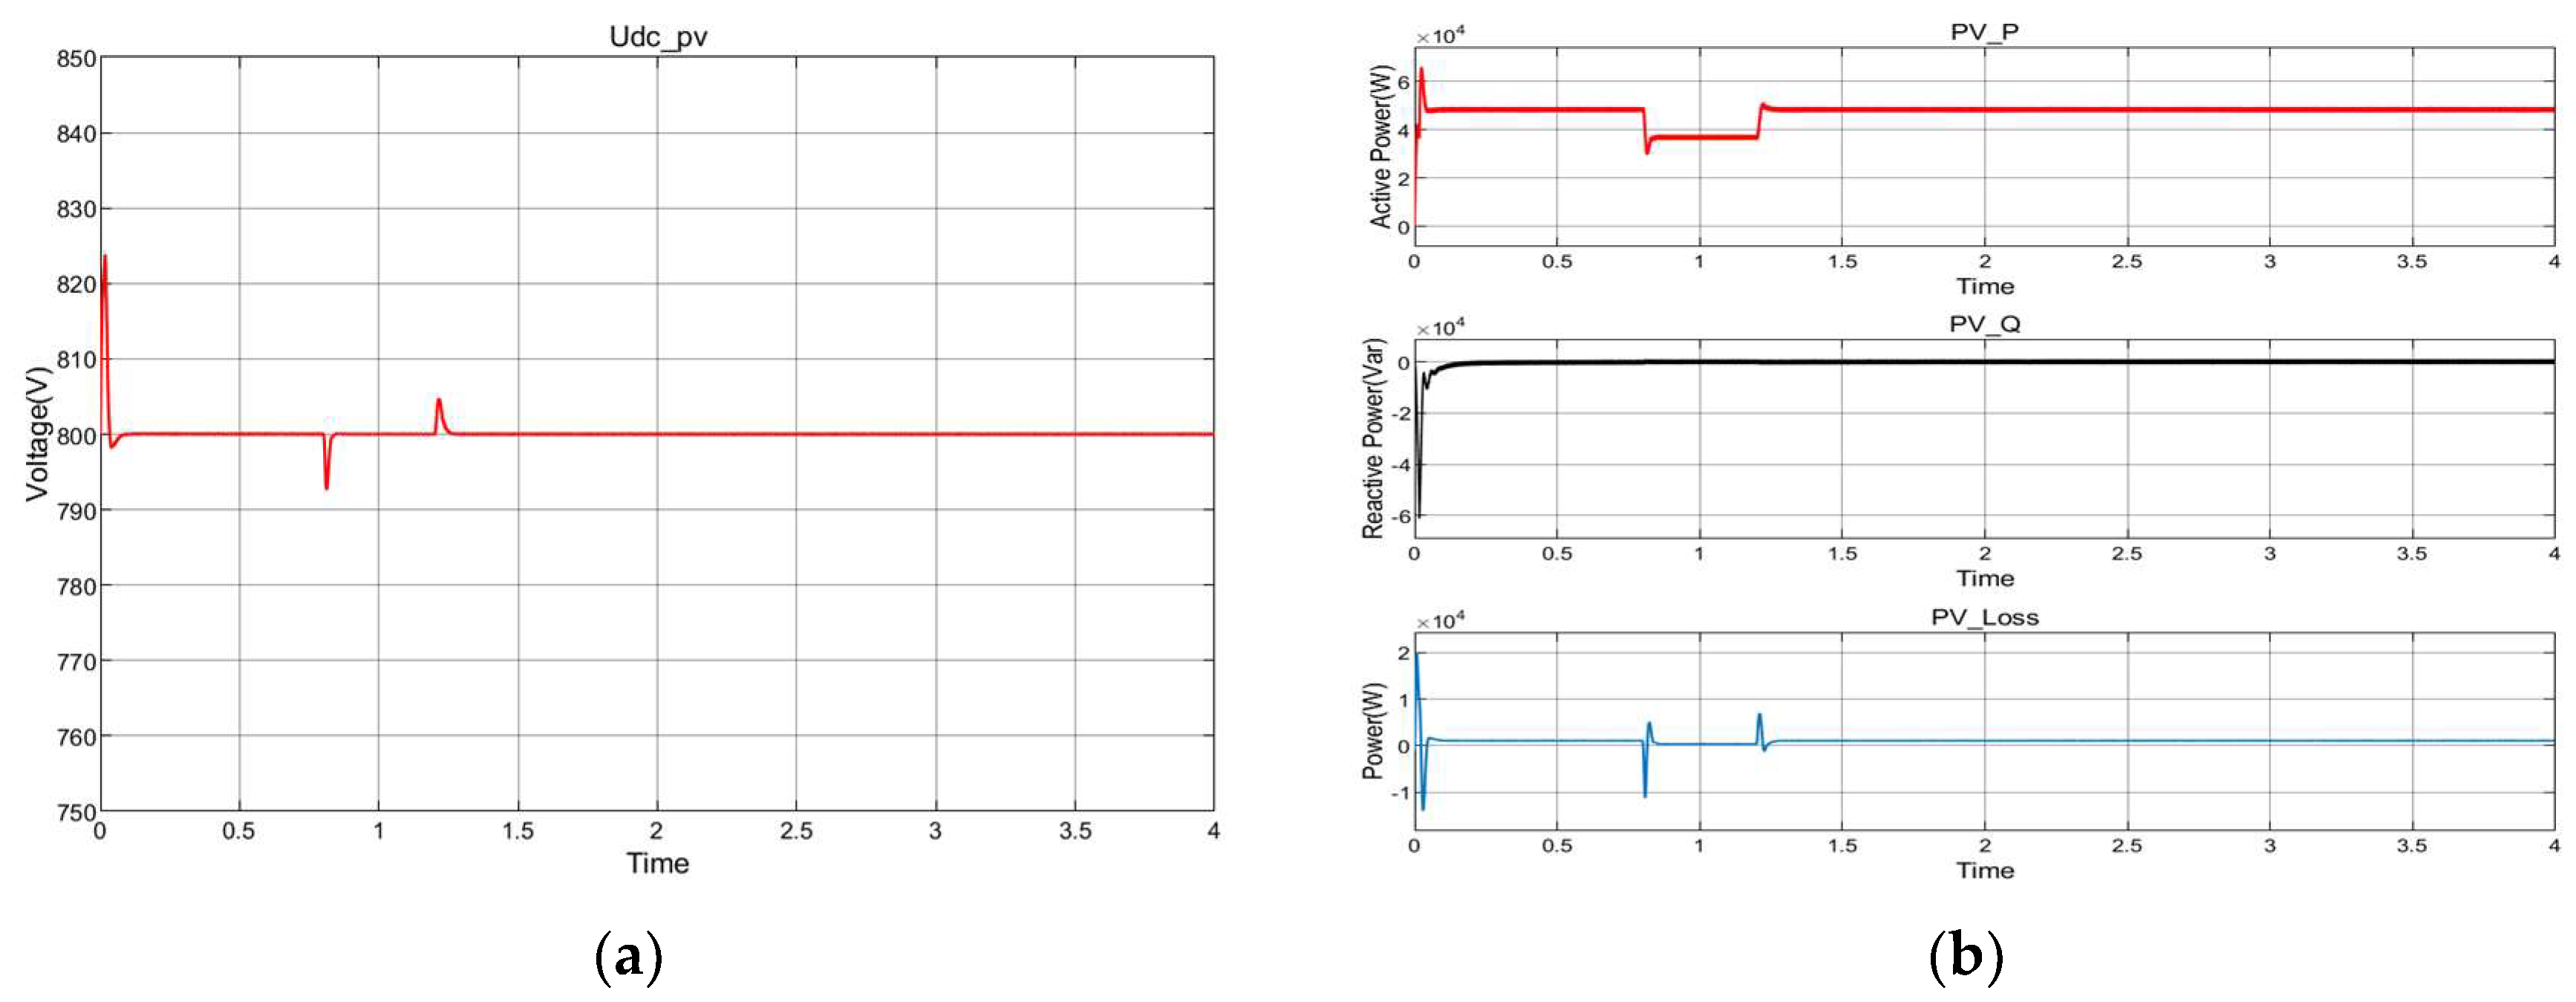
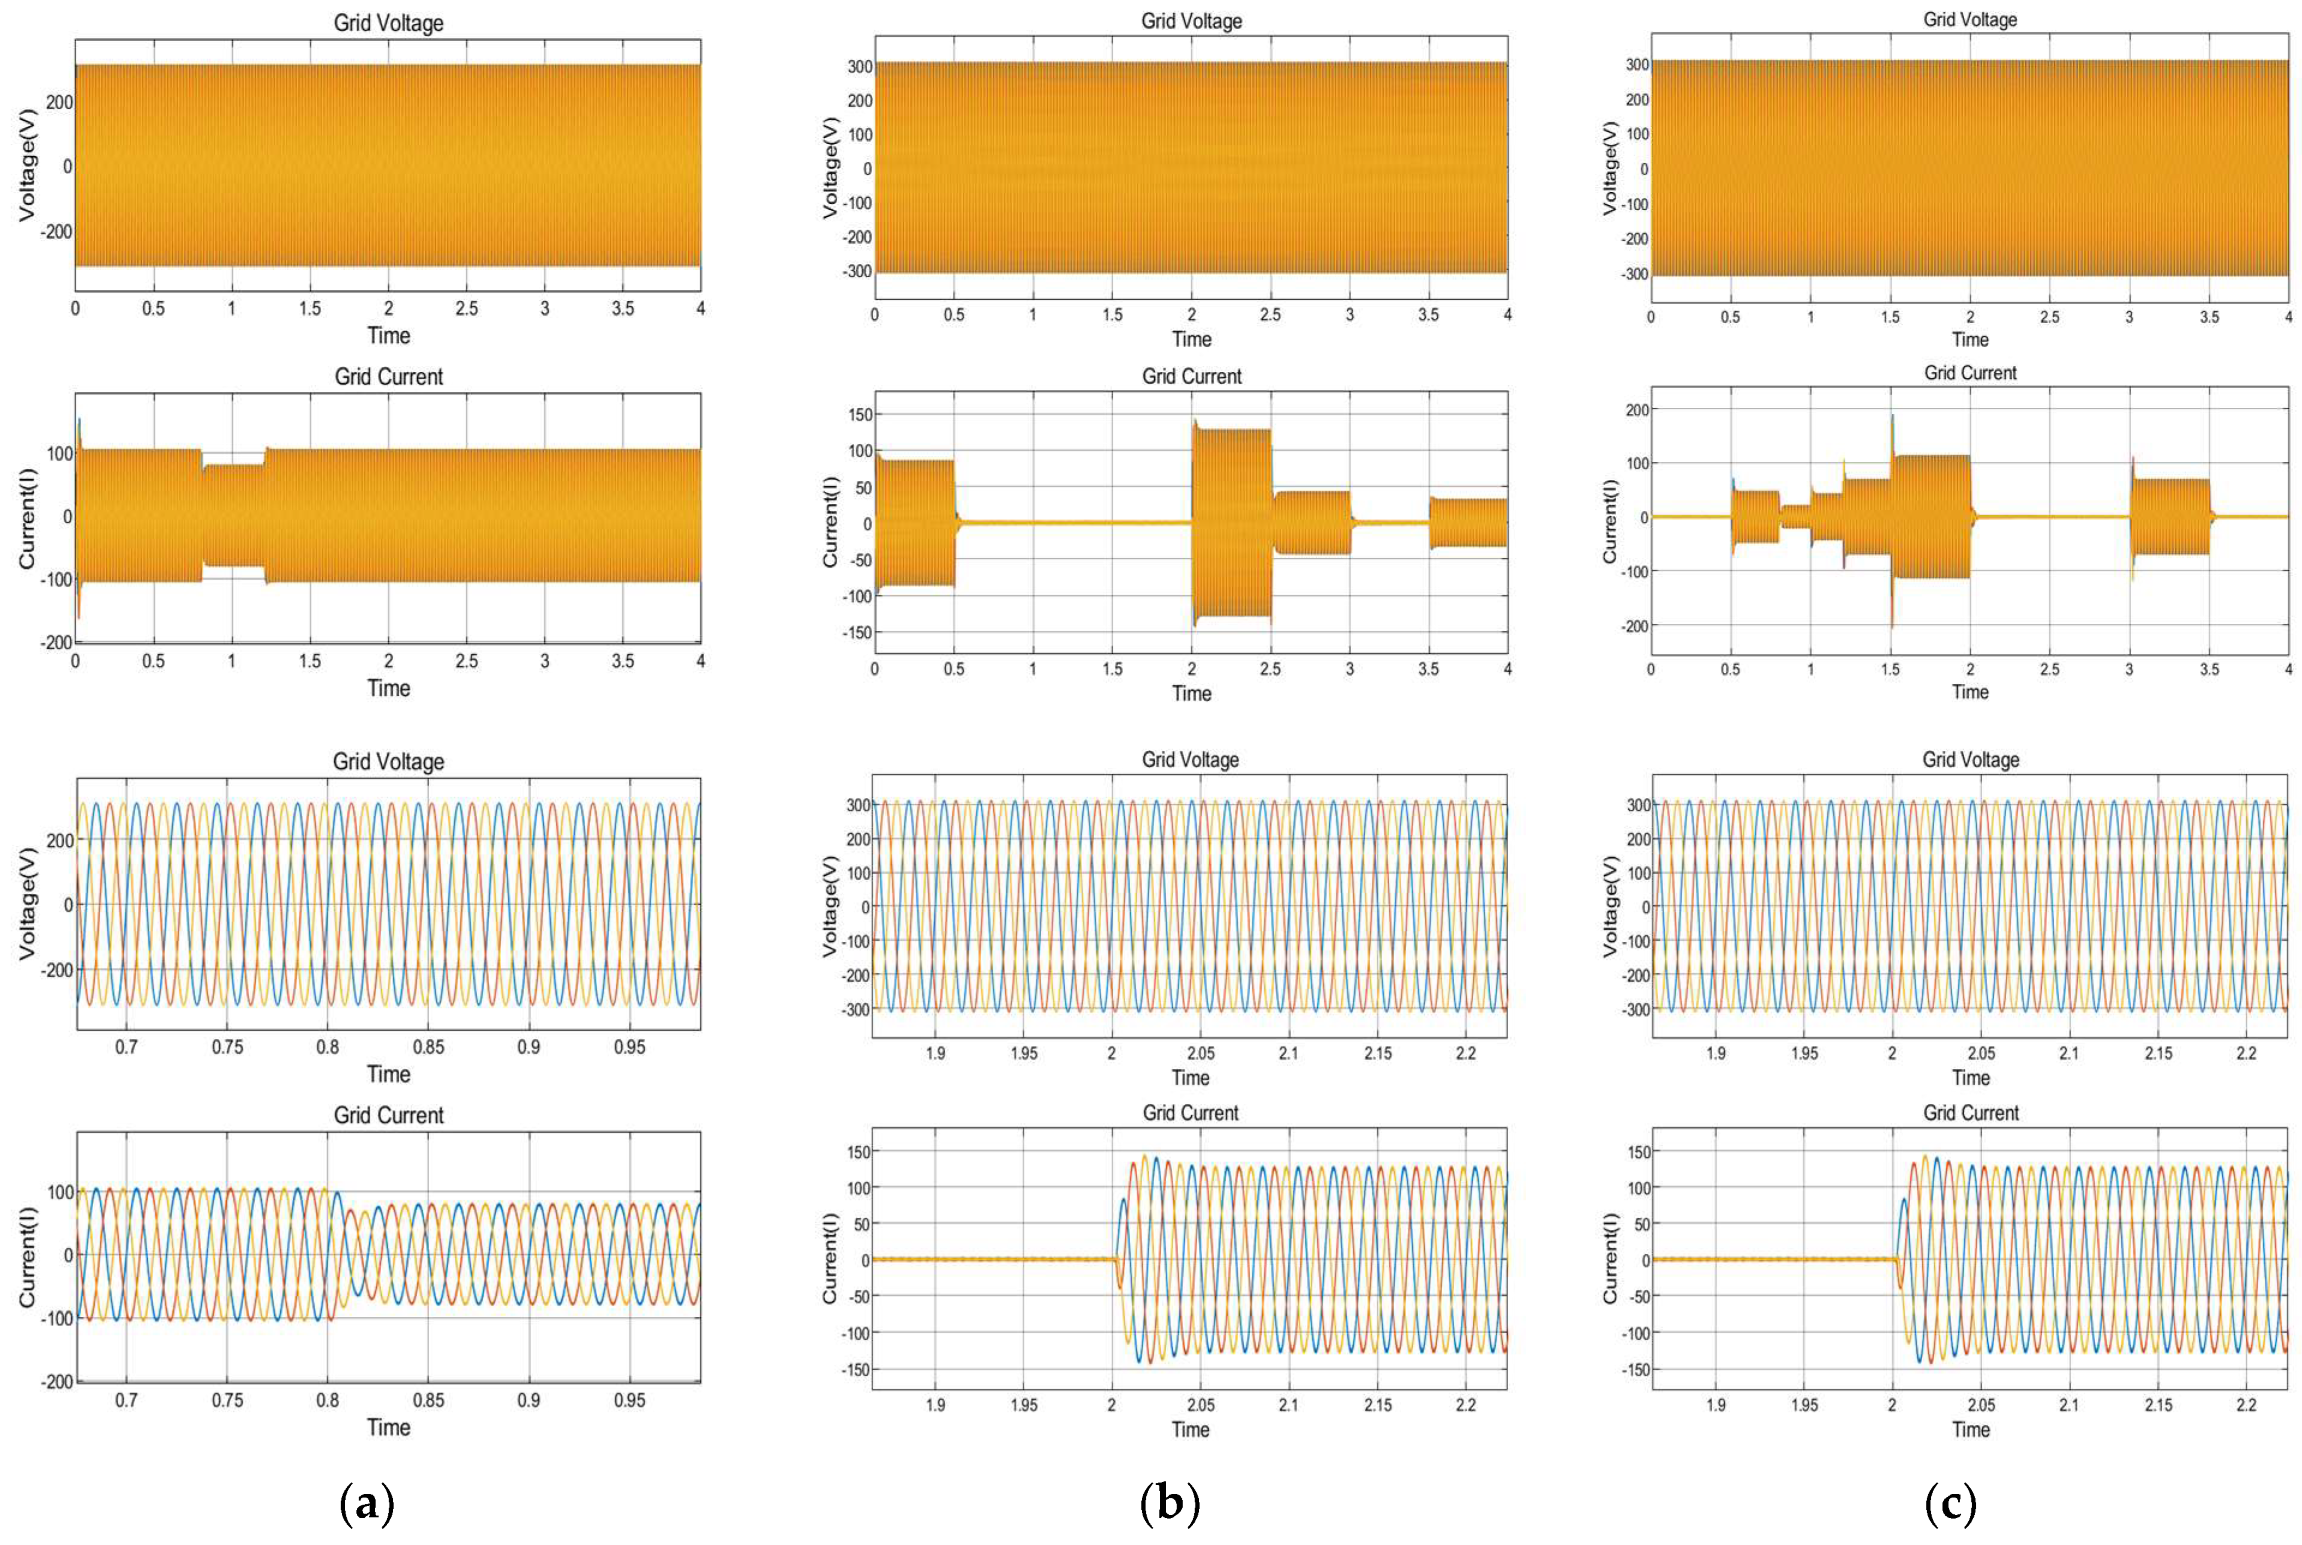
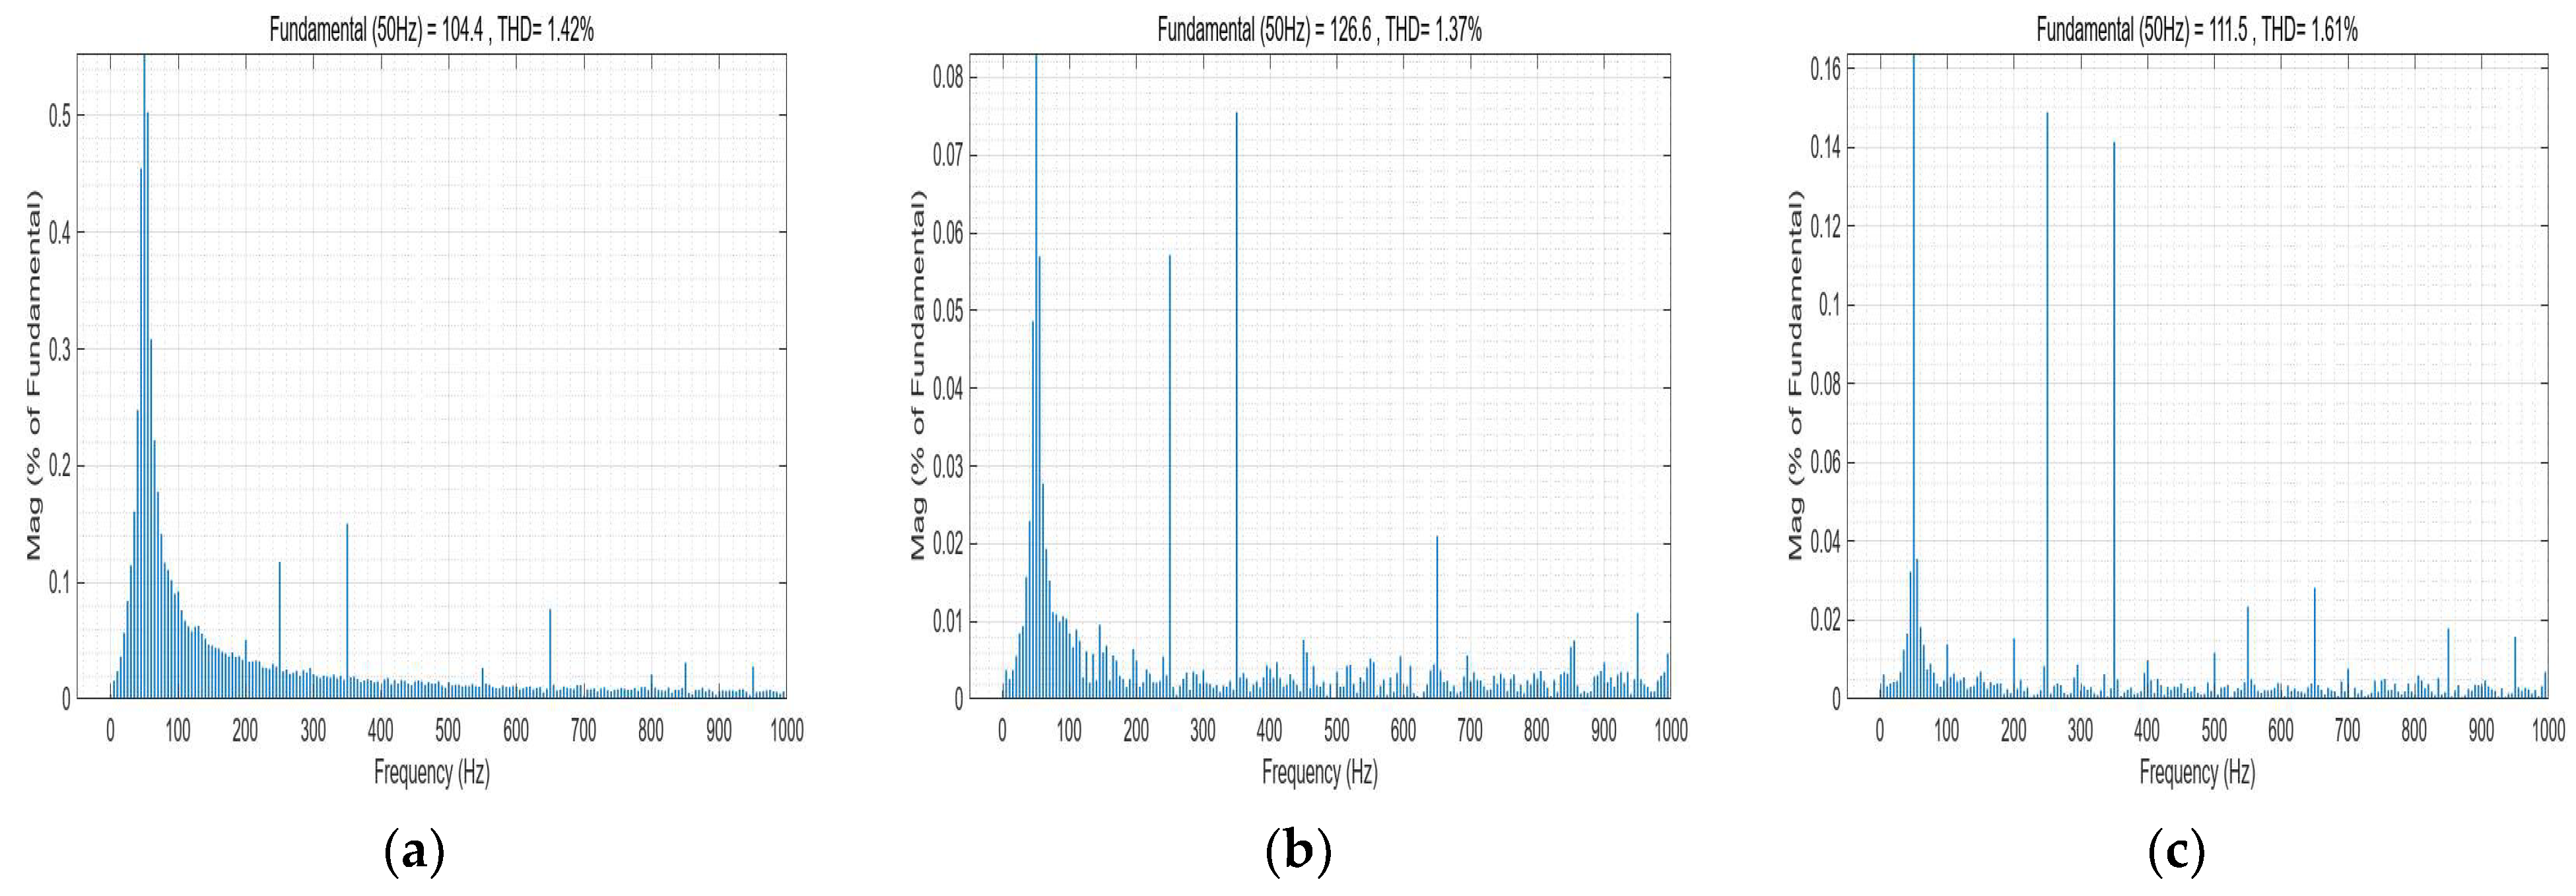
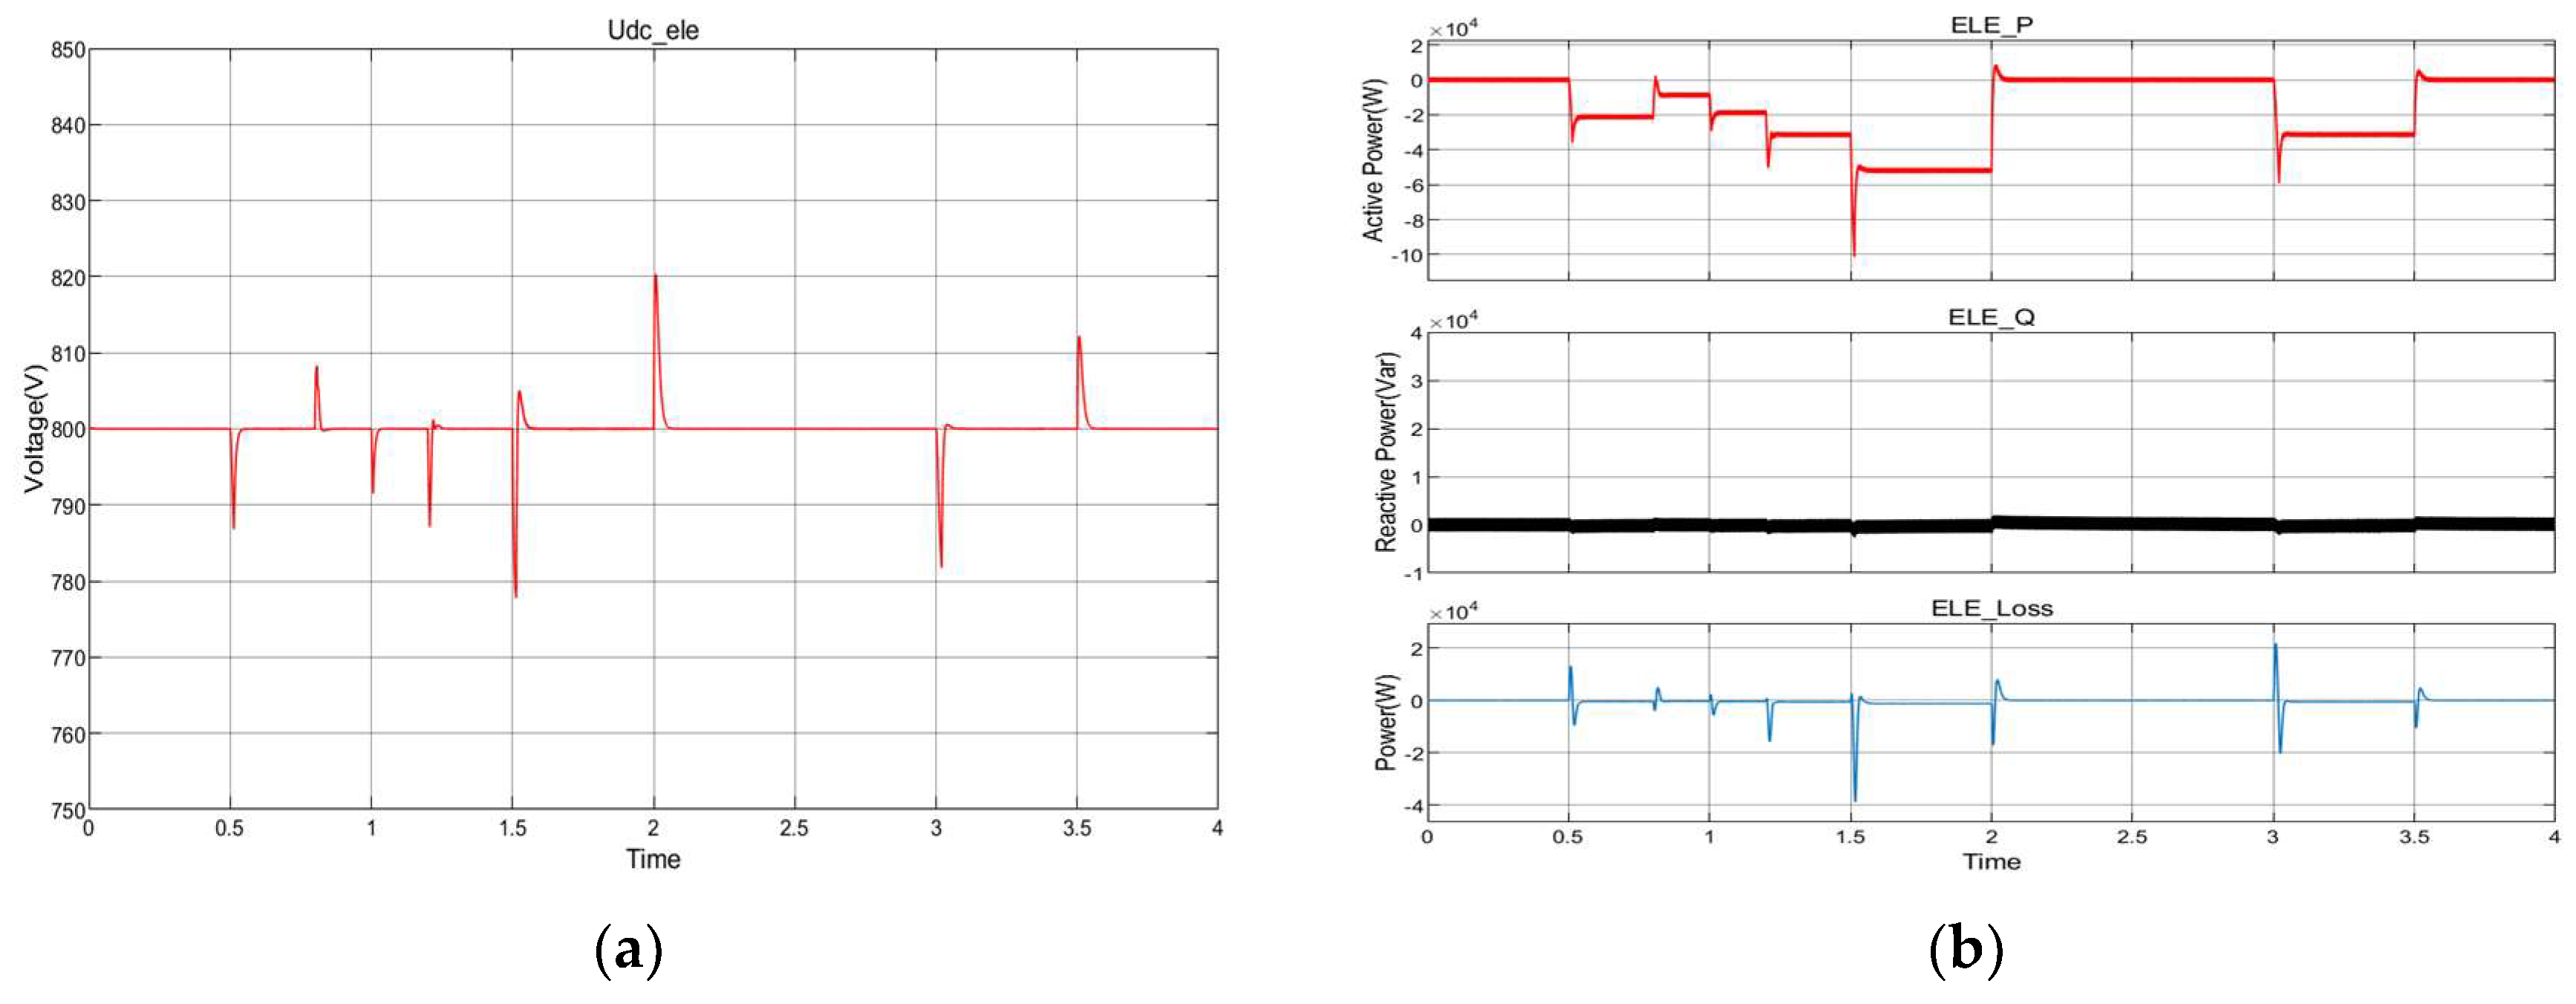
8.5. Dynamic Response Characteristics of the Power Electronic Converter

The dynamic response characteristics of the photovoltaic module inverter are shown in Figure 19. Since the outer ring of the inverter was controlled by the DC bus, the set value was 800 V. The reactive power was controlled by q-axis current, and the set value was 0 Var. The figure illustrates that the actual DC bus voltage of the photovoltaic module was effectively maintained at the set value of approximately 800 V. In the dynamic change of t = 0 s, t = 0.8 s, and t = 1 s, there was a short fluctuation. The start-up fluctuation was about 30 V, and the basic fluctuation value was maintained at 10 V. The active power output curve was kept consistent by the photovoltaic power generation curve, and the reactive power was maintained at the set value of 0 Var. The Power losses of the photovoltaic module inverter were maintained at 1100 W, indicating relatively low losses.
The dynamic response characteristics of the fuel cell inverter are illustrated in Figure 20, and its control strategy is consistent with that of the photovoltaic module inverter. The active power output curve of the fuel cell inverter conformed to the reference value of the fuel cell power. Reactive power was maintained at 0 Var. The actual DC bus voltage of the fuel cell module was maintained at the set value of 800 V, and the dynamic fluctuation value was maintained at about ±20 V. The fluctuation is large at t = 0 s, t = 2 s, and t = 2.5 s. The power losses of the fuel cell inverter were maintained at around 1000 W, which was similar to the power losses of the photovoltaic inverter.
The dynamic response characteristics of the electrolytic hydrogen rectifier are shown in Figure 21, and its control strategy was similar to the inverter control strategy. According to the figure, the active power of electrolytic hydrogen production was negative because it absorbed the surplus power from the power grid. The active power curve of the rectification output of electrolytic hydrogen production conformed to the reference value of electrolytic hydrogen production power, and the reactive power was maintained at 0 Var. The actual DC bus bar of the electrolytic hydrogen production module was maintained at the set value of 800 V, and the dynamic fluctuation value was maintained at about ± 20 V. The fluctuation was large at t = 1.5 s, t = 2 s, and t = 3 s. The power losses of the electrolytic hydrogen rectifier were maintained at around 1200 W, indicating relatively low losses.
The three-phase voltage and current diagram of the photovoltaic module, fuel cell module, and electrolytic hydrogen production module are shown in Figure 22. Because the converters use grid converters, the phase voltage of each module was 311 V, which was consistent with the phase voltage of the power grid.
As shown in Figure 22, in the initial stage of simulation and the mutation process, the grid-connected current output amplitude of the fuel cell, electrolytic cell, and photovoltaic cell all fluctuated because the DC output voltage did not meet the voltage level requirements of the rear inverter in the dynamic. When the system reached a steady state, the inverter output amplitude was a stable sine wave grid current and grid-connected voltage. Because the electrolytic pool absorbed power from the system to produce hydrogen, the grid current was opposite to the voltage phase.
With the fast Fourier transform (FFT) in Simulink, the harmonic distortion (THD) of the grid-connected current can be obtained. As shown in the Figure 23, the grid-connected THD of the photovoltaic module was 1.42%, the THD of the fuel cell module was 1.37%, and the THD of the electrolytic cell hydrogen production module was 1.61%, both of which met less than 5% and met the grid-connected standard.

9. Conclusions

In this paper, for the multi-energy complementary and cooperative control characteristics of the hydrogen-electricity coupling system, the conversion mechanism and coupling relationship between light energy, hydrogen energy, electric energy, and other forms of energy were analyzed in depth. Further, a hydrogen-electricity coupling digital simulation experimental system, including photovoltaic power generation, fuel cell, and electrolysis hydrogen system, was established, At the same time, taking into account the operational objectives of efficient energy utilization, power fluctuation suppression and grid dispatching control, eight simulation scenarios were designed. Corresponding to cooperative control strategies for the hydrogen-electric coupling system was proposed, and simulation verification was carried out based on the MATLAB/SIMULINK platform. This study showed that the hydrogen energy system, based on fuel cells and electrolytic hydrogen production, had flexible, efficient, and fast energy conversion and regulation characteristics, which met the demand for the flexible regulation of the power system under different scenarios, such as abundant power supply and insufficient power supply. Further, it had good support for the safe and economic operation of the power system under the access of a high proportion of intermittent new energy power generation. The cooperative control model and strategy of the hydrogen-electricity coupling system under different time scales, such as emergency control, primary frequency regulation, AGC control, etc., will be further studied in order to enrich the application functions and scenarios of hydrogen-electricity coupling system and give full play to the energy storage and regulation characteristics of hydrogen energy.

Author Contributions

Conceptualization, T.S., and J.S.; methodology, T.S.; software, J.S.; validation, Z.C., and H.Z.; formal analysis, J.S.; data curation, H.Z.; writing—original draft preparation, J.S.; writing—review and editing, T.S.; project administration, T.S.; funding acquisition, T.S. All authors have read and agreed to the published version of the manuscript.

Funding

This research is funded by the major project of the National Natural Science Foundation of China (Grant No. 62192753).

Data Availability Statement

Data are contained within the article.

Conflicts of Interest

The authors declare no conflict of interest.

References

  1. Nicoletti, G.; Arcuri, N.; Nicoletti, G.; Bruno, R. A Technical and Environmental Comparison between Hydrogen and Some Fossil Fuels. Energy Convers. Manag. 2015, 89, 205–213. [Google Scholar] [CrossRef]
  2. Hossain, M.B.; Islam, M.R.; Muttaqi, K.M.; Sutanto, D.; Agalgaonkar, A.P. Advancement of Fuel Cells and Electrolyzers Technologies and Their Applications to Renewable-Rich Power Grids. J. Energy Storage 2023, 62, 106842. [Google Scholar] [CrossRef]
  3. Chi, J.; Yu, H. Water Electrolysis Based on Renewable Energy for Hydrogen Production. Chin. J. Catal. 2018, 39, 390–394. [Google Scholar] [CrossRef]
  4. Amatoul, F.Z.; Er-raki, M. Modeling and Simulation of Electrical Generation Systems Based on PEM Fuel Cell-Boost Converter Using a Closed Loop PI Controller. Energy Rep. 2023, 9, 296–308. [Google Scholar] [CrossRef]
  5. Sun, L.; Jin, Y.; Pan, L.; Shen, J.; Lee, K.Y. Efficiency Analysis and Control of a Grid-Connected PEM Fuel Cell in Distributed Generation. Energy Convers. Manag. 2019, 195, 587–596. [Google Scholar] [CrossRef]
  6. Rasekh, N.; Hosseinpour, M. LCL Filter Design and Robust Converter Side Current Feedback Control for Grid-Connected Proton Exchange Membrane Fuel Cell System. Int. J. Hydrogen Energy 2020, 45, 13055–13067. [Google Scholar] [CrossRef]
  7. Xue, F.; Su, J.; Li, P.; Zhang, Y. Application of Proton Exchange Membrane Electrolysis of Water Hydrogen Production Technology in Power Plant. IOP Conf. Ser. Earth Environ. Sci. 2021, 631, 012079. [Google Scholar] [CrossRef]
  8. Acar, C.; Dincer, I. Review and Evaluation of Hydrogen Production Options for Better Environment. J. Clean. Prod. 2019, 218, 835–849. [Google Scholar] [CrossRef]
  9. Nguyen, T.; Abdin, Z.; Holm, T.; Mérida, W. Grid-Connected Hydrogen Production via Large-Scale Water Electrolysis. Energy Convers. Manag. 2019, 200, 112108. [Google Scholar] [CrossRef]
  10. Ismail, T.M.; Ramzy, K.; Elnaghi, B.E.; Abelwhab, M.N.; El-Salam, M.A. Using MATLAB to Model and Simulate a Photovoltaic System to Produce Hydrogen. Energy Convers. Manag. 2019, 185, 101–129. [Google Scholar] [CrossRef]
  11. Gaamouche, R.; Abbou, A.; Redouane, A.; Hasnaoui, A.E.; Belhorma, B. Modeling and Simulation of Direct Coupling of an Electrolyzer to PV System for Hydrogen Production. In Proceedings of the 2018 6th International Renewable and Sustainable Energy Conference (IRSEC), Rabat, Morocco, 5–8 December 2018; IEEE: Rabat, Morocco, 2018; pp. 1–5. [Google Scholar]
  12. Kuo, J.-K.; Wang, C.-F. An Integrated Simulation Model for PEM Fuel Cell Power Systems with a Buck DC–DC Converter. Int. J. Hydrogen Energy 2011, 36, 11846–11855. [Google Scholar] [CrossRef]
  13. İnci, M. Active/Reactive Energy Control Scheme for Grid-Connected Fuel Cell System with Local Inductive Loads. Energy 2020, 197, 117191. [Google Scholar] [CrossRef]
  14. Bizon, N.; Lopez-Guede, J.M.; Kurt, E.; Thounthong, P.; Mazare, A.G.; Ionescu, L.M.; Iana, G. Hydrogen Economy of the Fuel Cell Hybrid Power System Optimized by Air Flow Control to Mitigate the Effect of the Uncertainty about Available Renewable Power and Load Dynamics. Energy Convers. Manag. 2019, 179, 152–165. [Google Scholar] [CrossRef]
  15. Njoya, S.M.; Tremblay, O.; Dessaint, L.-A. A Generic Fuel Cell Model for the Simulation of Fuel Cell Vehicles. In Proceedings of the 2009 IEEE Vehicle Power and Propulsion Conference, Dearborn, MI, USA, 7–11 September 2009; IEEE: Dearborn, MI, USA, 2009; pp. 1722–1729. [Google Scholar]
  16. Chen, W.; Han, Y.; Li, Q.; Liu, Z.; Peng, F. Design of Proton Exchange Membrane Fuel Cell Grid-Connected System Based on Resonant Current Controller. Int. J. Hydrogen Energy 2014, 39, 14402–14410. [Google Scholar] [CrossRef]
  17. Ganiyu, S.O.; Martínez-Huitle, C.A.; Rodrigo, M.A. Renewable Energies Driven Electrochemical Wastewater/Soil Decontamination Technologies: A Critical Review of Fundamental Concepts and Applications. Appl. Catal. B Environ. 2020, 270, 118857. [Google Scholar] [CrossRef]
  18. Kou, Q.; Klein, S.A.; Beckman, W.A. A Method for Estimating the Long-Term Performance of Direct-Coupled PV Pumping Systems. Sol. Energy 1998, 64, 33–40. [Google Scholar] [CrossRef]
  19. Bensmail, S.; Rekioua, D.; Azzi, H. Study of Hybrid Photovoltaic/Fuel Cell System for Stand-Alone Applications. Int. J. Hydrogen Energy 2015, 40, 13820–13826. [Google Scholar] [CrossRef]
  20. Folgado, F.J.; González, I.; Calderón, A.J. Simulation Platform for the Assessment of PEM Electrolyzer Models Oriented to Implement Digital Replicas. Energy Convers. Manag. 2022, 267, 115917. [Google Scholar] [CrossRef]
  21. Koponen, J.; Ruuskanen, V.; Kosonen, A.; Niemela, M.; Ahola, J. Effect of Converter Topology on the Specific Energy Consumption of Alkaline Water Electrolyzers. IEEE Trans. Power Electron. 2019, 34, 6171–6182. [Google Scholar] [CrossRef]
  22. Milewski, J.; Guandalini, G.; Campanari, S. Modeling an Alkaline Electrolysis Cell through Reduced-Order and Loss-Estimate Approaches. J. Power Sources 2014, 269, 203–211. [Google Scholar] [CrossRef]
  23. Ursúa, A.; San Martín, I.; Barrios, E.L.; Sanchis, P. Stand-Alone Operation of an Alkaline Water Electrolyser Fed by Wind and Photovoltaic Systems. Int. J. Hydrogen Energy 2013, 38, 14952–14967. [Google Scholar] [CrossRef]
  24. Campos Da Paixão, I.; Cardozo, J.C.; Sales Monteiro, M.K.; Gondim, A.D.; Cavalcanti, L.N.; Fabiano De Santana Souza, D.; Martínez-Huitle, C.A.; Vieira Dos Santos, E. A Sustainable Solar-Driven Electrochemical Process for Reforming Lignocellulosic Biomass Effluent into High Value-Added Products: Green Hydrogen, Carboxylic and Vanillic Acids. RSC Adv. 2023, 13, 35755–35765. [Google Scholar] [CrossRef]
  25. Amores, E.; Rodríguez, J.; Carreras, C. Influence of Operation Parameters in the Modeling of Alkaline Water Electrolyzers for Hydrogen Production. Int. J. Hydrogen Energy 2014, 39, 13063–13078. [Google Scholar] [CrossRef]
  26. Aboukalam Da Cruz, M.H.A.; Etancelin, M.; Marias, F.; Reneaume, J.-M.; Sochard-Reneaume, S.; Serra, S. Dynamic Modelling of an Alkaline Water Electrolysis System and Optimization of Its Operating Parameters for Hydrogen Production. Int. J. Hydrogen Energy 2023, 48, 12982–12999. [Google Scholar] [CrossRef]
  27. Tijani, A.S.; Yusup, N.A.B.; Rahim, A.H.A. Mathematical Modelling and Simulation Analysis of Advanced Alkaline Electrolyzer System for Hydrogen Production. Procedia Technol. 2014, 15, 798–806. [Google Scholar] [CrossRef]
  28. Panahandeh, B.; Bard, J.; Outzourhit, A.; Zejli, D. Simulation of PV–Wind-Hybrid Systems Combined with Hydrogen Storage for Rural Electrification. Int. J. Hydrogen Energy 2011, 36, 4185–4197. [Google Scholar] [CrossRef]
  29. Saravanan, S.; Ramesh Babu, N. Maximum Power Point Tracking Algorithms for Photovoltaic System—A Review. Renew. Sustain. Energy Rev. 2016, 57, 192–204. [Google Scholar] [CrossRef]
  30. Valdez-Resendiz, J.E.; Sanchez, V.M.; Rosas-Caro, J.C.; Mayo-Maldonado, J.C.; Sierra, J.M.; Barbosa, R. Continuous Input-Current Buck-Boost DC-DC Converter for PEM Fuel Cell Applications. Int. J. Hydrogen Energy 2017, 42, 30389–30399. [Google Scholar] [CrossRef]
  31. Guilbert, D.; Collura, S.M.; Scipioni, A. DC/DC Converter Topologies for Electrolyzers: State-of-the-Art and Remaining Key Issues. Int. J. Hydrogen Energy 2017, 42, 23966–23985. [Google Scholar] [CrossRef]
  32. Armghan, H.; Yang, M.; Ali, N.; Armghan, A.; Alanazi, A. Quick Reaching Law Based Global Terminal Sliding Mode Control for Wind/Hydrogen/Battery DC Microgrid. Appl. Energy 2022, 316, 119050. [Google Scholar] [CrossRef]
  33. Ansari, S.; Chandel, A.; Tariq, M. A Comprehensive Review on Power Converters Control and Control Strategies of AC/DC Microgrid. IEEE Access 2021, 9, 17998–18015. [Google Scholar] [CrossRef]
  34. Sharma, R.K.; Mishra, S. Dynamic Power Management and Control of a PV PEM Fuel-Cell-Based Standalone Ac/Dc Microgrid Using Hybrid Energy Storage. IEEE Trans. Ind. Appl. 2018, 54, 526–538. [Google Scholar] [CrossRef]
  35. Esmaeilian, H.R.; Fadaeinedjad, R. Resolving Power Quality Issues Raised by Aerodynamic Aspects of Wind Turbine in Isolated Microgrids Using Fuel Cell/Electrolyzer System. IEEE Trans. Sustain. Energy 2016, 7, 1274–1283. [Google Scholar] [CrossRef]
Figure 1. Typical structure of hydrogen-electrode coupling system.
Processes 12 00138 g001
Figure 2. PEMFC equivalent circuit diagrams.
Processes 12 00138 g002
Figure 3. Characteristics of V-I and P-I of fuel cells.
Processes 12 00138 g003
Figure 4. Equivalent circuit diagram of a photovoltaic array.
Processes 12 00138 g004
Figure 5. (a) Boost converter topology diagram; (b) buck converter topology diagram.
Processes 12 00138 g005
Figure 6. The inverter topology diagram.
Processes 12 00138 g006
Figure 7. Hydrogen-electric coupling system experimental scenario.
Processes 12 00138 g007
Figure 8. Photovoltaic power generation MPPT control schematic diagram.
Processes 12 00138 g008
Figure 9. MPPT control flow chart based on incremental conductance method.
Processes 12 00138 g009
Figure 10. Fuel cell power generation control schematic diagram.
Processes 12 00138 g010
Figure 11. Grid-connected inverter control strategy diagram.
Processes 12 00138 g011
Figure 12. Principle diagram of power control for electrolytic hydrogen production.
Processes 12 00138 g012
Figure 13. Simulation diagram of the hydrogen-electric coupled system.
Processes 12 00138 g013
Figure 14. (a) Variation curves of grid-connected output power tracking reference value in 8 simulation scenarios; (b) Variation curves of fuel cell output power tracking reference value in 8 simulation scenarios; (c) Variation curves of electrolysis hydrogen consumption power tracking reference value in 8 simulation scenarios; and (d) Variation curves of output power in 8 simulation scenarios for each module.
Processes 12 00138 g014
Figure 15. (a) Variation curve of light irradiation intensity; (b) Variation curve of photovoltaic output.
Processes 12 00138 g015
Figure 16. (a) Comparison Chart of V-I-P Changes in Fuel Cells; (b) Fuel Consumption Chart of Fuel Cells.
Processes 12 00138 g016
Figure 17. Hydrogen production rate of the electrolyzer.
Processes 12 00138 g017
Figure 18. (a) Hydrogen production and storage capacity variation curve of electrolyzer; (b) Pressure variation curve of hydrogen storage tank.
Processes 12 00138 g018
Figure 19. (a) Dynamic voltage response characteristics of DC bus of photovoltaic module; (b) Dynamic response characteristics of photovoltaic module power.
Processes 12 00138 g019
Figure 20. (a) Dynamic voltage response characteristics of DC bus of fuel cell module; (b) Dynamic power response of fuel cell module.
Processes 12 00138 g020
Figure 21. (a) DC bus voltage dynamic response characteristics of electrolytic hydrogen production module; (b) Power dynamic response characteristics of electrolytic hydrogen production module.
Processes 12 00138 g021
Figure 22. (a) Grid-connected three-phase voltage and current diagram of the photovoltaic module; (b) Three-phase voltage and current diagram of fuel cell module; and (c) Grid-connected three-phase voltage and current diagram of hydrogen production module of the electrolytic cell.
Processes 12 00138 g022
Figure 23. (a) Grid-connected current harmonics of the photovoltaic module; (b) Grid-connected current harmonics of the fuel cell module; and (c) Grid-connected current harmonics of the hydrogen production module of the electrolytic cell.
Processes 12 00138 g023
Table 1. The specific parameters of PEMFC.
PEMFC ParametersValue
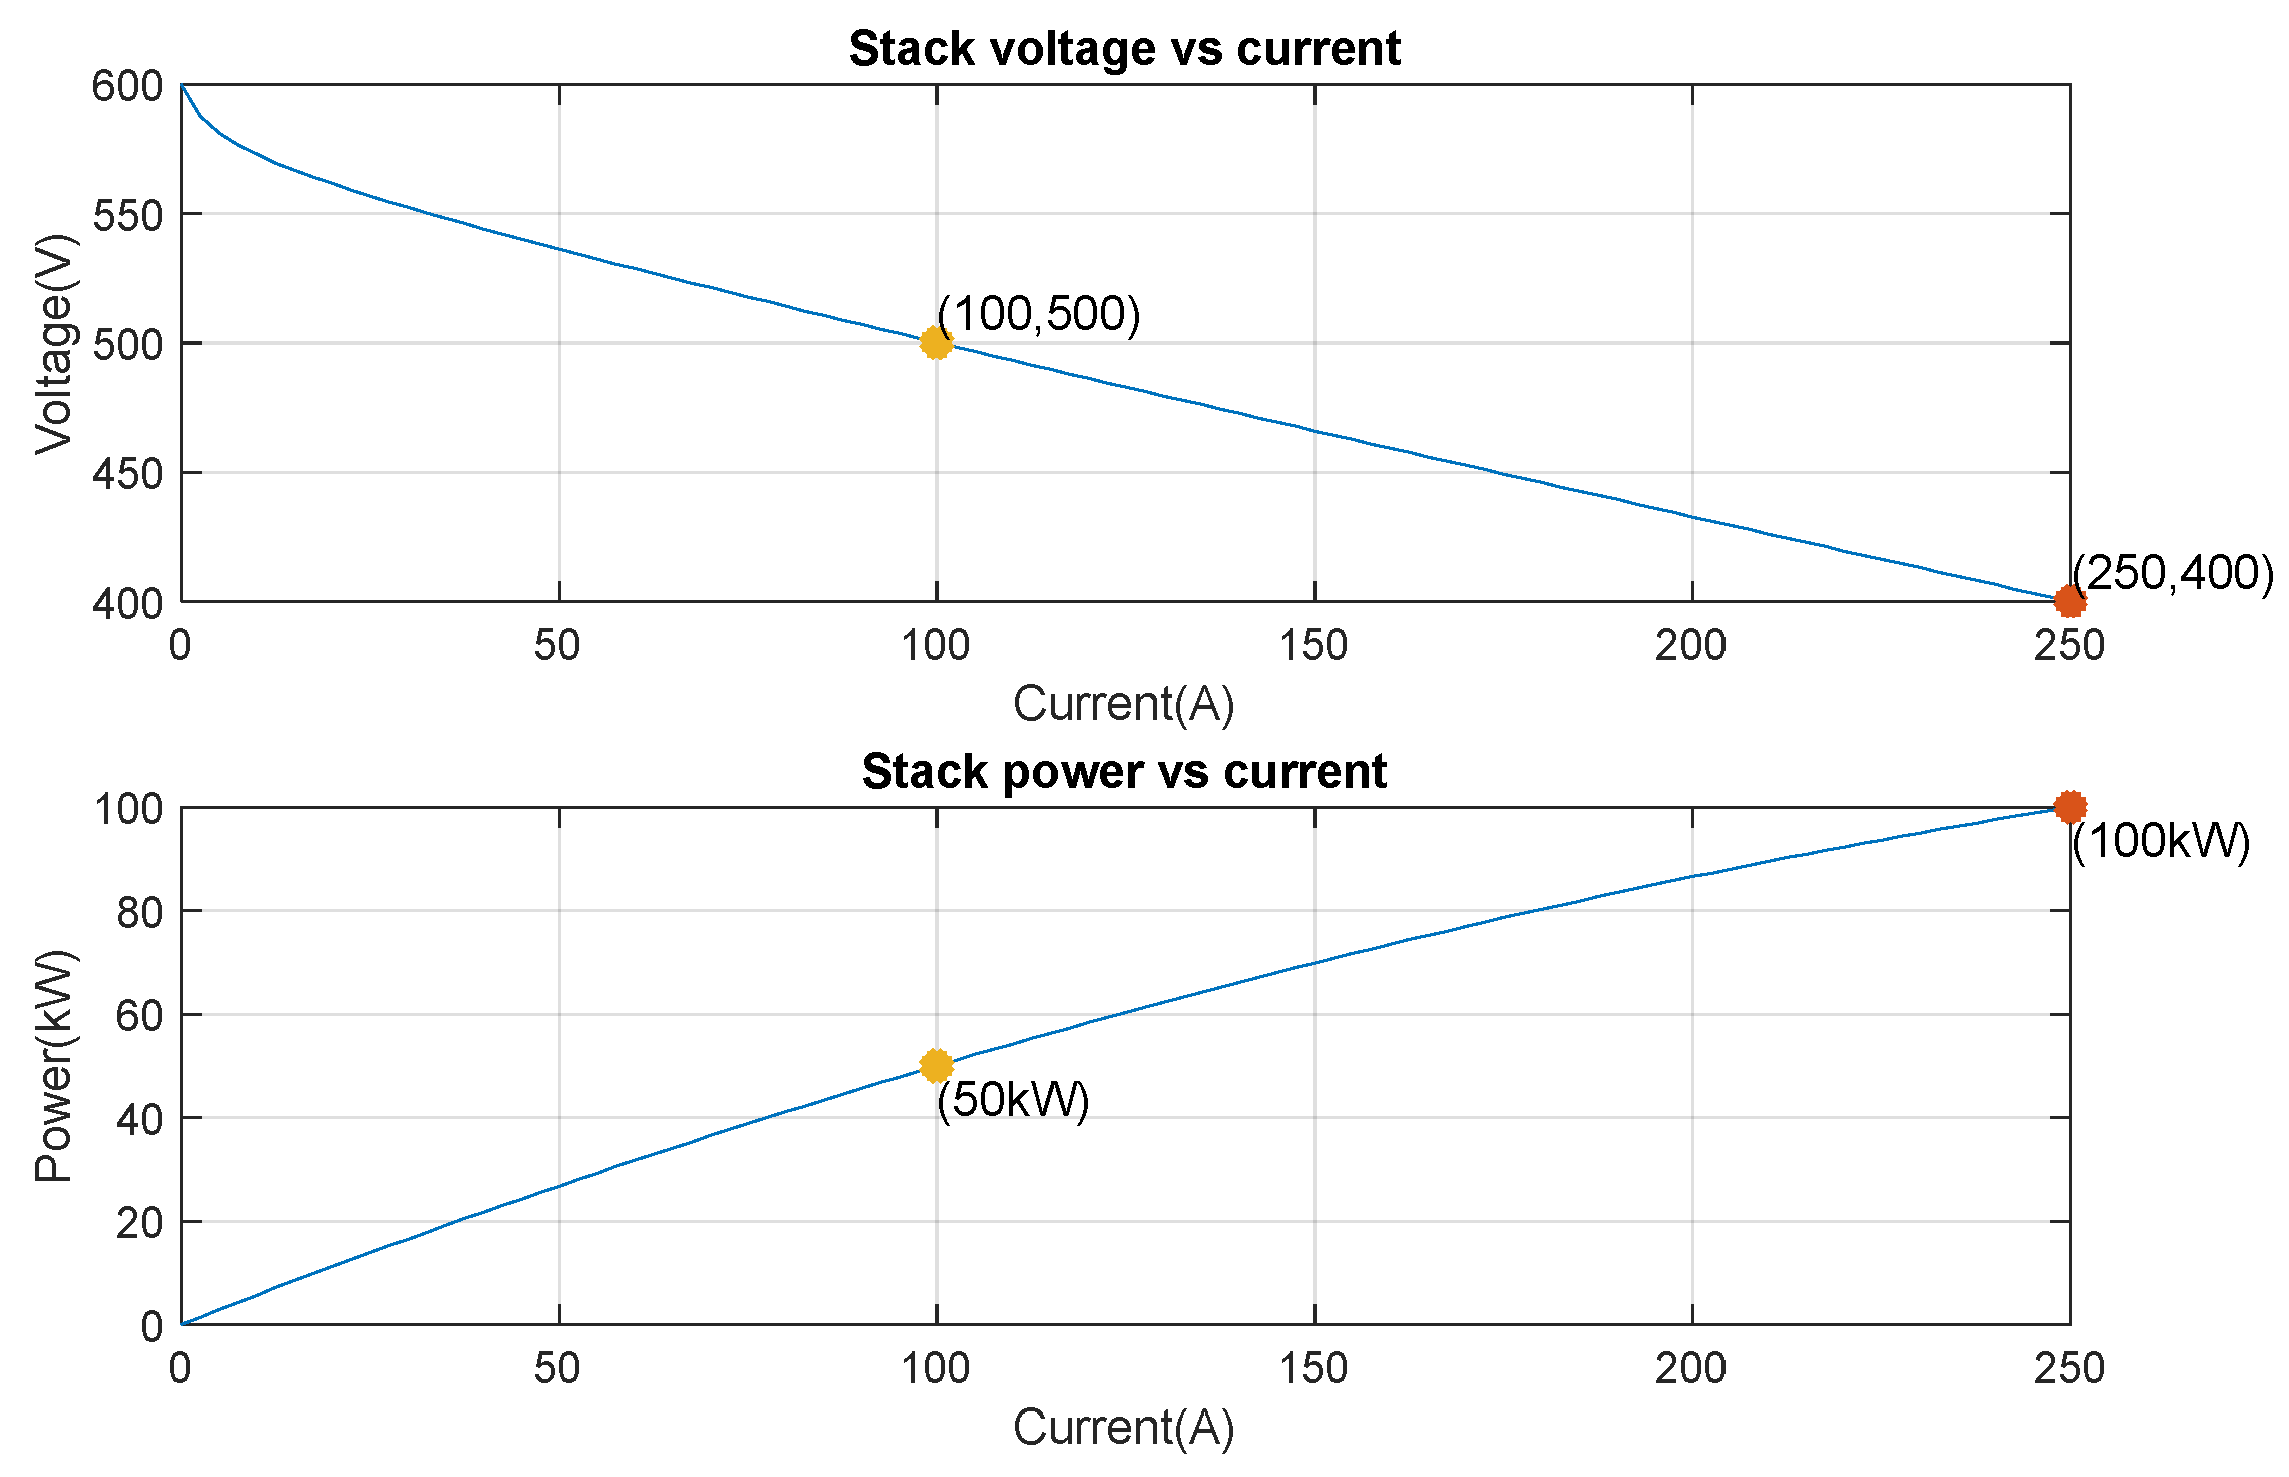
Nominal operating point [Inom (A), Vnom (V)][100, 500]
Maximum operating point [Iend (A), Vend (V)][250, 400]
Number of cells300
Nominal Power (kW)50
Maximal Power (kW)100
Exchange current (A)0.54669
Nerst voltage of one cell (V)1.2041
Fuel cell resistance (ohm)0.62238
Nominal supply pressure (Fuel (bar))1.5
Nominal supply pressure (Air (bar))1
System temperature (Kelvin)338
Capital cost ($/kW)400
Lifetime (h)50,000
Table 2. The specific parameters of the PV.
Photovoltaic ParametersValue
Parallel strings17
Series-connected modules per string14
Maximum Power (W)213.15
Cells per module60
Open circuit voltage (V)36.3
Short-circuit current (A)7.84
Voltage at maximum power point (V)29
Current at maximum power point Imp (A)7.35
Nominal temperature (°C)25
Table 3. The specific parameters of the Electrolysis tank.
Electrolysis Tank ParametersValue
Reversible Voltage (V)1.23
Area of Electrode (m2)0.1
Number of cells200
s 0.185
k T 1 2.54 × 10⁻²
k T 2 −0.158
k T 3 1.212 × 10³
r 1 8.232 × 10⁻⁵
r 2 −4.51 × 10⁻⁷
Nominal temperature (°C)35
Capital cost ($/kW)100
Lifetime (year)15
Table 4. The specific parameters of Converter.
Converter ParametersValue
Boost converter inductor (H)0.01
Boost converter capacitor (F)0.009
Buck converter inductor (H)0.1
Buck converter capacitor (F)0.001
Resistor (ohms)0.1
Filter inductor (H)0.0015
Disclaimer/Publisher’s Note: The statements, opinions and data contained in all publications are solely those of the individual author(s) and contributor(s) and not of MDPI and/or the editor(s). MDPI and/or the editor(s) disclaim responsibility for any injury to people or property resulting from any ideas, methods, instructions or products referred to in the content.

