2.2.1. Modeling Mechanism and Scientific Hypotheses
Computer coupling of phase diagrams and thermochemistry (Calphad) technology plays an essential role in the metallurgical analysis of the SAW process [
15,
16]. Firstly, during the process of SAW, all slag and molten metals are concealed beneath flux particles, thereby hindering the ability of researchers to directly analyze these components [
3]. Secondly, the temperature of the chemical reactions occurring in SAW exceeds 2000 °C, a level beyond the current capabilities of scientific detection methods [
17]. The Calphad method employs thermodynamic models to enhance the precision of predictions about material properties [
15]. As such, despite the impossibility of directly measuring thermodynamic data during the SAW process due to temperatures surpassing 2000 °C, the thermodynamic models in the Calphad technique have demonstrated their reliability in gathering thermodynamic data beyond such a temperature limit [
3]. Therefore, by integrating Calphad with specific thermodynamic models (slag-metal or gas–slag-metal equilibrium models), it becomes feasible to assess and predict the transfer behavior of elements [
15,
16].
It is well known that equilibrium is not attained in the process of SAW due to significant temperature differentials, pronounced density gradients, brief reaction intervals, and substantial electric currents [
6]. Despite such deviations from equilibrium, it is possible to employ thermodynamic principles by hypothesizing that thermodynamic equilibrium is established locally [
4]. This assumption accounts for the elevated temperatures and substantial surface-to-volume ratios, effectively mitigating the limited time for chemical reactions [
3].
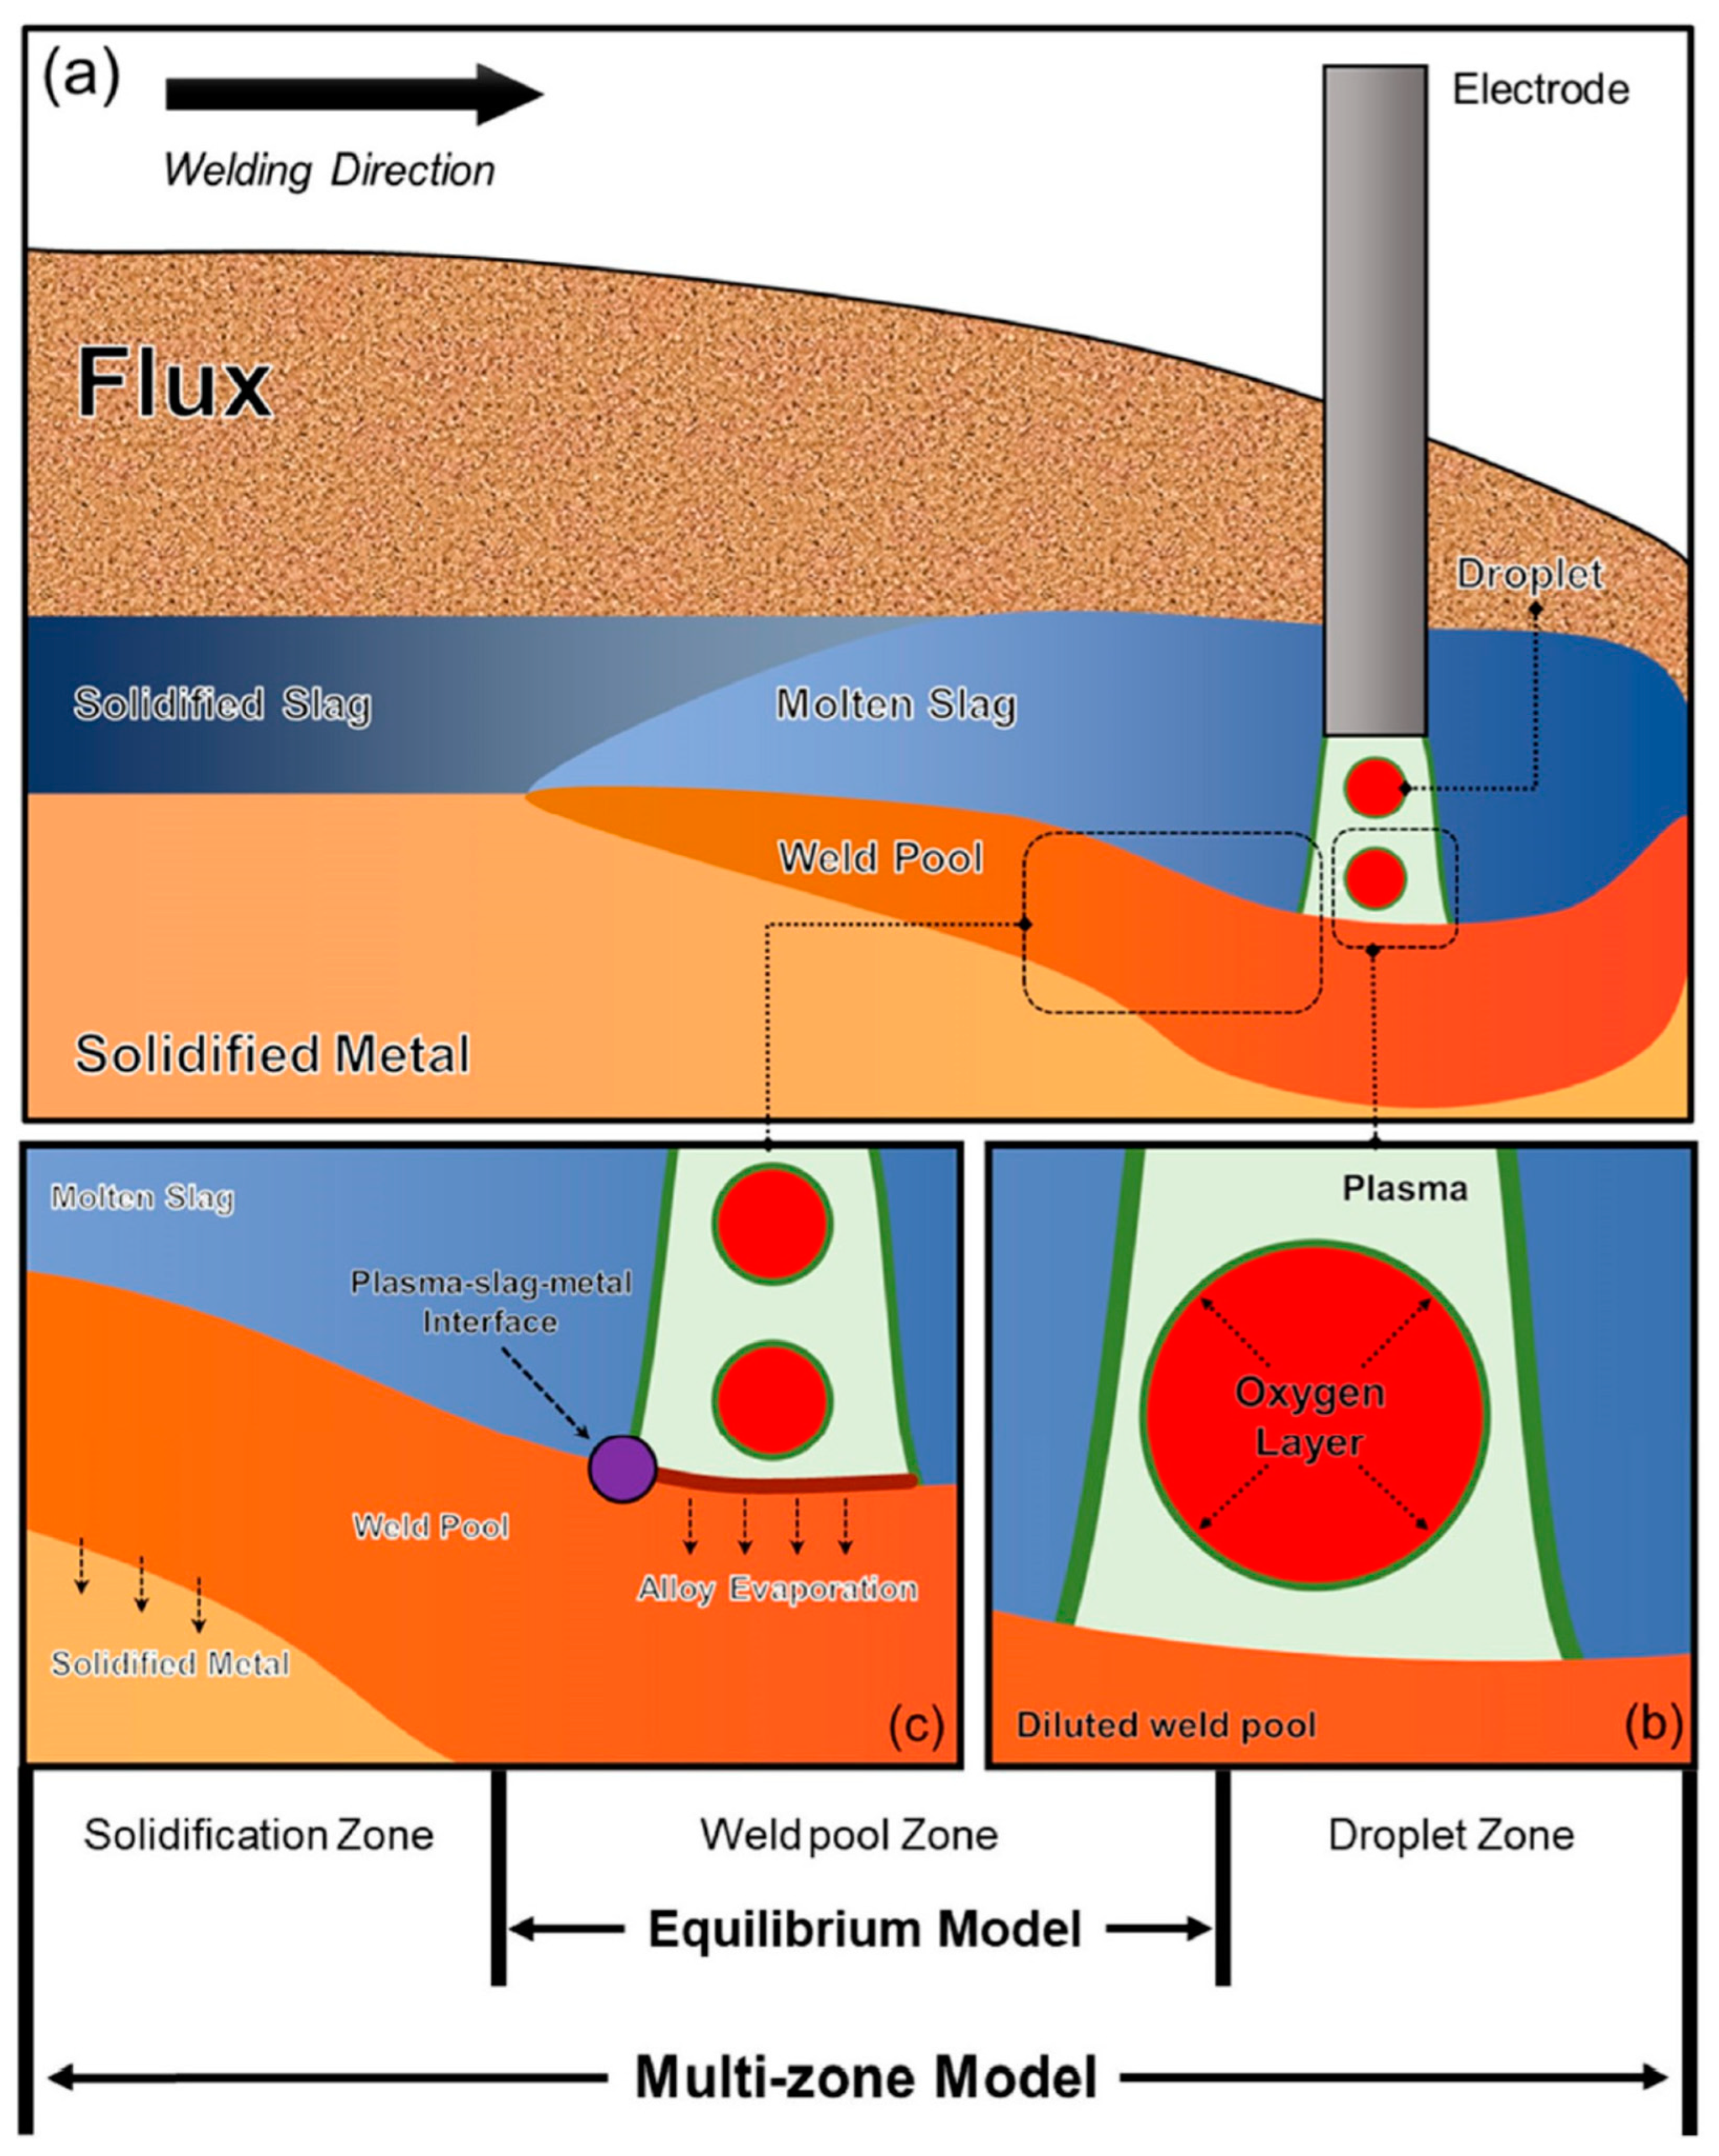
Figure 2 illustrates a schematic diagram of the SAW process and the primary chemical reaction interfaces that determine the transfer behavior of the elements of O, Si, and Mn. In the context of SAW, the process is typically divided into three fundamental zones according to the temperatures at which the chemical reactions take place [
18,
19,
20].
Within the framework of thermodynamic equilibrium models, emphasis is placed upon the chemical reactions occurring within the reaction zone of the weld pool (indicated through the purple dot in
Figure 2) [
3]. Scholars have formulated hypotheses pertaining to this interface, allowing for predictions of the transfer behaviors of elements from both the slag-metal and gas–slag-metal perspectives [
3,
18]. Nonetheless, a limitation of such an assessment approach emerges as it neglects the fact of O enrichment within the droplet reaction zone (see
Figure 2b) and the loss of alloying elements induced by the arc plasma [
1].
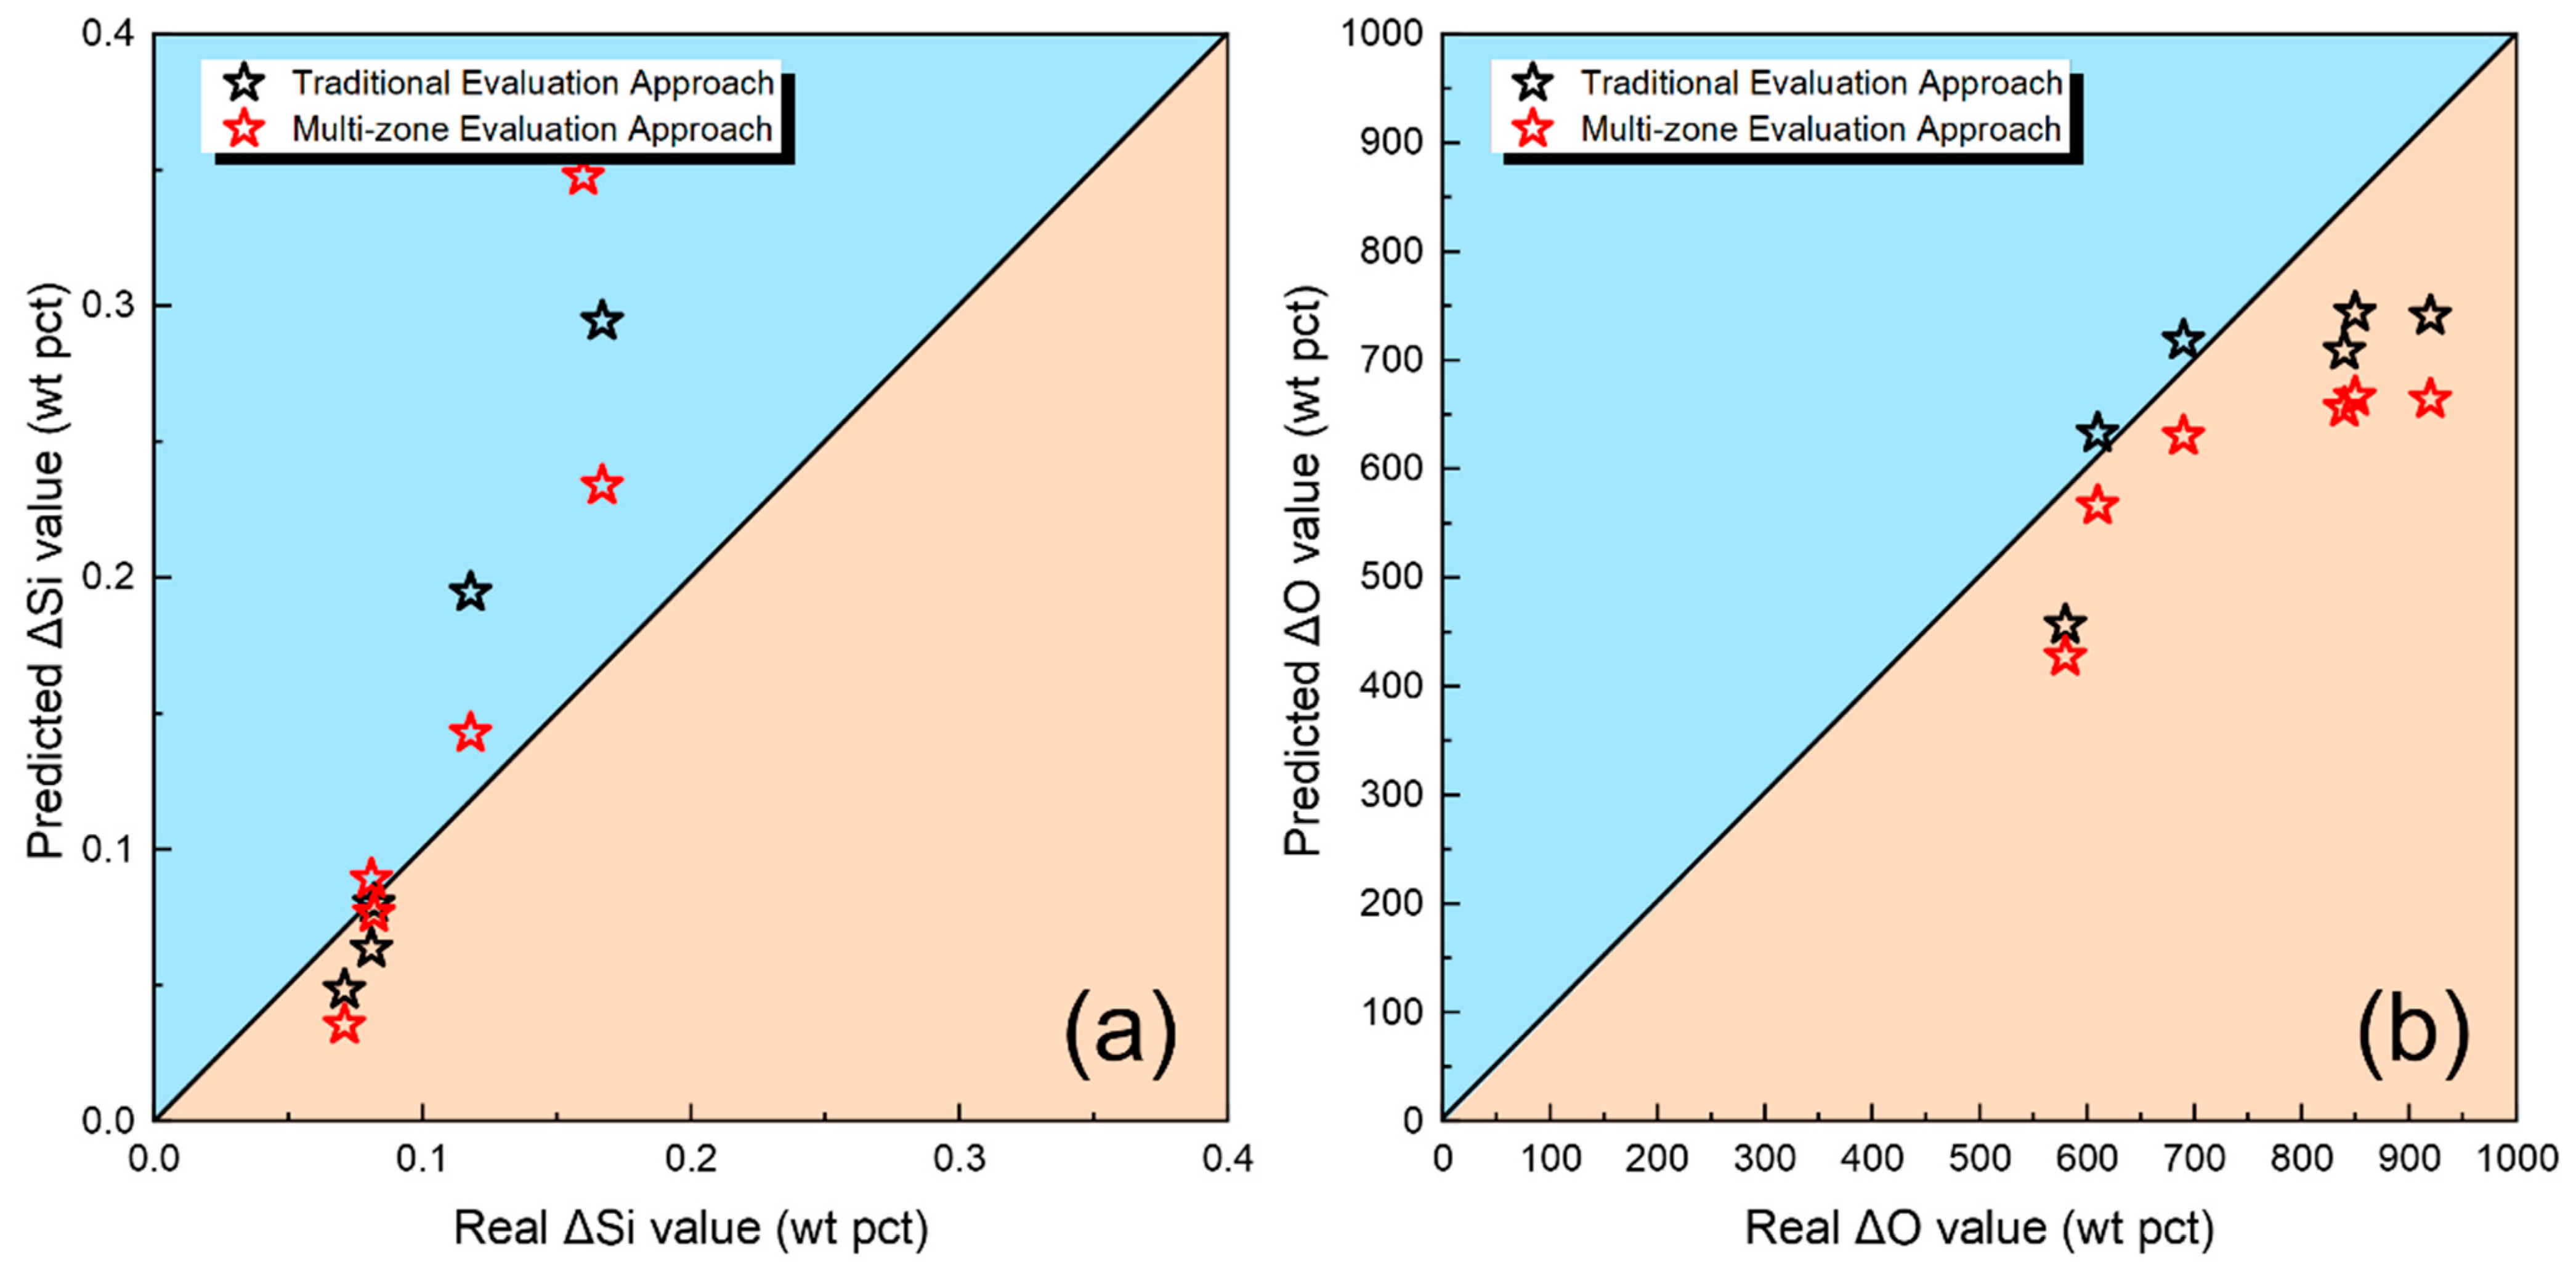
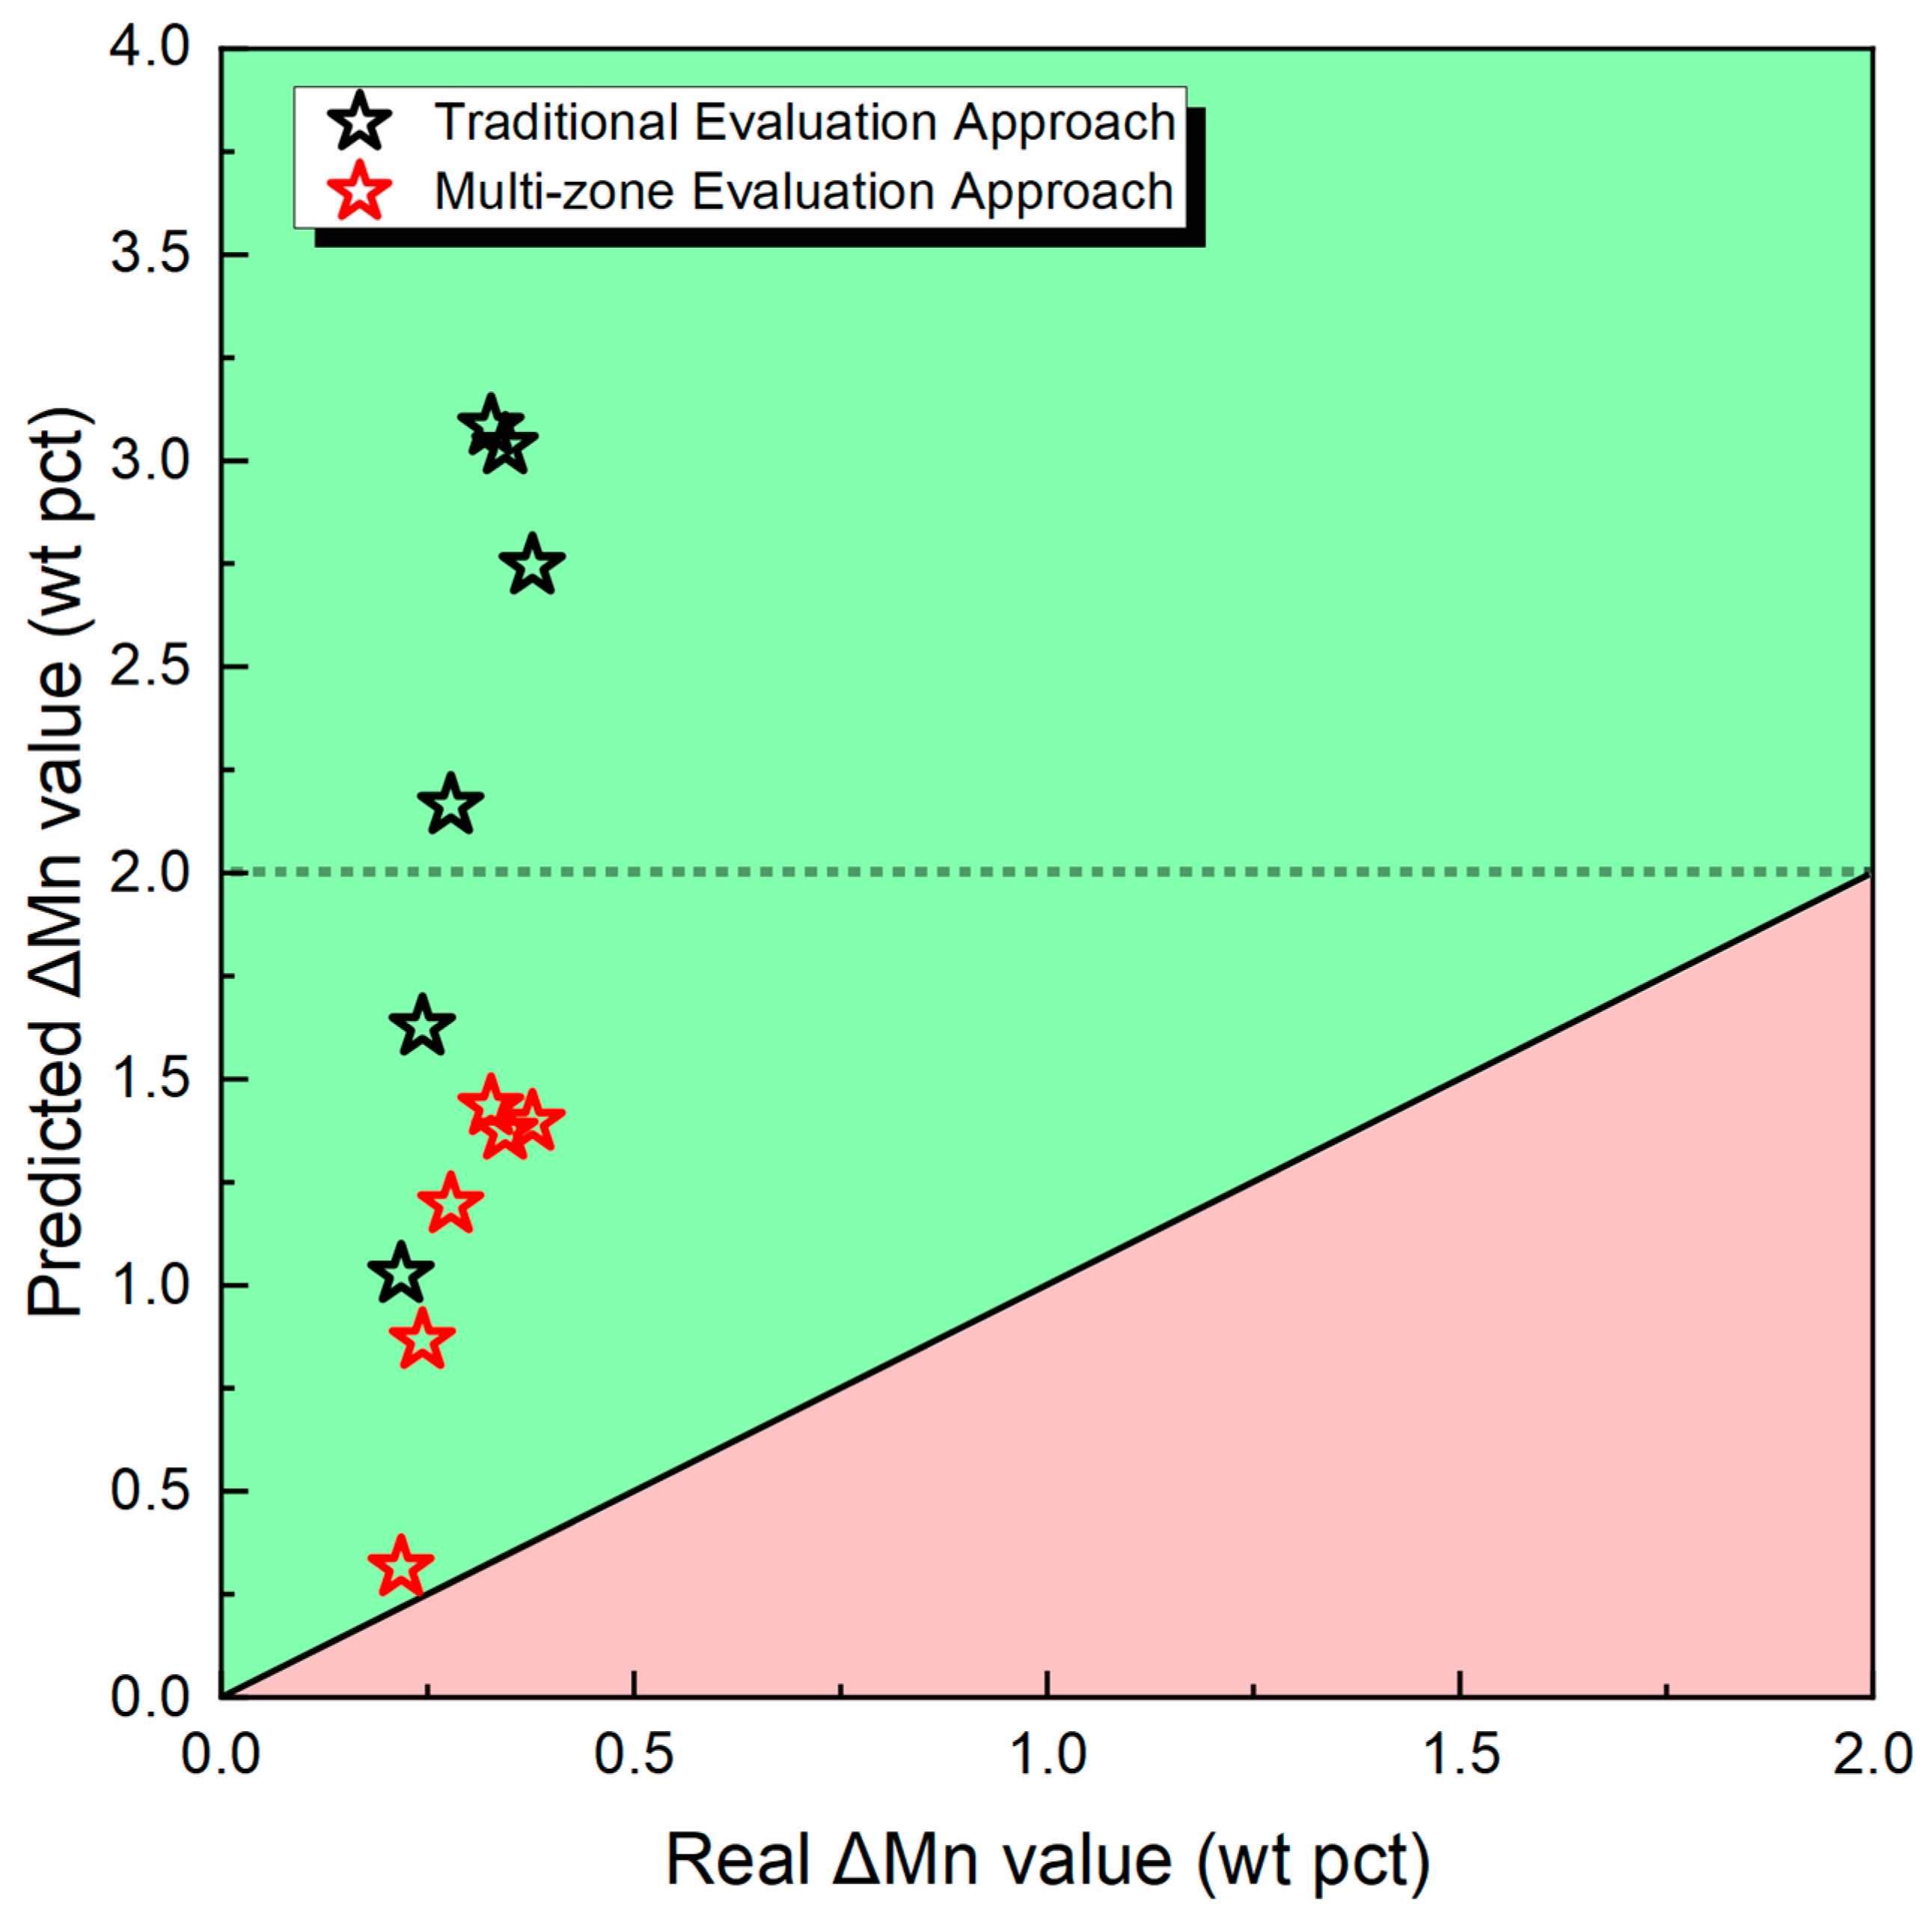
In this study, multi-zone model is employed to predict the transfer behavior of essential elements, namely O, Si, and Mn, and conduct a comparative analysis with predictions from thermodynamic equilibrium models [
20]. The scientific assumptions applied in the model as well as the employed databases are written out below.
A typical characteristic of SAW is the use of flux. During the welding process, the oxides in the flux decompose and release O
2 under the high temperature of the arc plasma, as detailed in several references [
3,
13]. The high O content forms an oxygen-rich layer on the surface of the molten droplet, hindering the redox reactions of metal elements such as Si, Mn, and Ti [
3,
18,
19,
21].
In this zone, the temperature soars to an astounding 2500 °C as the droplet separates from the electrode tip and traverses through the arc cavity [
3]. It has been postulated that the O in the droplet metal primarily originates from the O
2 generated through the decomposition of the oxide in the flux [
13,
22]. Preliminary experiments have revealed that there is an insignificant transfer of alloy elements within this zone [
12,
13]. Mitra et al. [
18,
19,
21] have suggested that a dynamic O layer forms at the metal–plasma interface, effectively blocking the alloy elements from reaching the interface, as illustrated in
Figure 2b.
When molten droplets become diluted through the molten pool, chemical reactions ensue at the gas–slag-metal interface, giving rise to elemental transitions [
6]. It is noted that the previously mentioned thermodynamic equilibrium model is primarily designed to model this specific zone [
3]. However, thermodynamic equilibrium models do not account for the substantial increase in O level within the droplet reaction zone [
3].
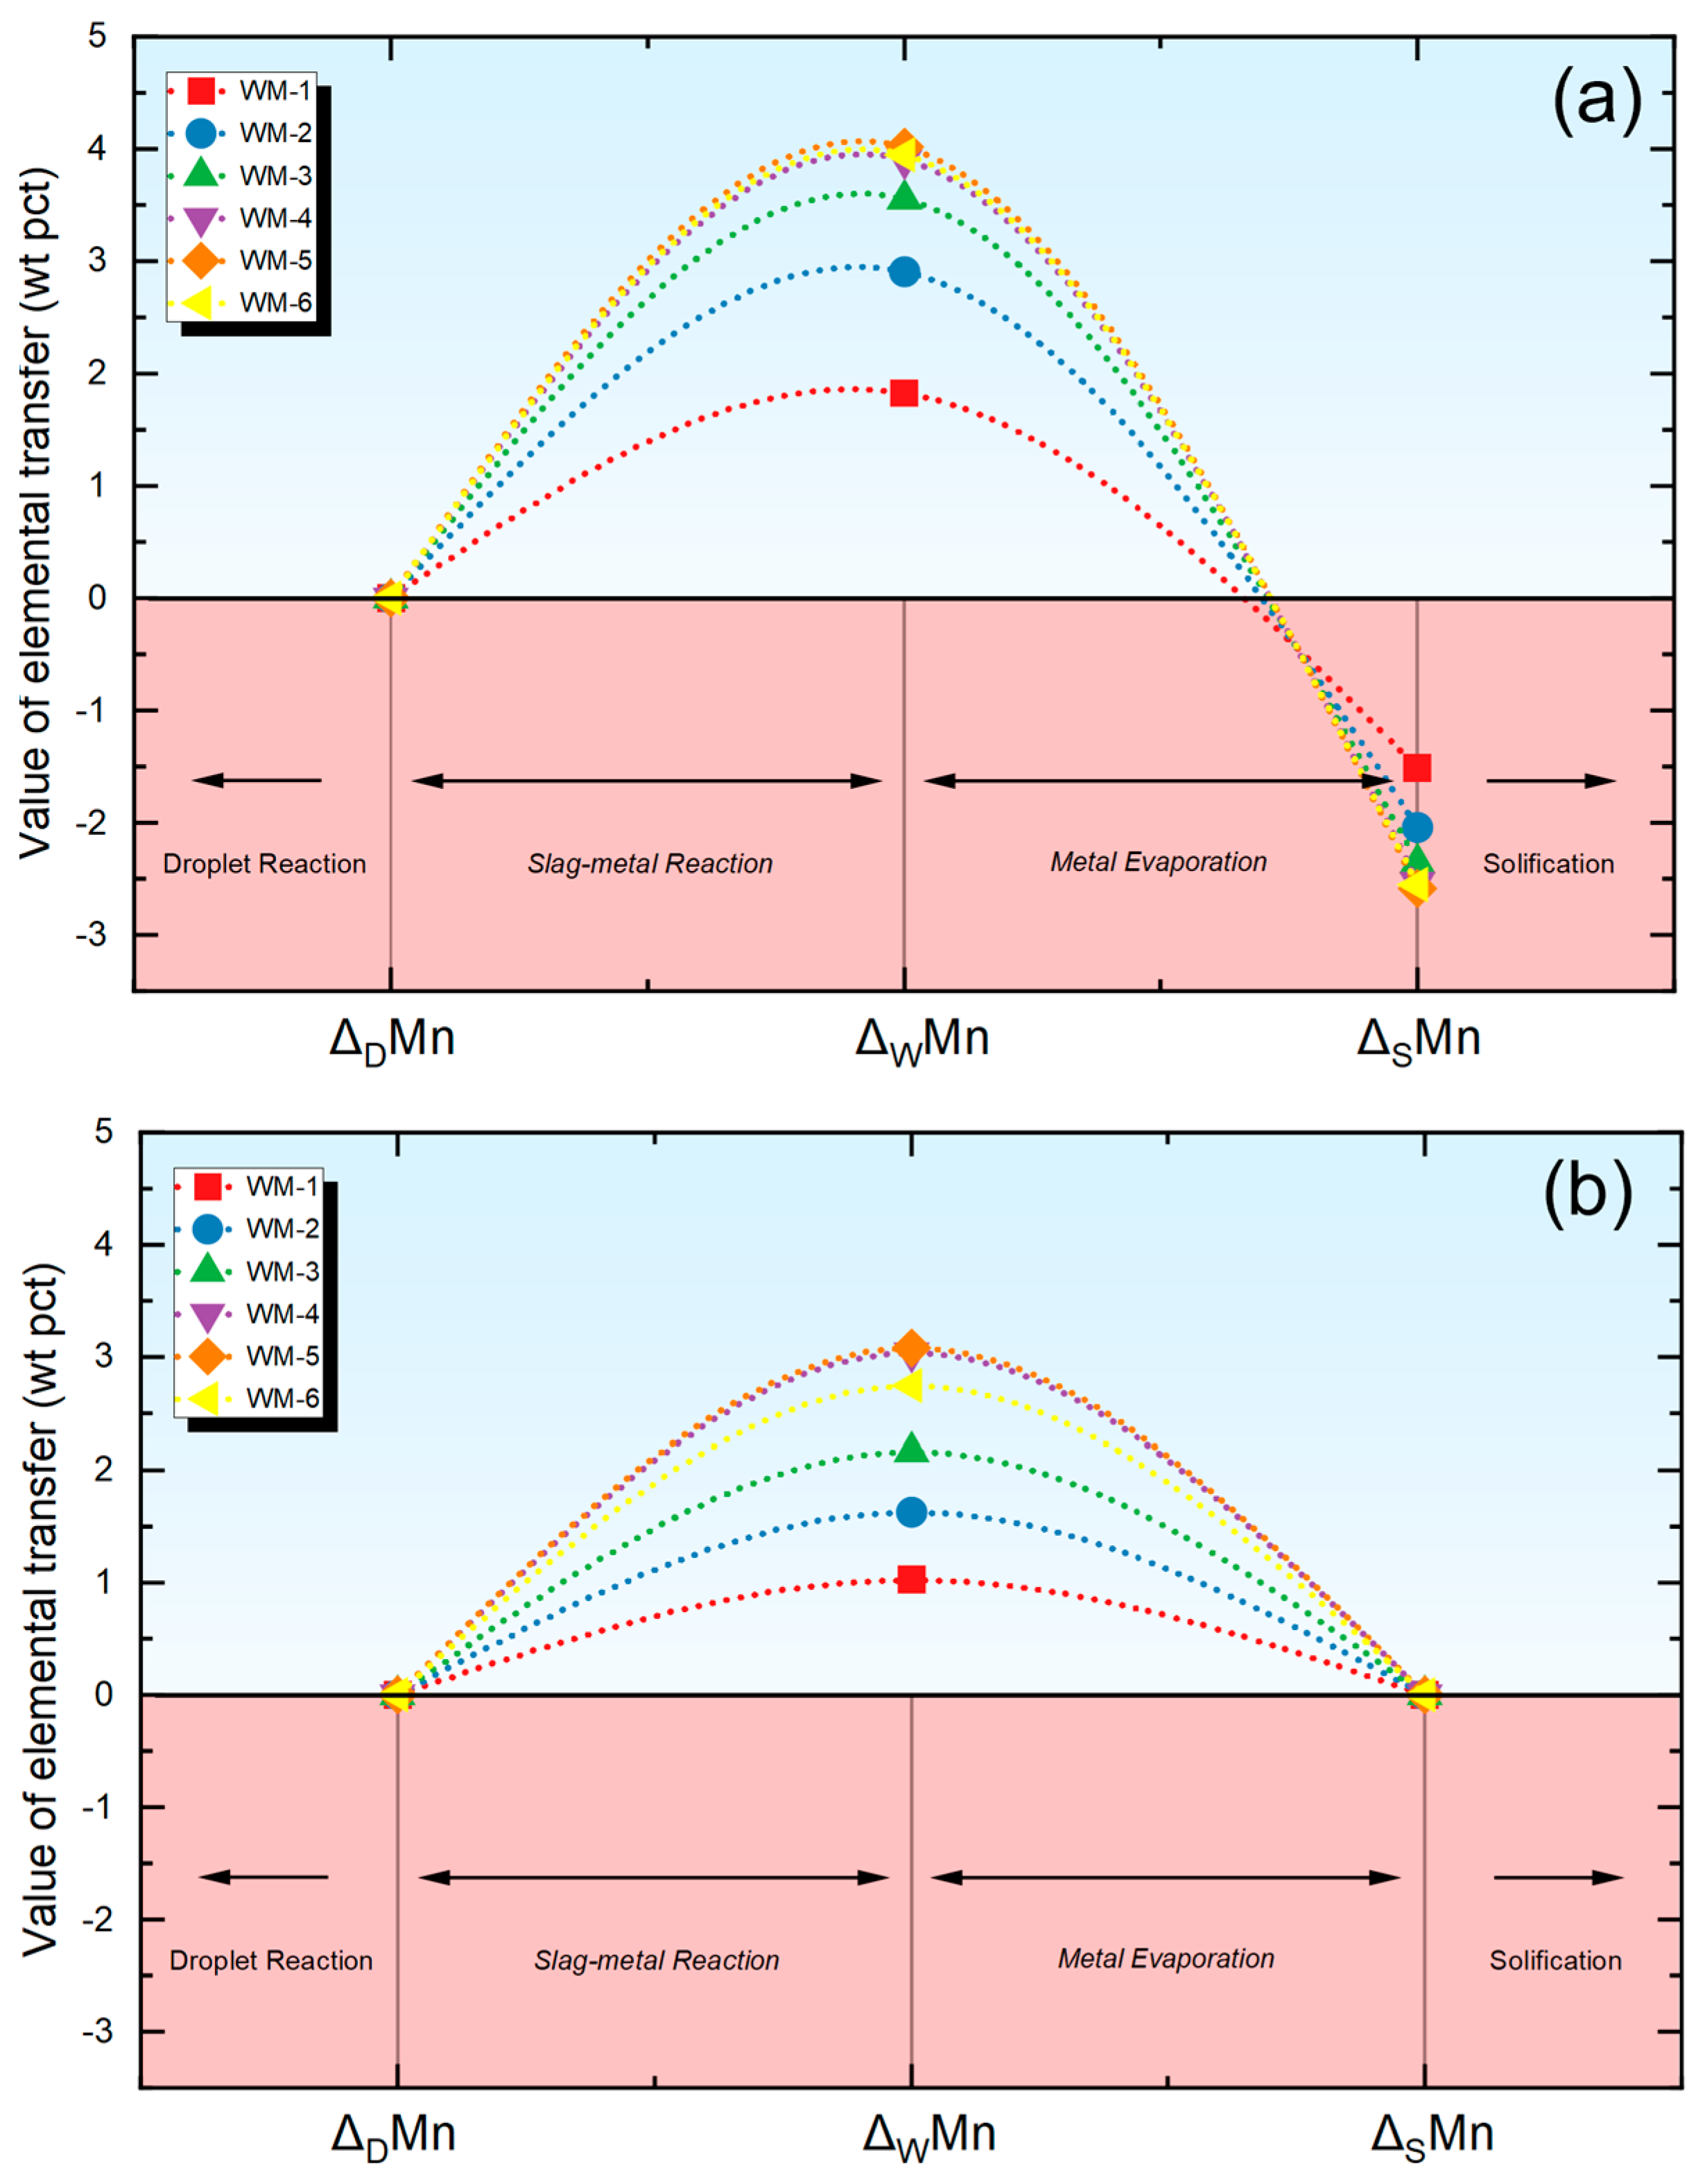
Furthermore, extensive research has highlighted significant losses of alloy elements during arc welding, particularly of Mn and Si [
1]. In this work, the recently developed Zhu’s model is utilized to estimate the evaporation of Mn and Si during the arc welding process as previous studies have validated the model’s efficacy in predicting the evaporation of Mn and Si in arc welding processes [
20,
23].
It is worth noting that during the solidification process following the weld pool reaction zone, there is a small reduction in element content at the slag–metal interface attributed to the adsorption of the oxides into the slag [
24]. As this study predominantly explores the bulk composition of the metal, the reduction of element at the slag–metal interface is not considered [
18,
19,
21].
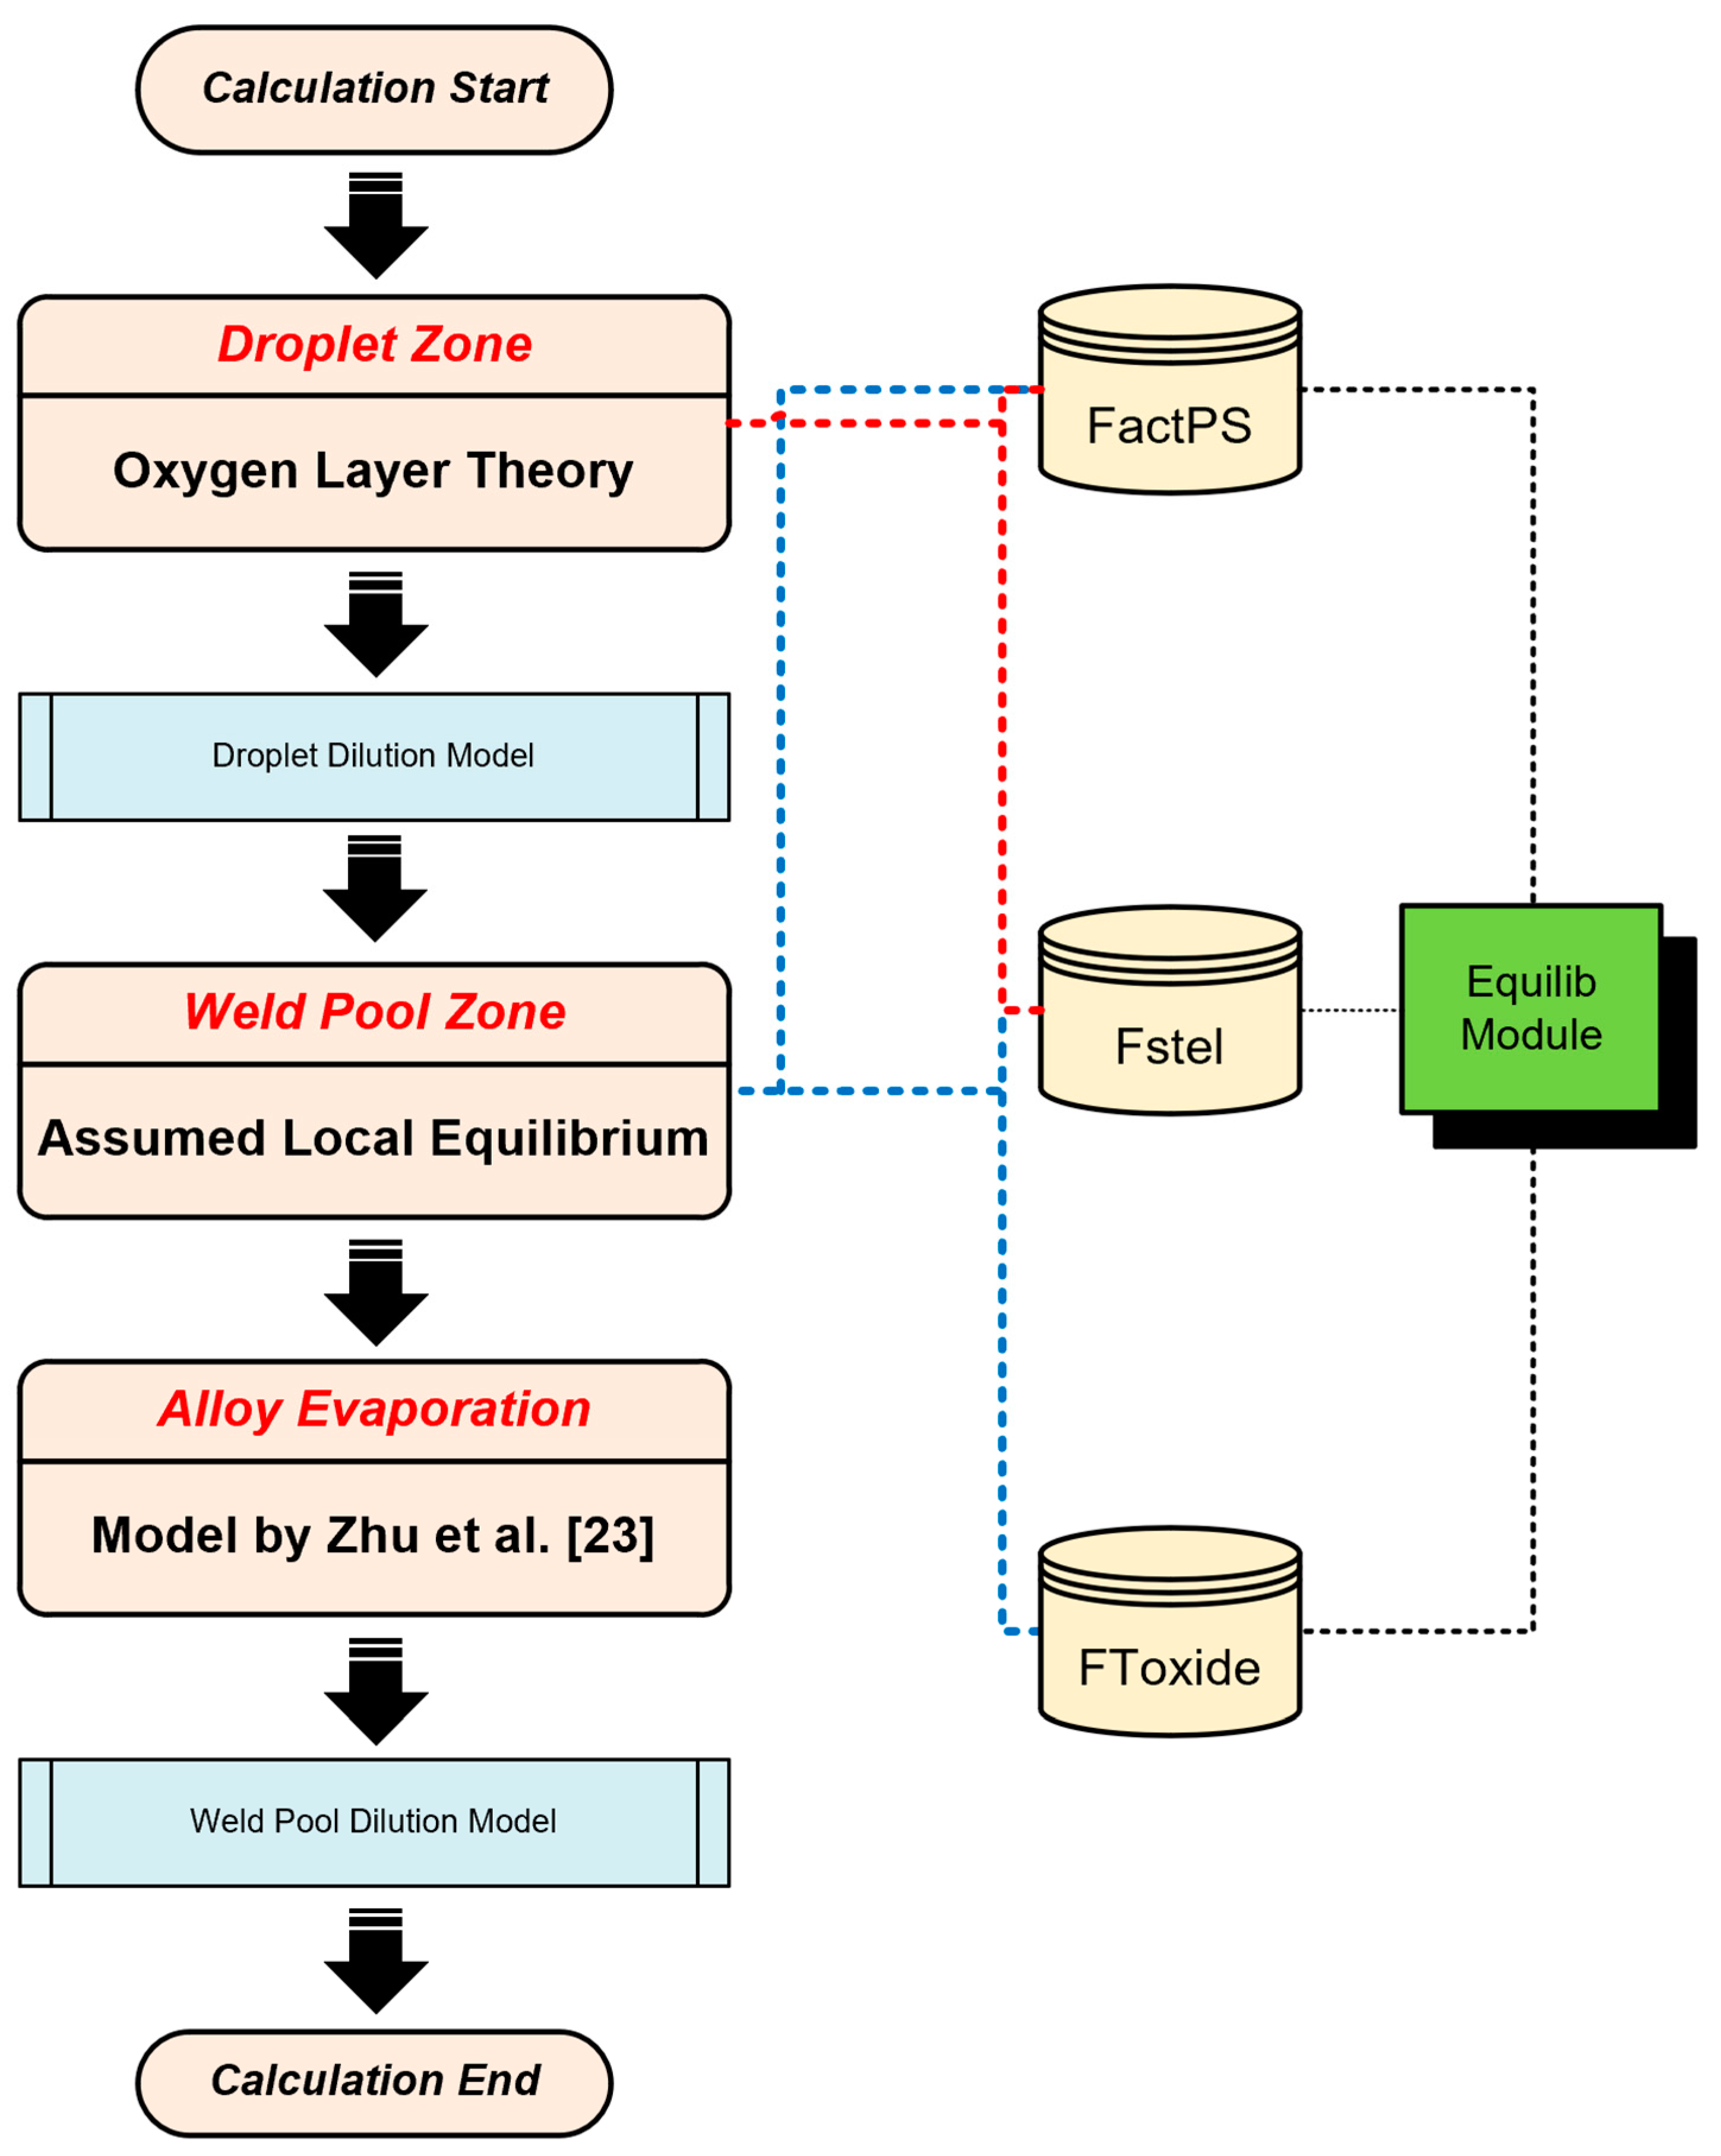
Figure 3 illustrates the detailed flowchart of the modeling process, including the scientific assumptions, thermodynamic data, and computational modules utilized. Data from previous studies (the measured compositions, predicted compositions, and model data, etc.) will be referred in this paper for the purpose of comparative analysis [
8,
14]. Compositions of metals and fluxes have been summarized in
Table 1 and
Table 2 [
8,
14].
2.2.2. Modeling Process
The thermodynamic simulation process in the droplet zone is as follows [
3]:
Step 1: database selection and phase simulation.
Three critical databases were chosen as follows: FToxid, Fstel, and FactPS.
These databases were configured within the Equilib module for subsequent phase simulations.
To simulate the molten slag and steel phases, the following solution phases were selected: FToxid-SLAGA and FStel-Liqu.
Step 2: setting the equilibrium temperature for the SAW process.
To model the SAW process accurately, the equilibrium temperature was set at 2500 °C, corresponding to the temperature of the arc plasma.
Input metal chemistries were acquired from the BM compositions.
Step 3: predicting O concentration in droplets.
Equilibrium calculations were performed using Fe and O as input metal constituents.
For the weld pool zone, the previously established thermodynamic equilibrium model will be utilized to predict the transfer behavior and metal composition [
3]. However, unlike previous cases, the increase in O content in the droplet will be taken into consideration when setting the input stream. Considering the dilution of the droplet, the input stream is set for the equilibrium in this part [
20]. The setting details have been extensively stated in our previous studies [
3]. Then, the evaporation level of the metal is estimated using Formulas (1) and (2) proposed by Zhu et al. [
23]
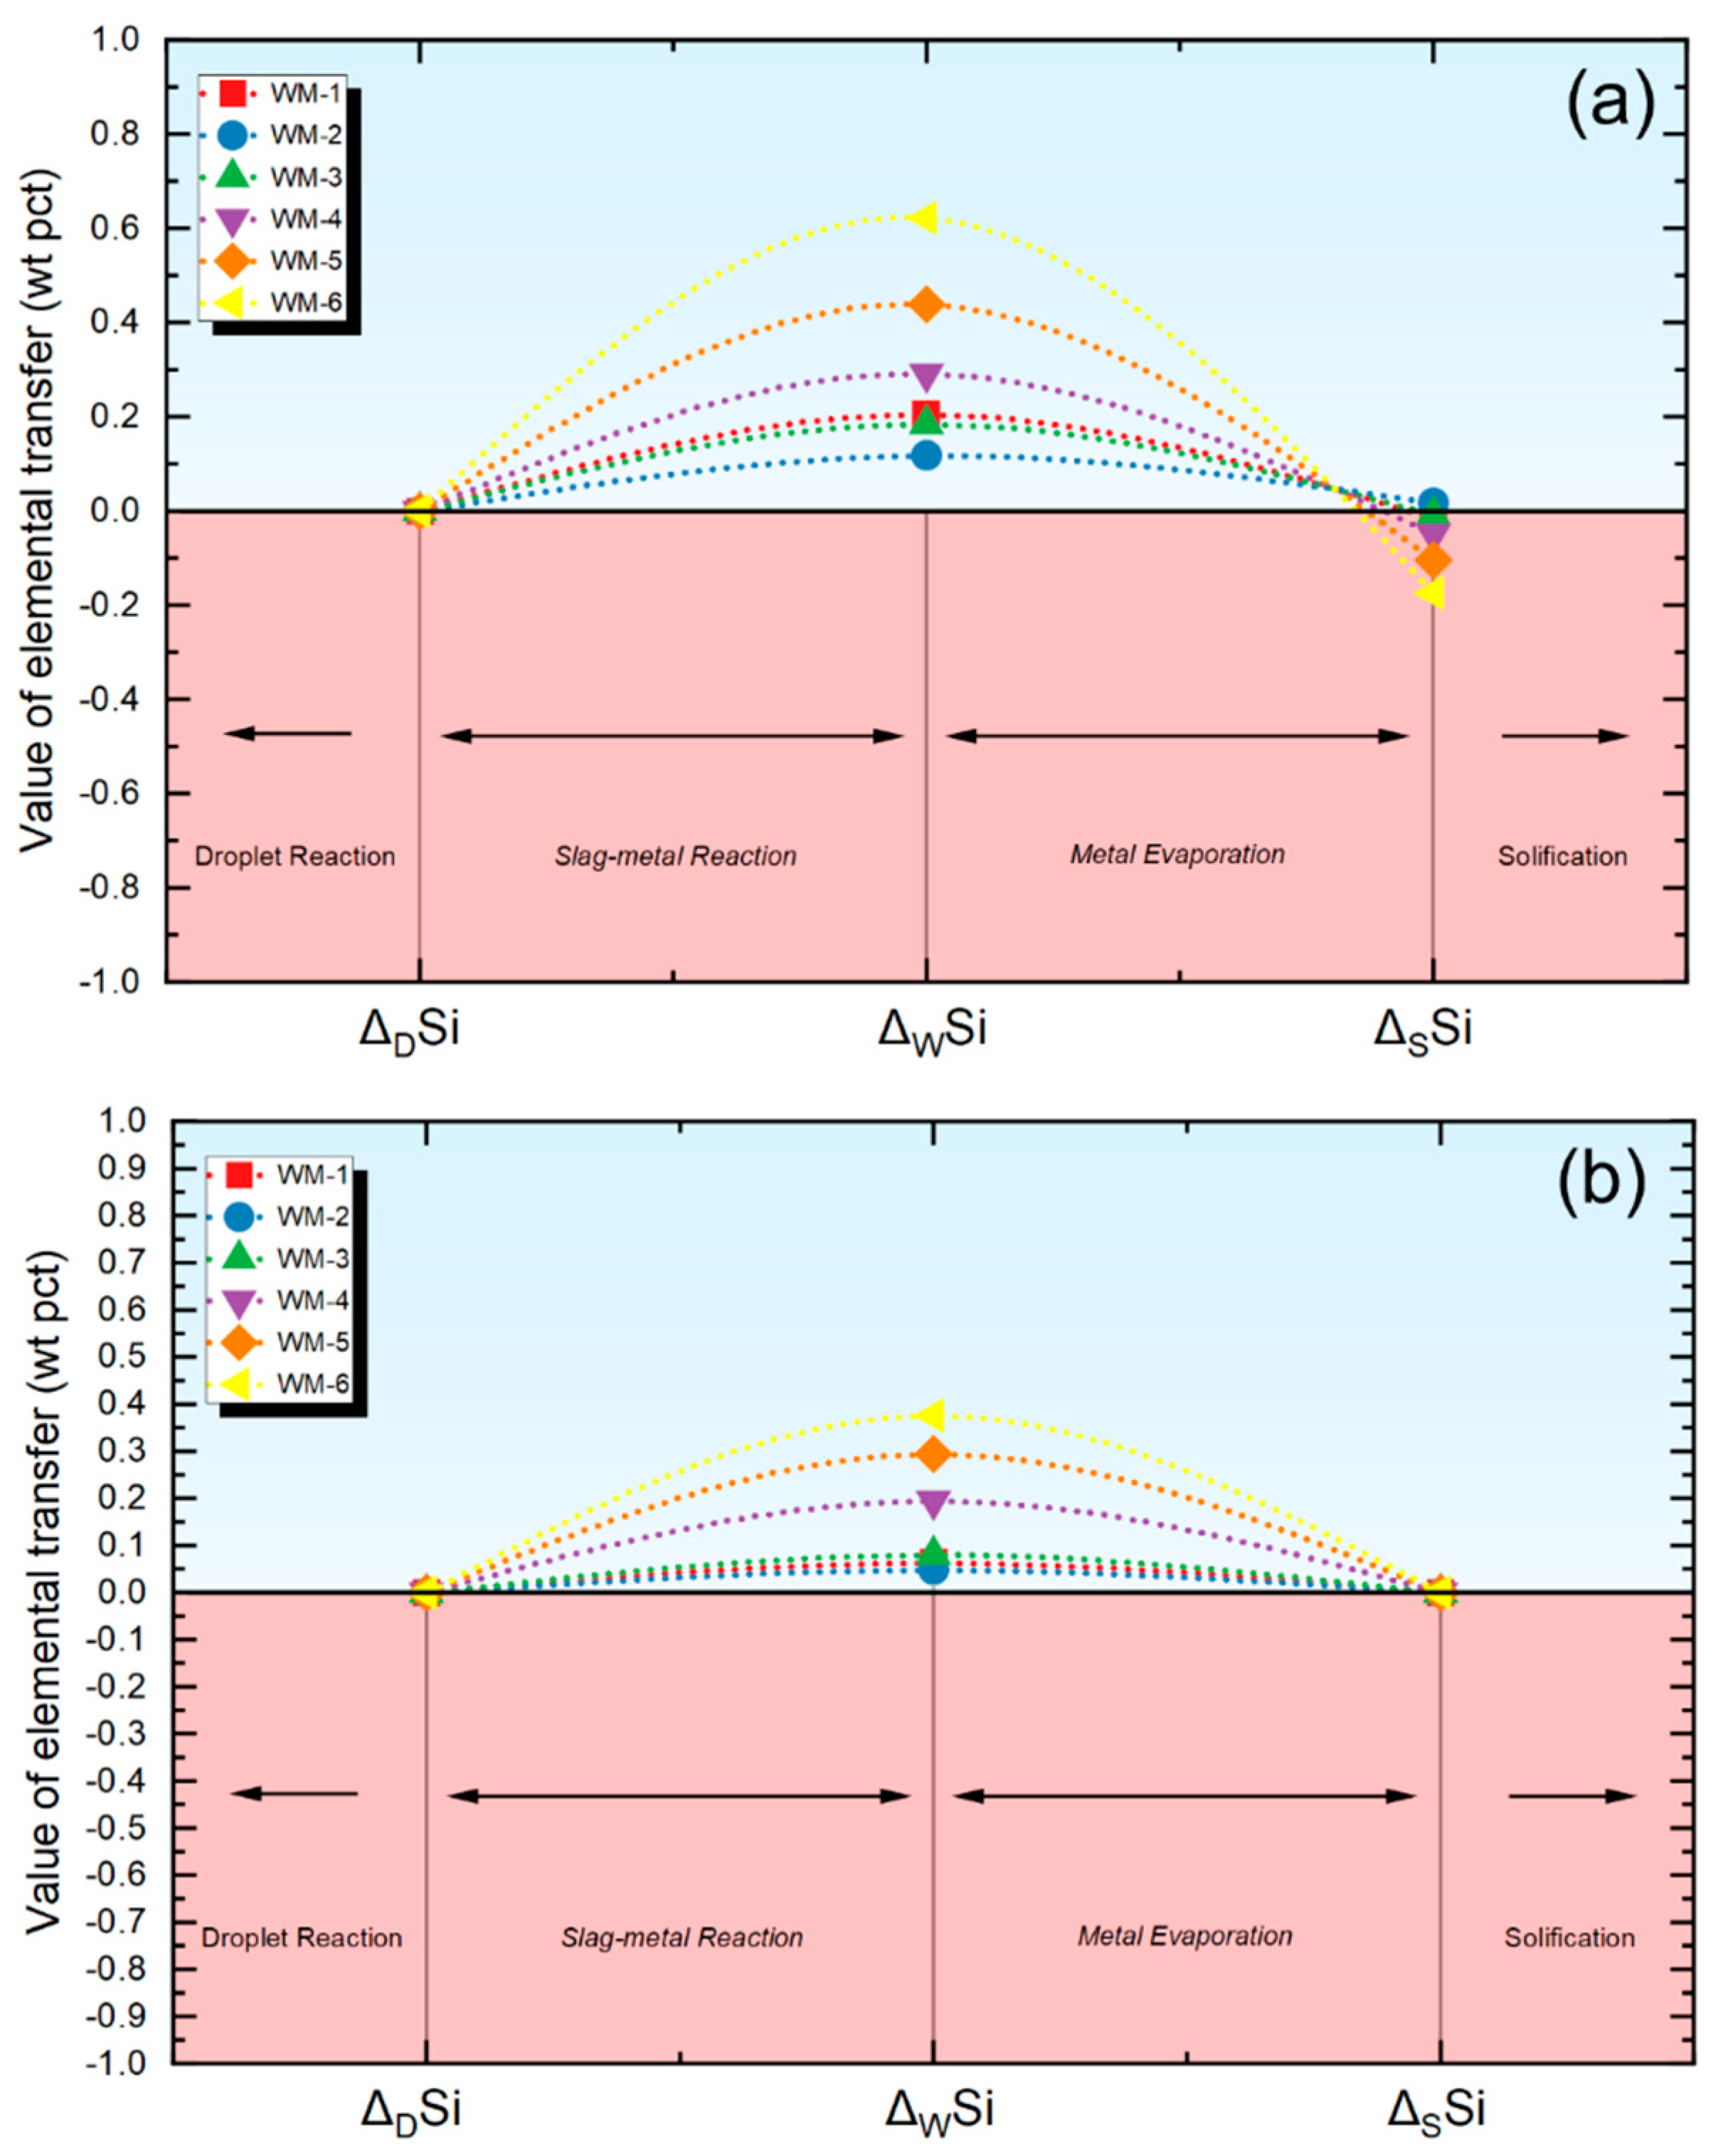
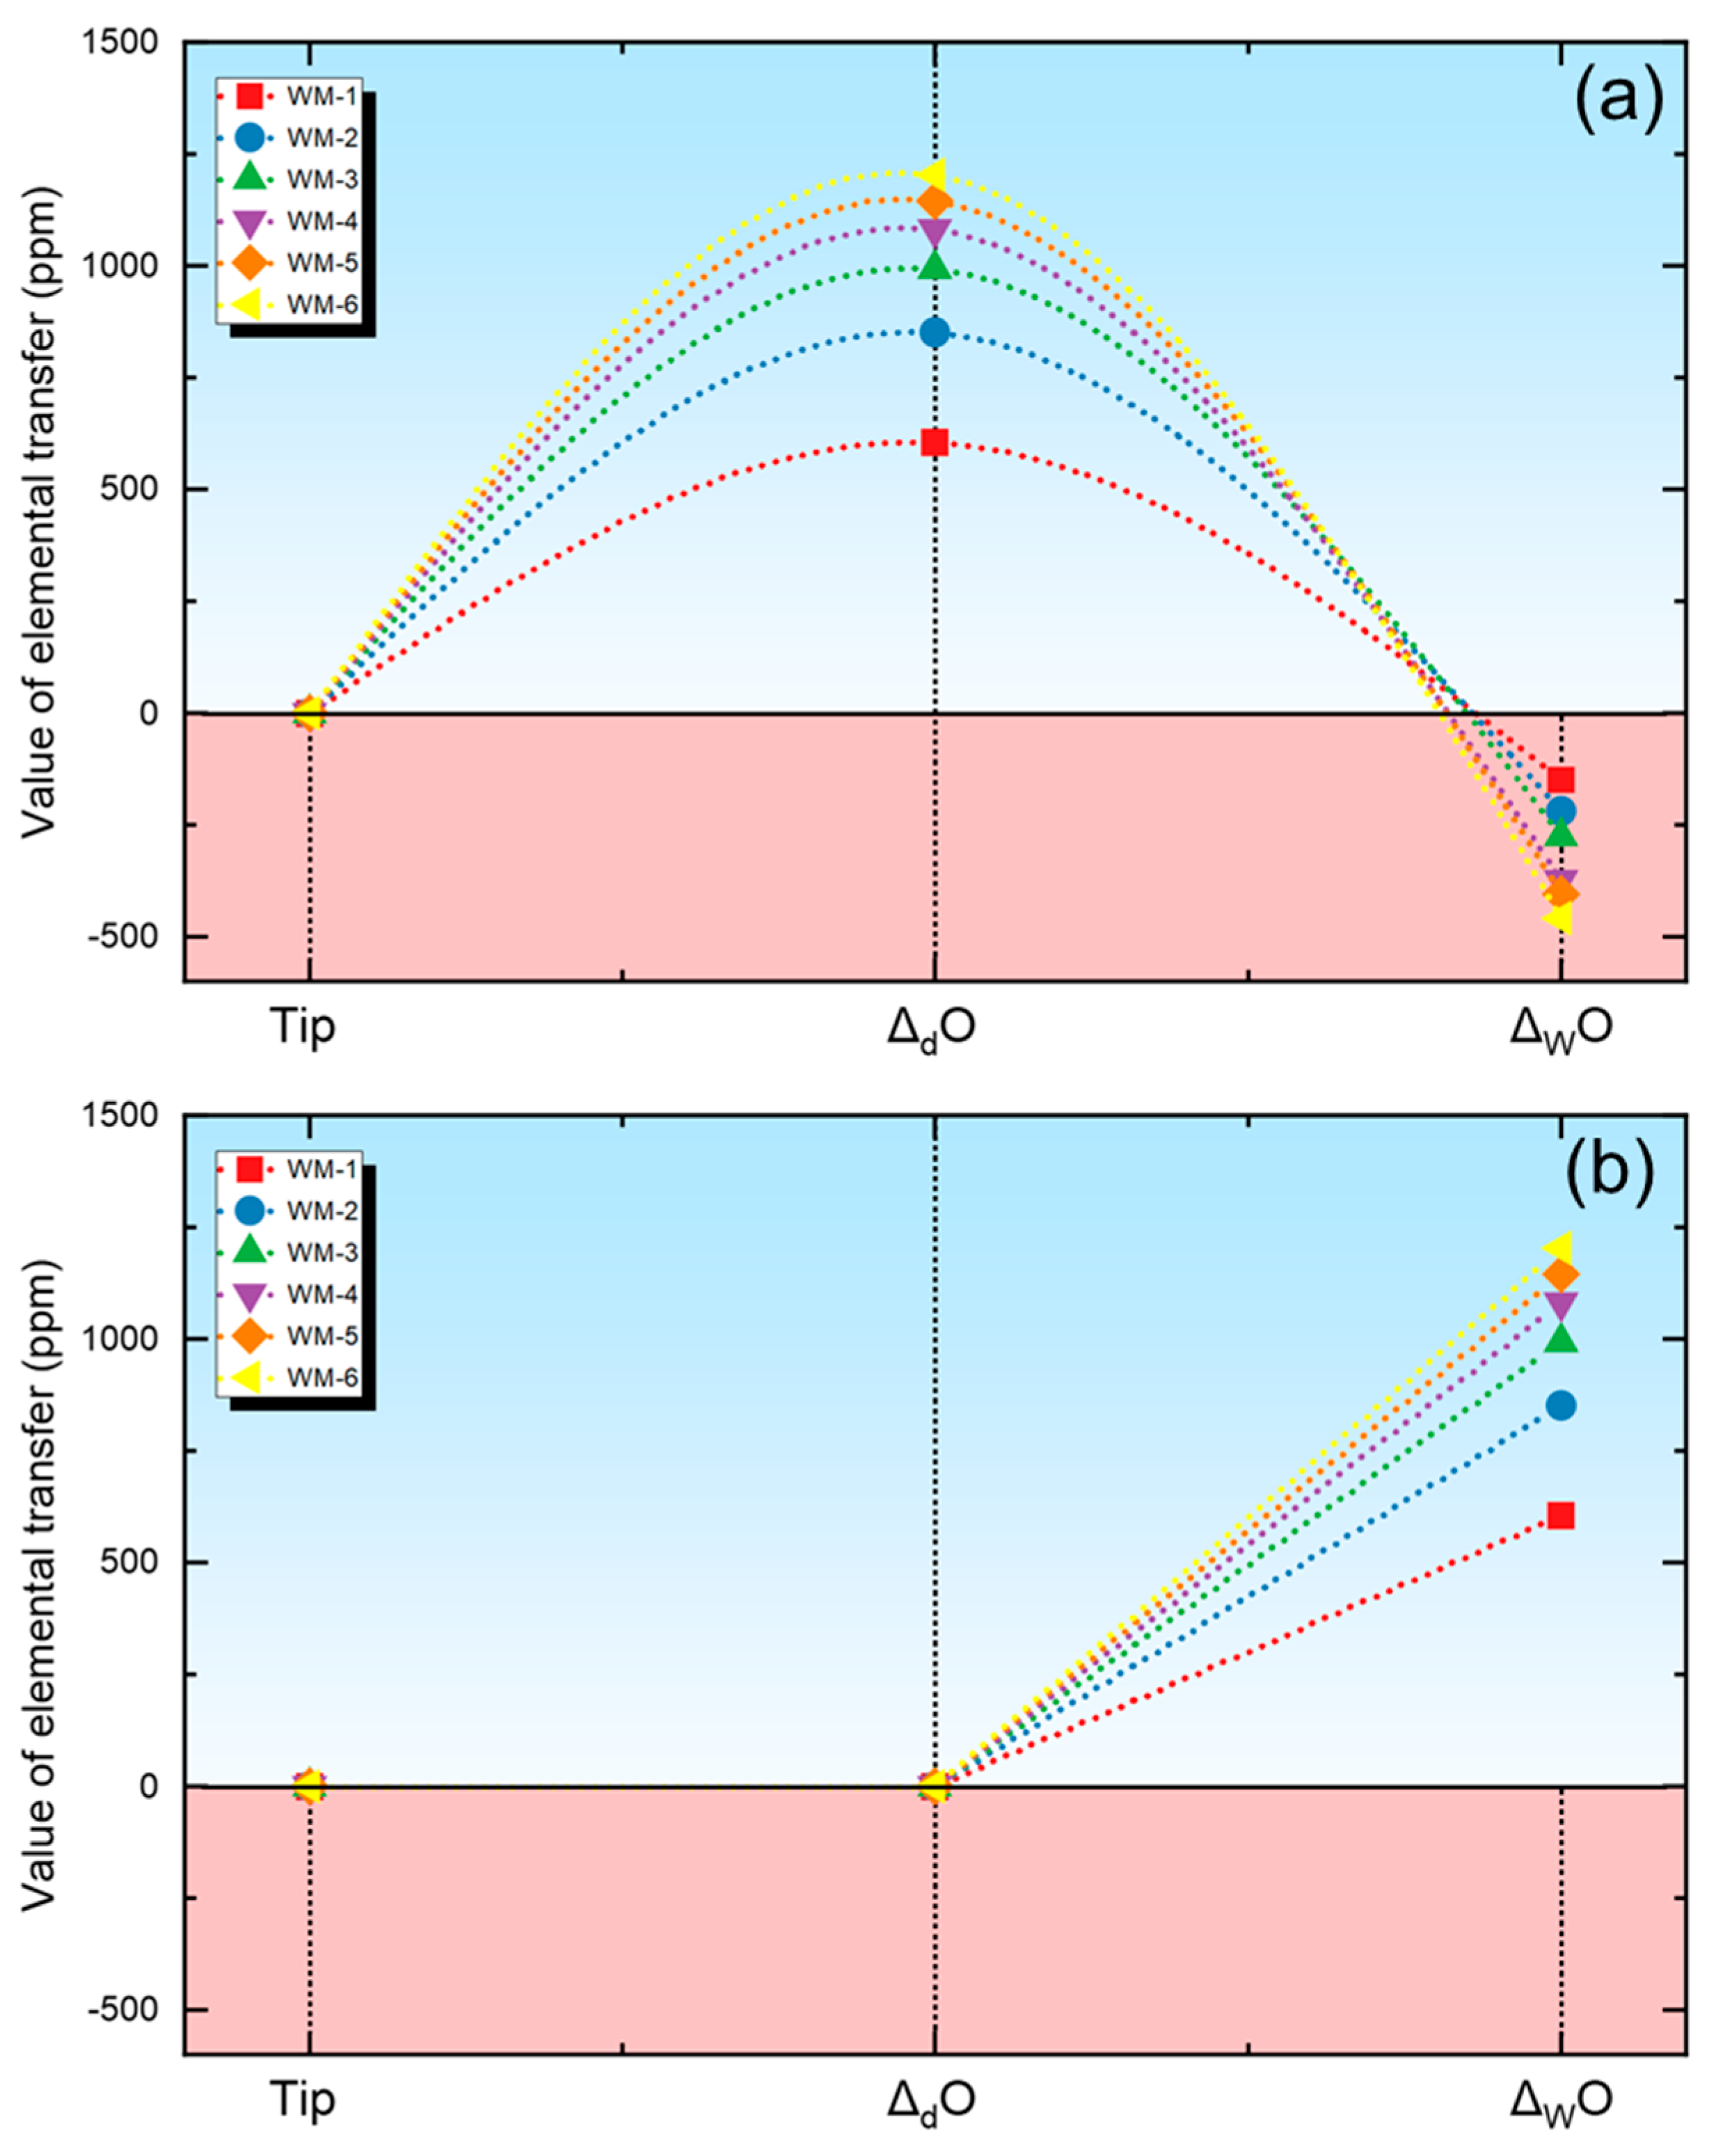
Δ
d and Δ
w are used to measure the extent of the material transfer within the droplet and weld pool regions in this investigation. For a specific element, the Δ
d and Δ
w values are computed using Equations (3) and (4) where Δ
d signifies the extent of elemental transfer in the droplet area, M
d represents the content in the droplet, Δ
W signifies the extent of elemental transfer in the weld pool region, M
W represents the content in the weld metal, and M
N represents the nominal composition. The M
N value is subsequently determined using Equation (5), which is derived by combining the measured compositions of the base metal (M
BM) and the electrode (M
EL) in conjunction with the dilution factor of the BM (d). Considering the minor difference in composition between the BM and the electrode, the value of d is set at 0.5 [
25].
To facilitate the reference,
Table 3 summarizes the models and theories mentioned in the article.
The main symbols used in the model and their definitions are summarized in
Table 4.
Here are examples of the key operations/processes.
(1) According to the model setting subjected to the droplet zone, the calculation utilized the P
O2 value in
Table 5 to simulate the O content in the droplet.
(2) According to the model setting subjected to the droplet zone, the metal compositions after the dilution calculated from Equation (5) are set as the input stream. The output stream of this stage has been given in
Table 6.
(3) After consideration of the chemical interaction within the weld pool zone, the metal evaporation is evaluated using Equations (1) and (2) with the output given in
Table 7.
(4) Then, Equations (3) and (4) are used to quantify the level of elemental transfer within the droplet zone and weld pool zone, respectively. Data will be detailed next.


