Article

Microstructure Imaging and Characterization of Rocks Subjected to Liquid Nitrogen Cooling

1
National Key Laboratory of Petroleum Resources and Engineering, China University of Petroleum (Beijing), Beijing 102249, China
2
CNPC Engineering Technology R&D Co., Ltd., Beijing 102206, China
3
Geothermal Energy Science and Technology Research Institute (Dali), Dali 671000, China
*
Author to whom correspondence should be addressed.
Processes 2024, 12(1), 127; https://doi.org/10.3390/pr12010127
Submission received: 15 November 2023 / Revised: 18 December 2023 / Accepted: 20 December 2023 / Published: 3 January 2024

Abstract

:
Liquid nitrogen (LN2) fracturing is a potential stimulation method in unconventional hydrocarbon recovery, showing its merits in being water free, creating low formation damage and being environmentally friendly. The microstructure evolution of rocks subjected to LN2 cooling is a fundamental concern for the engineering application of LN2 fracturing. In this paper, pore-scale imaging and characterization were performed on two rocks, i.e., tight sandstone and coal specimens subjected to LN2 cooling using computed tomography scanning. The digital core technique was employed to reconstruct the microstructures of rocks and give a quantitative analysis of the pore structure evolution of both dry and water-saturated rocks. The results indicate that LN2 cooling has a great effect on the pores’ morphology and their spatial distribution, leading to a great improvement in pore diameter and aspect ratio. When compared to the sandstone, coal is more sensitive to LN2 cooling and thermal stresses, having a more noticeable growth in pore–throat size. The porosity growth of coal is 291% higher than that of sandstone. There is a growing trend in the irregularity and complexity of pore structures. After LN2 cooling, the fractal dimensions of the pores of sandstone and coal grow by 11.7% and 0.87%, respectively, and the proportion of pores with a shape factor > 100 increases. More bundle-like and strip-shape pores with multiple branches are generated, which causes a significant growth in the throat size and the proportion of connected pores with a coordination number ≥ 1, enhancing the complexity and connectivity of pore structures dramatically. Additionally, pore water plays an important role in aggravating rock damage during LN2 cooling, enhancing the pore space and connectivity. The porosities of the saturated sandstone and coal samples grow by 22.6% and 490.4%, respectively, after LN2 cooling, which are 5.6% and 186.6% higher than dry samples. The generation of macropores ≥ 70 μm is the primary contributor to porosity growth during LN2 cooling, although such pores account for only a small proportion of the total. These findings contribute to our understanding of the microscopic mechanism of LN2 cooling on rock damage and may provide some guidance for the engineering application of LN2 fracturing.

1. Introduction

Unconventional hydrocarbon has become a reliable resource globally, which is of great significance for meeting the growing demand for energy and achieving low-carbon solutions [1,2,3,4,5]. Due to their intrinsic low-porosity and low-permeability features, the natural productivity of such reservoirs is generally quite low as compared to conventional reservoirs. Hydraulic fracturing plays an essential role in the economic exploration of unconventional hydrocarbon resources, which involves creating artificial high-conductivity fractures and enhancing the productivity [6,7]. Nevertheless, massive hydraulic fracturing is increasingly criticized due to the issues such as enormous water consumption, environmental risks and formation damage [8,9,10,11]. The formation is damaged mainly because external fracturing fluid during fracturing that invades low-permeability reservoirs can cause clay mineral swelling, fracture and pore narrowing or blocking of the seepage channels, resulting in a significant decline in the productivity. Additionally, the simple 2D planar fracture pattern created by hydraulic fracturing is not conducive to increasing the stimulated reservoir volume (SRV) [12,13]. To address these water-related issues, waterless fracturing technologies have attracted more and more interest recently [9,14].
Cryogenic fracturing, as a potential waterless fracturing technology, was first proposed and applied in fields in 1990s [15,16]. This technology uses liquid nitrogen (LN2) as a substitute for the conventional water-based fracturing fluid, showing great potential for addressing the environmental issues and enhancing the stimulation performances [17]. Nitrogen is abundant in the air, accounting for 78% of total gases, which can save the production cost of fracturing fluid when applied at large scales. Since cryogenic nitrogen fracturing is nonaqueous and chemical additives free, environmental contamination and formation damage induced by water blocking and clay swelling in conventional massive hydraulic fracturing could be perfectly eliminated. Moreover, liquid nitrogen can be directly dispersed into the air after gasification, reducing post-treatment disposal and greenhouse gas emissions, which are closely related to emission reduction and environmental protection policies. Additionally, liquid nitrogen has an extremely low temperature, with the boiling point of −195.8 °C at atmospheric pressure. When in contact with rocks, thermal shock induced by the sudden temperature drop destroys pore structures and the mechanical properties of rocks deteriorate significantly. This helps to reduce fracture initiation pressure, create secondary fractures, extend the length of primary fractures, and thereby improve reservoir stimulation performances greatly, contributing to energy conservation goals [18]. McDaniel et al. [16] and Grundmann et al. [17] reported six field application cases of cryogenic nitrogen fracturing, and suggested that injecting liquid nitrogen at cryogenic temperature is applicable at a moderate depth without damage to cement and casing. The stimulation results indicate that LN2 fracturing was promising, especially for unconventional oil and gas reservoirs. Therefore, more and more studies have focused on this technique to evaluate its efficiency in improving unconventional oil and gas reservoir permeability and conductivity.
Rock damage under super-cold conditions is the basis for the application of liquid nitrogen in reservoir stimulation [18,19,20]. Physical and mechanical parameters, such as compressive and tensile strength, elastic modulus, P-wave velocity, permeability and porosity, are commonly used to represent the damage characteristics of rock. Many experiments have been implemented to determine the physical and mechanical properties of rocks subjected to LN2 cooling [19,20,21,22,23,24,25,26]. It was found that LN2 cooling has a great effect on both physical and mechanical properties. After liquid nitrogen cooling, the permeability and porosity of rocks increase greatly, while density, P-wave velocity, uniaxial compressive strength, elastic modulus and tensile strength show a declining trend. According to previous experiment results, the permeability of coal improves by 93.55% after LN2 cooling, while uniaxial compression strength and peak strain (axial strain at the peak stress) reduce by 16.18~33.74% and 13.01~20.61%, respectively [18,27]. Moreover, audible cracking sounds can be heard when submerging coal in LN2. Zhao et al. [28] showed that the characteristic parameters such as the area, volume, length and width of internal fractures in rock samples were negatively correlated with rock mechanics properties. Therefore, the changes in the physical and mechanical properties demonstrate that LN2 cooling can greatly damage pore structures inside the rock.
There are several important factors affecting the damage of rocks subjected to LN2 cooling, such as bedding planes, lithology, water saturation and rock temperature, which have been comprehensively investigated in the past decades. Bedding planes are a critical feature for sedimentary rock, which act as natural weakness planes and guide the initiation and propagation of fractures during LN2 cooling. Cracks prefer to develop and distribute along natural joints and bedding in shale and coal. Jiang et al. [22,23] investigated the influence of LN2 treatment on the damage characteristics of different bedding shales through physical and mechanical tests. It was found that the permeability improvement and compressive strength reduction induced by LN2 cooling become less significant with increasing bedding angles. Water saturation is another important factor influencing rock damage during LN2 cooling. Unlike dry rocks, pore water not only causes mineral softening and defects to increase [29], but also, liquid nitrogen results in the freezing of pore water and its corresponding volume expansion in saturated rocks. The volume expansion induced by water phase transition can reach 9%, which can destroy pore structures and significantly enhance rock permeability. According to the studies reported by Cai et al. [30], the porosity does not rise significantly after LN2 cooling until the water saturation of coal increases to 40.6%. Moreover, Qin et al. [31,32,33] experimentally investigated the effect of cyclic freezing on the physical and mechanical properties of rocks. It was found that there is a negative correlation between compressive strength and cooling cycles. Increasing cooling cycles aggravates rock damage, resulting in greater permeability enhancement and more remarkable mechanical deterioration. Wu et al. [34] and Cai et al. [35] compared the physical and mechanical properties of high-temperature rocks (<600 °C) under LN2 cooling, water cooling and air cooling, in order to determine the damage characteristics of high-temperature rocks after LN2 cooling. The results indicate that damage induced by cooling becomes more serious with increasing rock temperature. Compared to water cooling and air cooling, LN2 cooling induces more microcracks, significant mechanical deterioration and permeability enhancement. Compared with granite and shale, sandstone is less sensitive to LN2 cooling. Guo et al. [36] also observed that with an increase in cooling rate, the degree of rock fragmentation increases, and the number of microcracks increases exponentially.
Rock is a multiscale porous media, and the destruction of micropore structures is the essential cause of physical and mechanical property changes in rocks subjected to LN2 cooling. Our predecessors employed a variety of methods to determine the pore structure evolution and internal damage characteristics of rocks, including nuclear magnetic resonance (NMR), scanning electron microscopy (SEM), acoustic emission (AE), energy dispersive spectroscopy (EDS), permeability measurement, the ultrasonic test, nitrogen adsorption and mercury intrusion [20,32,37,38,39,40,41,42,43,44,45,46]. However, these indirect tests cannot identify pore structures quantitatively, suffering from sample destruction and poor characterization capability. Some important features characterizing micropore structures cannot be captured, such as the three-dimensional (3D) spatial distribution of pores and throats, pore connectivity, fractal dimensions and pore size. In contrast to these methods, digital core technology is a nondestructive and more superior method for microstructural analysis of rocks, which benefits from presenting 3D spatial structures of the real pore-skeleton topology and providing corresponding data for quantitative analysis, and is thereby widely used in fields such as petroleum and geology analysis. Our predecessors conducted few preliminary investigations on the pore structures of coal subjected to LN2 cooling through digital core techniques [12,47,48,49]. Nevertheless, these preliminary studies were mainly focused on dry coal samples. Considering that rocks in reservoirs are generally saturated by water, further investigating the three-dimensional pore structure evolution of water-saturated rocks is of great significance to better understand the stimulation mechanisms of LN2 fracturing.
In the present paper, a high-resolution μ-CT scanning was performed on two rocks, i.e., tight sandstone and coal samples, before and after LN2 treatment. Three-dimensional micropore structures of rocks subjected to LN2 cooling were reconstructed and characterized quantitatively via digital core analysis, and rocks in both dry and water-saturated conditions were contrasted and analyzed to determine their differences in terms of microstructure evolution during LN2 cooling. This study is expected to offer insights into the microscopic damage mechanism of rocks induced by LN2 cooling at the pore-scale and provide some theoretical guidance for the engineering application of cryogenic nitrogen fracturing.

2. Materials and Methods

2.1. Sample Preparation

Coal and tight sandstone, collected from the major unconventional resource exploitation areas, were studied in this work. These samples were collected from the same coal mine and sandstone outcrop locations. Coal samples were collected from the Jincheng mining area, located in the southern Qinshui Basin, Shanxi Province, which is a significant area for coalbed methane development in China. Tight sandstone samples were collected from outcrops in Dayi County, western Sichuan Basin, which belongs to the Xu-3 member of the Upper Triassic Xujiahe Formation. It is a significant area for tight sandstone gas development in China. The Xujiahe Formation is divided into five members (T3x1~T3x5), with shale-dominated (T3x1, T3x3, T3x5) and sandstone-dominated T3x2, T3x4) layers serving as primary hydrocarbon source rocks and reservoir rocks, respectively [50,51]. The geographical locations of the coal mines and sandstone outcrops are illustrated in Figure 1. Further details on the Qinshui Basin and Sichuan Basin can be found in Refs. [52,53,54]. X-ray diffraction (XRD) analysis results for the rock samples are presented in Table 1. In addition, the proximate analysis indexes, vitrinite reflectance and organic macerals of coal samples were measured. As shown in Table 2, the Rmax (maximum reflectance), Rmin (minimum reflectance) and Ro (average reflectance) of the coal samples were 1.36, 0.91 and 1.14, respectively. The ash yield of coal samples was 12.95%, and the volatile content was 26.68%. Following the International Classification Standard of ISO 11760:2005 [55], the coal rank of the selected samples in this work is identified as Medium Ash Bituminous B. The organic macerals of the coal predominantly consist of vitrinite, accounting for 78% of the total, followed by inertinite at 22%, classifying it as moderately high vitrinite. Its mineral composition consists of clay minerals (46.0%), dolomite (31.2%), quartz (18.2%), etc. The sandstone samples are composed of quartz (50.90%), calcite (13.0%), dolomite (15.8%) and minor clay minerals. The main type of clay mineral is kaolinite and illite. Before the experiment, these samples were processed into cylinders with the dimensions of 5 mm in diameter and 10 mm in height, and dried for 24 h at the temperature of 80 °C in a muffle furnace. After this, CT scanning was conducted on these samples to acquire their original microstructures.

2.2. Experimental Setup and Procedures

2.2.1. Experiment Schedule

In total, four rock samples were used for the digital core analysis in this study, and they were divided into 2 groups, i.e., a dry group and a saturated group, with one coal sample and one sandstone sample in each group. The coal and sandstone samples in the dry group were labeled as C1# and S1#, while the samples in the saturated group were labeled as C2# and S2#, respectively. By comparing the pore structure evolution of samples C1# and S1# subjected to liquid nitrogen cooling, the sensitivity of the two rocks to liquid nitrogen thermal shock was studied. Samples C2# and S2# were saturated in the distilled water for 48 h under vacuum conditions to investigate the effect of pore water freezing during LN2 cooling. In summary, a total of eight micro-CT scanning experiments were conducted for the four aforementioned rock samples, and digital core analysis was carried out.
The experimental procedure of LN2 cooling of coal and sandstone samples was as follows:
(1)
Initial micro-CT scanning experiments were conducted on both the dry and saturated group samples to obtain 2D slice images of the initial microscopic pore structure.
(2)
Rock samples in both groups were immersed in a LN2 Dewar for 30 min and subsequently thawed at room temperature (about 25 °C) for 4 h.
(3)
A second round of CT scanning experiments was performed on these samples to obtain 2D slice images of the post-treated pore structures.
(4)
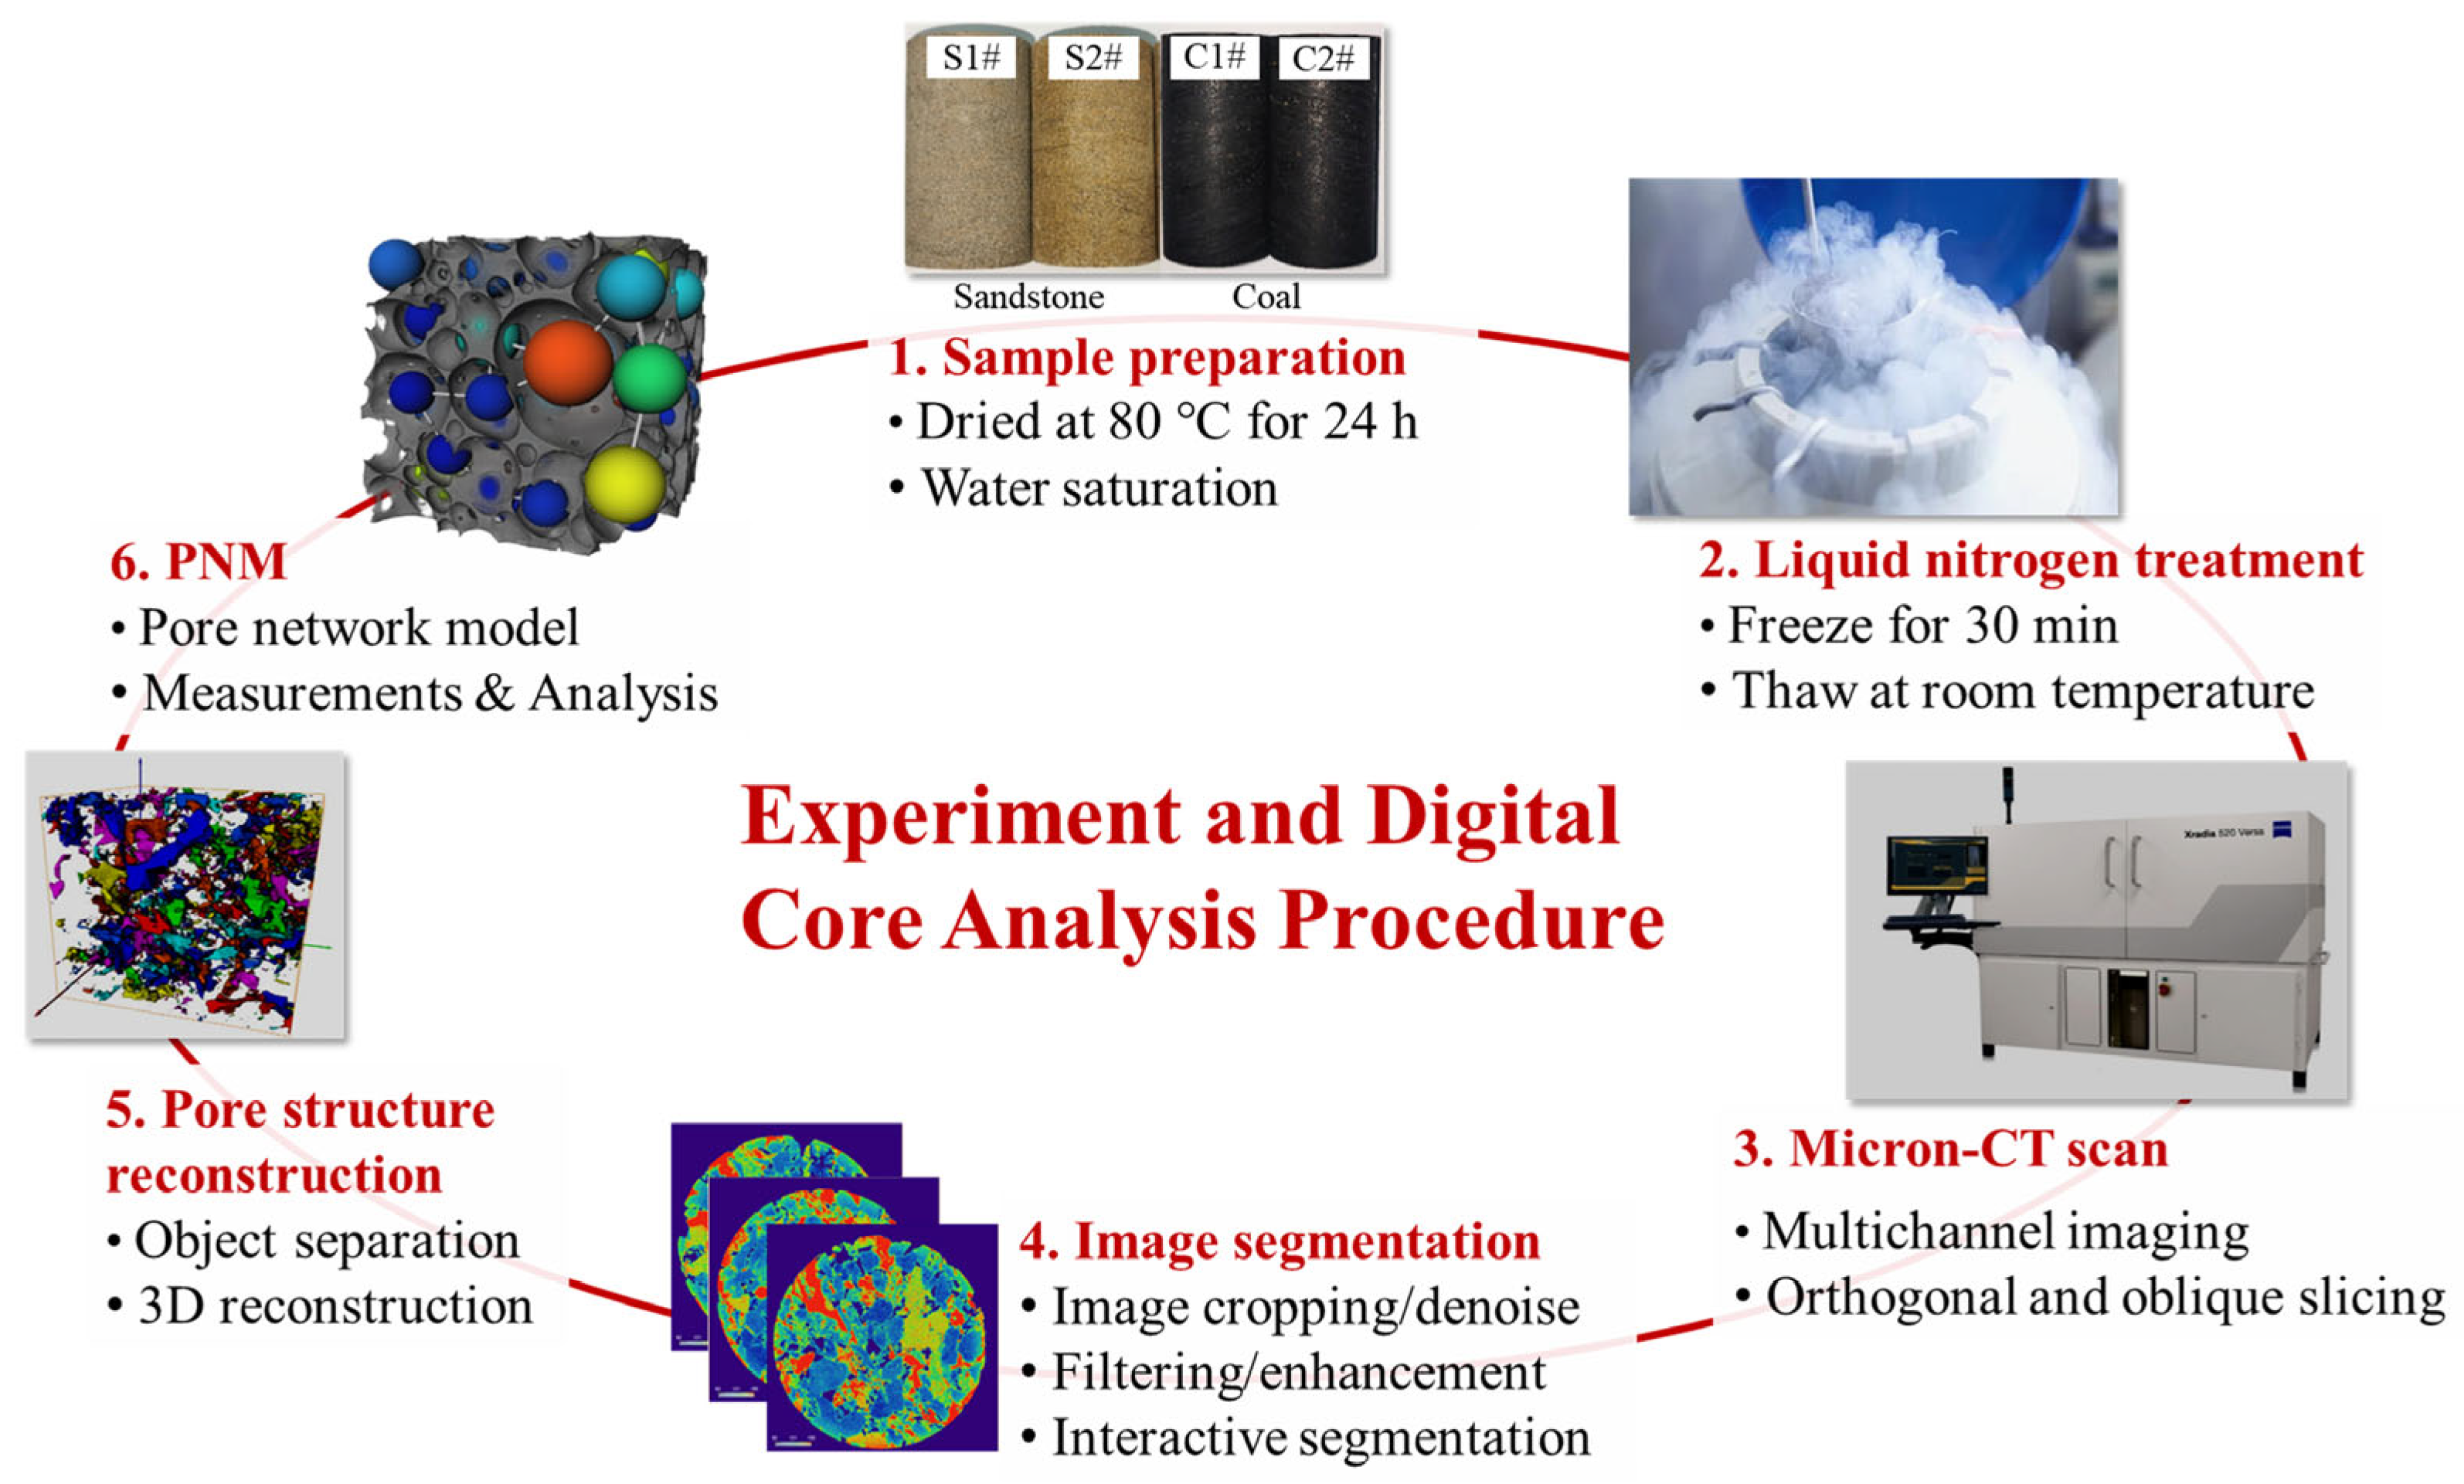
The visualization software AVIZO 9.0.1 was used to analyze the CT slice images before and after LN2 cooling, which could be stacked mathematically to reconstruct the 3D pore-skeleton structures following the procedure illustrated in Figure 2.

2.2.2. CT Scanning Setup

In this study, the high-resolution computed tomography (CT) inspection system YXLON FF35 was used to conduct the scanning. The working voltage and operating current were set to 100 Kv and 60 μA, respectively, with an exposure time of 20 s. The applied YXLON Panel 2530 detector has a detection range of 249 mm × 302 mm, with a frame rate up to 30 fps. X-ray CT scanning is a nondestructive method. It renders a detailed pore space structure while preserving the shapes of both pores and grains as well as their mutual configuration. When the sample is exposed to an X-ray beam, the energy of the X-ray attenuates due to the reflection, diffraction and absorption by the material. The degree of X-ray attenuation depends on the density of the material [56]. Based on the transmitted radiation received by the detectors, the detailed information about the internal structure of the target samples can be determined by Lambert–Beer’s law. The equation for this law is [57]:
I = I 0 e μ x
where I0 is the intensity of X-rays before penetrating the sample, in ev/m2∙s; I is the intensity of X-rays after penetrating the sample, in ev/m2∙s; x is the X-ray penetration length, in cm; μ is the linear attenuation coefficient of the material, in g/cm.
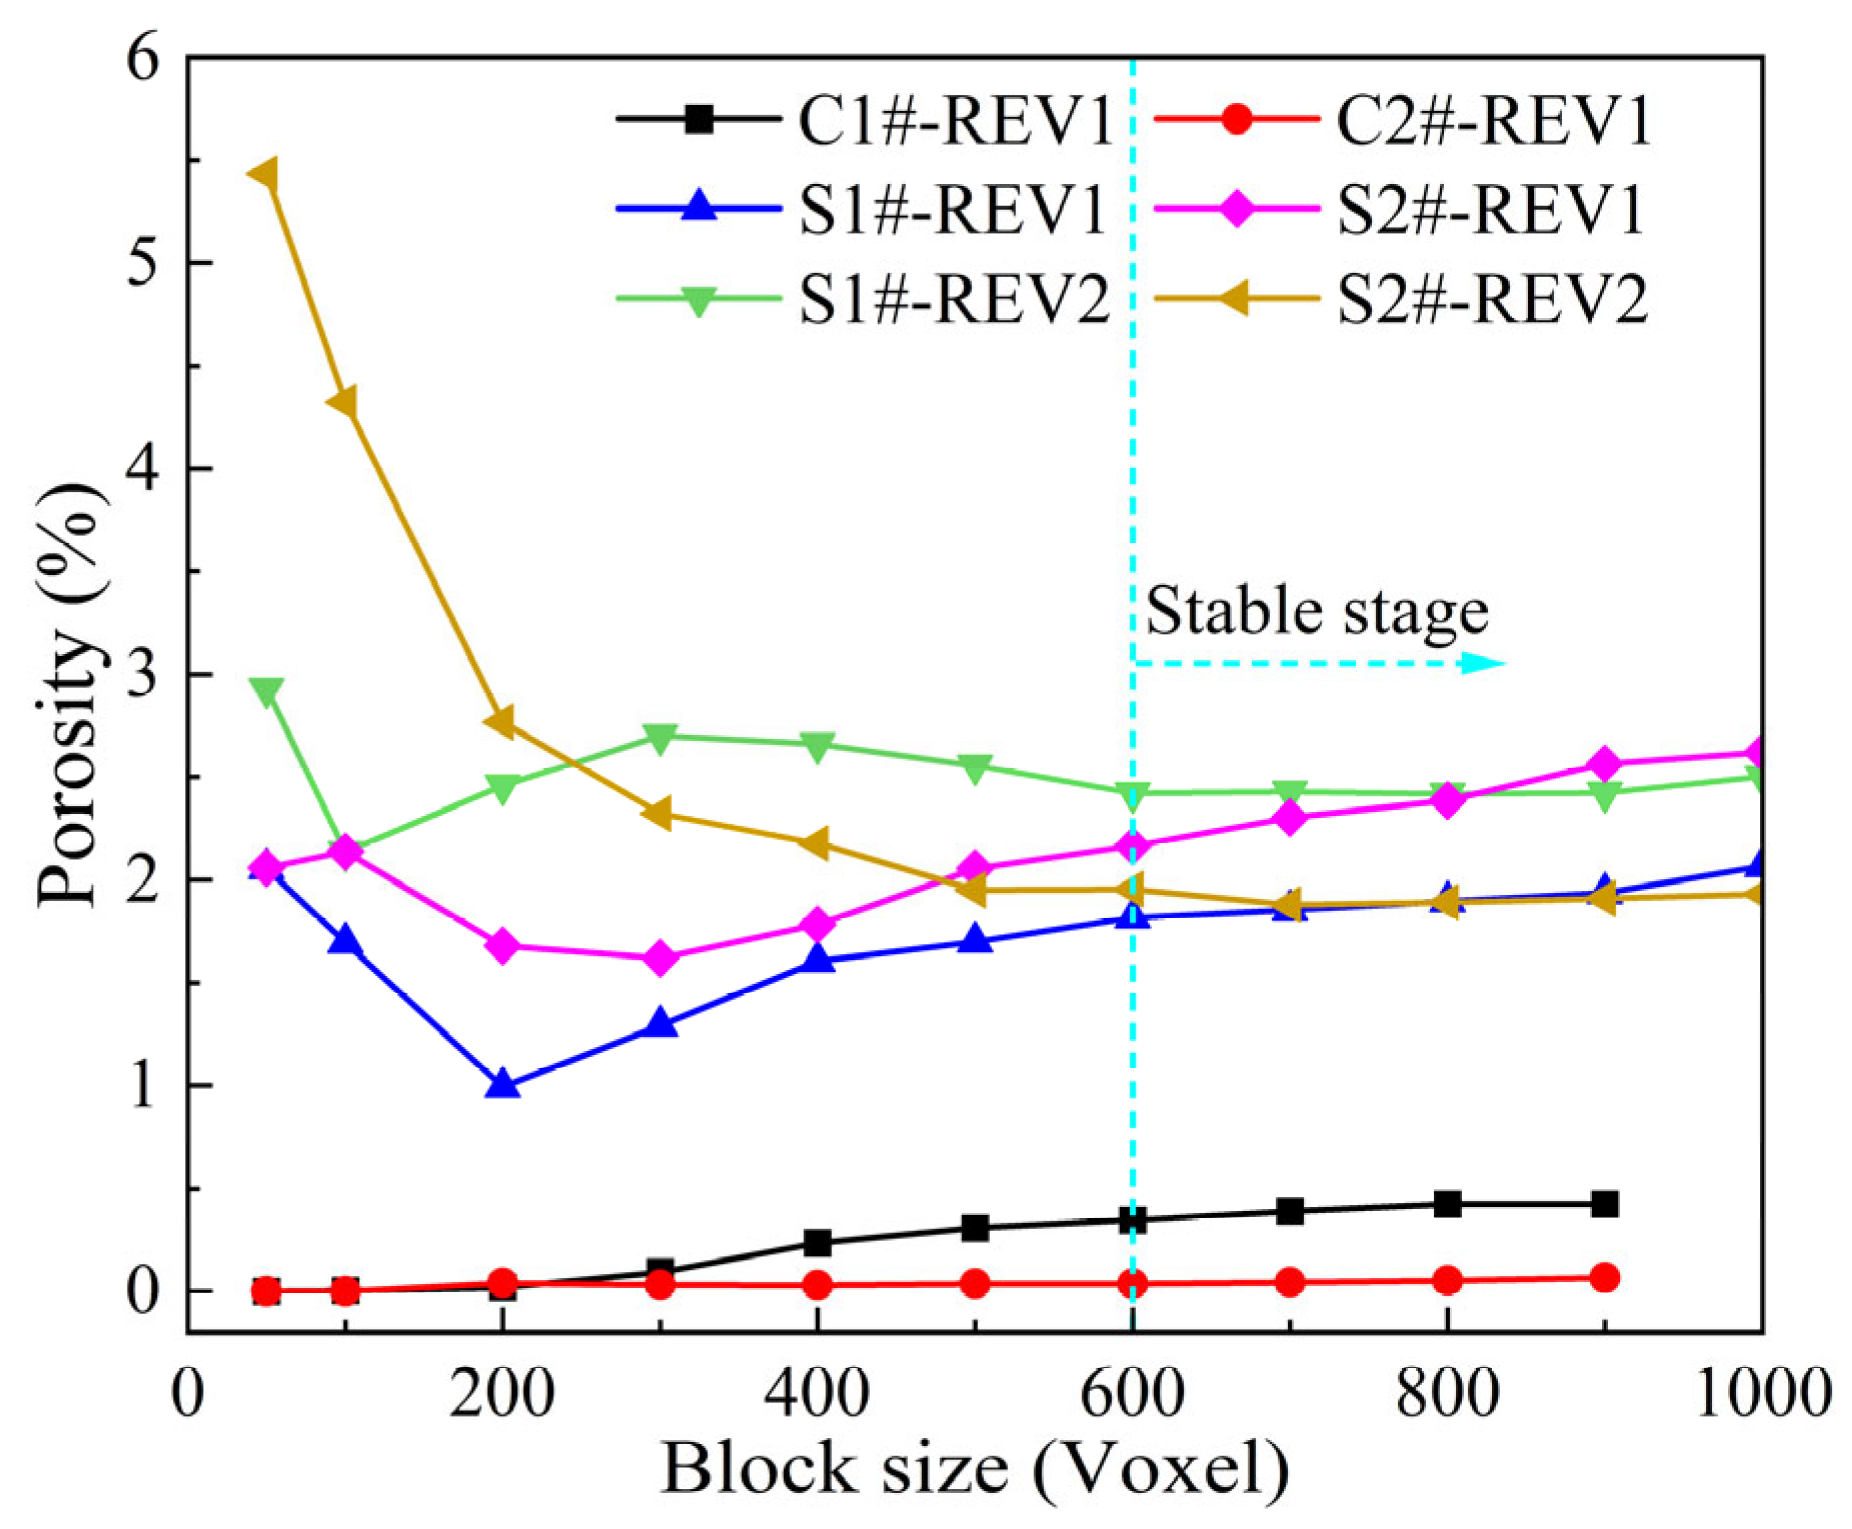
In order to obtain useful images of the pore structures, the field of view (FOV) needs to be selected so that the pore-space components are resolved into more than one pixel/voxel [58]. Macroscopic structures and properties of interest for a sample can be characterized effectively if the size of the field of view (FOV) and corresponding reconstructed model is large enough. Nevertheless, an overlarge scanning area inevitably leads to the loss of resolution and an increase in the data size and associated computational burden. We scanned the coal and sandstone samples under different FOV sizes and analyzed the porosities of the reconstructed models (as shown in Figure 3). This indicated that the porosity remains constant with the increasing size of the FOV after reaching 600 μm. Hence, considering the mutual constraint of the FOV of an imaging instrument and its resolution, 1013 × 940 pixel images with a maximum resolution up to 1.12 μm were scanned in this study to meet the requirements of identification accuracy and representativeness. More than 1000 2D slices were derived in the CT scanning of each sample and stacked to produce virtual cut sections (multiplanar reconstruction) across the volume data set, which are able to present the micropore structures and corresponding parameters of the rock samples.

2.3. Digital Core Analysis

2.3.1. Image Enhancement and Denoising

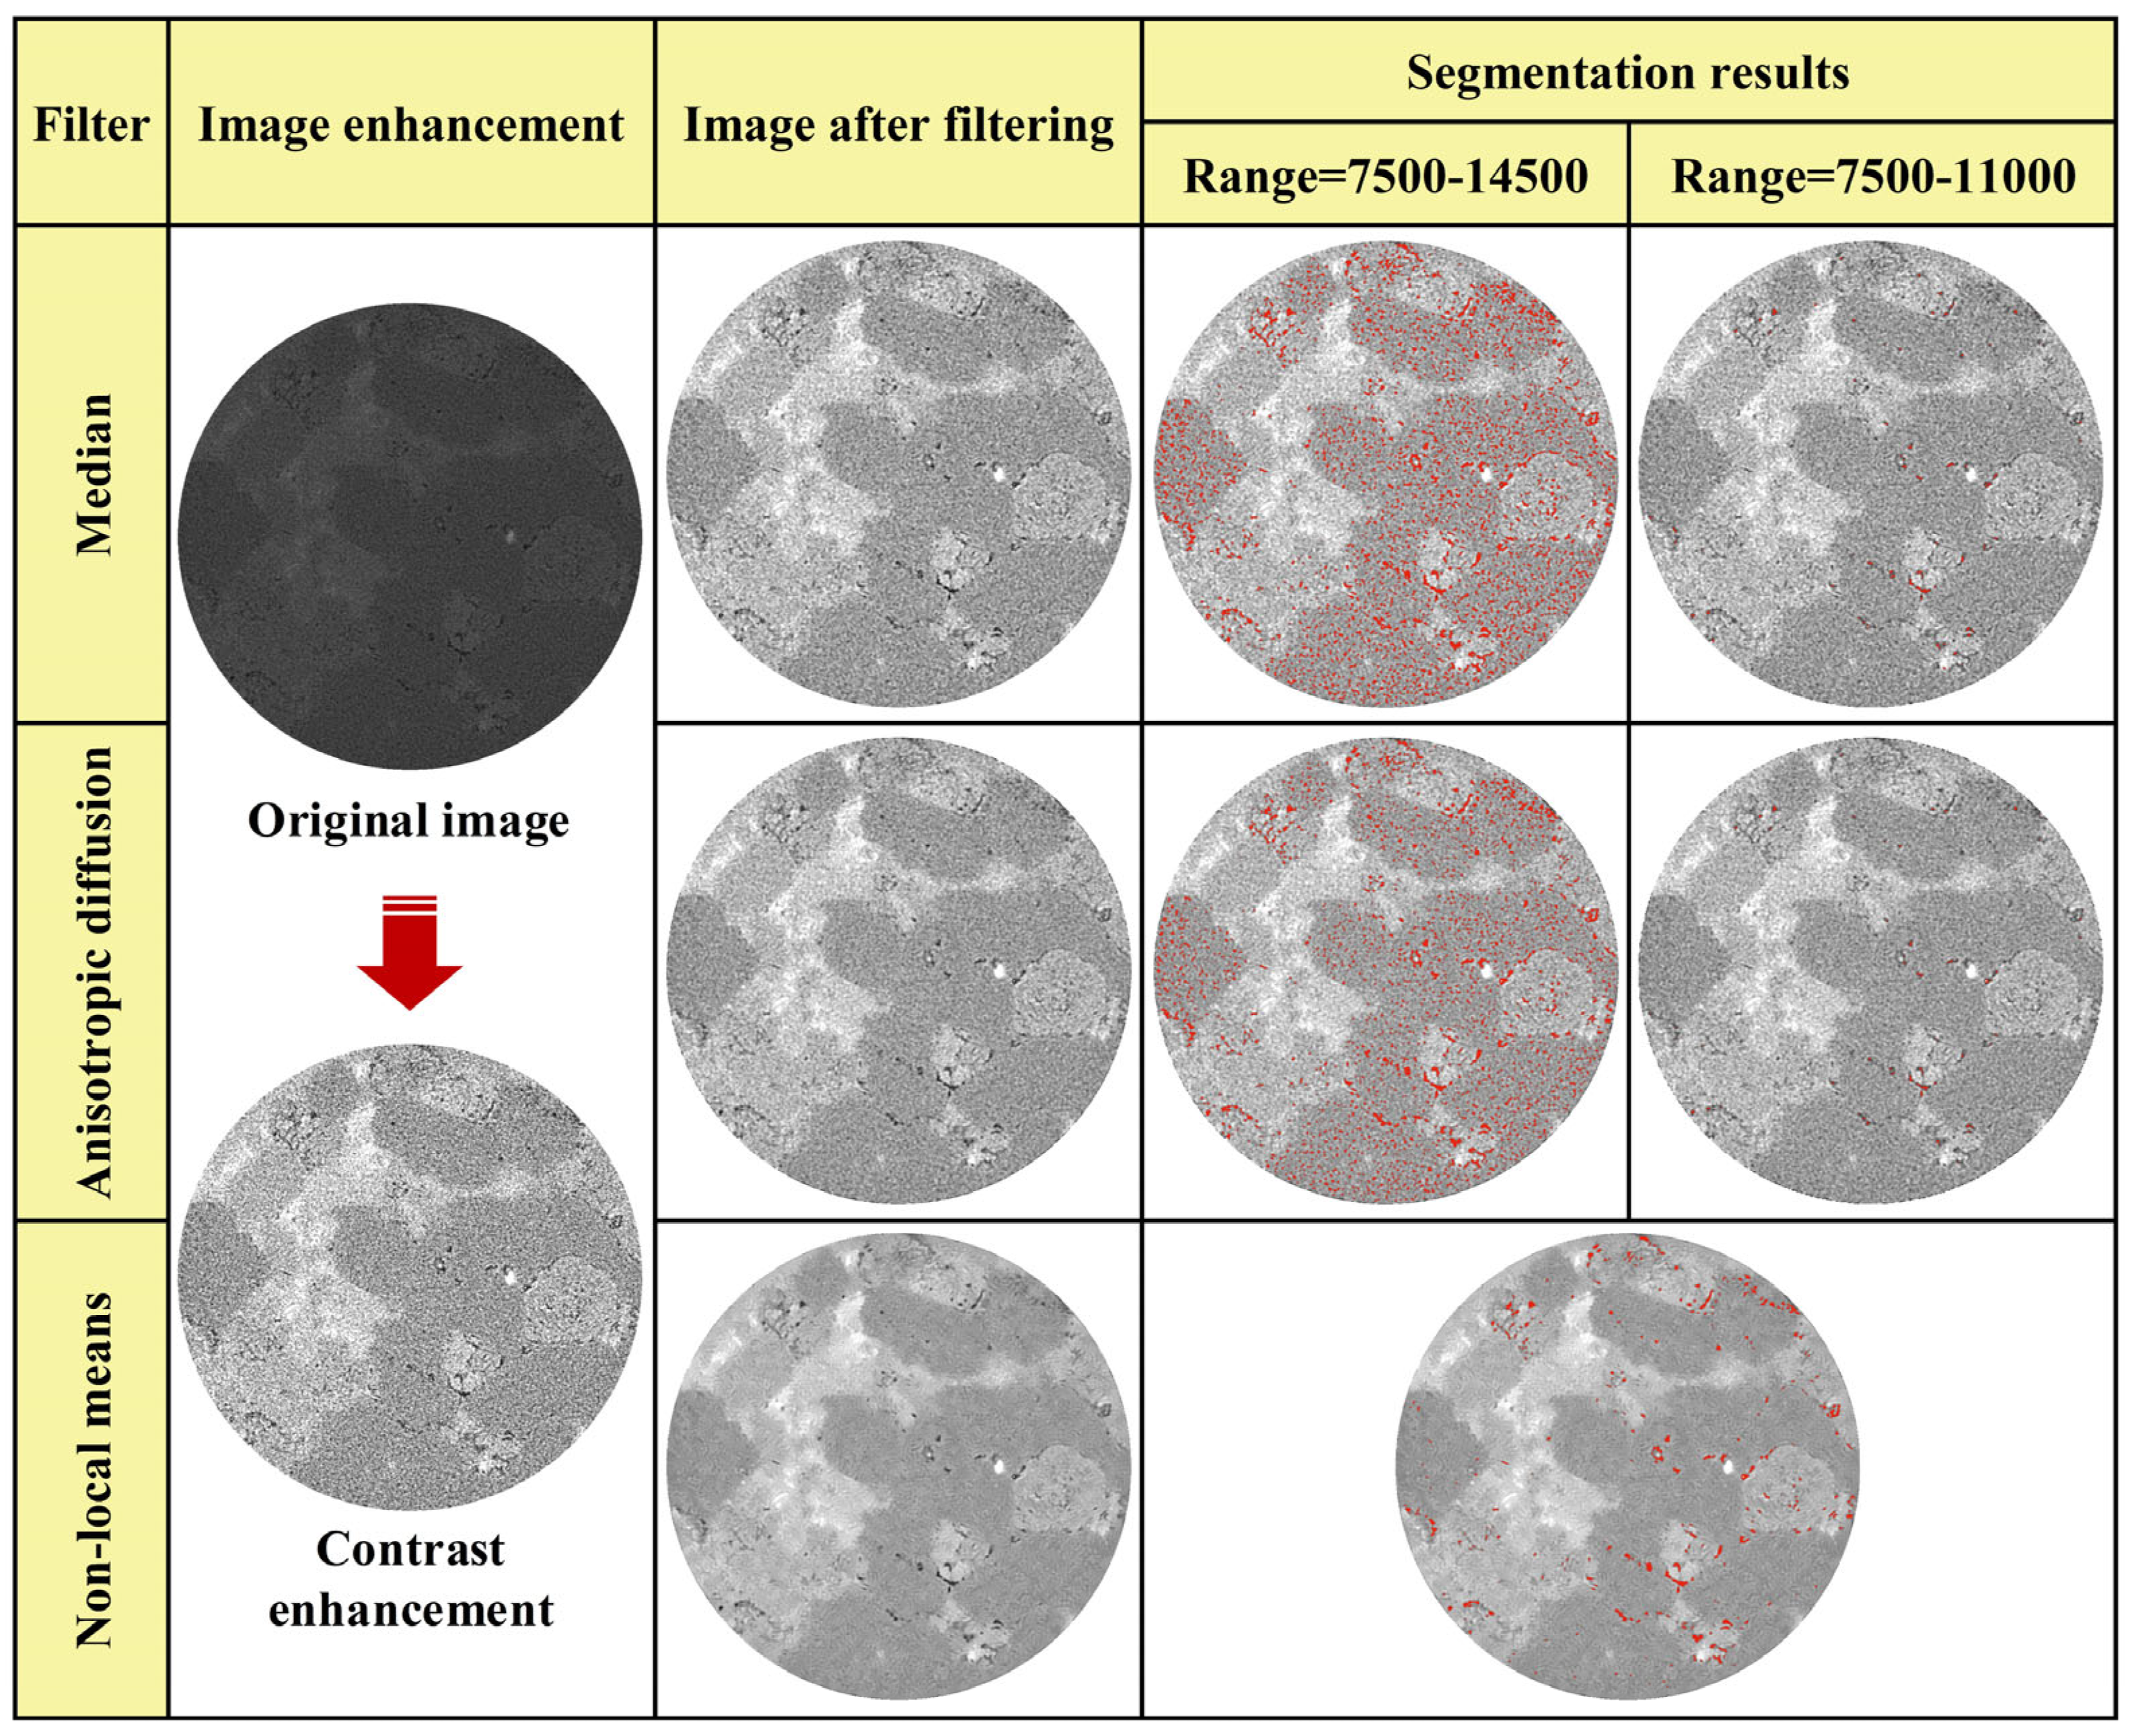
The digital core analysis was performed on the scanning slices using Thermo Scientific Avizo software 9.0.1. The original CT images generally contained multisource system noises, which have a negative effect on the reconstruction of 3D digital cores. Thereby, necessary preprocessing operations were implemented to improve the quality of the images. We firstly removed the CT slices with scanning shadows at the top and bottom sections via image cropping, followed by the contrast enhancement of the images, making the difference in the gray scale between the matrix and pores become noticeable and allowing us to separate the pores and rock matrix more precisely. To remove image noise and increase the signal–noise ratio (SNR), the images were filtered based on smoothing algorithms. Three different smoothing algorithms, i.e., median filter, anisotropic diffusion filter and nonlocal means filter, were applied and contrasted in our work. As shown in the third column of Figure 4, the image processed by the nonlocal means filter is smoother and has fewer noise pixels as compared to those processed by the other two filters. In contrast, images smoothed by the median filter and anisotropic diffusion filter present obvious noise pixels, which could be misidentified as pore structures and result in remarkable over-segmentation or under-segmentation depending on the threshold setting. The pore structures highlighted in red in Figure 4 represent the outcome of adjusting the intensity range selection, which is a result of this thresholding segmentation method. When the intensity range was set to 7500–14,500 (third column of Figure 4), it was evident that the median and anisotropic diffusion filter presented over-segmentation due to the presence of noise pixels. When we decreased the intensity range to 7500–11,000 (fourth column of Figure 4), a significant amount of noise pixels was not selected, but it led to under-segmentation of the actual pore shapes due to the narrow threshold range. In comparison, we found that adjusting the intensity range to 7500–14,500 on the image processed with the nonlocal means filter ensures the selection of the actual pore shapes while guaranteeing minimal noise interference. Therefore, the nonlocal means filter shows a good performance in identifying pore structures (red areas) in CT images when rational thresholds are set, and thereby was employed for the CT image denoising in this study.

2.3.2. Image Recognition and Segmentation

Image segmentation is an essential step for the 3D reconstruction of rock samples, which involves converting a gray-scale multiphase image into two or more unique well-defined phases. In this study, an interactive threshold segmentation approach was employed, in which segmentation was implemented by selecting one or more gray values from the image pixels as the threshold values. Such an approach can be regarded as a binarization process in essence. Image segmentation can be achieved by setting two thresholds T1 and T2, as illustrated in Equation (2):
g x , y = 0 ,                   f x , y T 2   or   f x , y T 1 1 ,                   T 1 f x , y T 2
where f(x, y) represents the initial gray level of the pixels (x, y), and g(x, y) represents the gray level of the pixels after binarization. Gray levels of pixels between the lower threshold T1 and the upper threshold T2 are considered as pores marked with 1, while pixels ≥ T2 or ≤T1 are considered as the matrix or minerals marked with 0. A rational threshold value is crucial for accurate segmentation. By comparing with the experimentally tested porosity, careful and repetitious trials were conducted to find proper upper and lower thresholds. For sandstone, there is an obvious difference in gray values between minerals and pore structures; thus it is easy to find the proper thresholds to identify and segment pore-skeleton structures effectively. In contrast, coal is a typical pore-fracture medium, and gray values of the narrow fractures do not significantly differ from that of the surrounding matrix. Consequently, the interactive threshold segmentation approach alone is insufficient to adequately identify the fracture structures in coal samples. Hence, a joint approach combining the binary segmentation and the manual edition of the new label field was adopted for the coal samples in our work (as illustrated in Figure 5). In this approach, the pore structures were segmented by the interactive threshold, while the fracture structures were extracted by the manual edition. Afterwards, the 3D pore-fracture structure of coal samples were obtained by combining the separately segmented images and subsequently taking the union set of extraction fields. Based on the segmentation results, the 3D pore structures were labeled and analyzed.

3. Results and Analyses

3.1. Micro-Failure Characteristics

The 2D CT slices shown in Figure 6 and Figure 7 give visual evidence of the effect of LN2 cooling on the micro-failure characteristics inside the rocks. Herein, we converted the original gray-scale CT images into color images to better identify the micro-failure structures. In these images, the light red color corresponds to low gray value, representing highly radioactive minerals, while dark blue corresponds to high gray value, representing the pore-fracture structures. Note that coring and CT scanning caused numerous defects and scanning shadows, resulting in inconsistent image sizes of dry sandstone S1# and dry coal rock C1#. However, this does not affect our ability to accurately obtain representative pore structure images. This is because, under the condition of ensuring representativeness, the scanning size required for coal samples is smaller than that for sandstone samples (as shown in Figure 3). Before LN2 cooling, the sandstone is tight with just a few isolated small pore spaces. Mineral particles in the rock are closely cemented. Nevertheless, noticeable microcracks and large pore spaces can be found in the sandstone after LN2 cooling, as shown in Figure 6, substantiating that LN2 cooling induces remarkable damage in the rocks and changes the pore structures significantly. At the micro level, there are two typical failure modes for sandstones subjected to LN2 cooling, i.e., intergranular cracking and innergranular cracking. As compared to the intragranular cracks, it seems that the sandstone prefers to fail in the intergranular cracking mode. Most micro-failures preferentially occur at the boundaries between mineral particles, and the number and the size of intergranular cracks are greater than those of intragranular cracks. Hence, intergranular cracking is considered to be the dominant failure mode in the damage of rocks subjected to LN2 cooling, which is consistent with previous studies [32]. In contrast to the sandstone, pore structures are less developed in the coal, as shown in Figure 7, and there are no obvious cemented grains. The damage to coal samples is characterized by the failure of bedding structures, which act as weak planes during LN2 cooling. Rapid cooling of LN2 could induce great stretching thermal stress, which promotes the initiation of the microcracks in the rocks, thereby improving the permeability of coal and the stimulation performances.

3.2. Pore Morphology and Spatial Distribution

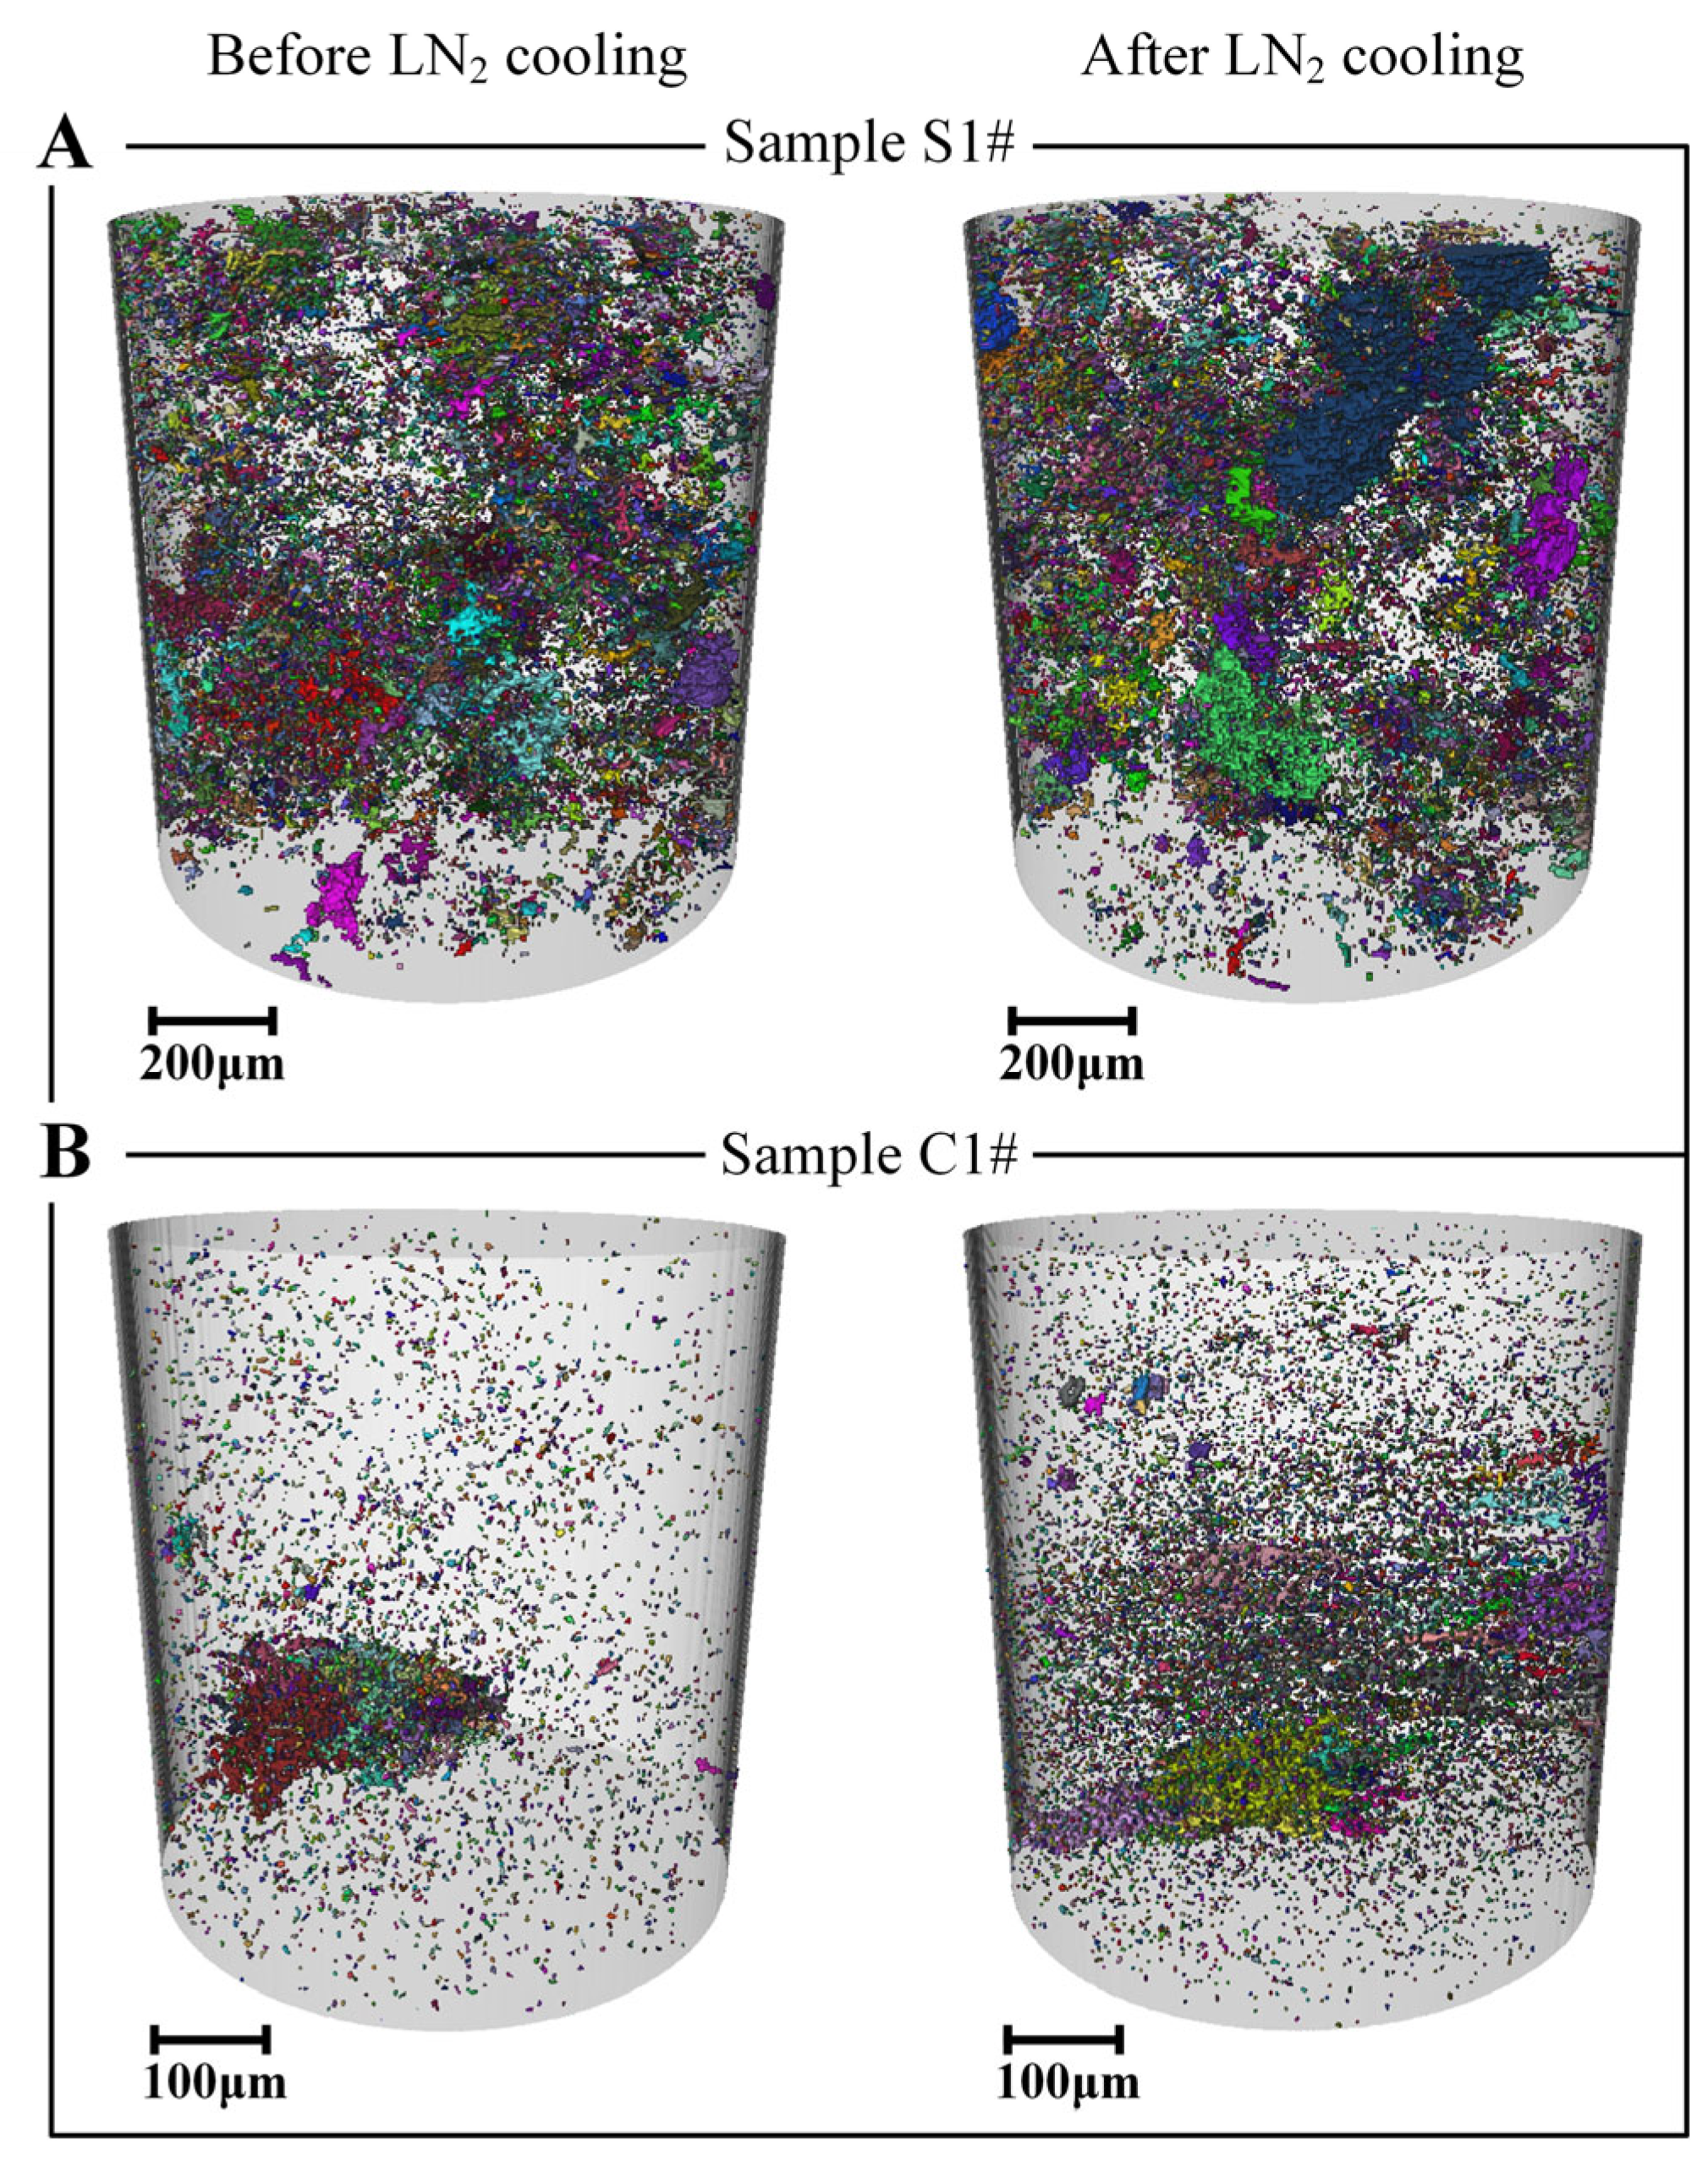
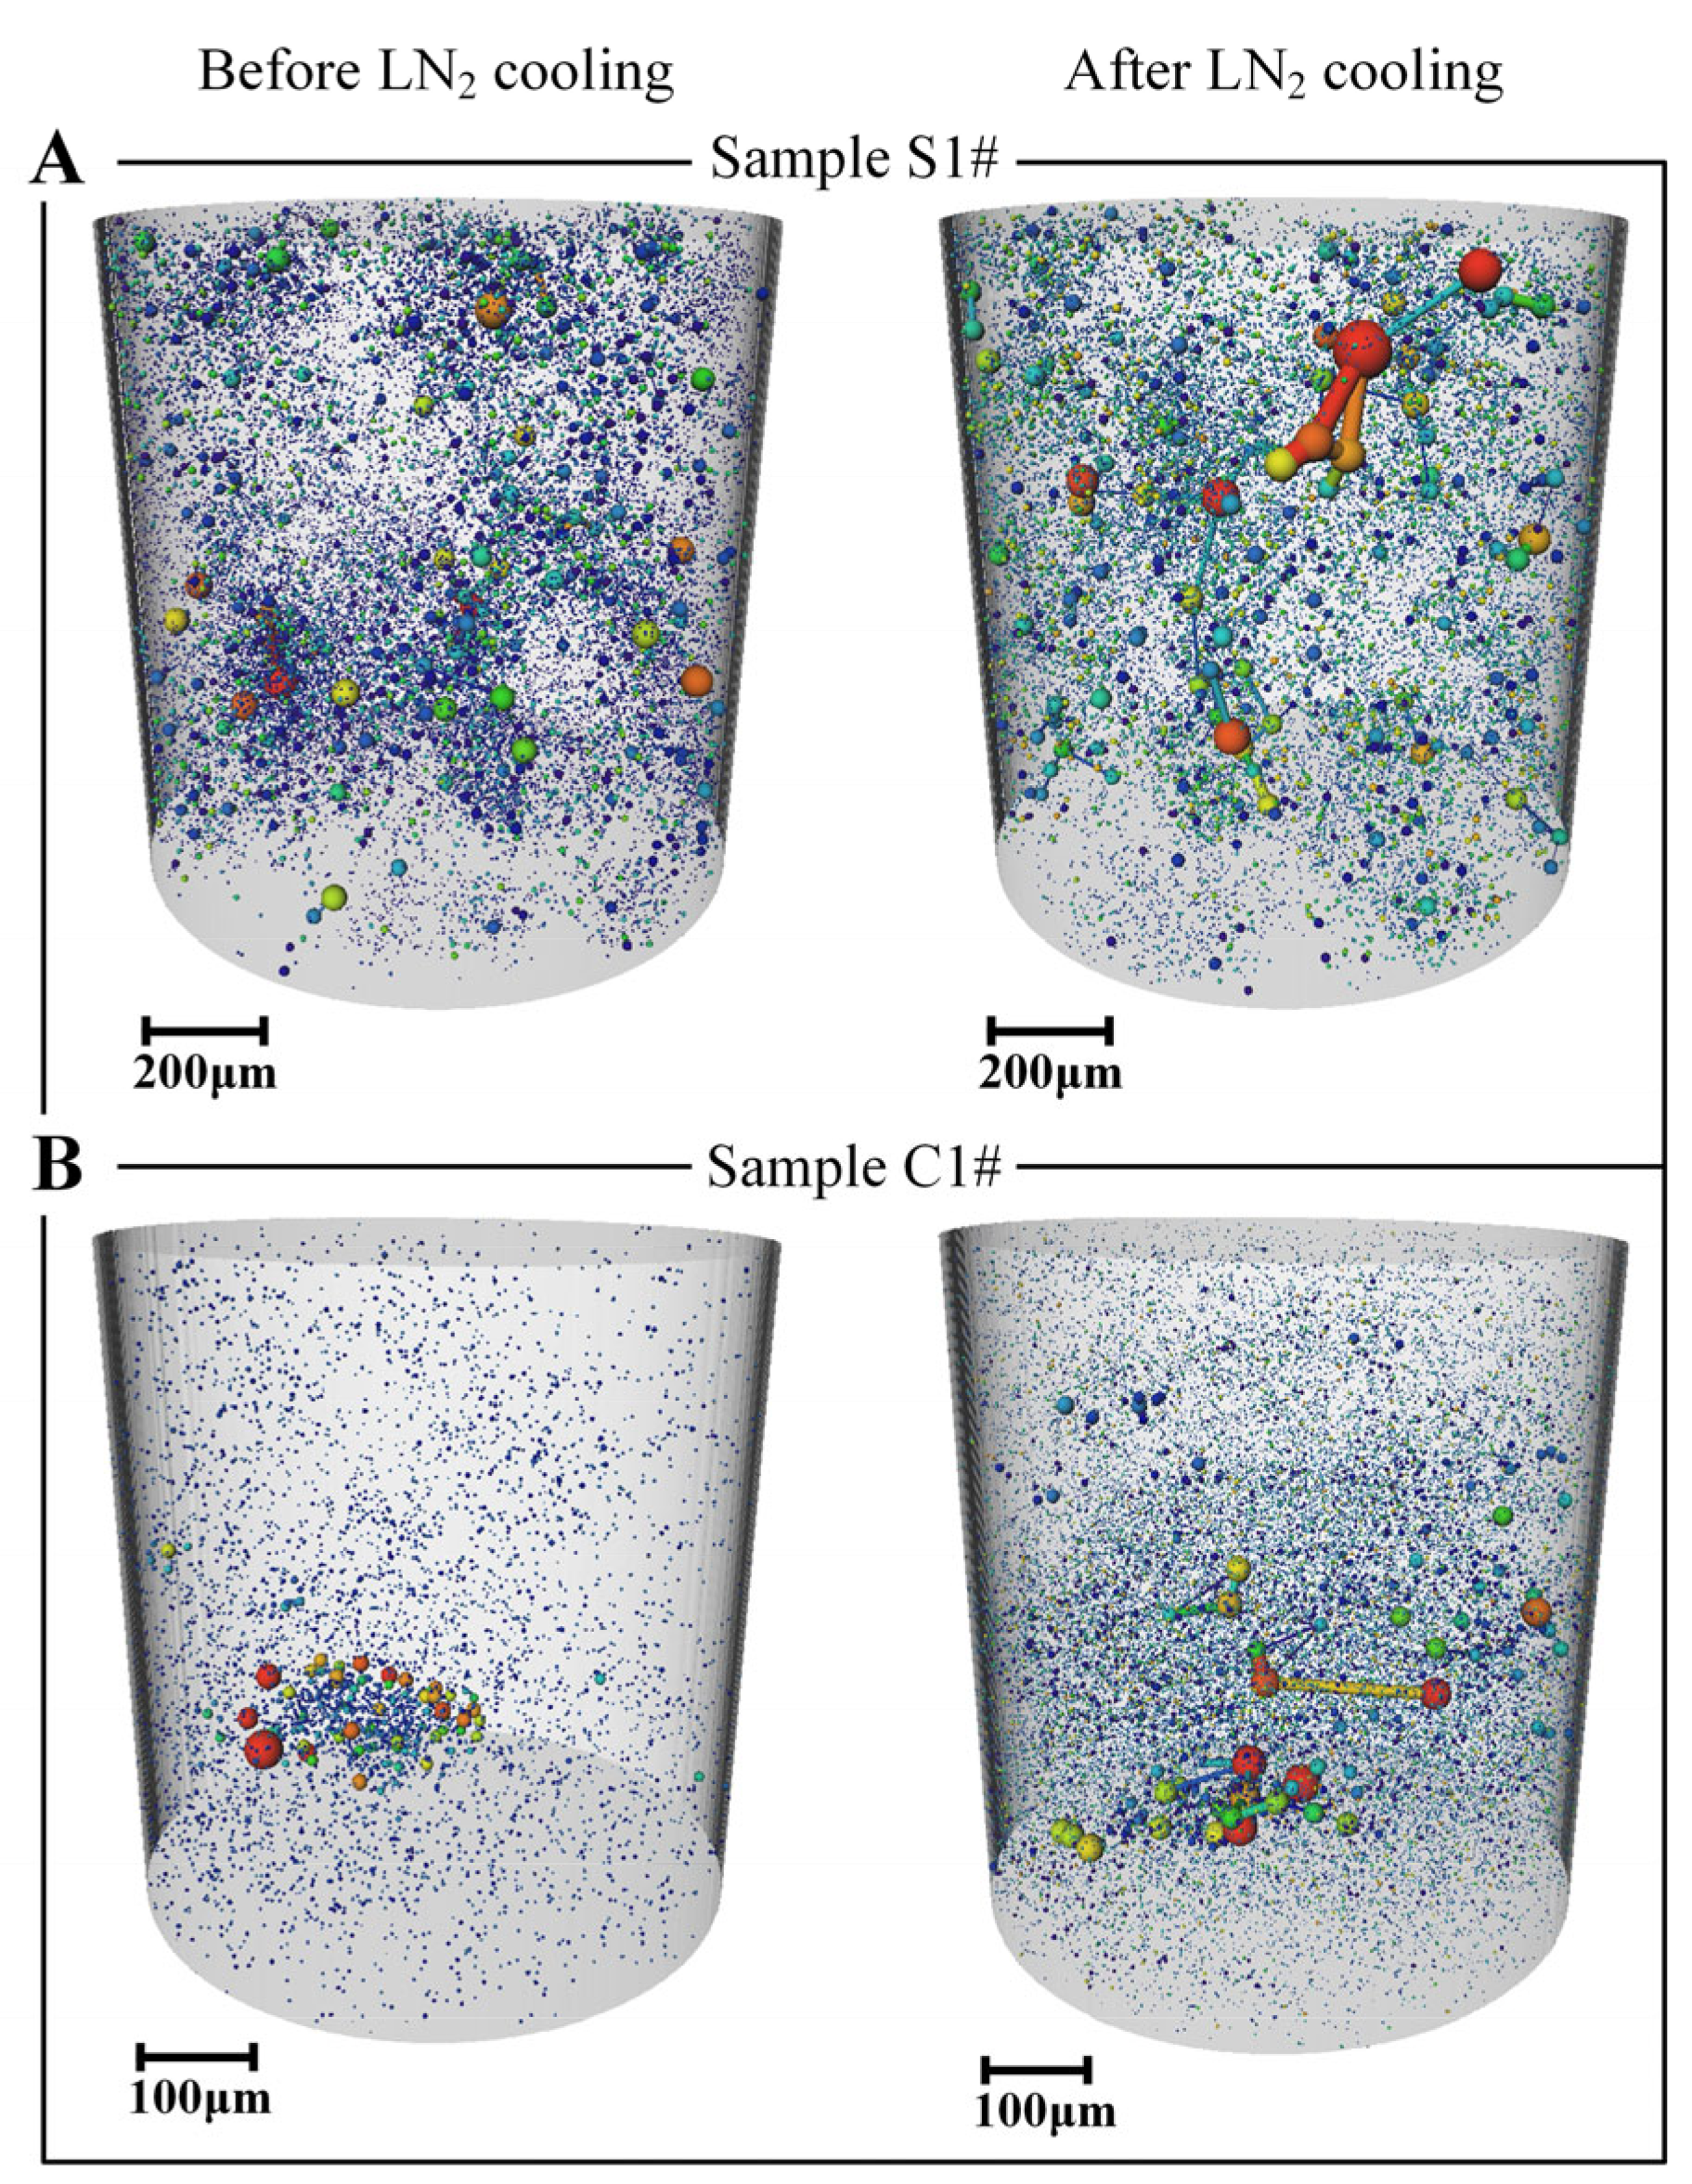
Figure 8A,B show the 3D pore structures of dry sandstone S1# and dry coal C1# before and after LN2 cooling treatment. It can be seen that the pores of the original dry sandstone S1# are relatively small and distributed in a scattered manner in space, as shown in Figure 8A. After LN2 cooling, pore size increases significantly, and the distribution of pores becomes denser, forming more large-sized connected strip-shape and bundle-like pore structures. Unlike the sandstone, the microstructures of the original coal sample C1# shown in Figure 8B give priority to isolated pores at the microscale, with worse connectivity. The number of micropores increases greatly after LN2 cooling, and many adjacent isolated small pores are connected to form pores with larger sizes. New fractures develop along the bedding planes in the coal, which play a major role in enhancing the permeability. Although LN2 cooling can induce damage in both sandstone and coal samples, the characteristics of pore morphology and spatial distribution changes are quite different.
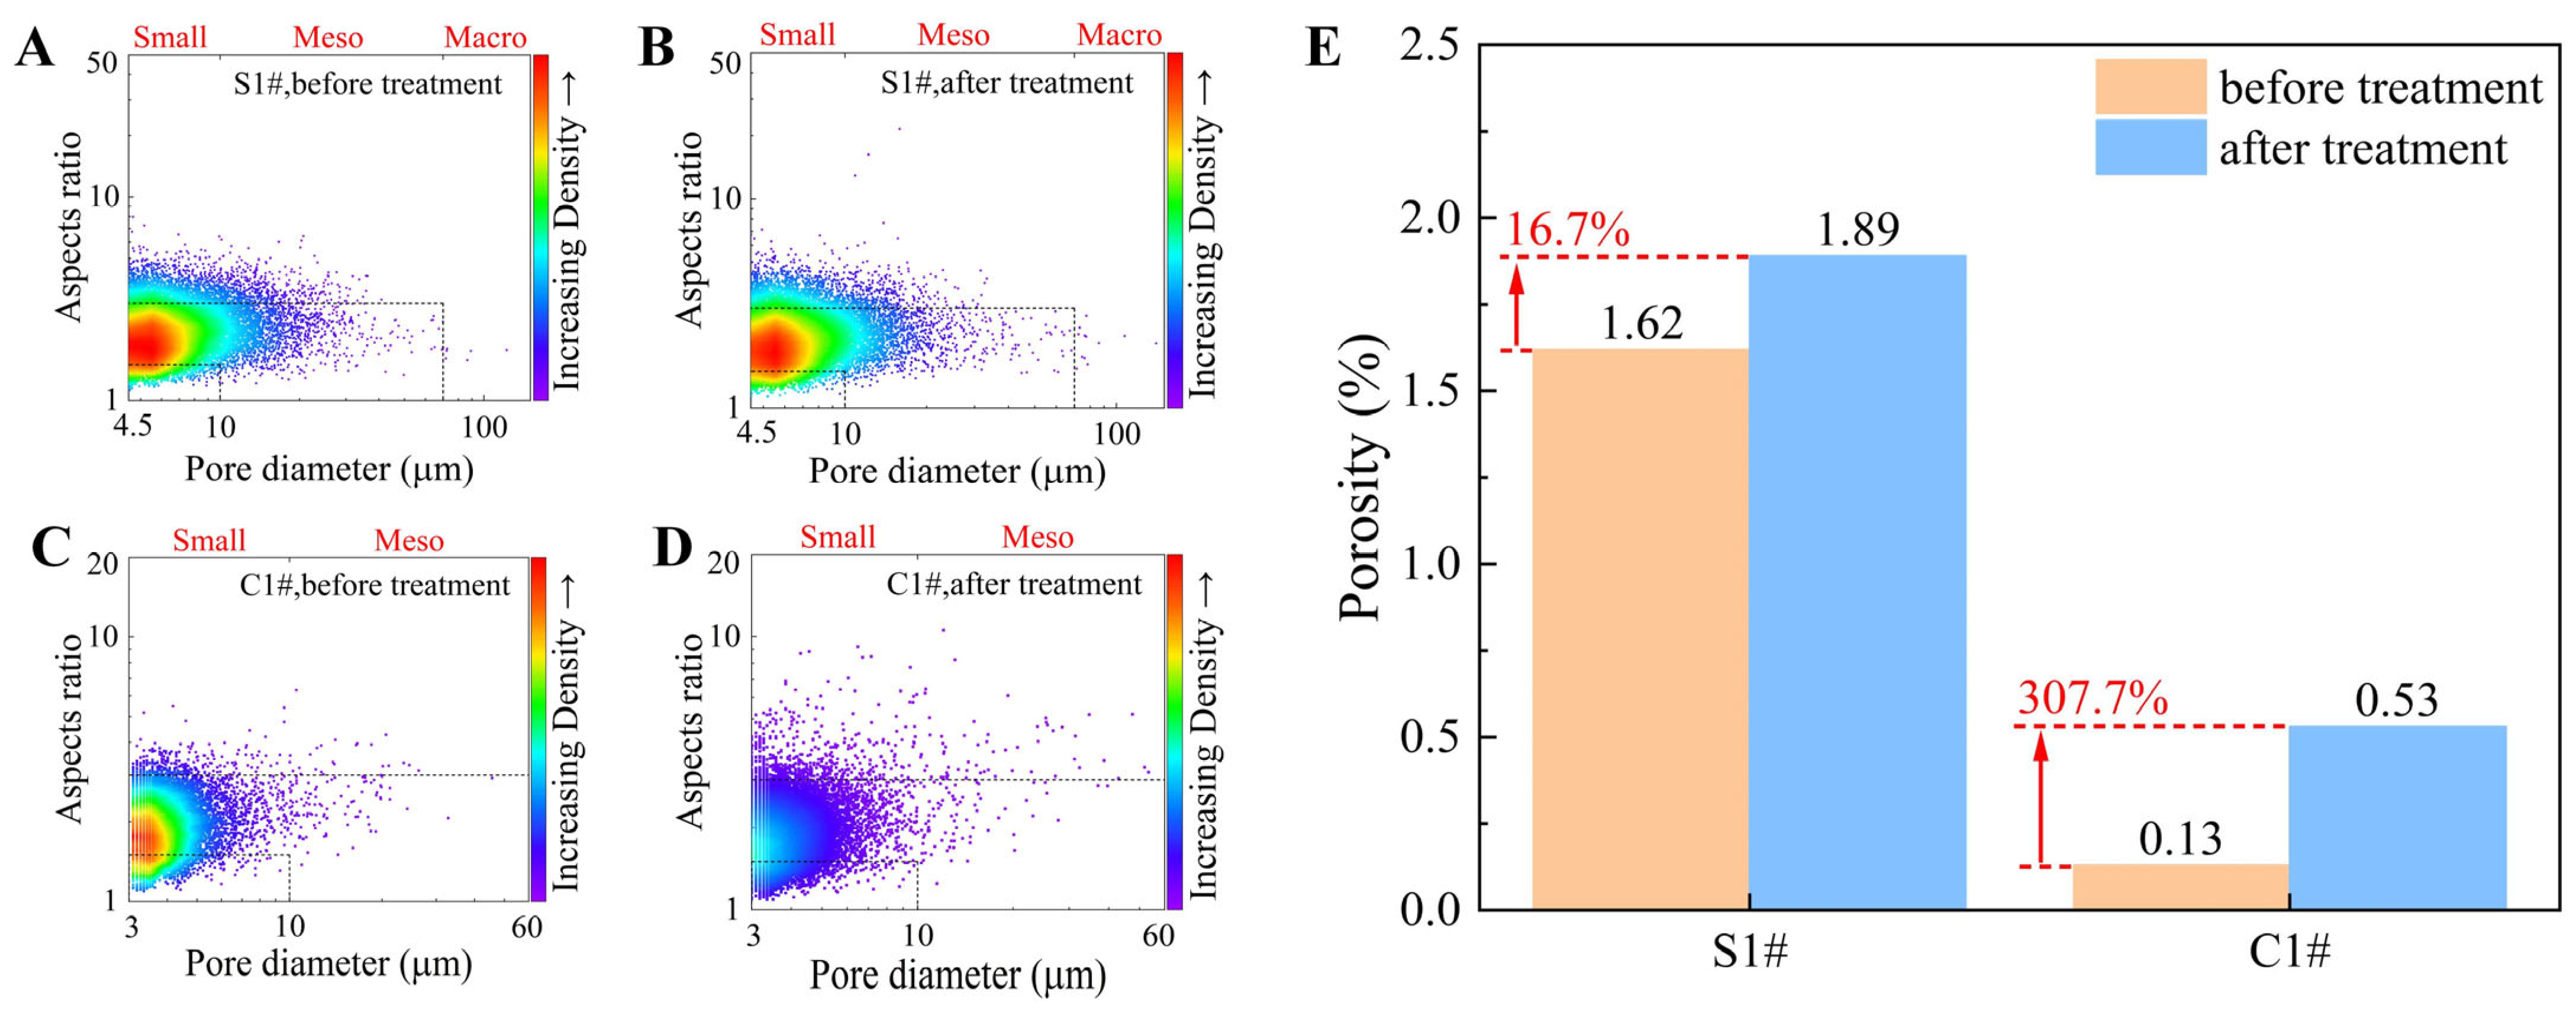
To determine the changes in pore morphology and spatial distributions, we counted the feature parameters of pores before and after LN2 cooling, and the scatter distributions of pores at different sizes against the aspect ratio are plotted in Figure 9A–D. Herein, the color representation in the plot is used to indicate the distribution intensity of data points. Specifically, the red area represents the density of the data distribution, and the blue area represents the sparseness of the data distribution. The aspect ratio is defined as the ratio of the maximum Feret diameter to the minimum Feret diameter. Generally, the geometric morphology of pores can be divided into three categories based on the aspect ratio, i.e., strip-shape pores with a ratio > 3, bundle-like pores with a ratio 1.5~3 and a spherical pore with a ratio 1~1.5. The 3D spatial distributions of pores are generally characterized by the connected strip-shape and bundle-like pores, accompanied with many spherical isolated pores. LN2 cooling expands the distribution range of pore diameter and aspect ratio significantly for both rocks. Before cooling, the aspect ratio of sandstone and coal is distributed in the range of 1~8 and 1~6.5, respectively, while the aspect ratio’s range grows to 1~22 and 1~11, respectively, after LN2 cooling. Coal, by contrast, is more sensitive to LN2 cooling, with more noticeable changes in pore size and aspect ratio. This fact can be inferred from the statistic porosity data illustrated in Figure 9E. After LN2 cooling, the porosity of coal sample C1# grows by 307.7%, which is 291% higher as compared to that of sandstone S1#.
To better identify the changes in pores at different scales, we categorized pores as small pore (<10 μm), mesopore (10~70 μm) and macropore (>70 μm) based on the equivalent diameter in this work. According to the scatterplots shown in Figure 9A–D, small pores with an equivalent diameter < 10 μm are distributed with the greatest density for both sandstone and coal, substantiating that the number of isolated small pores is the greatest for both rocks. The sandstone S1# has relatively larger pores, with mesopores accounting for the highest proportion (60.7%) as shown in Figure 10A. There are a few macropore structures with equivalent diameters over 100 μm, and the maximum pore size reaches 130 μm. In contrast, coal is dominated by small pores with a diameter < 10 μm, accounting for 74% in volume proportion. After LN2 cooling, the volume proportion of macropores in sandstone increases by 15%, while the proportion of small pores and mesopores shows a relative decrease, indicating that LN2 cooling promotes the expansion and connection of small pores to create more macropores or fractures. For coal sample C1#, although the number of small pores grows remarkably after LN2 cooling, the volume proportion decreases. The mesopore shows a slight growth in volume proportion. Regarding the pore morphology, original sandstone and coal samples are dominated by bundle-like pore structures, with both frequency and volume proportion accounting for more than 80% as shown in Figure 10B. The volume proportion of bundle-like pores increases greatly in the sandstone S1# after LN2 cooling, while other pores decrease. Unlike the sandstone, the micro-failure of coal C1# behaves similarly to the remarkable growth of strip-shape pores with an aspect ratio > 3 and isolated spherical pores with an aspect ratio 1~1.5, substantiating that LN2 thermal shock not only creates new pores but promotes the nucleation and convergence of primary pores to generate fracture structures.
Shape factor and fractal dimension are important feature parameters for porous materials such as rocks, and are commonly used to describe the regularity and roughness of pore morphology. The closer the shape factor is to 1, the more regular the pore structure. When the shape factor deviates from 1, the pore presents a more irregular and more complicated shape with more extended branches. Small pores generally present a relatively regular shape with a low shape factor, while large pores and fractures have greater shape factors. Figure 11A shows the volume proportions of pores with different shape factors in dry sandstone and coal samples before and after LN2 cooling. The distribution curves of pore shape factors are basically the same, ranging from 0 to 3000. There are three noticeable peak intervals at the shape factor ranges of 0~1.5, 3~5 and 10~3000, and pores with the shape factor between 0 and 1.5 account for the largest proportion. After LN2 cooling, the proportion of pores with a shape factor >100 increases sharply, suggesting a growing trend in the irregularity of pore structures. For coal sample C1#, in addition to the pores with a shape factor > 100, the proportion of pores with shape factor 0~1 is multiplied greatly after LN2 cooling, further indicating the generation of new micropores with a regular shape. Figure 7B contrasts the 3D fractal dimensions of sandstone S1# and coal C1# before and after LN2 cooling. The fractal dimension is calculated by Equation (3) [59]:
l n V r V m a x = 3 D ln d 3 D l n ( d m a x )
where D is the fractal dimension; Vr and Vmax represent the pore volume and the total pore volume with the equivalent diameter of the pore smaller than r, respectively; Vr/Vmax is the cumulative pore volume fraction (in %); and dmax is the maximum pore diameter (in μm). The fractal dimension is an effective indicator to evaluate the roughness of pore surfaces, indicating how complex the surface is and how it fills the space. The less smooth the surface is, the bigger the fractal dimension. As shown in Figure 11B, the fractal dimensions of pores grow by 11.7% and 0.87% after LN2 cooling for C1# and S1#, respectively. It seems that the influence of LN2 cooling on the fractal dimensions of sandstone is not remarkable when compared to that of coal, which agrees with previous analysis.
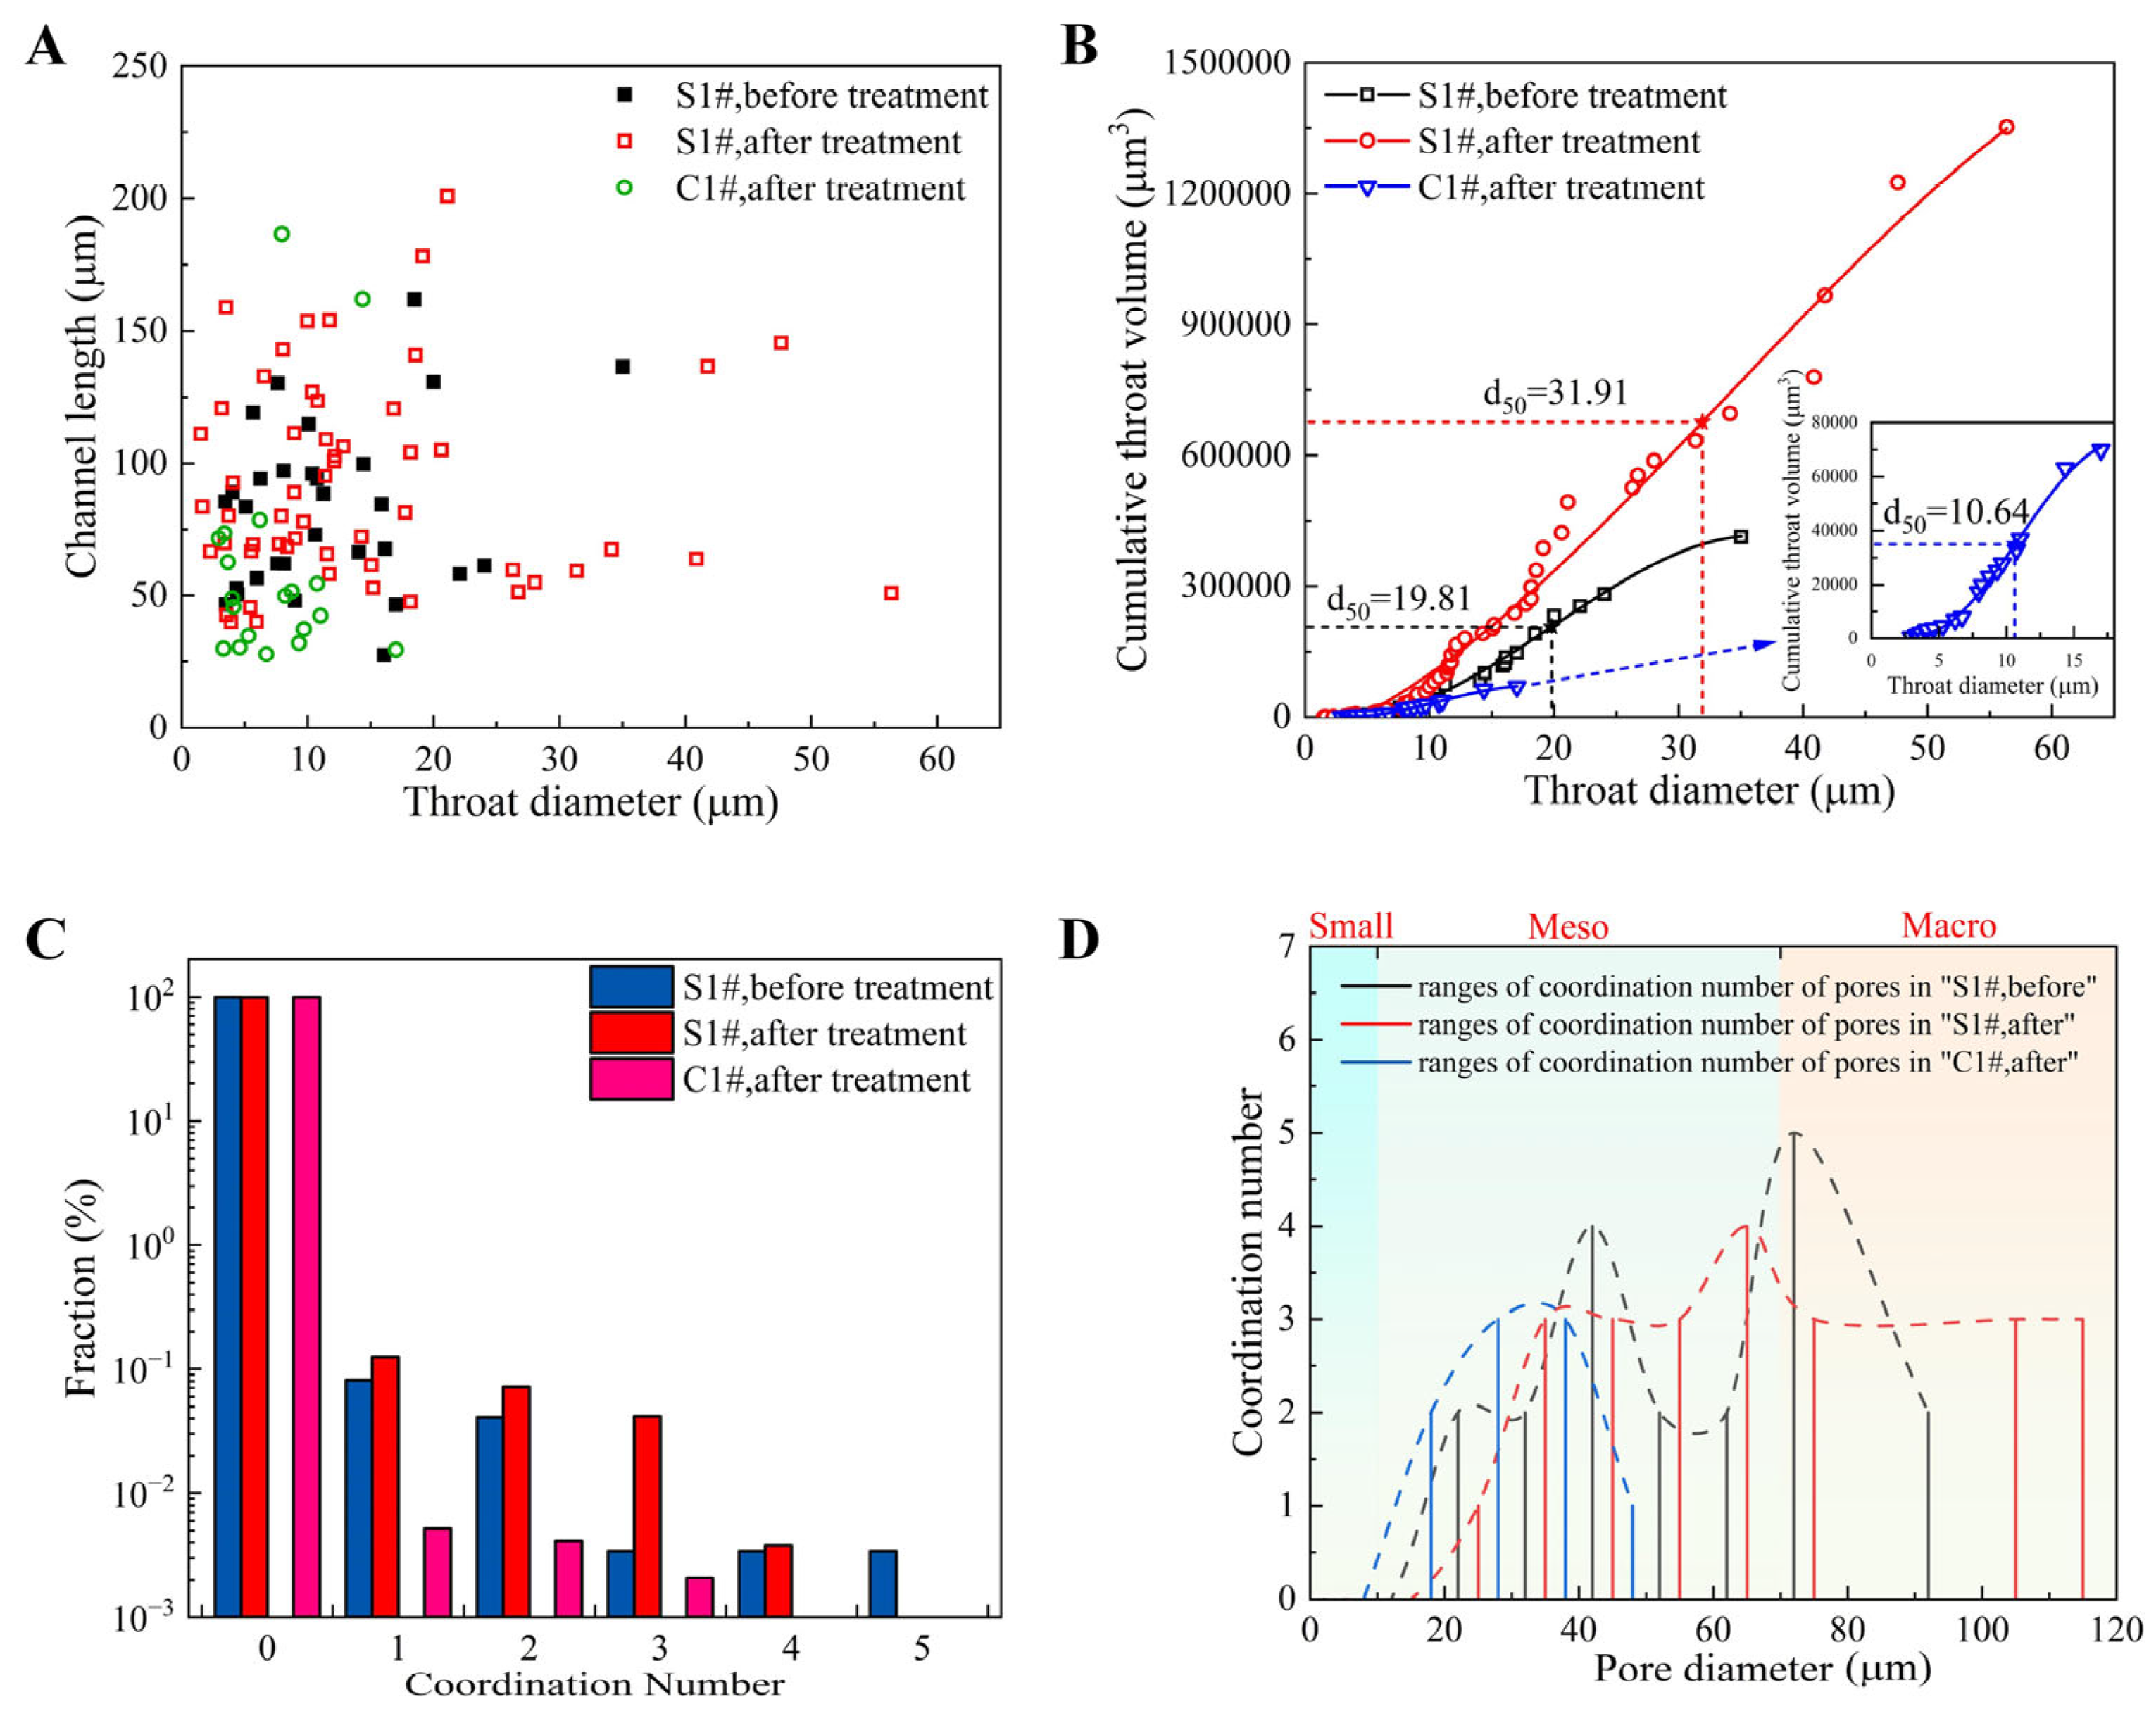
LN2 cooling has a great impact on pore connectivity and corresponding transport probability. To quantitatively characterize the connectivity of pores, the Pore Network model (PNM) was employed to reconstruct pore–throat structures, as shown in Figure 12 (more detailed information of PNM in Appendix A). Branching or endpoints of the network were defined as pores, while the lines connecting them were referred to as throats. Throats in the sample S1# are small before cooling, and there are no throat structures in the sample C1#. After cooling, more large-sized pores and throats appear in the rocks, indicating that the permeability and connectivity improves significantly. According to the statistical data shown in Figure 13A, the diameter and channel length of throats in the sandstone are mainly distributed in the range of 3~35 μm and 27~165 μm before LN2 cooling. However, after LN2 treatment, the maximum diameter and channel length expand to 57 μm and 209 μm respectively, and the median throat diameter d50 of sandstone increases by 29.8% as illustrated in Figure 13B. Regarding the coal sample C1#, although no throat structures were found in the original sample, remarkable micro-failures were induced by LN2 cooling, creating throats with a median diameter of 10.64 μm.
In addition, pore connectivity can also be directly reflected by coordination number. Figure 13C shows the comparison of the proportion of pores with different coordination numbers. The isolated pores with a coordination number 0 occupied the majority for both rocks, accounting for more than 99%. There is a negative correlation between the proportion and the coordination number of pores. Compared with the sample C1#, S1# has greater pore connectivity and a higher value of coordination number. After LN2 cooling, the proportion of connected pores with the coordination number ≥ 1 increases by 25.3% in sample S1#, and the maximum value of the coordination number in sample C1# increases from 0 to 3, further verifying the effect of LN2 cooling on the enhancement of pore connectivity. Figure 13D plots the variation in the coordination number against pore diameter. It is indicated that most small pores are isolated with a coordination number of 0 regardless of rock type, while bundle-like mesopores and stripped macropores have a coordination number ranging from 0 to 4 and 0 to 5, respectively. Although the effect of LN2 on the coordination number is not consistent for different types of pores, the coordination number and connectivity of pores is always positively correlated to the scale of the pore.

3.3. The Influence of Pore Water

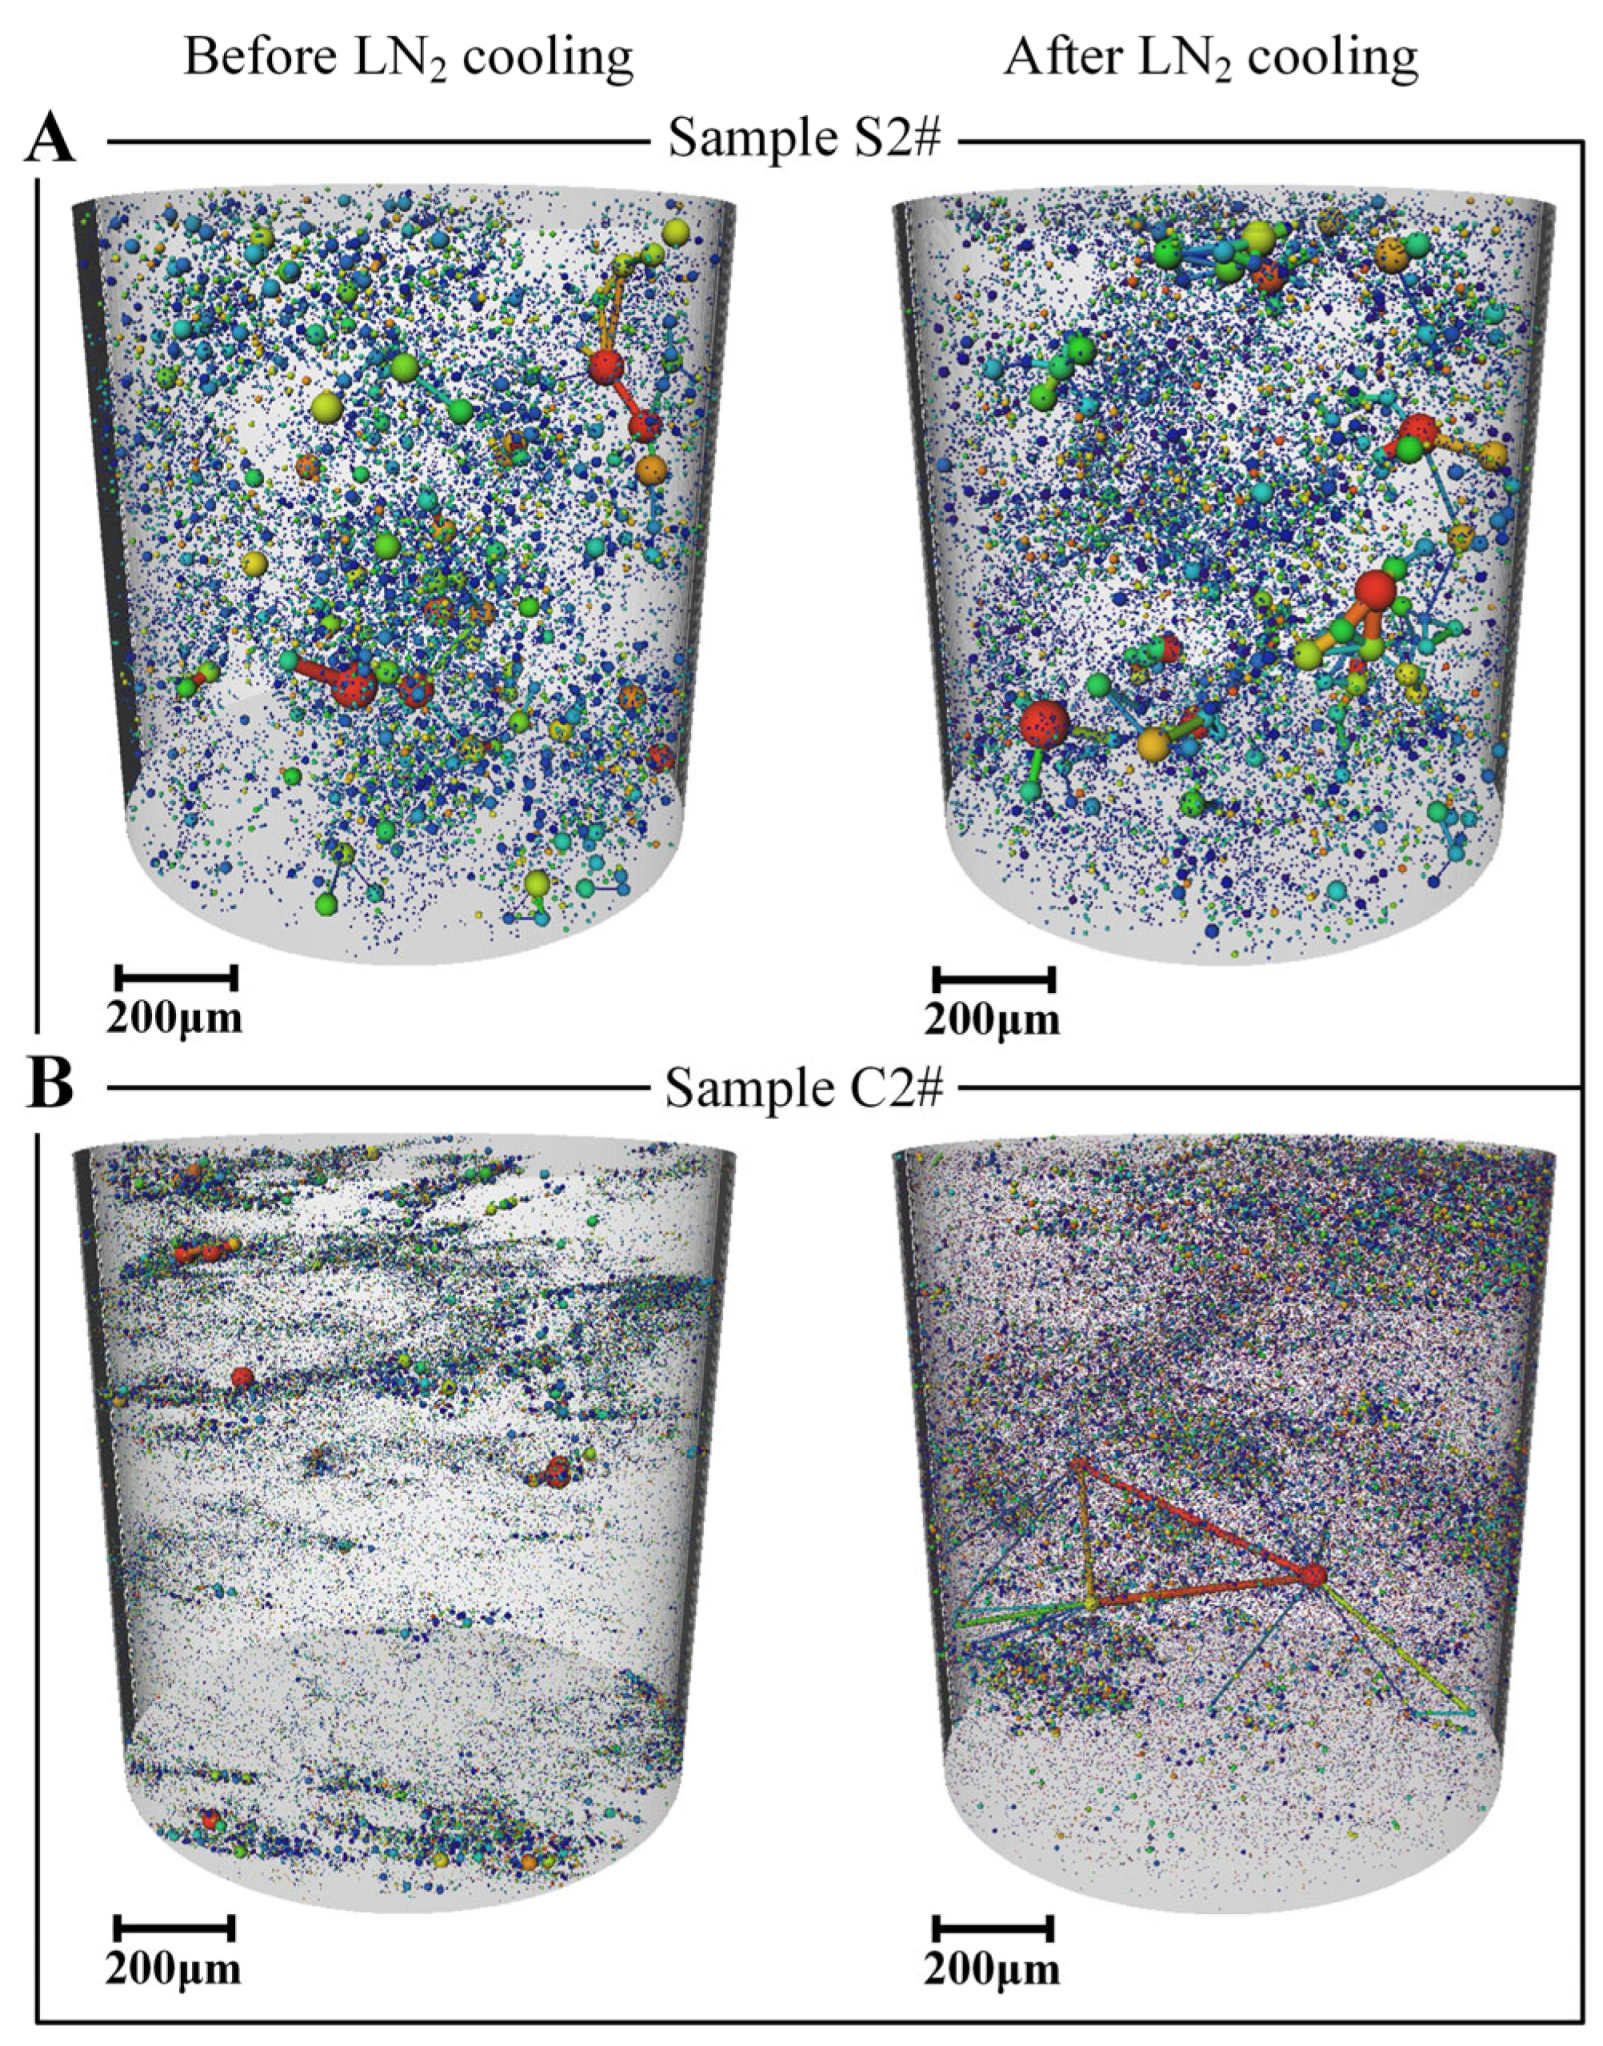
Water saturation is an important factor influencing the damage of rocks subjected to LN2 cooling. Rock is a porous medium that is generally saturated by water under in situ conditions. Due to the freezing and expansion of pore water at low temperature, the damage degree and pore structure evolution characteristics of water-saturated rock under liquid nitrogen cooling are significantly different from those of dry rocks. We reconstructed and compared the 3D pore structures of water-saturated sandstone S2# and coal C2# before and after LN2 cooling, as shown in Figure 14A,B. Similar to the dry rock samples, the water-saturated rock samples also show a dramatic growth in the number and size of pores after LN2 cooling. For the saturated coal sample C2#, the damage is significantly enhanced, even creating a fracture extending throughout the entire sample. The length and width of this fracture (as shown in Figure 15) are significantly greater than those of the dry rock sample shown in Figure 7. Moreover, it is noted that the propagation direction of this fracture is basically parallel to the distribution direction of the vein represented in red in the 2D slices, indicating that the fracture preferentially develops along the bedding plane under LN2 cooling.
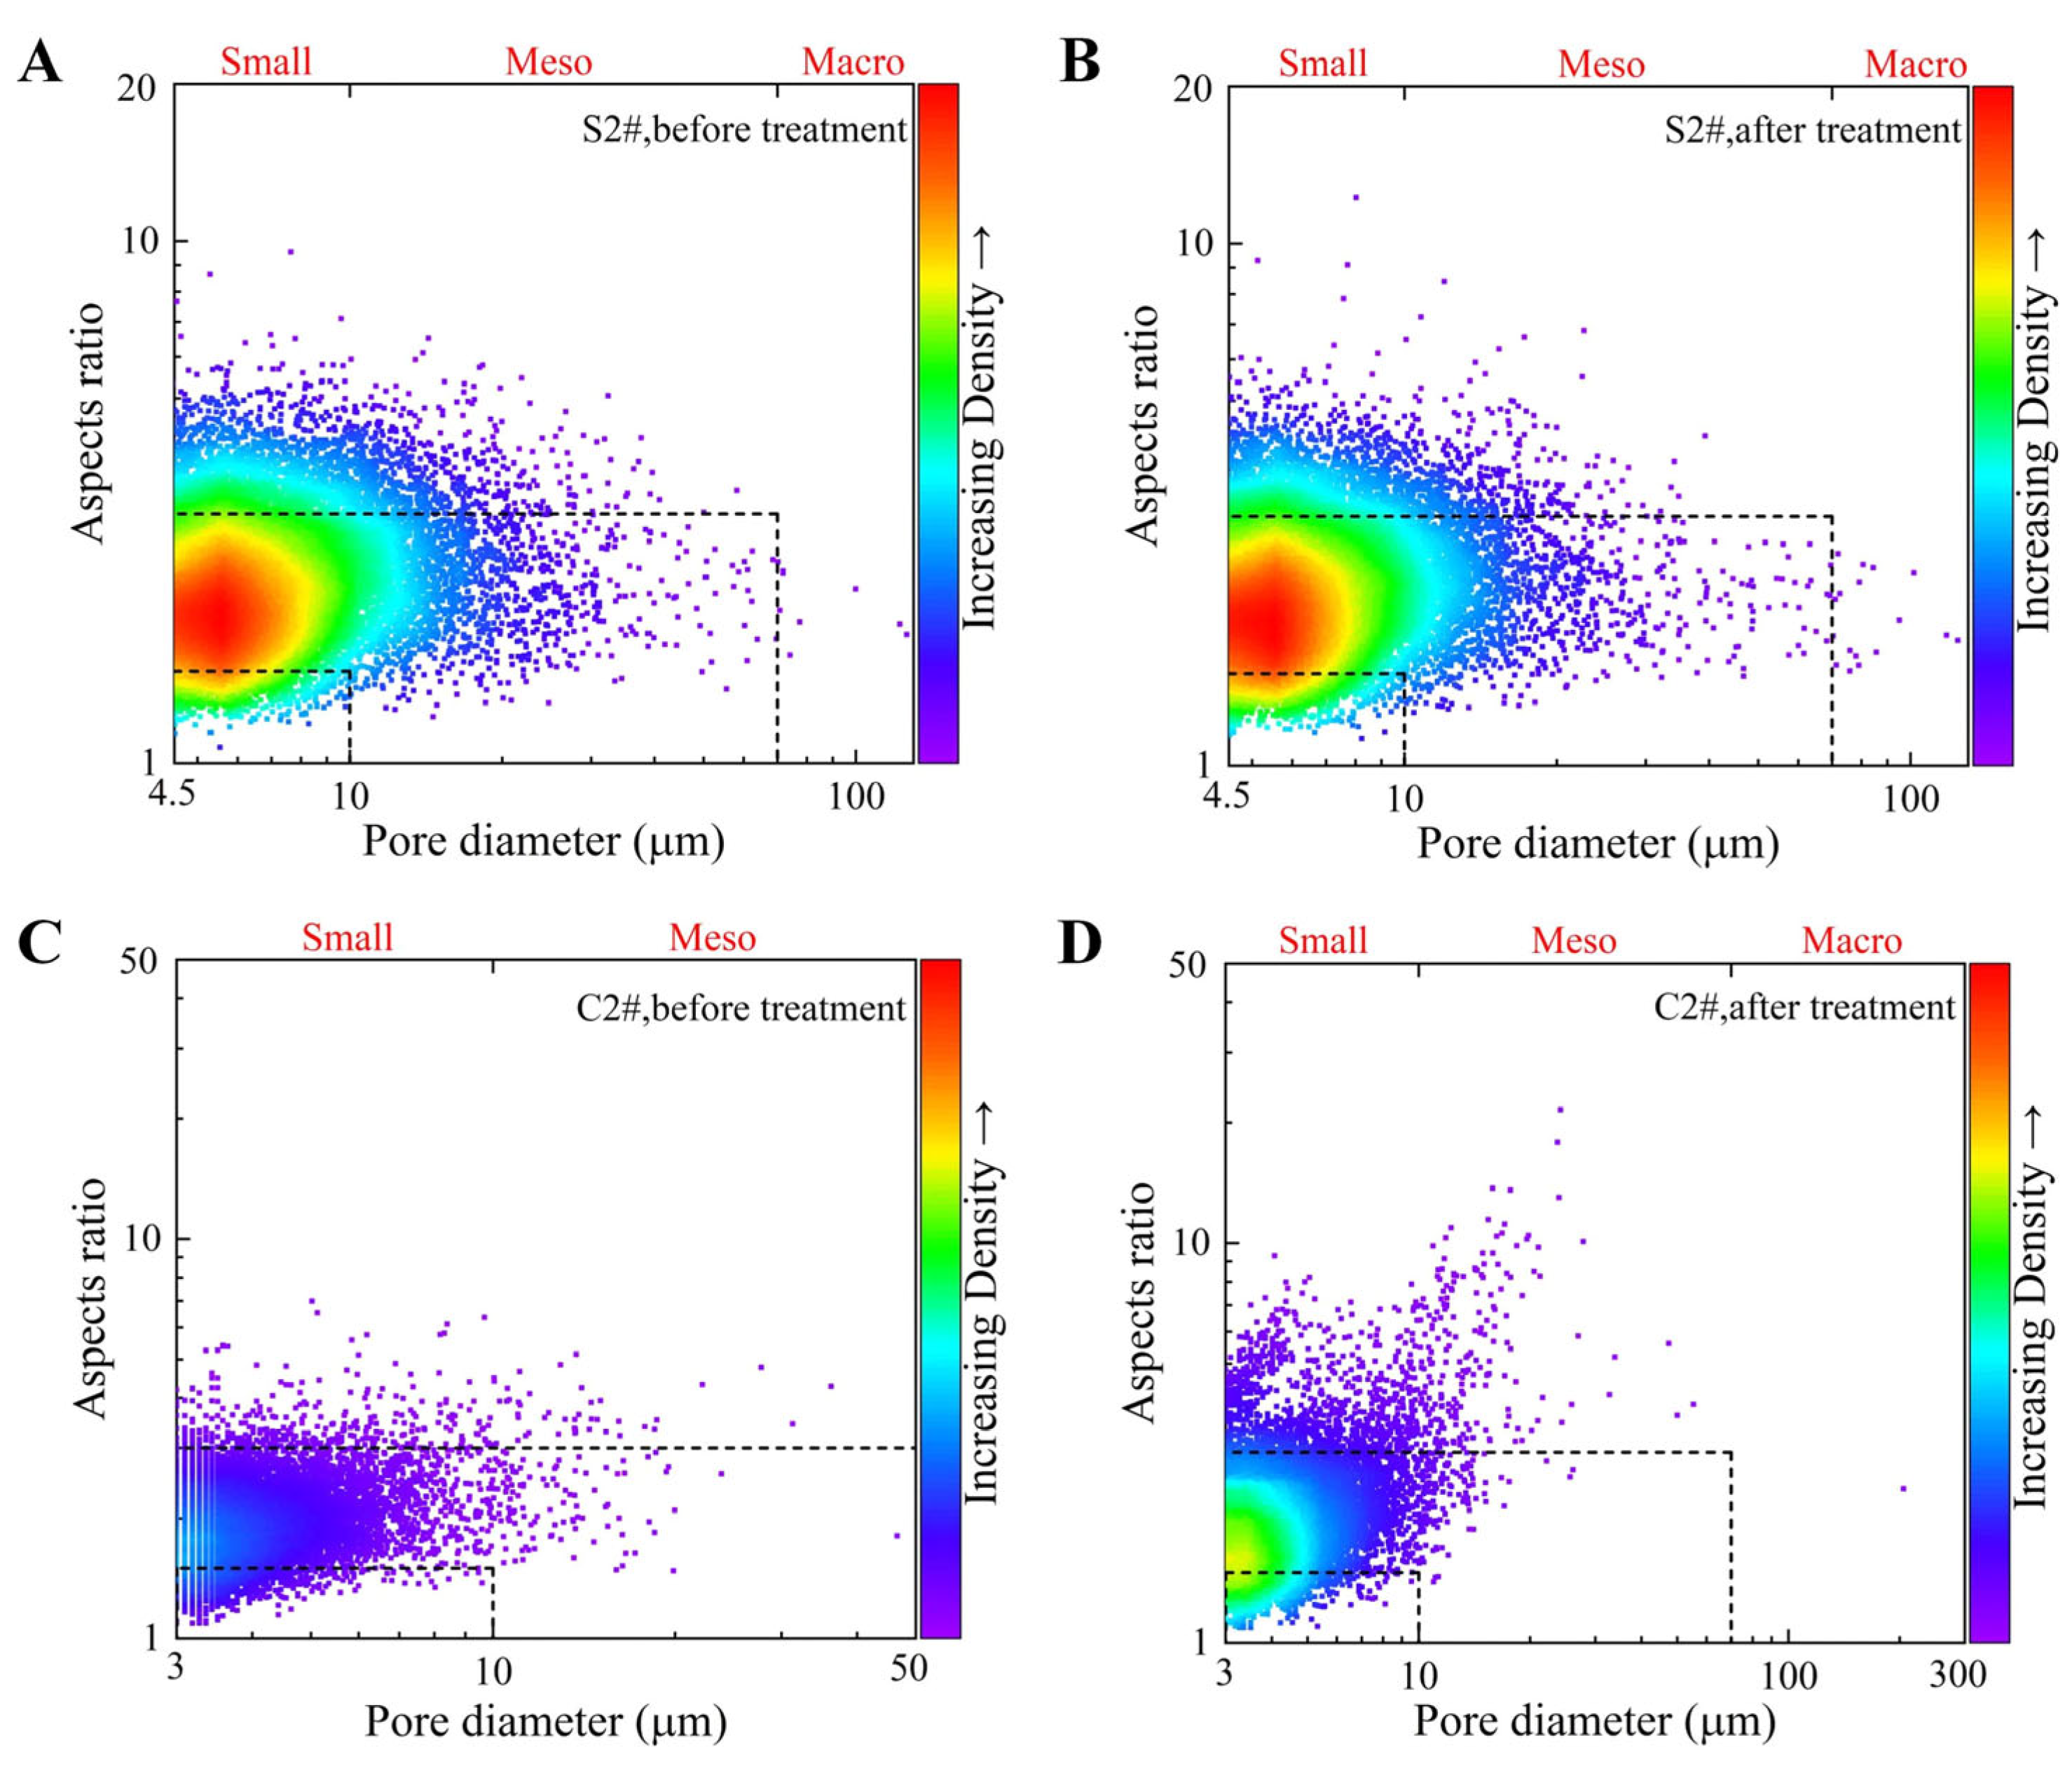
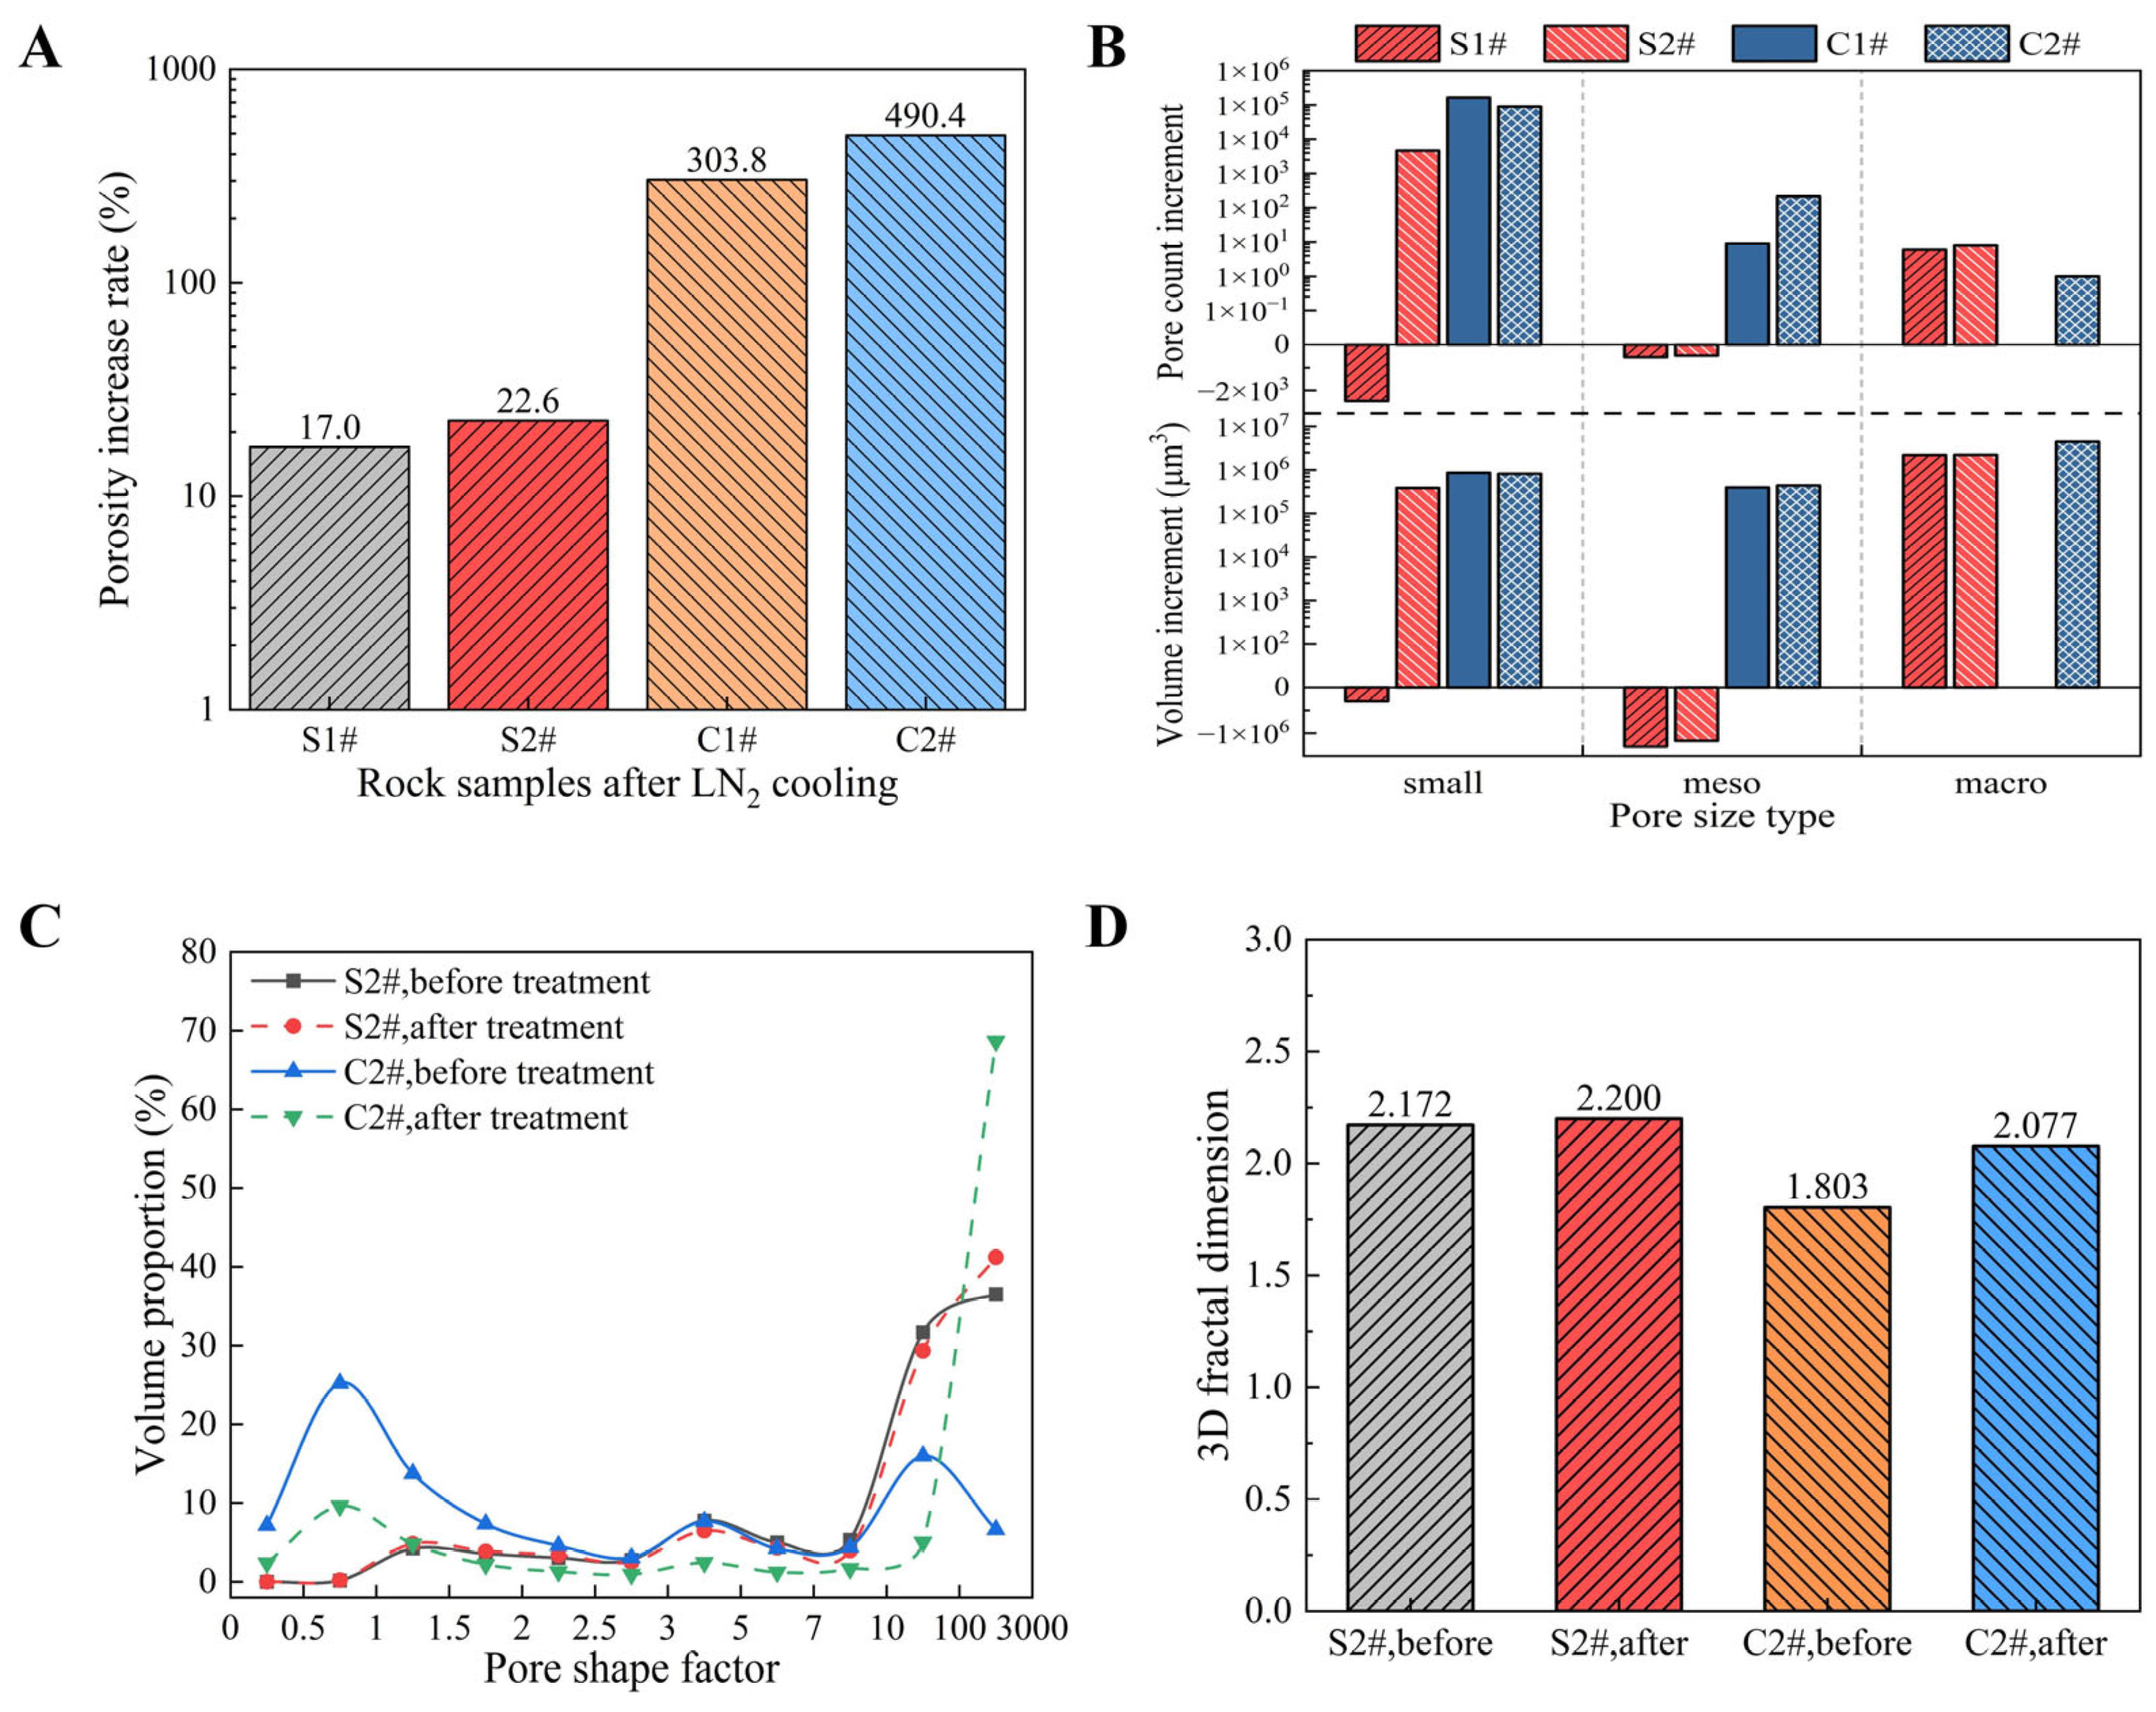
For the water-saturated sandstone S2#, the bundle-like pores with the aspect ratio ranging from 1.5 to 3 account for the majority of the total number, as illustrated in Figure 16. Both the aspect ratio and pore diameter increase dramatically after LN2 cooling. Figure 17A compares the porosity growth of the dry and saturated samples. It is evident that the variation in the pore structure is more significant for saturated rock samples as compared to dry rock samples. It is seen that the porosities of the saturated sandstone S2# and coal sample C2# increase by 22.6% and 490.4%, respectively, which are 5.6% and 186.6% higher as compared to S1# and C1#. Coal is more sensitive to water saturation and subsequent LN2 cooling.
In fact, the effects of LN2 cooling on various types of pores are different under saturated and dry conditions. As shown in Figure 17B, for saturated and dry sandstone, the variation trend of meso- and macropores stays the same. Nevertheless, unlike the dry sandstone C1#, the count of small pores increases drastically, indicating a large number of new pores are created in water-saturated sandstone C2# under LN2 cooling. For both dry and saturated coal samples, small pores and mesopores show an increasing trend after cooling. What differs for dry coal is that some macropore structures larger than 70 microns are formed in water-saturated coal. Although the macropores account for only a small proportion in the total count, the increment in volume proportion is significantly higher than that of other pores. Therefore, the generation of macropores is the main contributor to porosity growth during LN2 cooling. Figure 17C plots the variation in the volume proportion against pore shape factor. Similar to the dry sandstone S1#, the water-saturated sandstone S2# shows an increase in the volume proportion of pores with high shape factors (>100). For coal samples, due to the intrinsic development of bedding planes, the structures of pores and fractures become more complex after cooling, and the volume proportion of pores with a high shape factor (>100) increases significantly. In terms of the roughness of pores and fractures, the fractal dimensions of pores and fractures in saturated rock samples are basically at the same level as that of dry rock samples, as illustrated in Figure 17D. The fractal dimension grows after LN2 treatment, and the growth rate of coal samples C2# is remarkably higher than that of sandstone samples S2#, which is consistent with that of dry samples.
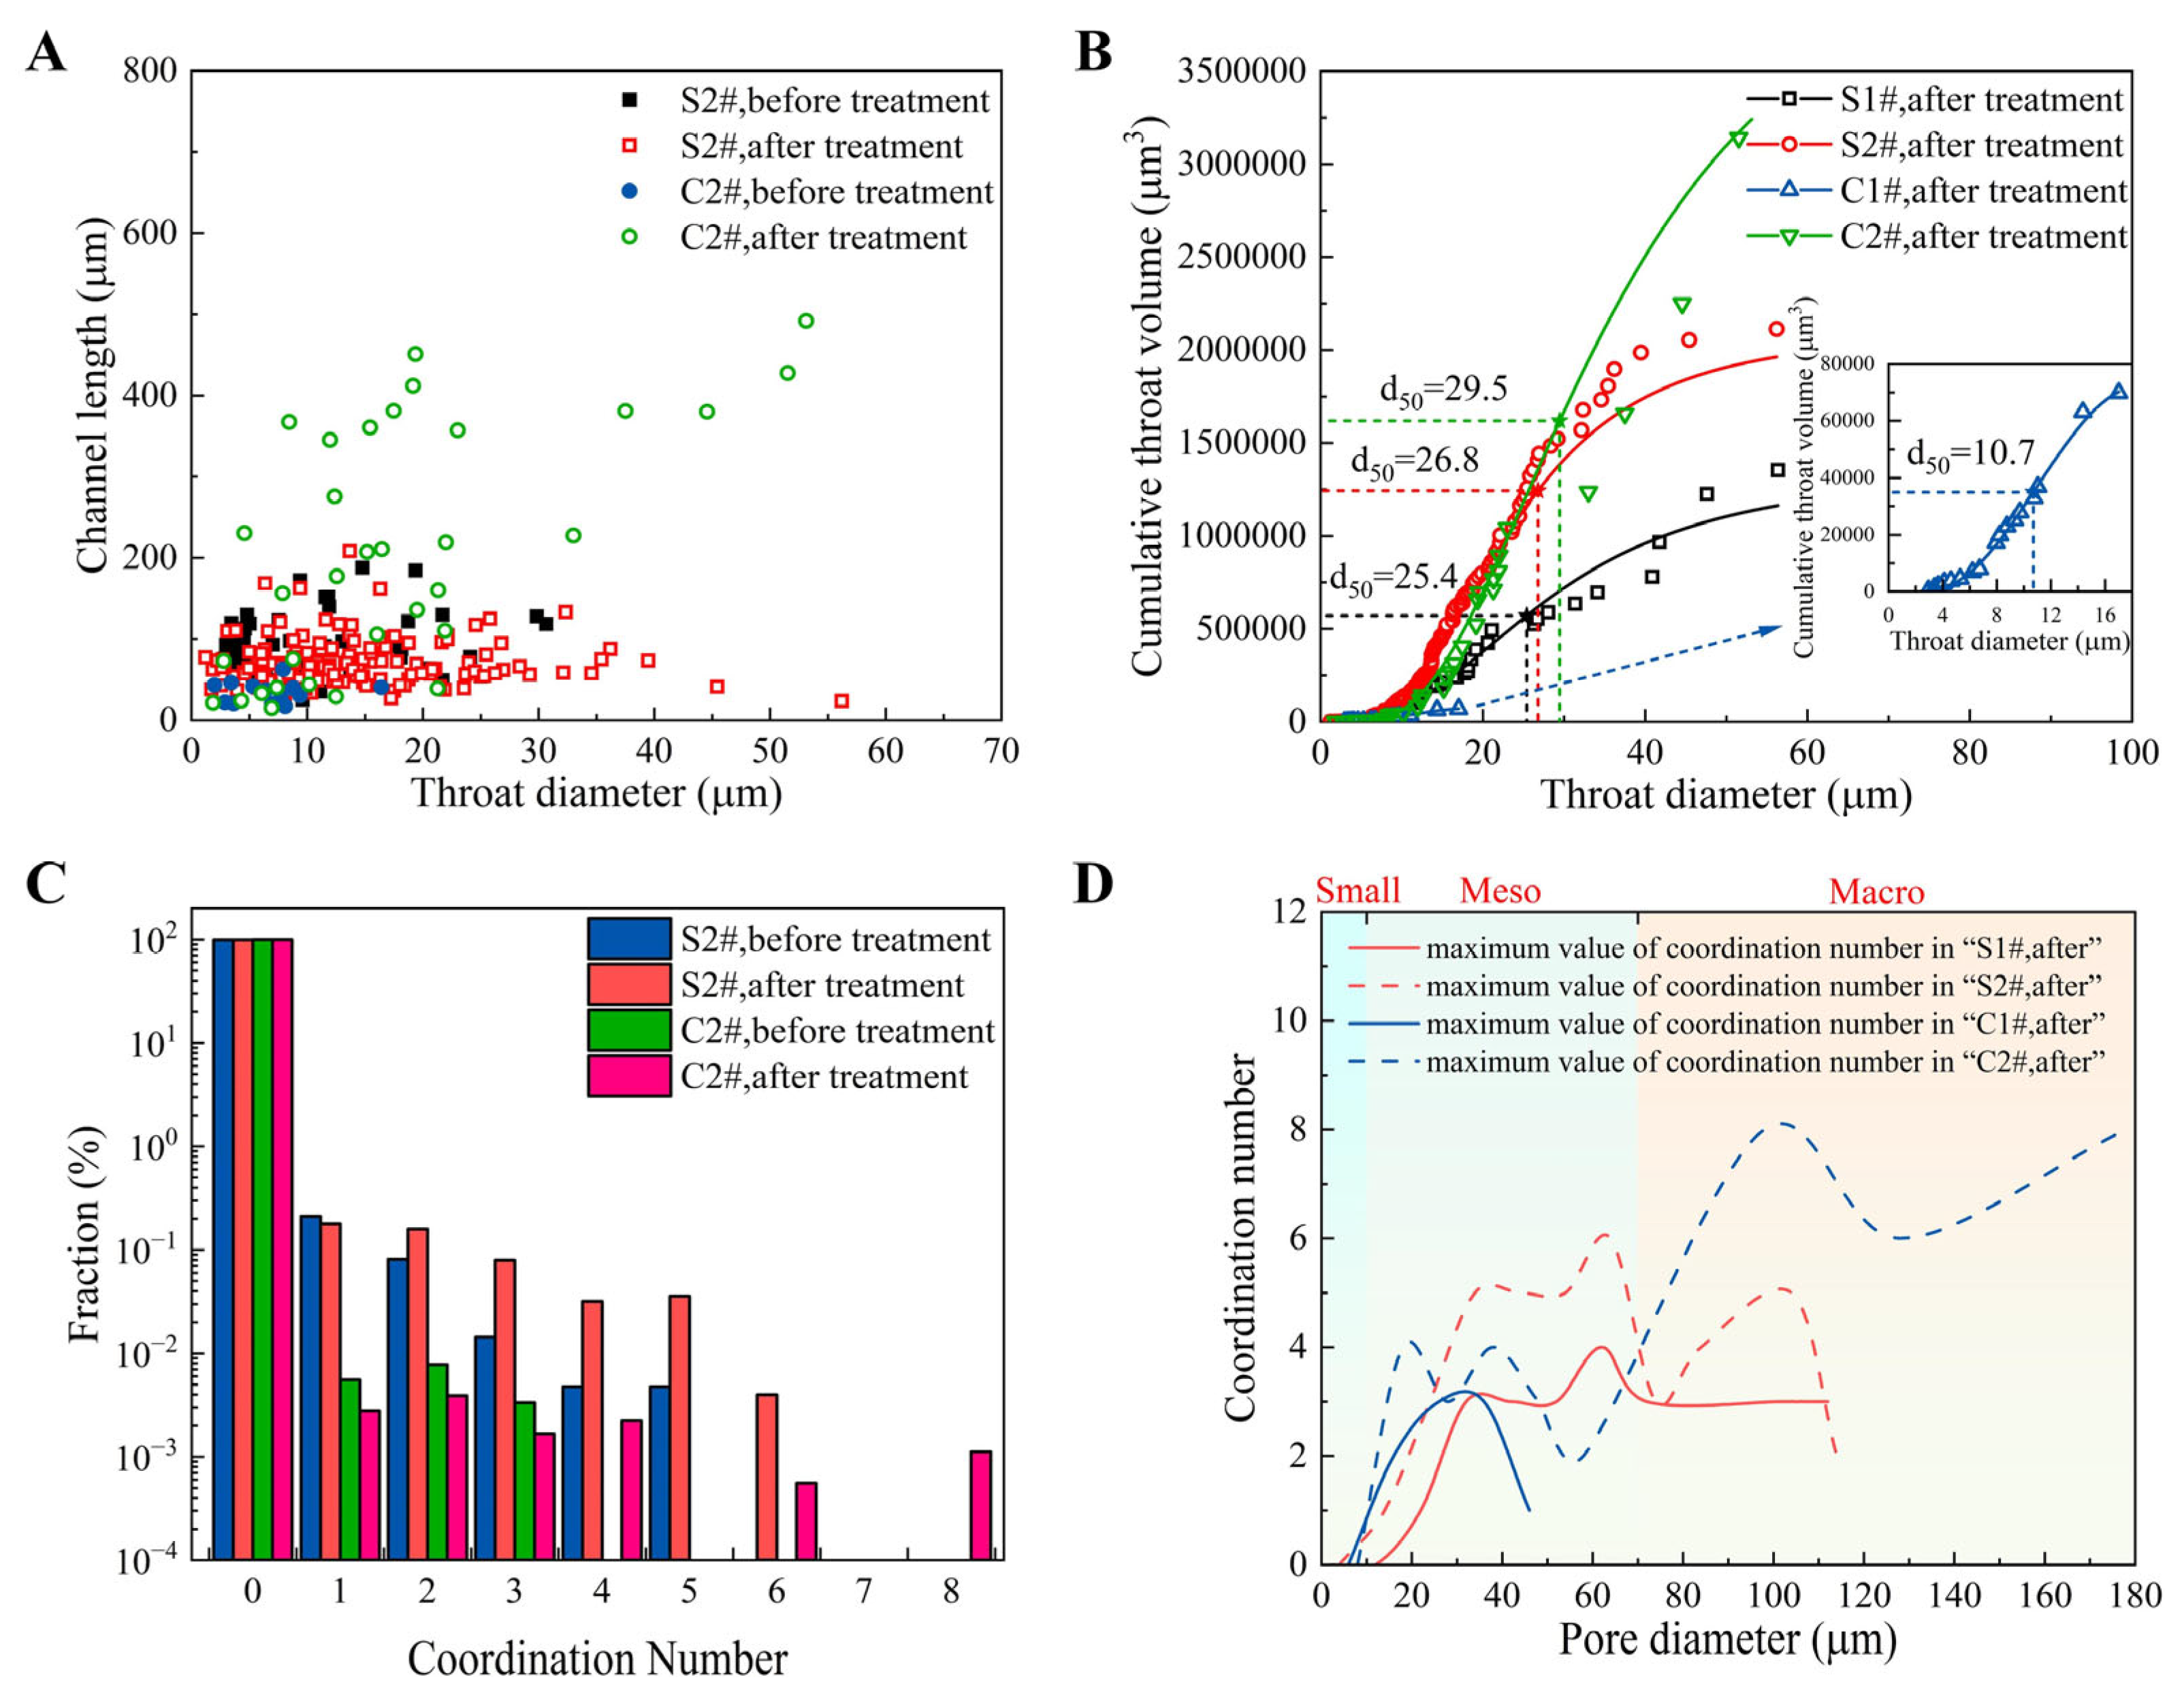
Figure 18 shows the pore–throat structures of water-saturated sandstone S2# and coal C2# before and after LN2 cooling. It is seen that the number and size of throats formed in saturated rocks are significantly larger than those formed in dry rocks. According to the statistical data shown in Figure 19A,B, after LN2 cooling, the maximum diameter and channel length of throat structures in S2# increase by 83.9% and 11.2% respectively, and the median throat diameter d50 increases to 26.8 μm as illustrated in Figure 19B. For the water-saturated coal sample C2#, the maximum throat length and median diameter reach 492 μm and 29.5 μm, which are 1.66 times and 1.77 times higher than those of dry coal sample C1#, respectively. Regarding the coordination number, as shown in Figure 19C,D, although the proportion of pores with coordination number 1 in sandstone and coordination number 1–3 in coal reduces slightly after LN2 cooling, the number of these pores does not actually decrease. The reduction in the proportion of pores with a low coordination number is mainly attributed to the dramatical growth in pores with a high coordination number. LN2 cooling has a more significant impact on the water-saturated coal. The maximum coordination number of sample C2# increases from 3 to 8, which is much higher than those of C1# and S2#. Moreover, for both the dry and water-saturated rock samples, small pores always exist in an isolated pattern with a coordination number of 0. Meso- and macropores of C2# and S2# have a greater coordination number than C1# and S1# do, further substantiating that pore water can aggravate the damage to rocks during LN2 cooling and enhance the pore connectivity significantly.

4. Discussion

Thermal stress is the primary cause of micro-failures during liquid nitrogen cooling. Rock is a mixture composed of various minerals. Since these minerals generally differ from each other in thermo-physical properties and mechanical properties, thermal deformations between neighboring minerals are mismatched in the LN2 cooling process, thereby resulting in thermal stresses, destroying the cementations and generating inter-granular cracks along mineral boundaries. Differing from intergranular cracking, intragranular cracking is attributed to the strong anisotropy of physical properties of one particular mineral. The difference in the thermo-physical properties along different axes causes a deformation mismatch inside the mineral particles and thereby creates intragranular cracks. Quartz is a crucial mineral, which plays a dominant role in the micro-failures during LN2 cooling [24]. Since quartz has a significantly higher thermal expansion coefficient as compared to other minerals, stronger local thermal stresses can be induced at the boundaries between quartz and other minerals. Hence, intergranular cracks are preferentially developed at quartz boundaries. Moreover, the thermal expansion coefficient of quartz vertical to the c axis is about two times higher than that parallel to the c axis [21]. Intra-granular cracks can also be found in quartz minerals. According to the XRD test results illustrated in Table 1, the sandstone sample used in our work is rich in quartz mineral, accounting for more than 50% of its composition. This explains why the microstructures of the sandstone have a significant response to LN2 cooling.
Nevertheless, unlike sandstone, the cracking of bedding planes induced by thermal stress is the primary failure mode of coal. During LN2 cooling, the bedding planes act as weak planes due to the poor cementation, and they prioritize initiation and propagation under thermal stress. Since coal generally has lower strength and develops many weak planes, LN2 cooling has a more significant impact on its pore structures, resulting in greater porosity growth and conductivity enhancement as compared to other rocks.
In contrast to the dry rocks, the damage mechanism is quite different for water-saturated rock subjected to LN2 cooling. According to the quantitative analysis in Section 3, LN2 cooling causes greater damage to water-saturated samples, generating more large-sized pores and throats as compared to dry rocks. Rock is a porous medium generally saturated by water under in situ conditions. During LN2 cooling, pore water has a phase transition from water to ice, causing the volume of pore water to expand significantly. Under the atmosphere condition, the volume expansion induced by phase transition can reach 9%. Meanwhile, due to the existence of connected pores and throats in the rock, the frontal ice gradually extends into the core in the freezing process, squeezes the internal pore water, boosts the pore pressure and thereby destroy the cementation between mineral particles. Joint actions of volume expansion induced by phase transition and the boosting pressure of internal pore water should be responsible for the damage aggravation of water-saturated rocks subjected to LN2 cooling.
In summary, we investigated the microstructure evolution of rocks subjected to LN2 cooling, which is a great and fundamental concern of the application of LN2 fracturing. Pore-scale imaging and characterization were performed on tight sandstone and coal specimens subjected to LN2 cooling using computed tomography scanning. Compared with the previous methodologies such as NMR, SEM and physical and mechanical properties tests, this study reveals the internal damage mechanism of rock subjected to LN2 cooling through more intuitive micro-scale evidence. However, although we obtained some new insights into the microscopic mechanism of rock subjected to LN2 cooling, there are still some limitations or shortcomings in this study. For instance, we only studied the sensitivity of rock properties and states to LN2 thermal shock, and obtained the formation applicability of liquid nitrogen fracturing. However, in the field application of LN2 fracturing technology, the parameters such as the cooling treatment time and cycle number of LN2 are critical factors affecting the reservoirs’ stimulation performance. Additionally, due to the high scanning accuracy, this study obtained high-resolution imaging of micro-scale cores in tight sandstone and coal specimens, but the corresponding rock reconstruction volumes are relatively small, and so it is difficult to comprehensively represent the structural features of macro-scale cores. While our study did not cover these aspects, they offer significant guidance for future investigations. In the future, we will further explore the characteristics of rock damage under different LN2 treatment parameters. Furthermore, a multiscale and multicomponent method will be used to reconstruct the macro-scale and high-precision structure of the digital core model. This approach aims to provide valuable insights into the practical application of LN2 fracturing technology.

5. Conclusions

In this paper, we performed a high-resolution μ-CT scanning on sandstone and coal samples before and after LN2 cooling. Three-dimensional pore structures were reconstructed and characterized to analyze the effect of LN2 cooling quantitatively, and rocks in both dry and water-saturated conditions were contrasted to determine the influence of water saturation on pore structure evolution during LN2 cooling. The main conclusions are summarized as follows:
  • LN2 cooling causes rock damage and significantly changes the three-dimensional pore structures of rock. After cooling, both intergranular and intragranular cracking appeared in the sandstone, while macroscopic cracks parallel to bedding appeared in the coal rock. The porosity and connectivity in the rock were greatly improved. As compared to the sandstone, coal is more sensitive to LN2 cooling, with more noticeable changes in pore–throat size, aspect ratio and fractal dimensions. After LN2 cooling, the porosity of coal grows by 307.7%, which is 291% higher as compared to that of sandstone.
  • LN2 cooling has a great effect on the morphology and spatial distribution of pore structures, increasing pore diameter and aspect ratio greatly. There is a growing trend in the irregularity of pore structures after LN2 cooling. The proportion of pores with a shape factor > 100 increases sharply, and more bundle-like and strip-shape pores that are multi-branched are generated, intensifying the complexity and roughness of pores. The fractal dimensions of the pores of sandstone and coal grow by 11.7% and 0.87% after LN2 cooling, respectively.
  • LN2 cooling can enhance the pore connectivity significantly. More large-sized pores and throats appeared in the rocks, the proportion of connected pores with the coordination number ≥ 1 increased by 25.3% in the sample S1# and the median throat diameter d50 increased by 29.8%. The maximum value of the coordination number in the sample C1# increased from 0 to 3, although no throat structures were found in the original sample, creating throats with a median diameter of 10.64 μm after LN2 cooling.
  • Pore water aggravates the damage to rocks during LN2 cooling, improving pore space and enhancing the connectivity significantly. The porosities of the saturated sandstone S2# and coal sample C2# increases by 22.6% and 490.4%, respectively, which are 5.6% and 186.6% higher as compared to dry samples. The meso- and macropores of water-saturated rocks have a greater coordination number than dry rocks. The generation of macropores is the main contributor to porosity growth during LN2 cooling. Although the macropores account for only a small proportion in the total number, the volume proportion increment of them is significantly higher than that of other pores.

Author Contributions

Investigation, K.L. and Z.W.; project administration, R.G. and X.Q.; writing—original draft, W.Z. and P.H.; writing—review and editing, X.W. and Z.H. All authors have read and agreed to the published version of the manuscript.

Funding

This research was funded by National Natural Science Foundation of China, grant number 52020105001, 52192624, and 52204019, the Science Foundation of China University of Petroleum, Beijing, grant number 2462022QZDX005, and the Yunnan Science and Technology Plan Project, grant number 202302AF080001.

Data Availability Statement

Data are contained within the article.

Conflicts of Interest

Author Pengpeng Huang was employed by the company CNPC Engineering Technology R&D Co., Ltd. The remaining authors declare that the research was conducted in the absence of any commercial or financial relationships that could be construed as a potential conflict of interest.

Appendix A

To quantitatively analyze the morphological characteristics of pore structures and the connectivity between pores, the Label Analysis module and Generate Pore Network Model were used to analyze the extracted pore structure in our work. The Label Analysis module can be used to obtain the volume, surface area, pore diameter, shape factor, fractal dimension, number of voxels, etc., individually for each separate particle. The Generate Pore Network Model can output the Pore Network Model (PNM) corresponding to the pore structure. Branching or endpoints of the network were defined as pores, while the lines connecting them were referred to as throats. The PNM can provide some important parameters, such as the number of pores, the number of throats, the coordination number, and the throat length. The significance of each parameter in characterizing pore morphology and spatial distribution is shown as follows:
Porosity: the ratio between the volume of pore structures and the volume of the rock (number of pixels in pore structures/number of pixels in the entire rock).
The volume of pores and throats corresponds to the number of voxels of pores and throats, multiplied by the volume of a single voxel.
Shape factor: This is commonly used to evaluate the complexity of the pore space. When the shape factor approaches 1, it indicates that the shape of the pore is closer to a perfect cube; when the shape factor deviates from 1, it indicates that the shape of the pore is more irregular and more complicated.
Fractal dimension is an indicator to measure and compare the roughness of a surface. The less smooth the surface is, the bigger the fractal dimension. It can also be interpreted as a quantification of how complex the surface is and how it fills the space.
The coordination number is defined as the number of throats connected to neighboring pore bodies.
The throat length is defined as the distance from the pore center to another pore.

References

  1. Qiao, J.; Zeng, J.; Jiang, S.; Feng, S.; Feng, X.; Guo, Z.; Teng, J. Heterogeneity of reservoir quality and gas accumulation in tight sandstone reservoirs revealed by pore structure characterization and physical simulation. Fuel 2019, 253, 1300–1316. [Google Scholar] [CrossRef]
  2. Guo, C.; Xu, J.; Wei, M.; Jiang, R. Experimental study and numerical simulation of hydraulic fracturing tight sandstone reservoirs. Fuel 2015, 159, 334–344. [Google Scholar] [CrossRef]
  3. He, P.; Lu, Z.; Lu, Y.; Huang, Y.; Pan, L.; Ouyang, L.; Zhou, J. Experimental study on fracture propagation and induced earthquake reduction by pulse hydraulic fracturing in shale reservoirs. Gas Sci. Eng. 2023, 110, 204908. [Google Scholar] [CrossRef]
  4. Wu, S.; Ge, H.; Wang, X.; Meng, F. Shale failure processes and spatial distribution of fractures obtained by AE monitoring. J. Nat. Gas Sci. Eng. 2017, 41, 82–92. [Google Scholar] [CrossRef]
  5. Yang, L.; Sheng, X.; Zhang, B.; Yu, H.; Wang, X.; Wang, P.; Mei, J. Propagation behavior of hydraulic fractures in shale under triaxial compression considering the influence of sandstone layers. Gas Sci. Eng. 2023, 110, 204895. [Google Scholar] [CrossRef]
  6. Wang, H. Hydraulic fracture propagation in naturally fractured reservoirs: Complex fracture or fracture networks. J. Nat. Gas Sci. Eng. 2019, 68, 102911. [Google Scholar] [CrossRef]
  7. Liu, C.; Zhao, A.; Wu, H. Competition growth of biwing hydraulic fractures in naturally fractured reservoirs. Gas Sci. Eng. 2023, 109, 204873. [Google Scholar] [CrossRef]
  8. Guo, J.; Liu, Y. Opening of natural fracture and its effect on leakoff behavior in fractured gas reservoirs. J. Nat. Gas Sci. Eng. 2014, 18, 324–328. [Google Scholar] [CrossRef]
  9. Wang, L.; Yao, B.; Cha, M.; Alqahtani, N.B.; Patterson, T.W.; Kneafsey, T.J.; Miskimins, J.L.; Yin, X.; Wu, Y. Waterless fracturing technologies for unconventional reservoirs-opportunities for liquid nitrogen. J. Nat. Gas Sci. Eng. 2016, 35, 160–174. [Google Scholar] [CrossRef]
  10. Lai, F.; Li, Z.; Wang, Y. Impact of water blocking in fractures on the performance of hydraulically fractured horizontal wells in tight gas reservoir. J. Pet. Sci. Eng. 2017, 156, 134–141. [Google Scholar] [CrossRef]
  11. Cheng, Y. Impact of water dynamics in fractures on the performance of hydraulically fractured wells in gas-shale reservoirs. J. Can. Pet. Technol. 2012, 51, 143–151. [Google Scholar] [CrossRef]
  12. Zhang, Q.; Zhang, X.; Sun, W. Hydraulic fracturing in transversely isotropic tight sandstone reservoirs: A numerical study based on bonded-particle model approach. J. Struct. Geol. 2020, 136, 104068. [Google Scholar] [CrossRef]
  13. Duan, W.; Sun, B.; Pan, D.; Wang, T.; Guo, T.; Wang, Z. Experimental study on fracture propagation of hydraulic fracturing for tight sandstone outcrop. Energy Explor. Exploit. 2021, 39, 156–179. [Google Scholar] [CrossRef]
  14. Kalam, S.; Afagwu, C.; Al Jaberi, J.; Siddig, O.M.; Tariq, Z.; Mahmoud, M.; Abdulraheem, A. A review on non-aqueous fracturing techniques in unconventional reservoirs. J. Nat. Gas Sci. Eng. 2021, 95, 104223. [Google Scholar] [CrossRef]
  15. Wilson, D.R.; Siebert, R.M.; Lively, P. Cryogenic Coal Bed Gas Well Stimulation Method. U.S. Patent No. 5,464,061, 7 November 1995. [Google Scholar]
  16. McDaniel, B.W.; Grundmann, S.R.; Kendrick, W.D.; Wilson, D.R.; Jordan, S.W. Field Applications of Cryogenic Nitrogen as a Hydraulic Fracturing Fluid. In Proceedings of the SPE Annual Technical Conference and Exhibition, San Antonio, TX, USA, 5–8 October 1997; p. SPE-38623-MS. [Google Scholar]
  17. Grundmann, S.R.; Rodvelt, G.D.; Dials, G.A.; Allen, R.E. Cryogenic Nitrogen as a Hydraulic Fracturing Fluid in the Devonian Shale. In Proceedings of the SPE Eastern Regional Meeting, Pittsburgh, PA, USA, 9–11 November 1998; p. SPE-51067-MS. [Google Scholar]
  18. Cai, C.; Li, G.; Huang, Z.; Tian, S.; Shen, Z.; Fu, X. Experiment of coal damage due to super-cooling with liquid nitrogen. J. Nat. Gas Sci. Eng. 2015, 22, 42–48. [Google Scholar] [CrossRef]
  19. Li, Z.; Xu, H.; Zhang, C. Liquid nitrogen gasification fracturing technology for shale gas development. J. Pet. Sci. Eng. 2016, 138, 253–256. [Google Scholar] [CrossRef]
  20. Wu, X.; Huang, Z.; Li, R.; Zhang, S.; Wen, H.; Huang, P.; Dai, X.; Zhang, C. Investigation on the damage of high-temperature shale subjected to liquid nitrogen cooling. J. Nat. Gas Sci. Eng. 2018, 57, 284–294. [Google Scholar] [CrossRef]
  21. Qin, L.; Zhai, C.; Liu, S.; Xu, J. Mechanical behavior and fracture spatial propagation of coal injected with liquid nitrogen under triaxial stress applied for coalbed methane recovery. Eng. Geol. 2018, 233, 1–10. [Google Scholar] [CrossRef]
  22. Jiang, L.; Cheng, Y.; Han, Z.; Gao, Q.; Yan, C.; Wang, G.; Wang, H.; Fu, L. Experimental Investigation on Pore Characteristics and Carrying Capacity of Longmaxi Shale Under Liquid Nitrogen Freezing and Thawing. In Proceedings of the IADC/SPE Asia Pacific Drilling Technology Conference and Exhibition, Bangkok, Thailand, 27–29 August 2018; p. SPE-191111-MS. [Google Scholar]
  23. Jiang, L.; Cheng, Y.; Han, Z.; Gao, Q.; Yan, C.; Wang, H.; Fu, L. Effect of liquid nitrogen cooling on the permeability and mechanical characteristics of anisotropic shale. J. Pet. Explor. Prod. Technol. 2019, 9, 111–124. [Google Scholar] [CrossRef]
  24. Wu, X.; Huang, Z.; Cheng, Z.; Zhang, S.; Song, H.; Zhao, X. Effects of cyclic heating and LN2-cooling on the physical and mechanical properties of granite. Appl. Therm. Eng. 2019, 156, 99–110. [Google Scholar] [CrossRef]
  25. Li, Z.; Wang, F.; Shu, C.; Wen, H.; Wei, G.; Liang, R. Damage effects on coal mechanical properties and micro-scale structures during liquid CO2-ECBM process. J. Nat. Gas Sci. Eng. 2020, 83, 103579. [Google Scholar] [CrossRef]
  26. Memon, K.R.; Ali, M.; Awan, F.U.R.; Mahesar, A.A.; Abbasi, G.R.; Mohanty, U.S.; Akhondzadeh, H.; Tunio, A.H.; Iglauer, S.; Keshavarz, A. Influence of cryogenic liquid nitrogen cooling and thermal shocks on petro-physical and morphological characteristics of Eagle Ford shale. J. Nat. Gas Sci. Eng. 2021, 96, 104313. [Google Scholar] [CrossRef]
  27. Yang, Z.Z.; Zhang, Y.P.; Jia, M.; Li, X.G.; Wei, Z.; Zhang, L. Experimental research on influence of low temperature on coal permeability. Rock Soil Mech. 2017, 38, 354–360. [Google Scholar]
  28. Zhao, Y.; He, X.; Jiang, L.; Wang, Z.; Ning, J.; Sainoki, A. Influence analysis of complex crack geometric parameters on mechanical properties of soft rock. Int. J. Coal Sci. Technol. 2023, 10, 78. [Google Scholar] [CrossRef]
  29. Liu, X.; Chen, H.; Liu, B.; Wang, S.; Liu, Q.; Luo, Y.; Luo, J. Experimental and numerical investigation on failure characteristics and mechanism of coal with different water contents. Int. J. Coal Sci. Technol. 2023, 10, 49. [Google Scholar] [CrossRef]
  30. Cai, C.; Li, G.; Huang, Z.; Shen, Z.; Tian, S.; Wei, J. Experimental study of the effect of liquid nitrogen cooling on rock pore structure. J. Nat. Gas Sci. Eng. 2014, 21, 507–517. [Google Scholar] [CrossRef]
  31. Qin, L.; Zhai, C.; Liu, S.; Xu, J.; Yu, G.; Sun, Y. Changes in the petrophysical properties of coal subjected to liquid nitrogen freeze-thaw—A nuclear magnetic resonance investigation. Fuel 2017, 194, 102–114. [Google Scholar] [CrossRef]
  32. Qin, L.; Zhai, C.; Liu, S.; Xu, J.; Wu, S.; Dong, R. Fractal dimensions of low rank coal subjected to liquid nitrogen freeze-thaw based on nuclear magnetic resonance applied for coalbed methane recovery. Powder Technol. 2018, 325, 11–20. [Google Scholar] [CrossRef]
  33. Qin, L.; Li, S.; Zhai, C.; Lin, H.; Zhao, P.; Shi, Y.; Bai, Y. Changes in the pore structure of lignite after repeated cycles of liquid nitrogen freezing as determined by nitrogen adsorption and mercury intrusion. Fuel 2020, 267, 117214. [Google Scholar] [CrossRef]
  34. Wu, X.; Huang, Z.; Zhang, S.; Cheng, Z.; Li, R.; Song, H.; Wen, H.; Huang, P. Damage analysis of high-temperature rocks subjected to LN 2 thermal shock. Rock Mech. Rock Eng. 2019, 52, 2585–2603. [Google Scholar] [CrossRef]
  35. Cai, C.; Wang, B.; Zou, Z.; Feng, Y.; Tao, Z. Experimental Study on the Damage and Failure Characteristics of High-Temperature Granite after Liquid-Nitrogen Cooling. Processes 2023, 11, 1818. [Google Scholar] [CrossRef]
  36. Guo, P.; Zhang, P.; Bu, M.; Xing, H.; He, M. Impact of cooling rate on mechanical properties and failure mechanism of sandstone under thermal-mechanical coupling effect. Int. J. Coal Sci. Technol. 2023, 10, 26. [Google Scholar] [CrossRef]
  37. Zhang, J.; Li, X.; Xie, Z.; Li, J.; Zhang, X.; Sun, K.; Wang, F. Characterization of microscopic pore types and structures in marine shale: Examples from the Upper Permian Dalong formation, Northern Sichuan Basin, South China. J. Nat. Gas Sci. Eng. 2018, 59, 326–342. [Google Scholar] [CrossRef]
  38. Zhao, D.; Wang, Q.; Li, D.; Feng, Z. Experimental study on infiltration and freeze—Thaw damage of water-bearing coal samples with cryogenic liquid nitrogen. J. Nat. Gas Sci. Eng. 2018, 60, 24–31. [Google Scholar] [CrossRef]
  39. Song, S.; Liu, J.; Yang, D.; Ni, H.; Huang, B.; Zhang, K.; Mao, X. Pore structure characterization and permeability prediction of coal samples based on SEM images. J. Nat. Gas Sci. Eng. 2019, 67, 160–171. [Google Scholar] [CrossRef]
  40. Wei, J.; Zhang, L.; Li, B.; Wen, Z. Non-uniformity of coal damage caused by liquid nitrogen freeze-thaw. J. Nat. Gas Sci. Eng. 2019, 69, 102946. [Google Scholar] [CrossRef]
  41. Chu, Y.; Sun, H.; Zhang, D.; Yu, G. Nuclear magnetic resonance study of the influence of the liquid nitrogen freeze—Thaw process on the pore structure of anthracite coal. Energy Sci. Eng. 2020, 8, 1681–1692. [Google Scholar] [CrossRef]
  42. Li, Q.; Yin, T.; Li, X.; Zhang, S. Effects of rapid cooling treatment on heated sandstone: A comparison between water and liquid nitrogen cooling. Bull. Eng. Geol. Environ. 2020, 79, 313–327. [Google Scholar] [CrossRef]
  43. Lin, H.; Long, H.; Yan, M.; Li, S.; Shu, C.; Bai, Y. Methane adsorption thermodynamics of coal sample subjected to liquid nitrogen freezing-thawing process. J. Nat. Gas Sci. Eng. 2021, 90, 103896. [Google Scholar] [CrossRef]
  44. Zhang, Y.; Okere, C.J.; Su, G. Effect of loading rates on accurate in-situ stress determination in different lithologies via Kaiser effect. Arab. J. Geosci. 2021, 14, 1304. [Google Scholar] [CrossRef]
  45. Ahmadi, Y.; Aminshahidy, B. Inhibition of asphaltene precipitation by hydrophobic CaO and SiO2 nanoparticles during natural depletion and CO2 tests. Int. J. Oil Gas Coal Technol. 2020, 24, 394–414. [Google Scholar] [CrossRef]
  46. Zhao, T.; Zhang, P.; Xiao, Y.; Guo, W.; Zhang, Y.; Zhang, X. Master crack types and typical acoustic emission characteristics during rock failure. Int. J. Coal Sci. Technol. 2023, 10, 2. [Google Scholar] [CrossRef]
  47. Akhondzadeh, H.; Keshavarz, A.; Al-Yaseri, A.Z.; Ali, M.; Awan, F.U.R.; Wang, X.; Yang, Y.; Iglauer, S.; Lebedev, M. Pore-scale analysis of coal cleat network evolution through liquid nitrogen treatment: A Micro-Computed Tomography investigation. Int. J. Coal Geol. 2020, 219, 103370. [Google Scholar] [CrossRef]
  48. Akhondzadeh, H.; Keshavarz, A.; Awan, F.U.R.; Ali, M.; Al-Yaseri, A.; Liu, C.; Yang, Y.; Iglauer, S.; Gurevich, B.; Lebedev, M. Liquid nitrogen fracturing efficiency as a function of coal rank: A multi-scale tomographic study. J. Nat. Gas Sci. Eng. 2021, 95, 104177. [Google Scholar] [CrossRef]
  49. Liu, W.; Wang, G.; Han, D.; Xu, H.; Chu, X. Accurate characterization of coal pore and fissure structure based on CT 3D reconstruction and NMR. J. Nat. Gas Sci. Eng. 2021, 96, 104242. [Google Scholar] [CrossRef]
  50. Xie, W.; Li, X.; Zhang, M. Reservoir evaluation of Upper Triassic Xujiahe formation in southwest Sichuan basin. Nat. Gas Geosci. 2008, 19, 94–99. [Google Scholar]
  51. Rukai, Z.; Xia, Z.; Liuhong, L.; Xuesong, W.; Nai, Z.; Hongli, G.; Lihong, S. Depositional system and favorable reservoir distribution of Xujiahe Formation in Sichuan Basin. Pet. Explor. Dev. 2009, 36, 46–55. [Google Scholar] [CrossRef]
  52. Zhang, B.; Fu, X.; Li, G.; Deng, Z.; Shen, Y.; Hao, M. An experimental study on the effect of nitrogen injection on the deformation of coal during methane desorption. J. Nat. Gas Sci. Eng. 2020, 83, 103529. [Google Scholar] [CrossRef]
  53. Li, R.; Wang, S.; Li, G.; Wang, J. Influences of coal seam heterogeneity on hydraulic fracture geometry: An in situ observation perspective. Rock Mech. Rock Eng. 2022, 55, 4517–4527. [Google Scholar] [CrossRef]
  54. Gong, L.; Zeng, L.; Gao, Z.; Zhu, R.; Zhang, B. Reservoir characterization and origin of tight gas sandstones in the Upper Triassic Xujiahe formation, Western Sichuan Basin, China. J. Pet. Explor. Prod. Technol. 2016, 6, 319–329. [Google Scholar] [CrossRef]
  55. ISO 11760: 2005(E); Classification of Coals. International Organization for Standardization (ISO): Geneva, Switzerland, 2005; 9p.
  56. Wildenschild, D.; Sheppard, A.P. X-ray imaging and analysis techniques for quantifying pore-scale structure and processes in subsurface porous medium systems. Adv. Water Resour. 2013, 51, 217–246. [Google Scholar] [CrossRef]
  57. Wildenschild, D.; Vaz, C.; Rivers, M.L.; Rikard, D.; Christensen, B. Using X-ray computed tomography in hydrology: Systems, resolutions, and limitations. J. Hydrol. 2002, 267, 285–297. [Google Scholar] [CrossRef]
  58. Ma, J. Pore-scale characterization of gas flow properties in shale by digital core analysis. In Unconventional Oil and Gas Resources Handbook; Elsevier: Amsterdam, The Netherlands, 2016; pp. 127–150. [Google Scholar]
  59. Wang, J.; Jiang, F.; Zhang, C.; Song, Z.; Mo, W. Study on the pore structure and fractal dimension of tight sandstone in coal measures. Energy Fuels 2021, 35, 3887–3898. [Google Scholar] [CrossRef]
Figure 1. Location of the coal and sandstone samples used in this study.
Processes 12 00127 g001
Figure 2. Experimental procedure and digital core analysis.
Processes 12 00127 g002
Figure 3. Porosities of coal and sandstone samples scanned at different areas against the size of FOV.
Processes 12 00127 g003
Figure 4. Comparison of filtering performances of different smoothing algorithms. Red areas in the images represent the segmented pores.
Processes 12 00127 g004
Figure 5. The image segmentation process of pore-fracture structures’ extraction in coal sample.
Processes 12 00127 g005
Figure 6. Micro-failure characteristics of sample S1# before and after LN2 cooling.
Processes 12 00127 g006
Figure 7. Micro-failure characteristics of sample C1# before and after LN2 cooling.
Processes 12 00127 g007
Figure 8. Three-dimensional reconstruction of pore structures in dry rock samples before and after LN2 cooling. (A) Sandstone sample S1#; (B) coal sample C1#.
Processes 12 00127 g008
Figure 9. Impact of LN2 cooling on the microstructures and porosities of S1# and C1# samples: (AD) pore size and aspect ratio scatterplot; (E) porosity comparison.
Processes 12 00127 g009
Figure 10. Changes in count and volume proportion of different types of pores before and after LN2 cooling. (A) Pores at different scales; (B) pores at different aspect ratios.
Processes 12 00127 g010
Figure 11. Shape factor and 3D fractal dimension of pores in dry sandstone S1# and coal C1# before and after LN2 cooling. (a) Volume proportions of pores with different shape factors; (b) comparison of the 3D fractal dimensions of pores.
Processes 12 00127 g011
Figure 12. Pore–throat skeleton of dry rock samples before and after LN2 cooling. (A) Sandstone sample S1#; (B) coal sample C1#.
Processes 12 00127 g012
Figure 13. Connectivity parameters of pore structures. (A) Scatterplot of throat diameter against channel length; (B) cumulative distribution curve of throat diameter; (C) proportion of pores with different coordination number; (D) coordination number ranges of pores with different diameters.
Processes 12 00127 g013
Figure 14. Three-dimensional reconstruction of pore structures in water-saturated rocks before and after LN2 cooling. (A) Water-saturated sandstone S2#; (B) water-saturated coal C2#.
Processes 12 00127 g014
Figure 15. Micro-failures inside the water-saturated coal C2# after LN2 cooling.
Processes 12 00127 g015
Figure 16. Scatterplot of pores at different sizes against aspect ratio for water-saturated samples S2# and C2# before and after LN2 cooling. (A) sandstone S2# before LN2 cooling treatment; (B) sandstone S2# after LN2 cooling treatment; (C) coal C2# before LN2 cooling treatment; (D) coal C2# after LN2 cooling treatment.
Processes 12 00127 g016
Figure 17. Changes in the feature parameters of pore structures in water-saturated samples after LN2 cooling. (A) Comparison of porosity growth rate between dry and water-saturated rocks; (B) count and volume changes in pores at different scales; (C) volume proportion distribution of pores against shape factor; (D) 3D fractal dimensions of pores before and after LN2 cooling.
Processes 12 00127 g017
Figure 18. Pore–throat structures of (A) water-saturated sandstone S2# and (B) water-saturated coal C2# before and after LN2 cooling.
Processes 12 00127 g018
Figure 19. Throat parameters of water-saturated rocks. (A) Comparison of the ranges of throat diameter and channel length of water-saturated rocks before and after LN2 cooling; (B) comparison pf the cumulative distribution curve of throat diameter between dry samples and water-saturated samples; (C) proportion of pores with different coordination numbers in the water-saturated samples; (D) comparison of the coordination number ranges of pores with different diameters between dry samples and water-saturated samples.
Processes 12 00127 g019
Table 1. XRD analysis of rock samples.
MineralQKPlCaDPyBC
Sandstone50.6%1.2%3.2%13.0%15.8%--16.2%
Coal18.2%---31.2%1.2%3.4%46.0%
Q: quartz; K: K-feldspar; Pl: plagioclase; Ca: calcite; D: dolomite; Py: pyrite; B: barite; C: clay minerals.
Table 2. Basic parameters of coal samples.
Rmin
(%)
Ro
(%)
Rmax
(%)
Proximate AnalysisMaceral ContentCoal Rank
Fixed Carbon
(%)
Moisture
(%)
Ash Yield
(%)
Volatile
(%)
Vitrinite
(%)
Inertinite
(%)
Coal0.911.141.3657.382.9912.9526.687822Bituminous B
Disclaimer/Publisher’s Note: The statements, opinions and data contained in all publications are solely those of the individual author(s) and contributor(s) and not of MDPI and/or the editor(s). MDPI and/or the editor(s) disclaim responsibility for any injury to people or property resulting from any ideas, methods, instructions or products referred to in the content.