Article

Exploitation and Utilization of Generated Oil and Gas by Pyrolysis Simulation Modeling of Shale Source Rocks under the Condition of In Situ Conversion

1
Research Institute of Petroleum Exploration & Development, PetroChina, Beijing 100083, China
2
College of Earth Science and Engineering, Shandong University of Science and Technology, Qingdao 266590, China
3
Guangzhou Institute of Geochemistry, Chinese Academy of Sciences, Guangzhou 510640, China
*
Author to whom correspondence should be addressed.
Processes 2024, 12(1), 121; https://doi.org/10.3390/pr12010121
Submission received: 2 November 2023 / Revised: 14 November 2023 / Accepted: 20 November 2023 / Published: 3 January 2024
(This article belongs to the Special Issue Exploration, Exploitation and Utilization of Coal and Gas Resources)

Abstract

:
Previous studies have mainly focused on the source rocks of the 7th Member of Yanchang Formation (Chang 7 Member) in the Ordos Basin, with very few studies focusing on the extracts from the source rocks. These extracts have important guiding significance for studying the in situ conversion process of shale oil. Taking the shale source rock of the Chang 7 Member as an example, this paper selected the extract of shale source rock (i.e., retained oil), which has been less studied previously, as the sample to carry out the hydrocarbon-generating pyrolysis simulation experiment of a semi-open–semi-closed system. Seven groups of parallel simulation experiments were designed with a pressure of 20 MPa. The generated oil and gas were collected and quantified, and their geochemical characteristics were researched. In addition, the generated oil and gas were investigated from aspects of cumulative yield and net increased yield, and the chromatographic and mass spectral characteristics of the generated oil were also researched. Based on this, an inductive hydrocarbon generation model of retained oil in shale source rocks was established: slow hydrocarbon generation stage (300–320 °C), rapid hydrocarbon generation stage (320–360 °C), and residual oil pyrolysis stage (0.79%Ro–1.47%Ro). This study is of important significance to guide the research on the in situ conversion process of shale source rock.

1. Introduction

The hydrocarbon generation and expulsion process of geologic time takes a megayear (Ma) as the unit of measurement, and that of in situ shale conversion takes a year as the unit of measurement. According to the time–temperature compensation principle, the high-temperature condition of the pyrolysis simulation experiment can ensure the pyrolysis process of organic matter is completed within several days or even several minutes, so as to provide guidance for the efficient production of shale oil [1,2,3,4,5]. The in situ conversion process uses horizontal well electric heating lightening technology to convert the heavy oil and solid organic matter in shale into light oil and gas quickly [3,4]. It may solve the problem of low–medium maturity shale oil exploitation in China, which is the core technology of shale oil and gas exploitation in China.
The previous hydrocarbon-generating pyrolysis simulation experiments mainly focused on marine I and II kerogen and continental III kerogen [6,7,8,9], but seldom researched the shale after chloroform bitumen “A” extraction (i.e., retained oil). These extracts contain much scientific information and have important guiding significance for studying the in situ conversion process of shale oil. The in situ conversion of shale oil is to heat and crack shale underground to convert it into high-quality oil and gas, and then separate the oil and gas through channels to achieve effective shale oil extraction. Thermal simulation experiments of hydrocarbon generation can simulate the process of underground in situ conversion of shale.
The recoverable resources of shale oil and gas amount to (400~450) × 108 t in the Chang 7 Member of Yanchang Formation in the Ordos Basin, which is an important shale-oil- and gas-producing area in China [1]. The Chang 7 Member deposited the most important source rock in the basin, and is the strata where oil and gas are most developed. Recently, the research of China’s continental middle–low maturity shale oil has made great progress. The Chang 7 shale is the most potential representative for in situ conversion of shale oil in China. However, previous studies mainly focused on evaluating the hydrocarbon generation potential of the Chang 7 shale, or the Chang 7 Member was regarded as a reservoir to characterize its reservoir performance quantitatively.
The thermal simulation experiment of hydrocarbon generation can simulate the process of underground in situ conversion of shale. According to the closeness of the experimental system, it can be divided into an open system, a closed system, and a semi-closed system. Previous pyrolysis experiments essentially include the pyrolysis simulation experiments based on a closed or open system [10,11,12]. Under the condition of in situ conversion, the burial depth of the shale is generally over 300 m, where the pressure cannot be constant, and the pyrolytic hydrocarbon generation is associated with hydrocarbon expulsion, so the shale is in the state between open and closed systems [8,10]. The open system does not accept pressure, and the closed system cannot provide the hydrocarbon expulsion process, so neither of them is suitable to research the hydrocarbon generation mechanisms of retained oil under the condition of in situ conversation [13,14]. The semi-open–semi-closed pyrolysis system is the most suitable to analyze the hydrocarbon generation process of the retained oil in the 7th Member of Yanchang Formation comprehensively.

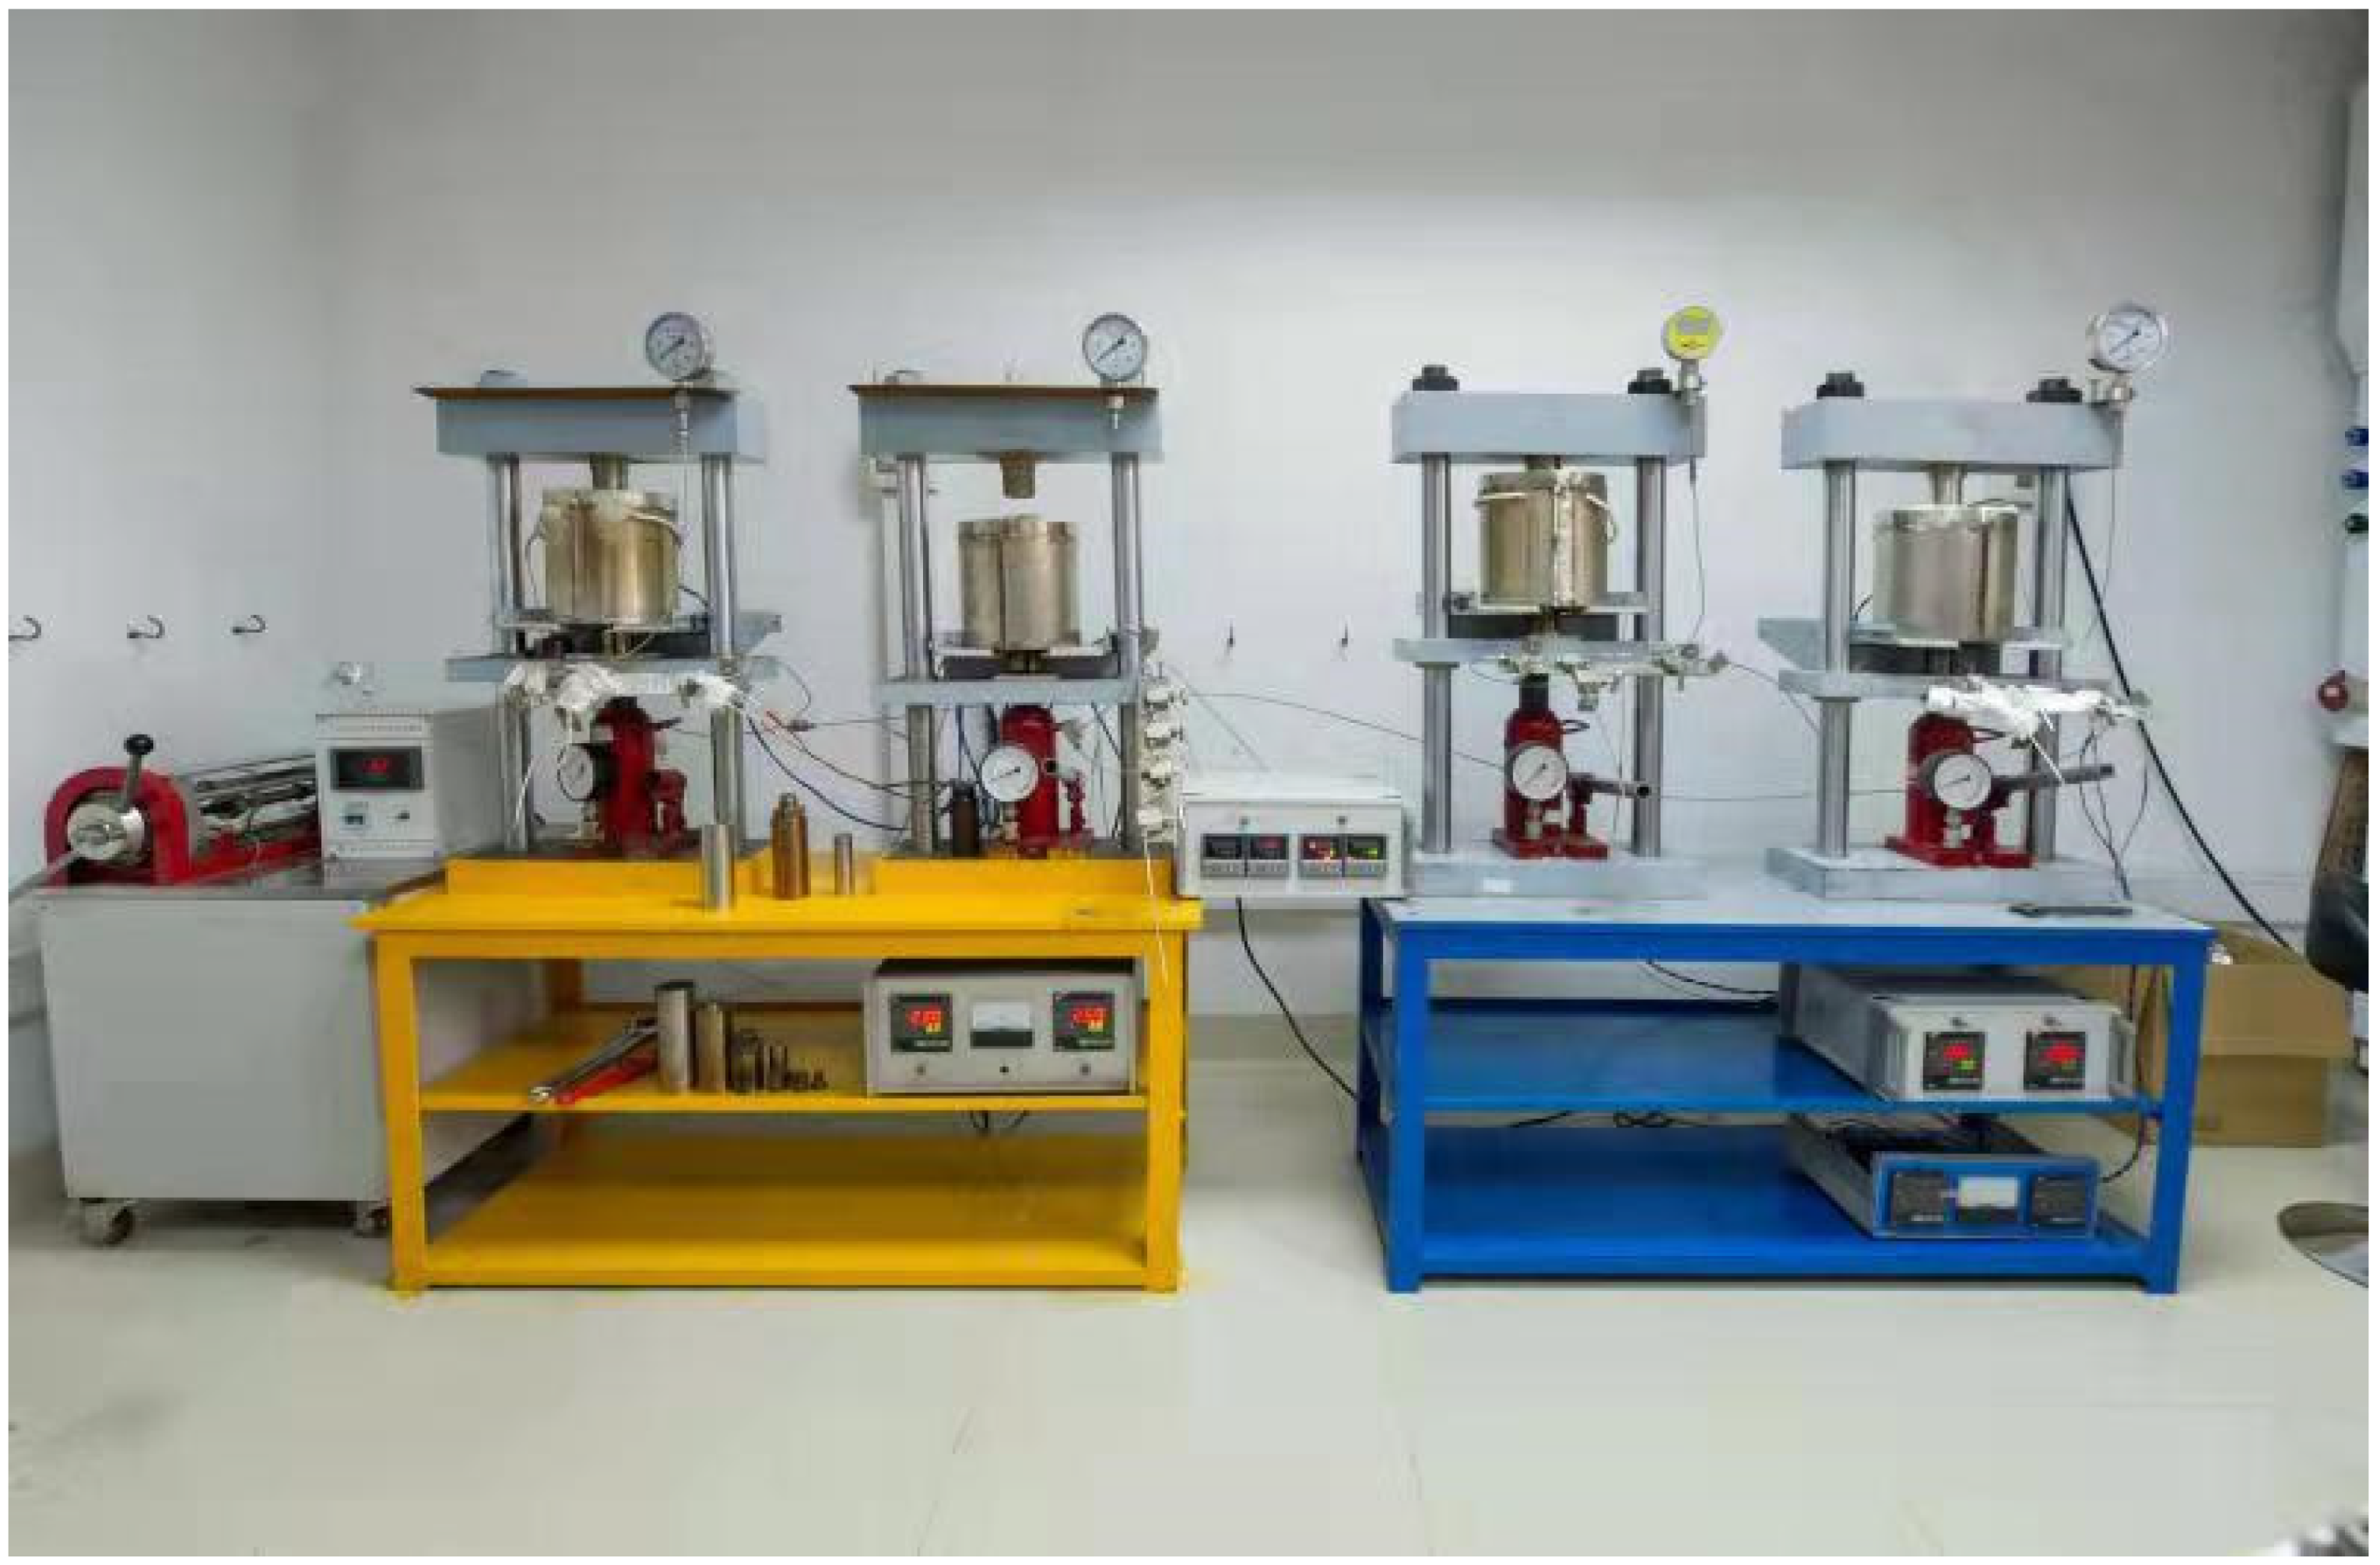
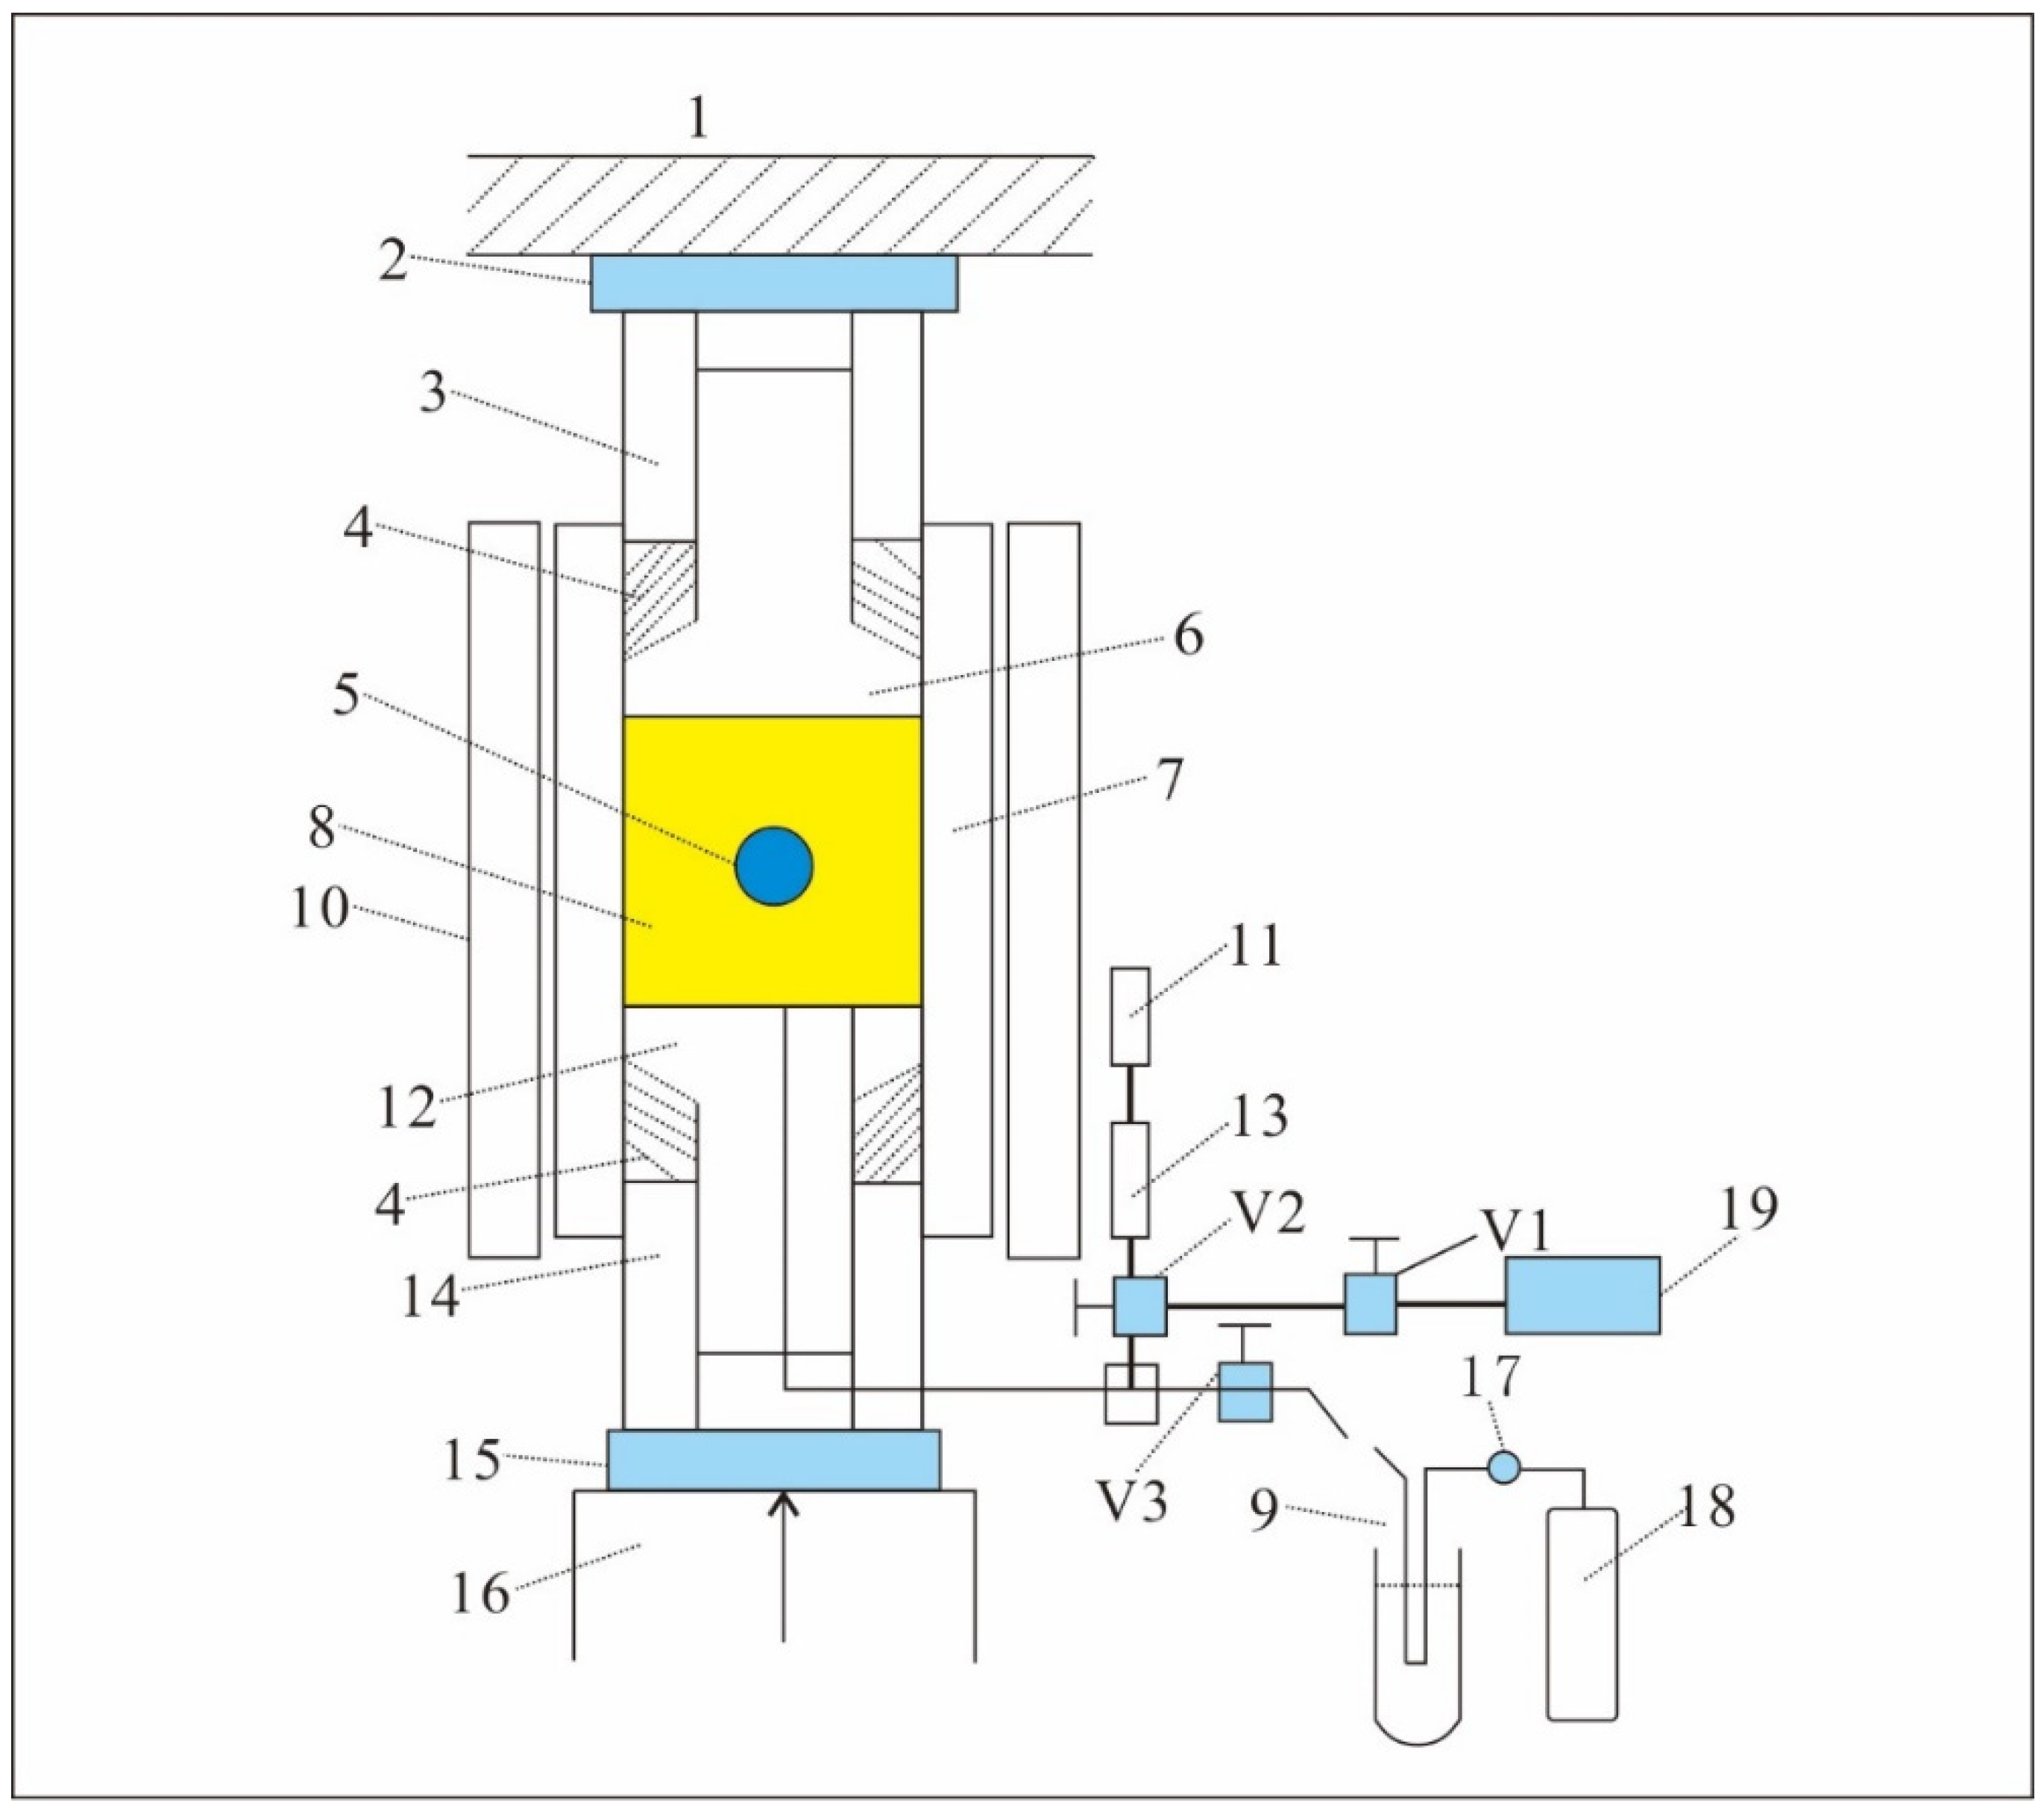
2. Samples and Methods

The Ordos Basin is located in central-northern China, and it is China’s second largest sedimentary basin, with an abundance of oil and gas resources [15,16,17,18]. The most important source rock in the Ordos Basin is deposited in the Chang 7 Member, which is the most developed oil and gas interval. During the depositional period of the Yanchang Formation in the Late Triassic, a large inland freshwater lake basin with a wide water area was formed in the basin. The basin reached its peak in the depositional period of the Chang 7 Member of the Yanchang Formation, forming the main source rock of the basin. Recently, great progress has been made in the research of continental medium–low maturity shale oil in China [19,20,21]. The Chang 7 Member in the Ordos Basin is the most potential representative area of in situ shale oil conversion in China [22,23].
Samples include outcrop shale source rock, located in a mining pit in the Hejiafang area of Tongchuan City, Sha’anxi Province, China. The vitrinite reflectance (Ro) is 0.50%, the maximum pyrolysis temperature (Tmax) is 430 °C, and the total organic carbon (TOC) content is 26.89%. This study took the liquid sample of Chang 7 Member shale in the Ordos Basin after the extraction of chloroform bitumen “A” (i.e., retained oil) as the research object. The sample rocks were crushed to about 20 mesh. In order to research the hydrocarbon generation and expulsion characteristics of retained oil under high temperature and high pressure, the hydrocarbon generation–expulsion experiment of retained oil samples was conducted using the piston-type press (Figure 1 and Figure 2). Under high temperature, the retained oil sample flowed and expelled to the direction of low pressure, which led to the termination of the experiment. To simulate the retention effect of minerals on retained oil in strata, alumina particles were added into the reaction container to keep the retained oil samples in the alumina interlayers.
In this study, 7 groups of parallel experiments were designed, including 300 °C, 320 °C, 340 °C, 360 °C, 380 °C, 400 °C, and 420 °C. In the preheating stage, heat the samples from room temperature to 200 °C within 8 h, and then keep the samples at 200 °C for 2 h to avoid different thermal maturities of the samples at the edge and the center of the high-pressure reactor. In the stage of temperature programming, increase the temperature to the ultimate pyrolysis temperature at the rate of 20 °C/h and then remain at this temperature for 2 h. The pressure is the lithostatic pressure, which is applied by using the hoisting jack (Figure 1 and Figure 2). The actual pressure applied to the sample in the pyrolysis reactor is calculated based on the actual area of pressure. According to the temperature-increasing program, the pressure is increased to 20 MPa if it is lower than 20 MPa, and the pressure is recorded but not decreased if it is higher than 20 MPa. In the process of product collection, the pressure decreases temporarily, but pressurization is not necessary, for the pressure can recover to 20 MPa rapidly after product collection.
Clean the pyrolysis instrument and its fittings and the glass device for product collection, and then bake them for 5 h using the muffle furnace to remove the organic matter. After, take them out for cooling. Seal the pores at the lower part of the pyrolysis instrument using the graphite seal ring used for the plug with an exhaust duct. Place one piece of cleaned and baked stainless steel gasket with a few holes and three pieces of cleaned and baked stainless steel fine gauze at the inner exhaust port of the pyrolysis instrument, to avoid the blockage of the exhaust port by alumina particles. The blockage of the exhaust port by alumina particles can stop the expulsion of the generated products, leading to the failure of the experiment. After the gasket and the gauze have been placed, pour alumina particles into the pyrolysis reactor and place them uniformly on the gauze. Weigh 1 g of retained oil and pour it over the alumina particles. Then, add alumina particles to cover the retained oil, and compact the alumina particles. Seal the pores at the upper part of the pyrolysis instrument using the graphite seal ring used for the wholly sealed plug, insert the thermocouple, and compact to a pressure of 20 MPa using the hoisting jack. After all pipes are connected, inject deionized water to check the gas tightness between the pyrolysis instrument and pipe. When there is no water leakage, start the temperature-increasing program.
In the stage of preheating, keep the exhaust valve between the pyrolysis device and product collection device opened to drain the water out of the pyrolysis instrument. When the temperature programming begins, close the exhaust valve, and connect the vacuumed product collection glass device with the gas outlet of the exhaust valve through a rubber hose until the end of the temperature-increasing process. Taking the 300 °C experiment as an example, heat the samples from room temperature to 200 °C within 8 h, and then remain at 200 °C for 2 h (keep the exhaust valve opened in this process). Then, close the exhaust valve, connect the product collection device with the exhaust port, increase the sample temperature from 200 °C to 300 °C at the rate of 20 °C/h, and remain at this temperature for 2 h. Afterwards, open the exhaust valve, the gas stop clamp, and the valve of the gas collector of the glass system to collect the products. Then, place the glass condense tube to collect the expelled oil in the vacuum cup with 0 °C ice water (the water temperature in the vacuum cup must be 0 °C in the process of product collection). Expelled oil is the oil that is collected directly at each temperature point after pyrolysis. When the gas pressure in the pyrolysis instrument drops to a constant value, close the exhaust valve, and isolate the product collection glass device using the gas stop clamp. Shut down the temperature programming device. When the pyrolysis reactor cools to room temperature, take out the pyrolytic residual in the pyrolysis instrument. Here, the first group of experiments ends.
Taking the 320 °C experiment as an example, heat the samples from room temperature to 200 °C within 8 h and then remain at 200 °C for 2 h (keep the exhaust valve opened in this process). Then, close the exhaust valve, connect the product collection device with the exhaust port, increase the sample temperature from 200 °C to 300 °C at the rate of 20 °C/h, and remain at this temperature for 2 h. Afterwards, open the exhaust valve, the gas stop clamp, and the valve of the gas collector of the glass system to collect the products. Then, place the glass condense tube to collect the expelled oil in the vacuum cup with 0 °C ice water. Two minutes later, close the exhaust valve (in fact, it has entered the next stage of temperature increasing in the process of valve opening). After the temperature has continued to increase to 320 °C, and remains at this temperature for 2 h, open the exhaust valve, the gas stop clamp, and the valve of the gas collector of the glass system to collect the products generated under the temperature of 300–320 °C. When the gas pressure in the pyrolysis reactor drops to a constant value, close the exhaust valve, and isolate the product collection glass device using the gas stop clamp. Shut down the temperature programming device. When the pyrolysis instrument cools to room temperature, remove the pyrolytic residual from the pyrolysis instrument. Here, the second group of experiments ends. Conduct the rest of the experiments following the above-mentioned steps. Open the exhaust valve every 20 °C increase during the temperature programming of samples, until the pyrolysis temperature reaches 420 °C, when the seventh group of experiments ends.

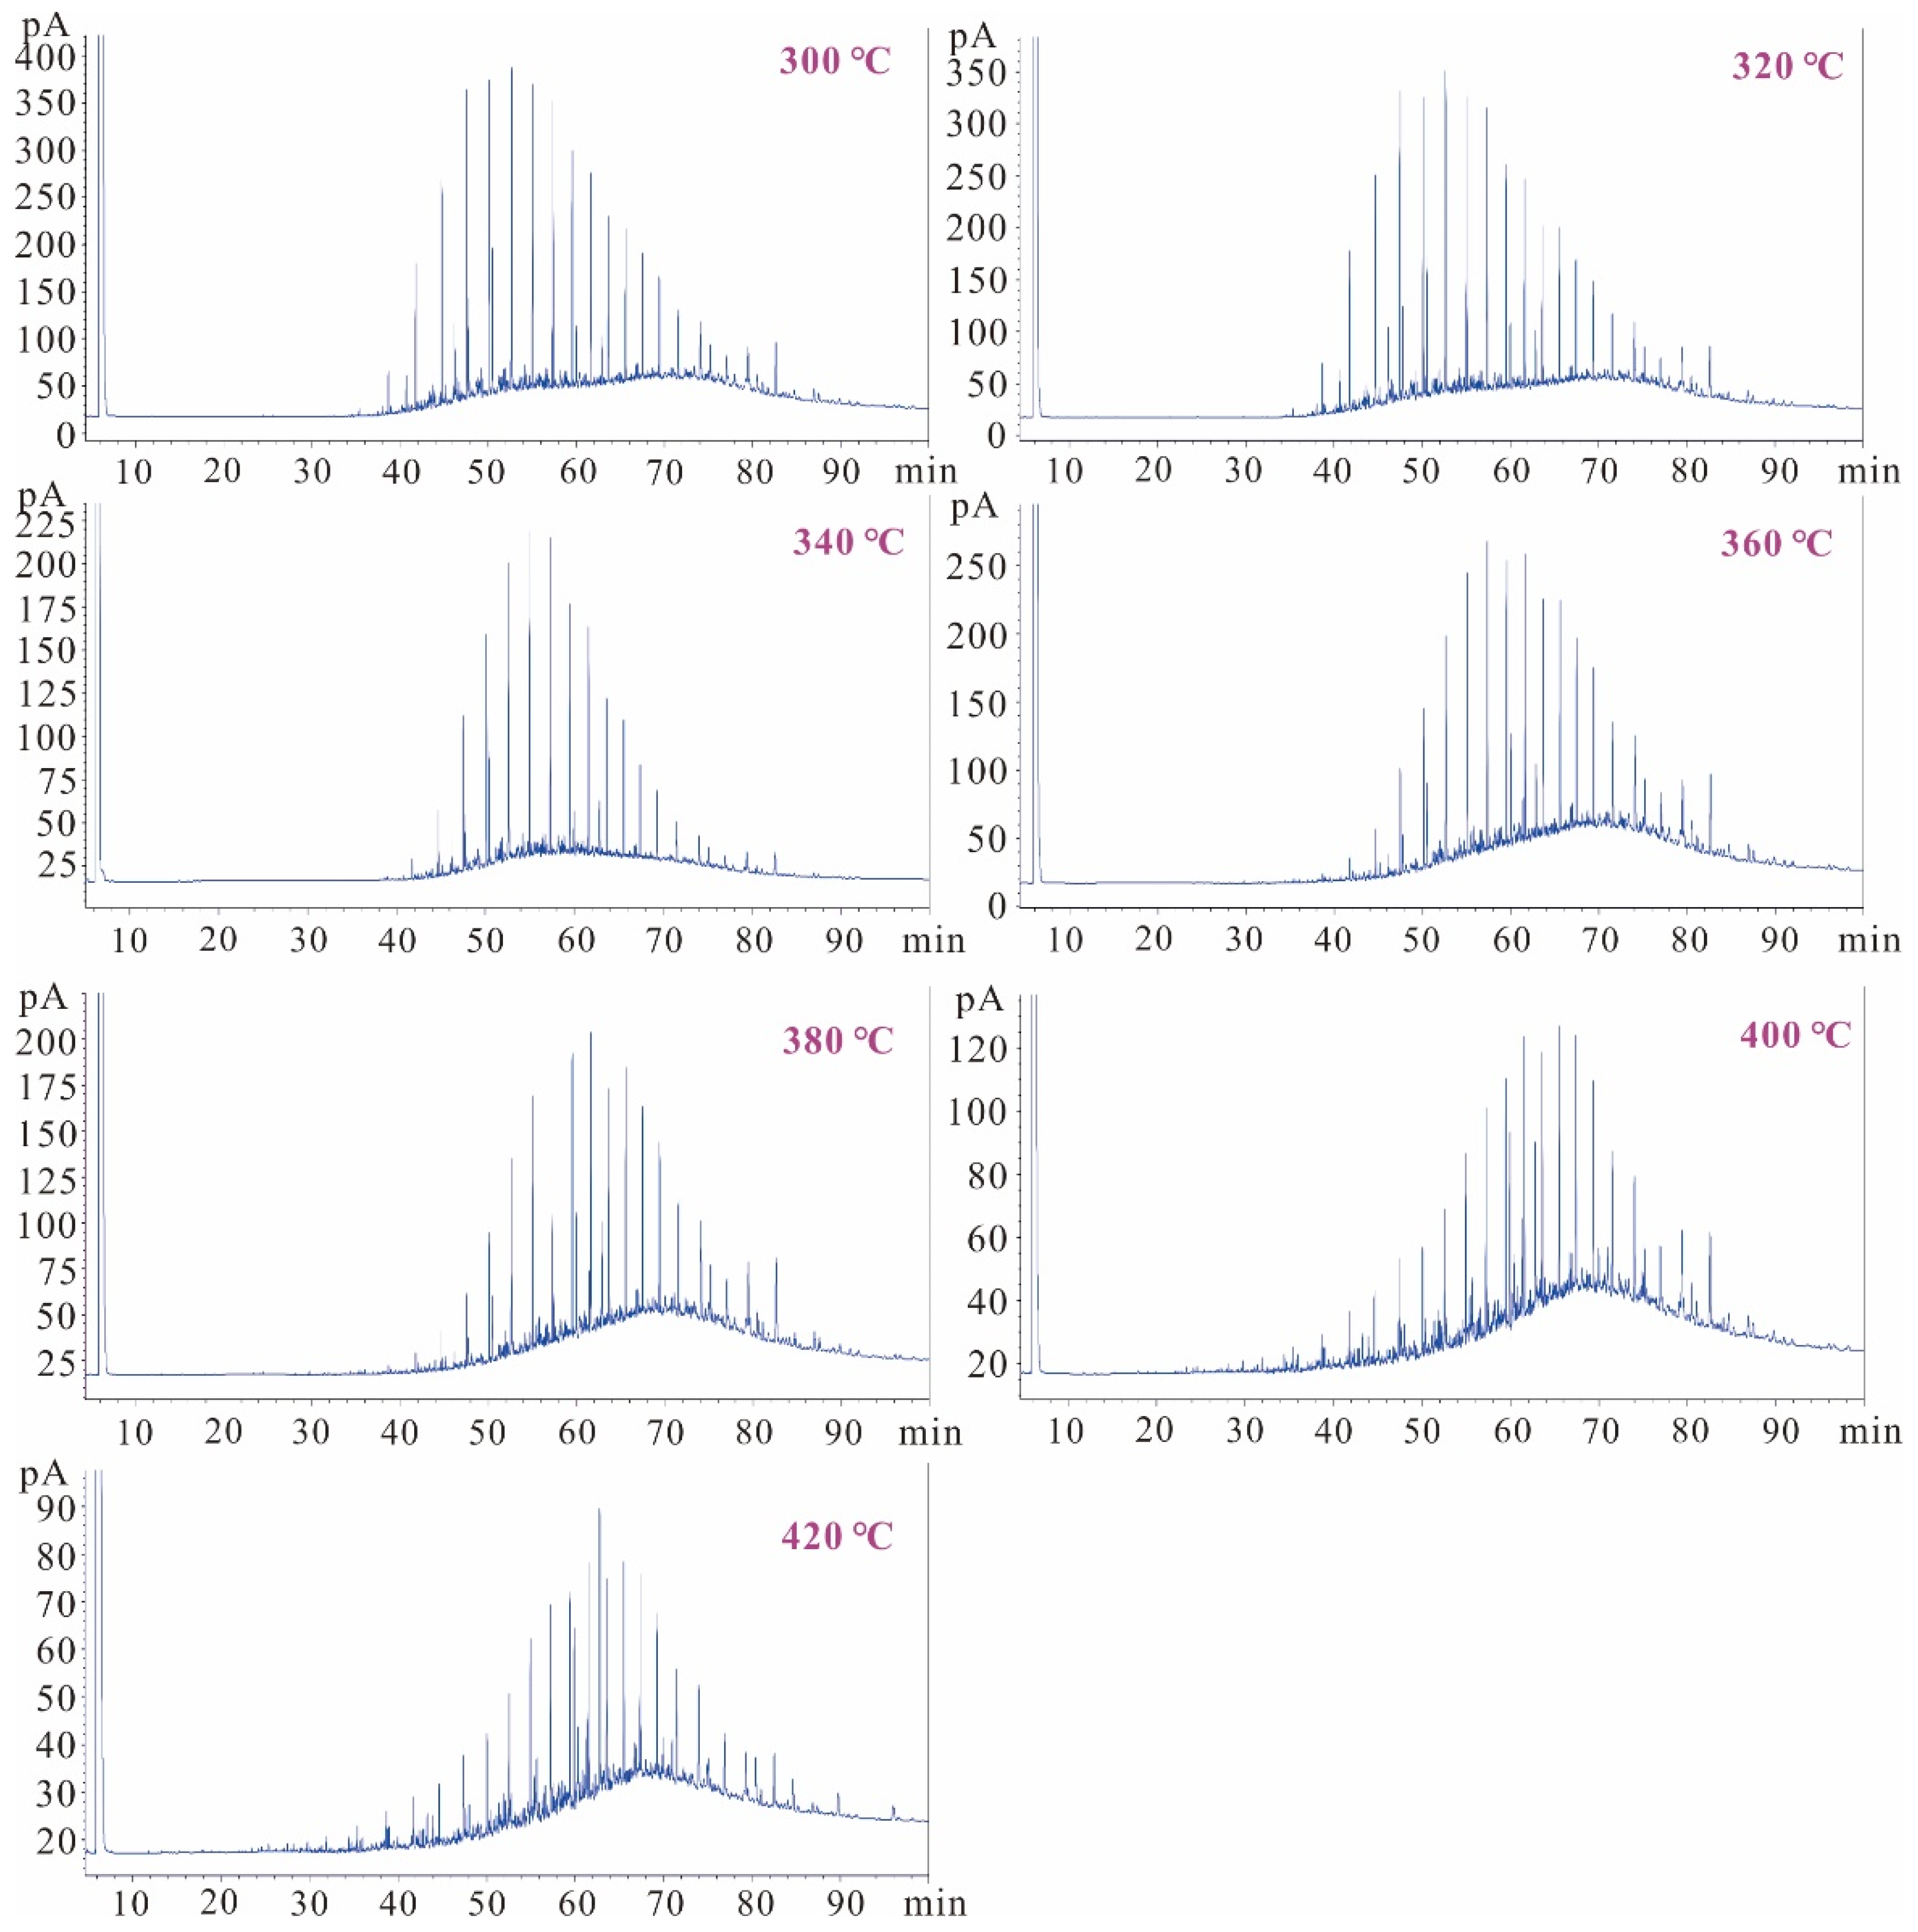
3. Results and Discussion

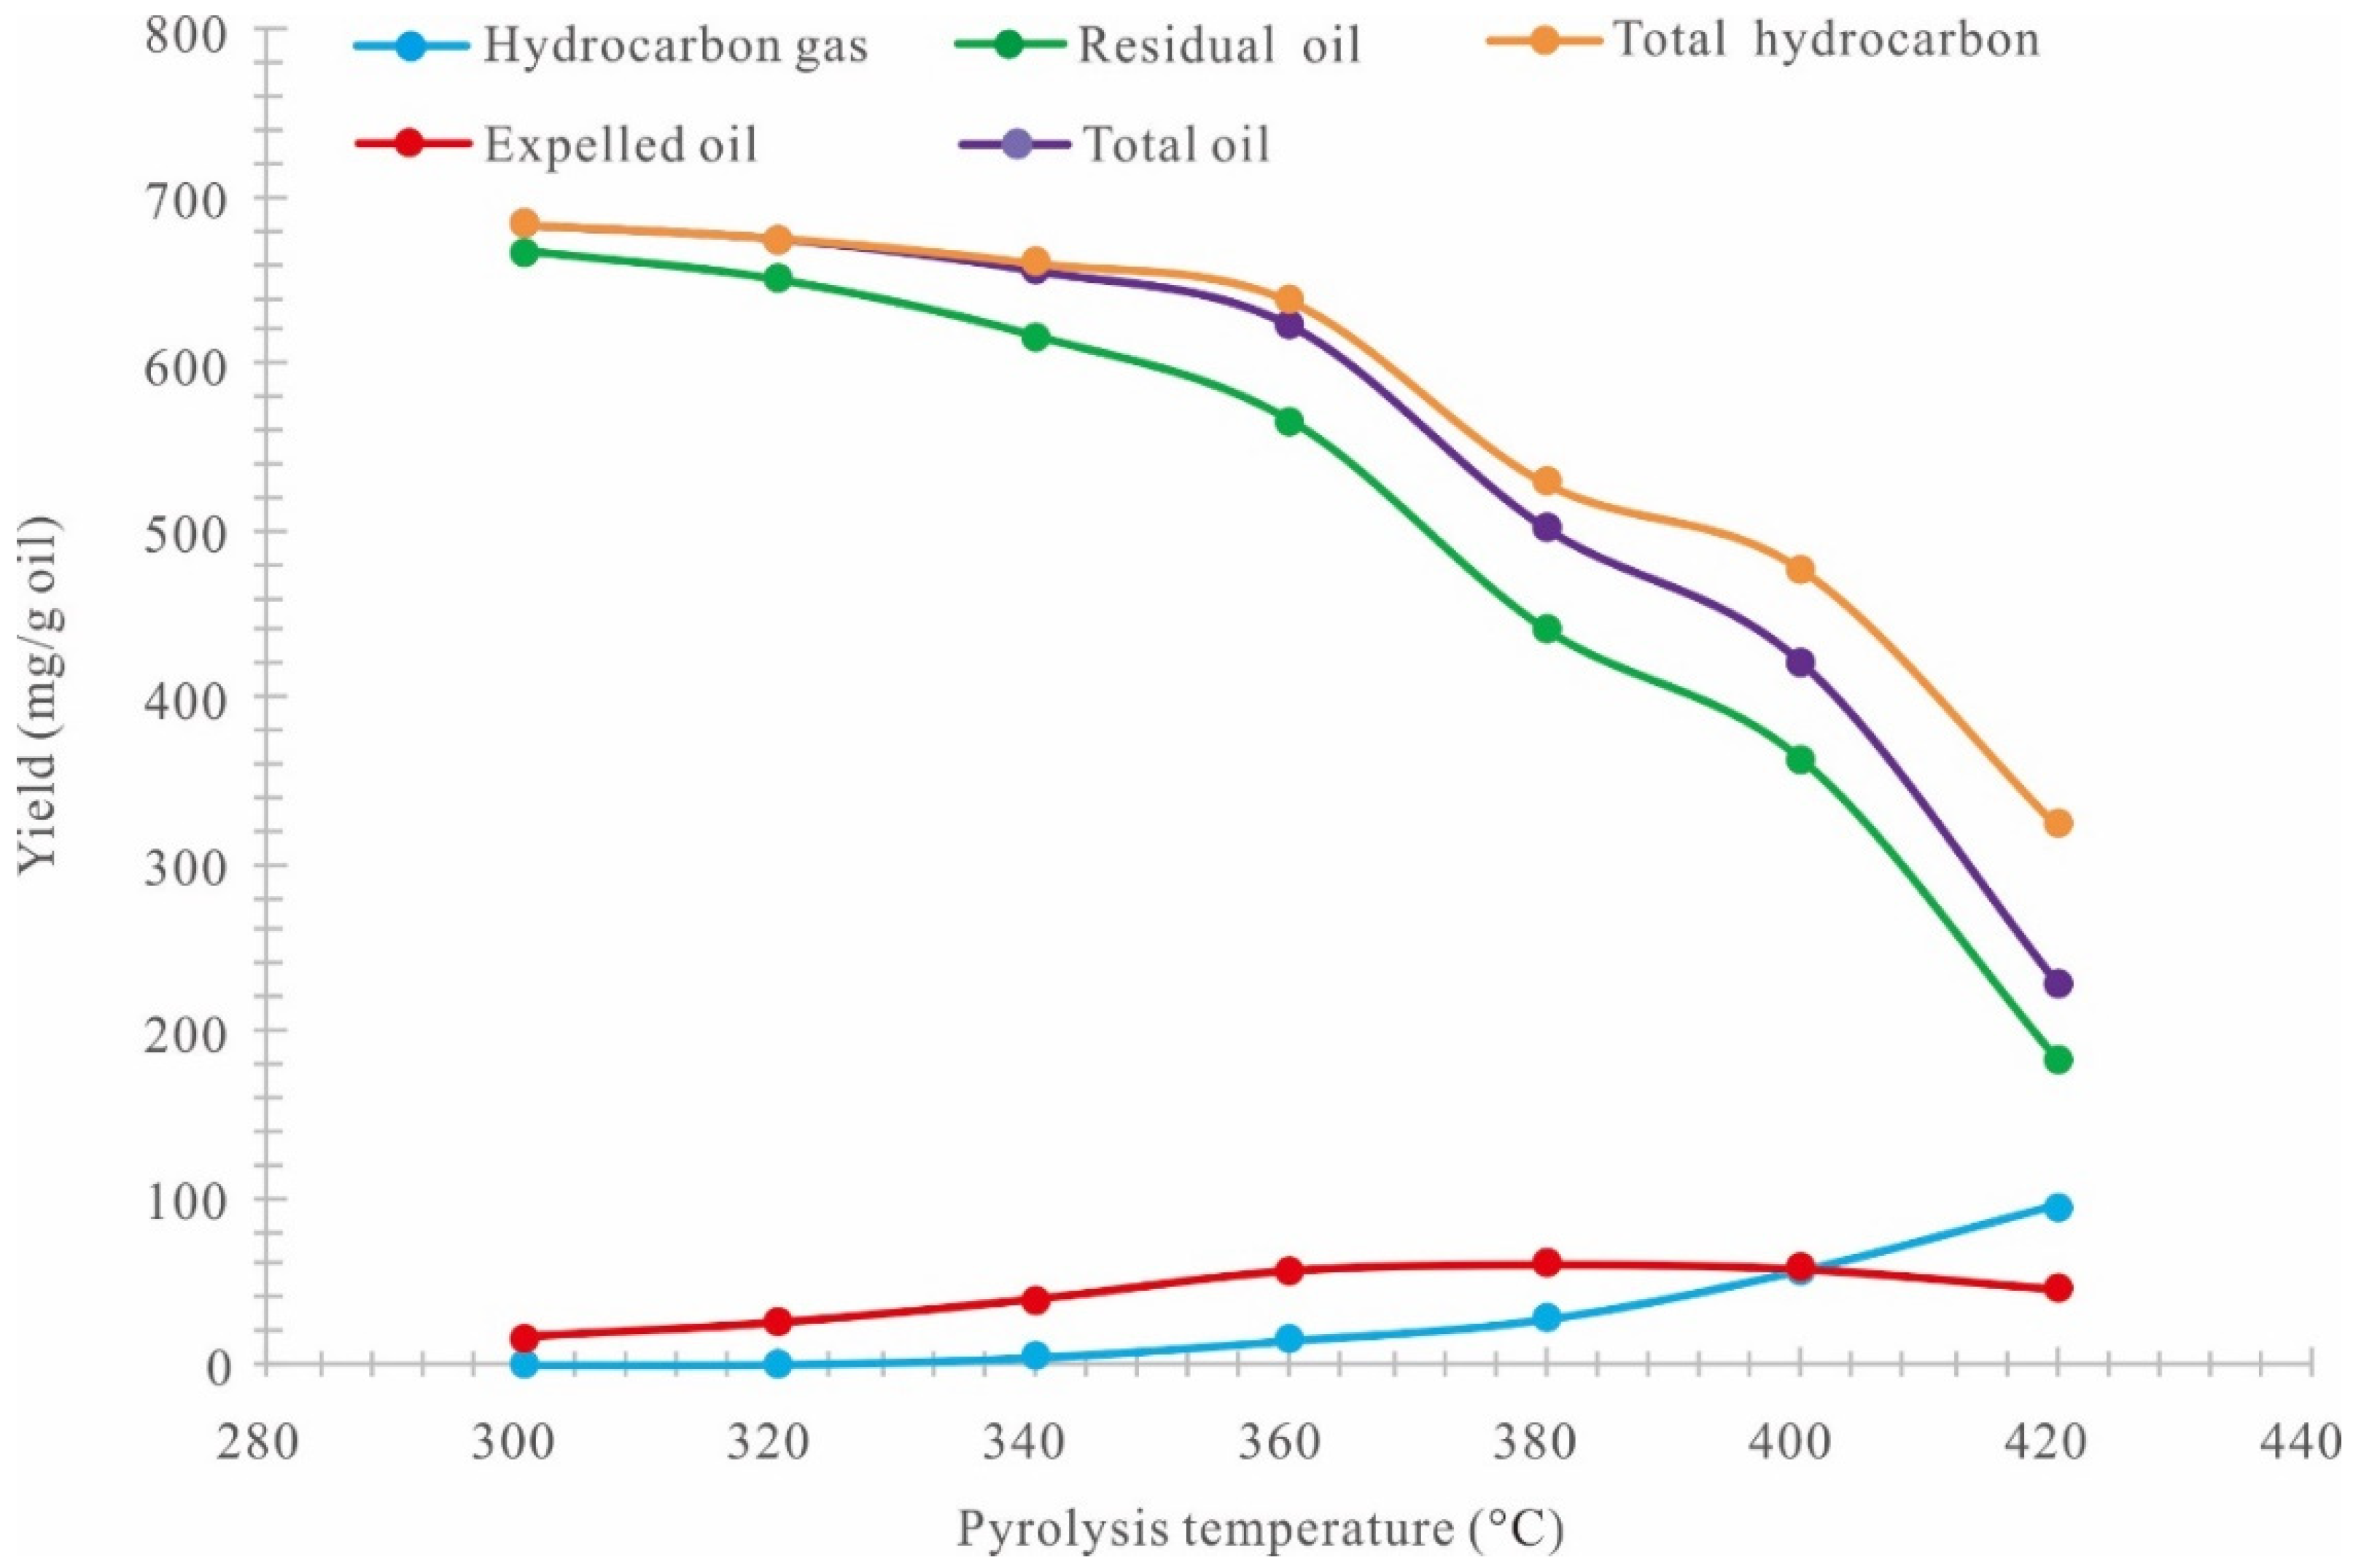
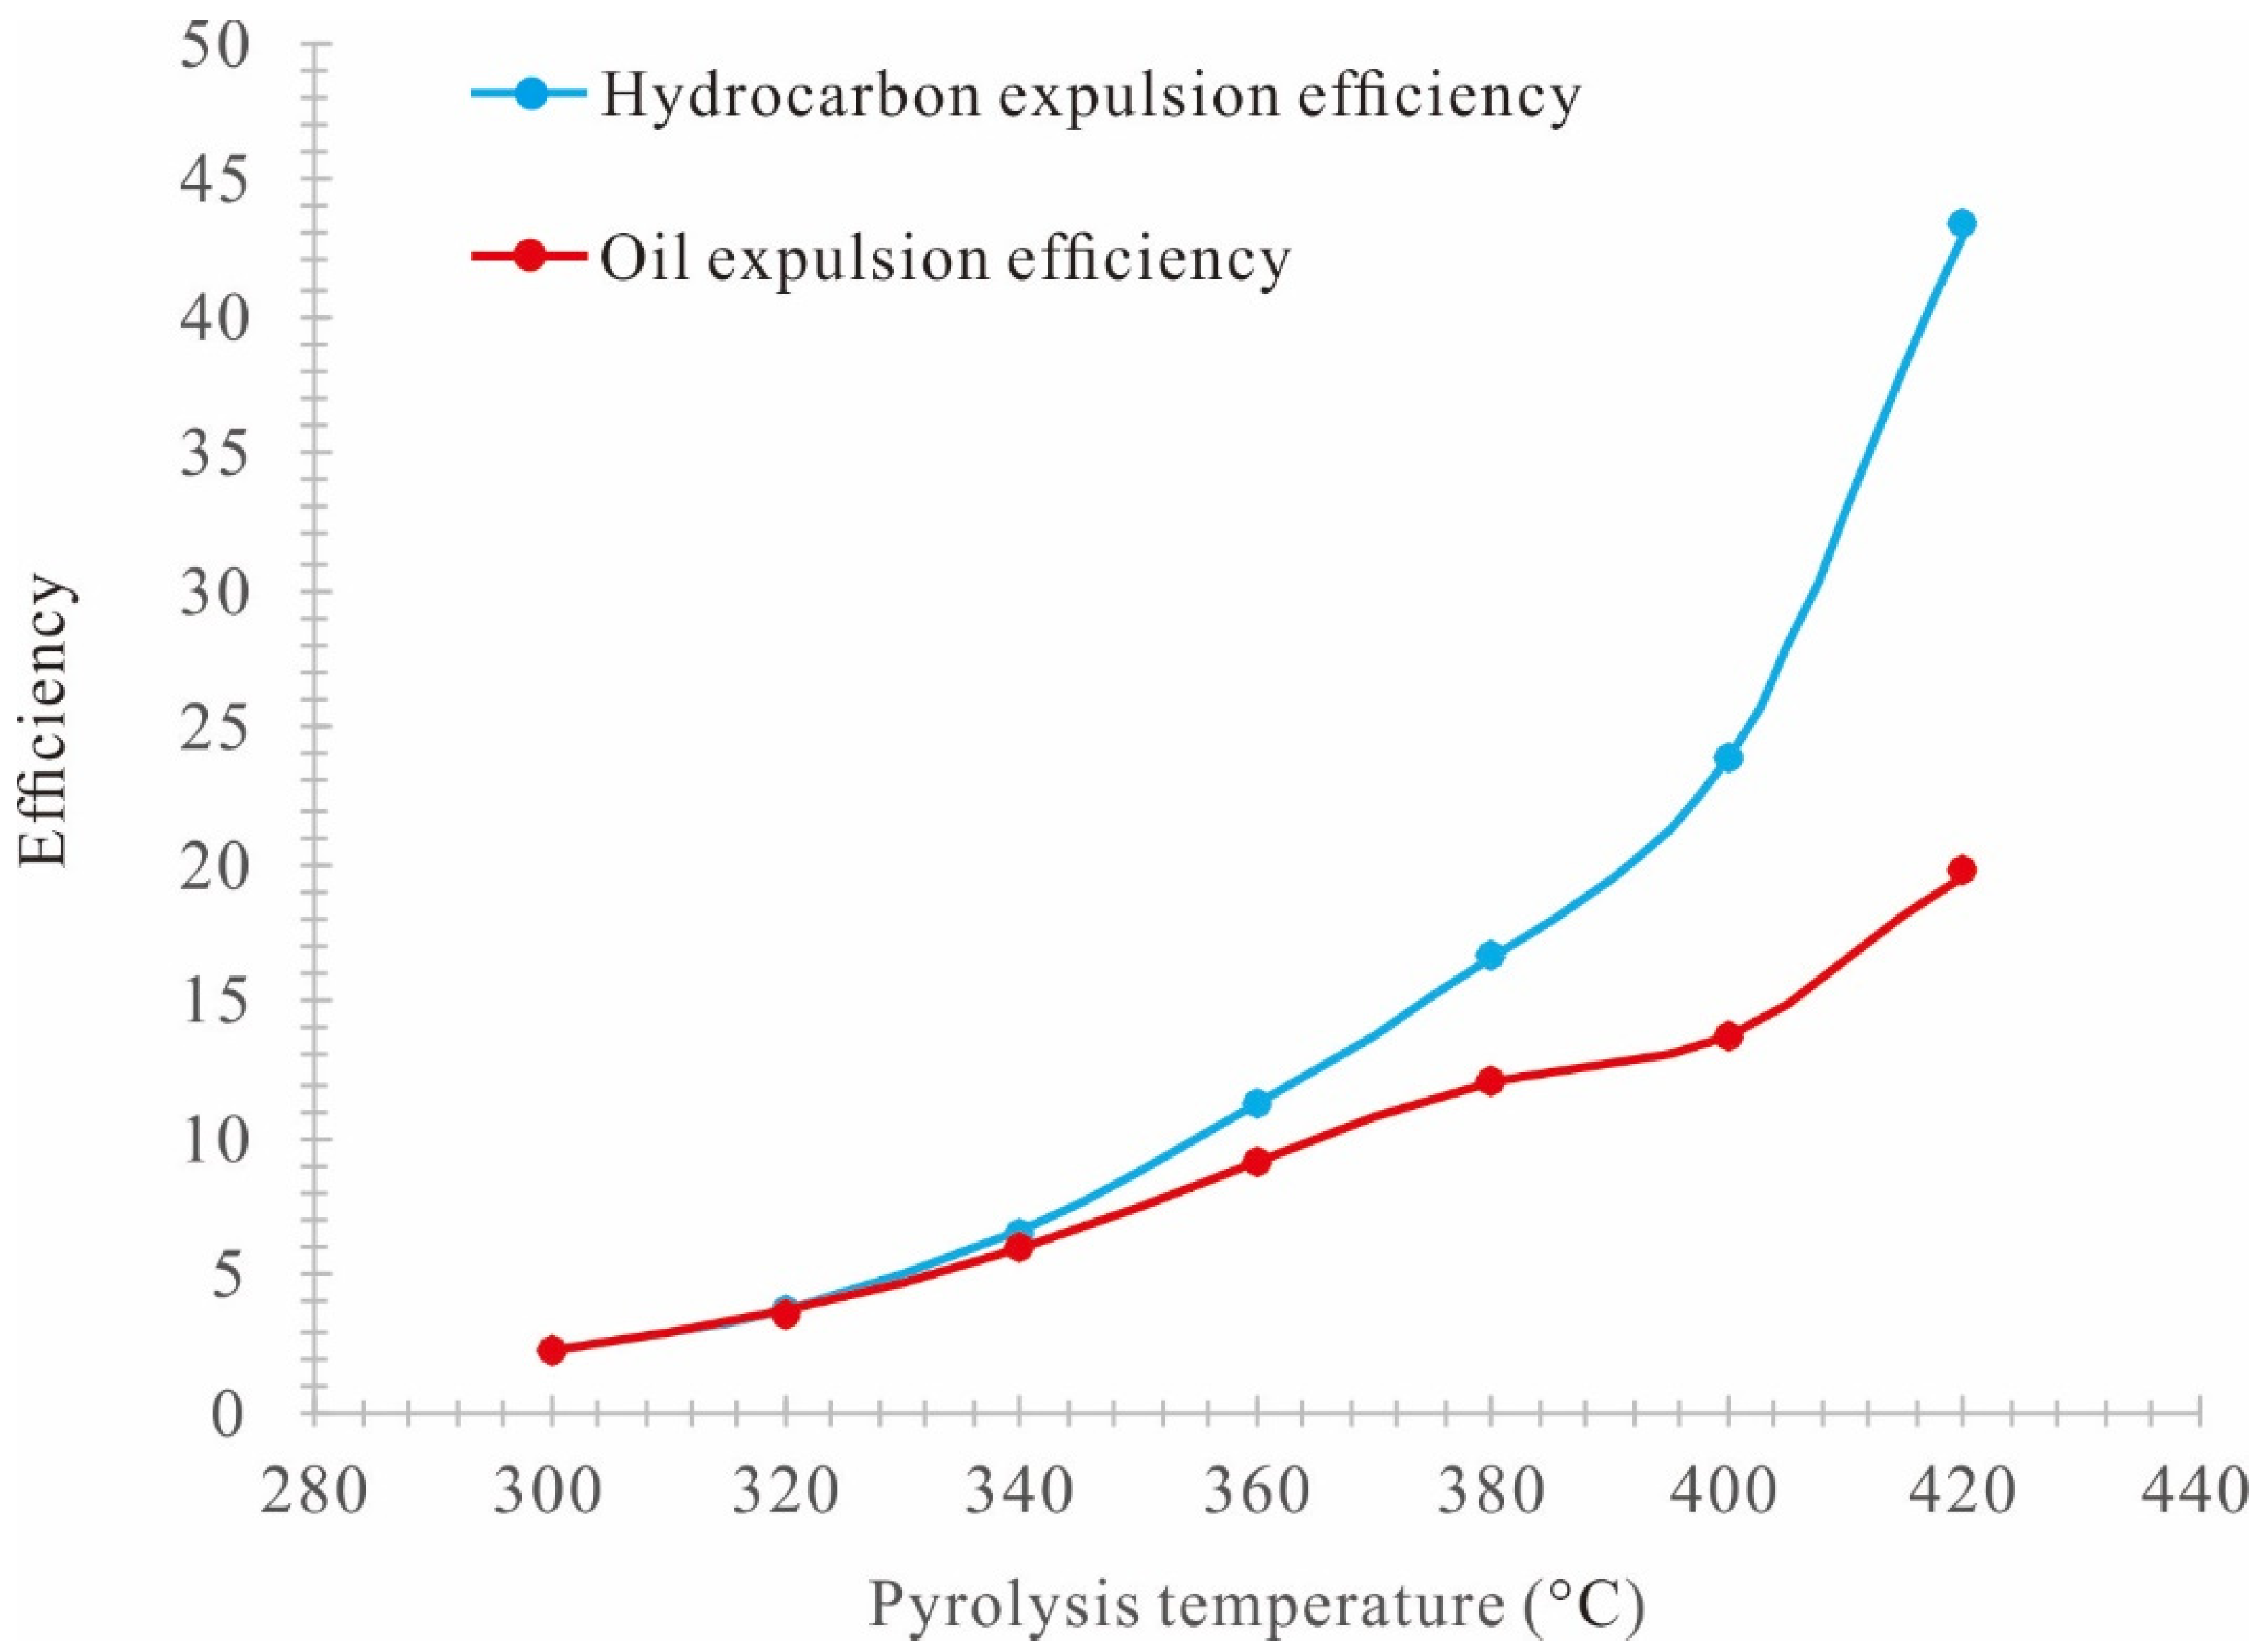
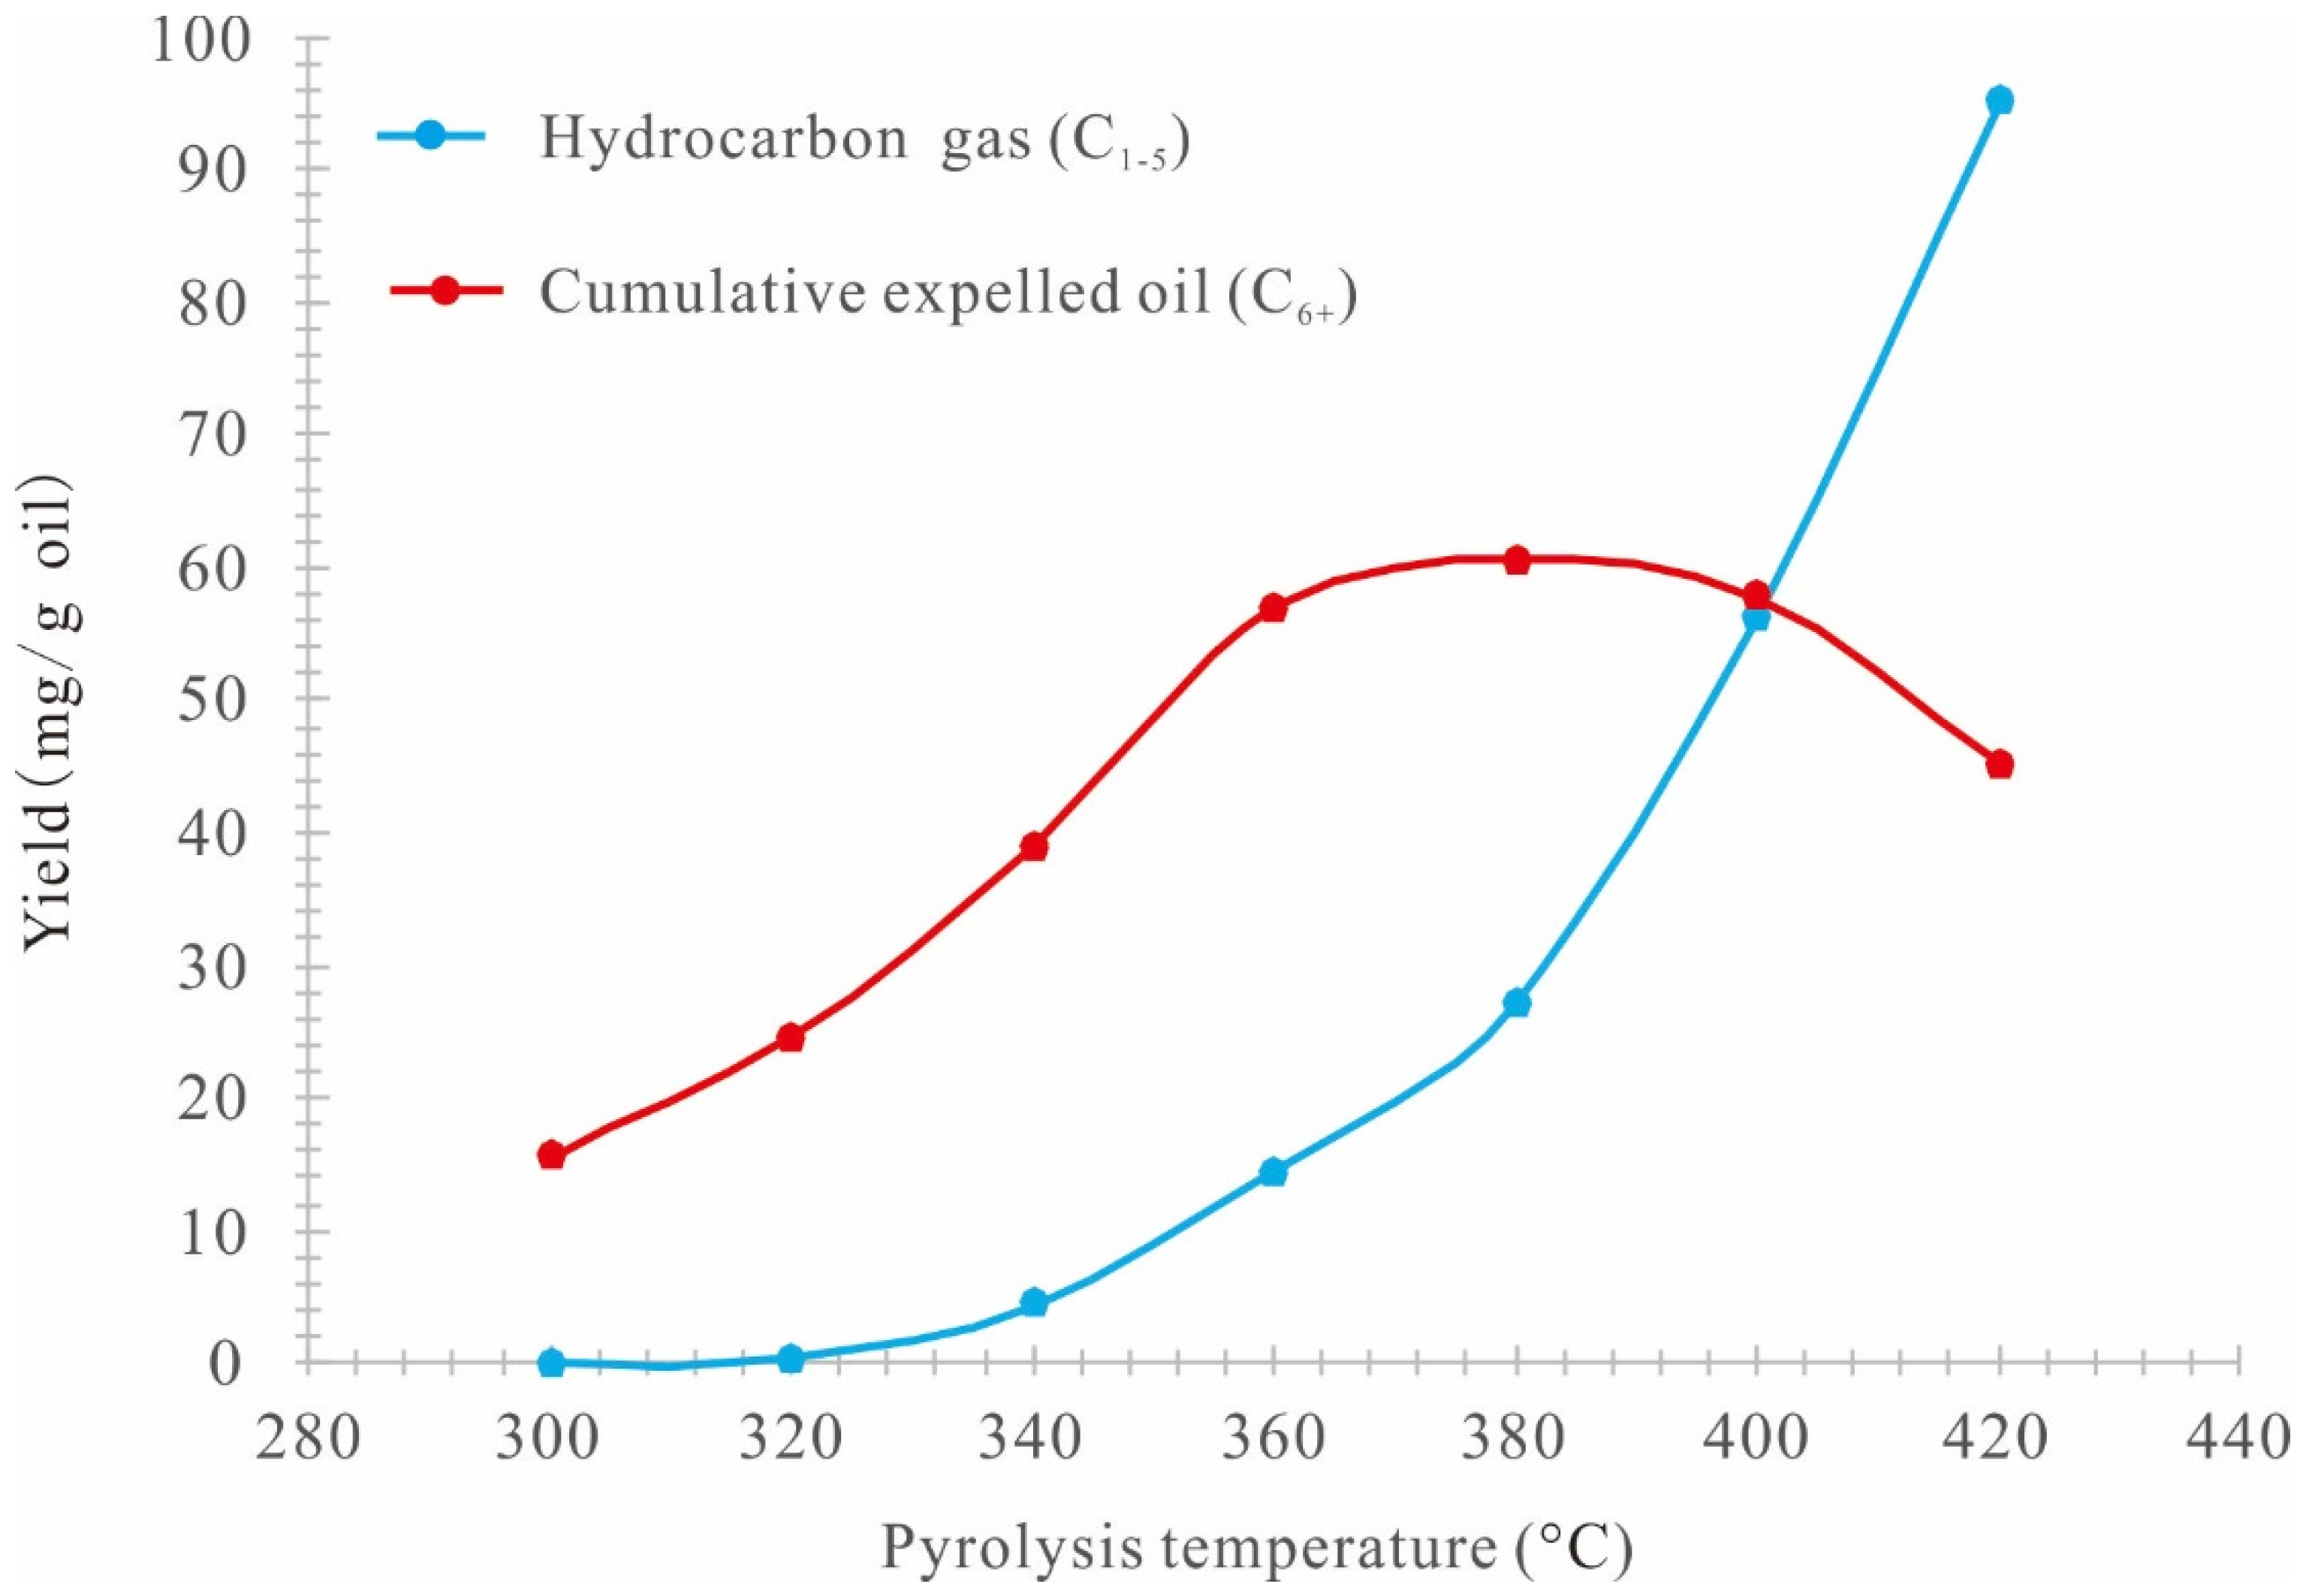
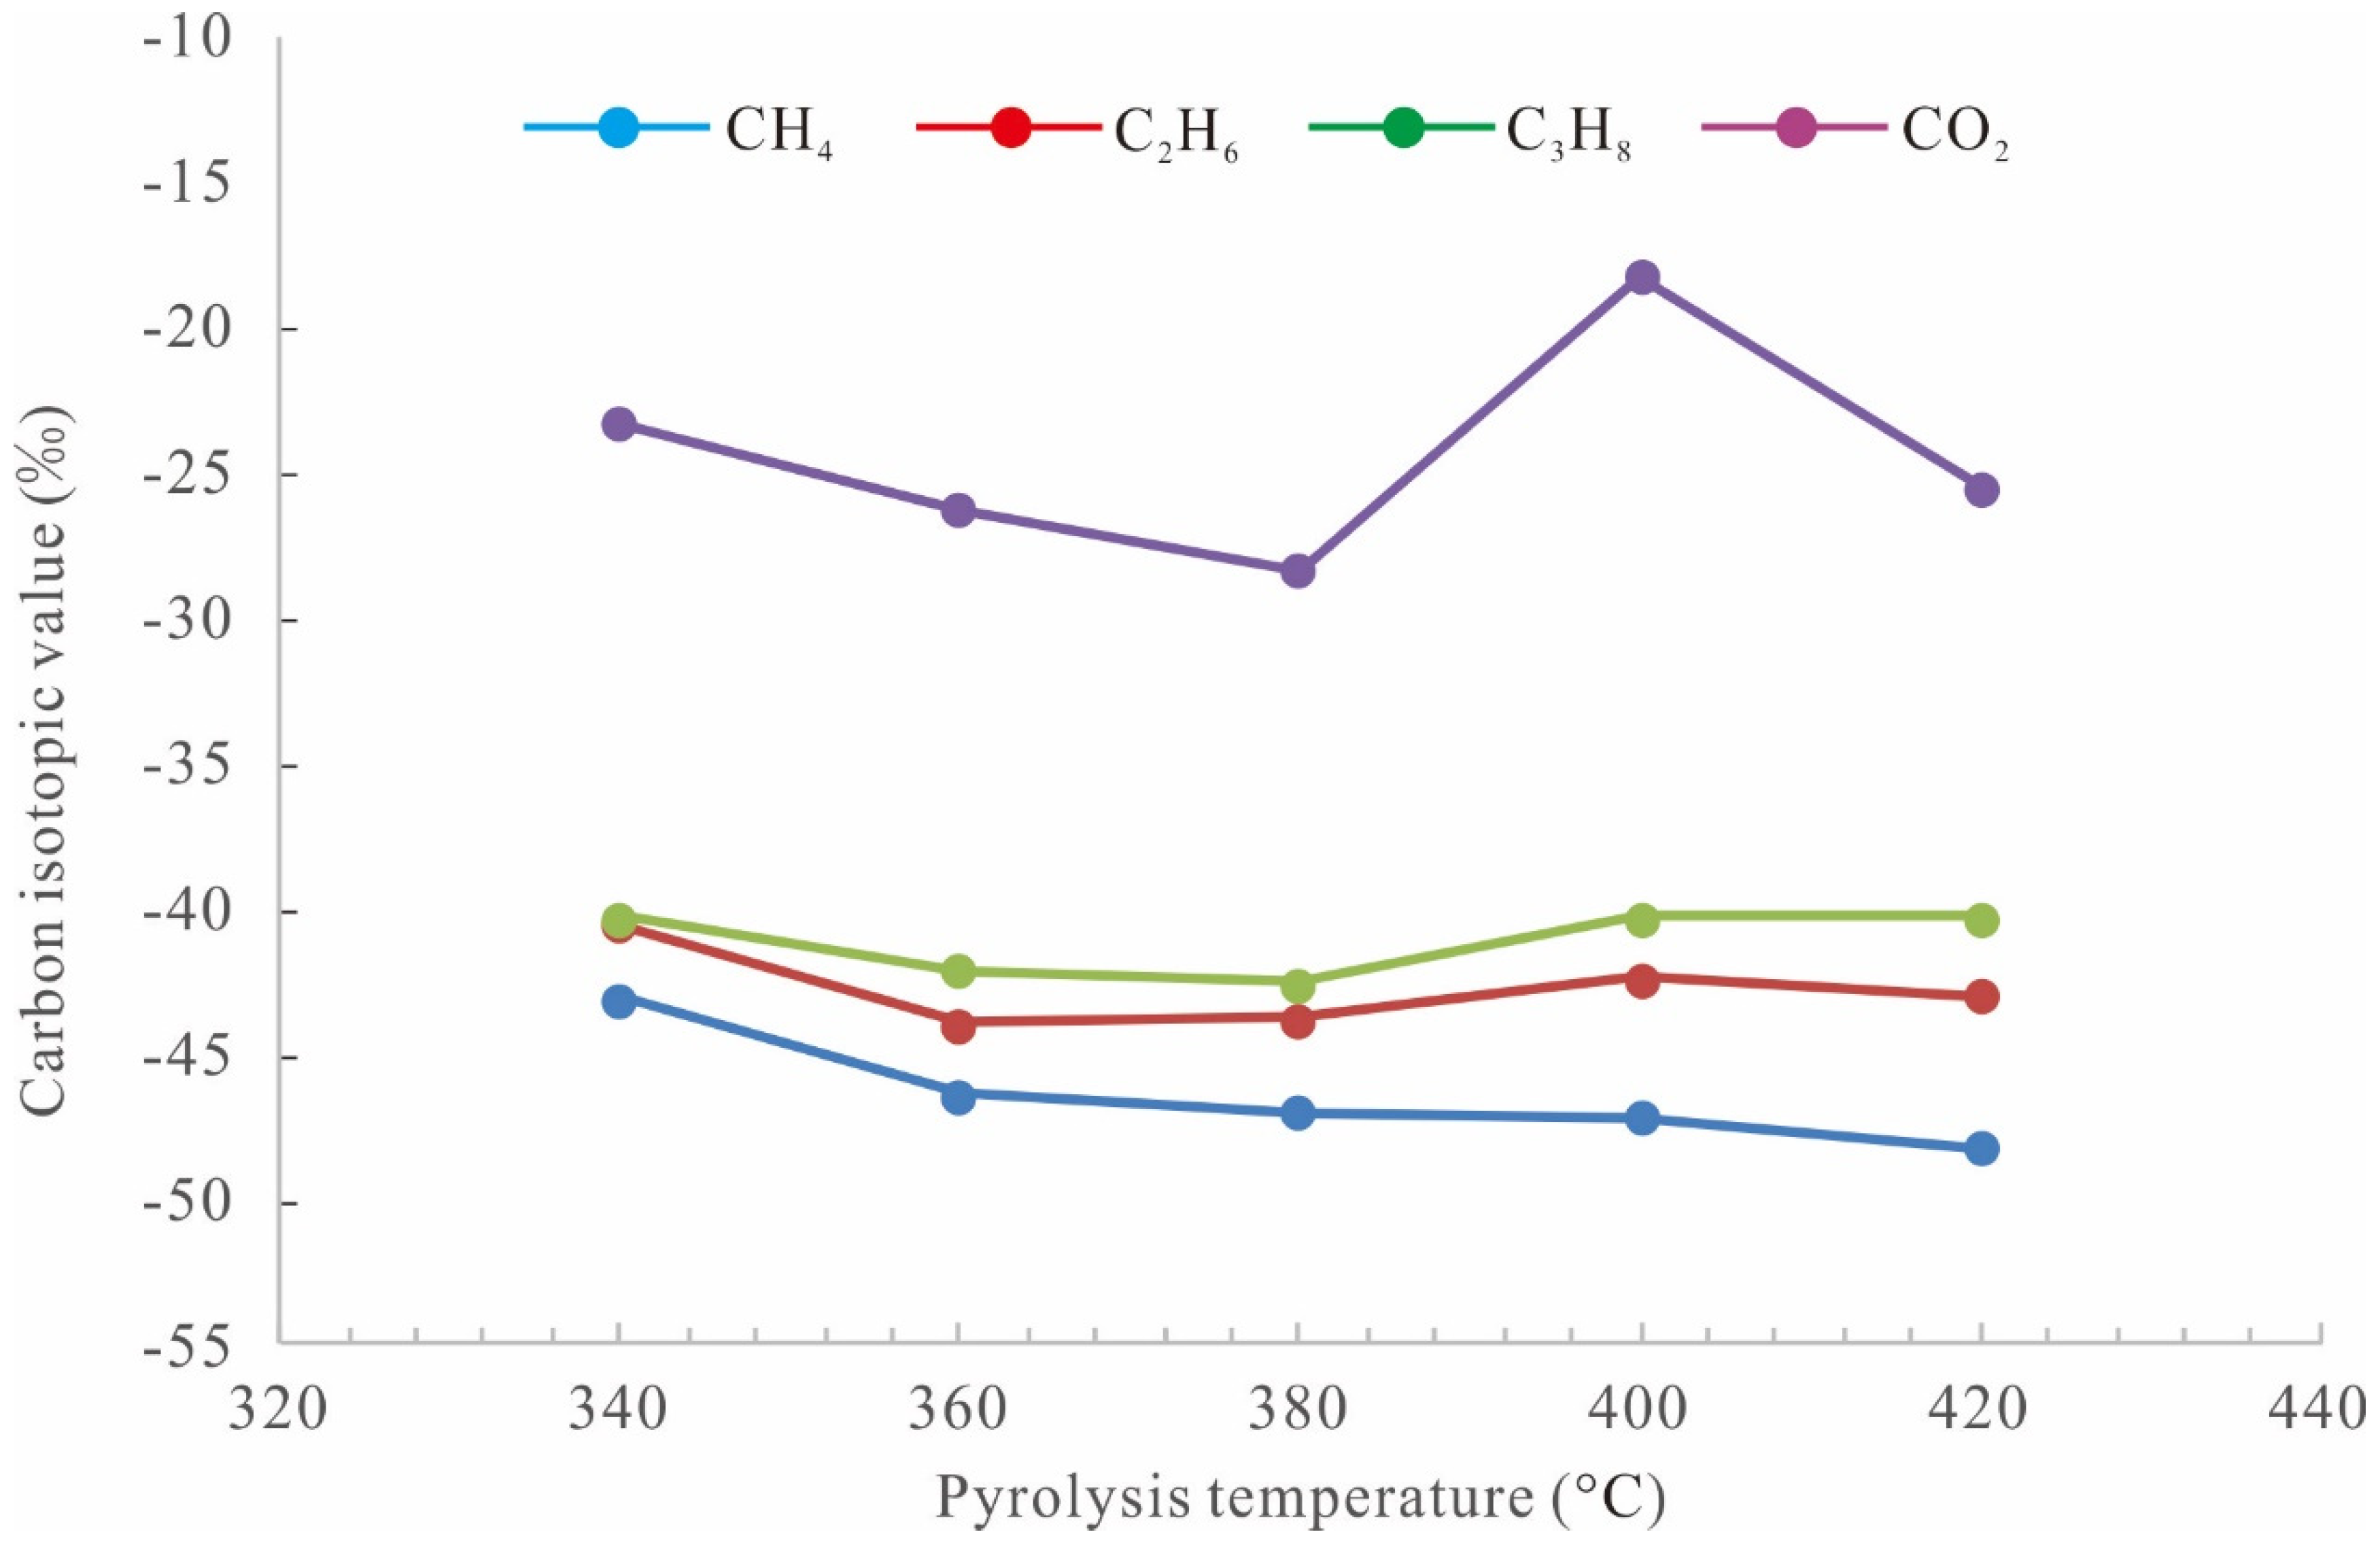
3.1. Quantification of Pyrolysis Products

After the experiments finish, take down the oil-collecting tube, pour the liquid in the tube into the beaker with dichloromethane, and flush the tube repeatedly using dichloromethane, so as to keep the light compositions as much as possible. Collect all hydrocarbon products in the oil-collecting tube. Filter the liquid in the beaker using a filter membrane to remove the solid fragments expelled together with the products. Carry out oil and water separation using a buret, to remove the water from the products. Afterwards, transfer the expelled oil dissolved in dichloromethane into a 50 mL constant volume bottle. To quantify the expelled oil, divide it into light compositions (C6–C14) and heavy compositions (C14+) to quantify separately.
C6–C14 compositions are quantified by means of the internal standard method. Prepare C24D50 with a certain concentration (β mg/mL) in advance to be the standard sample. Firstly, put a certain amount (weight ma) of solution (oil + dichloromethane) into a 4 mL glass (weigh the empty glass in advance). Then, add 50 μL of standard sample C24D50 into the glass. Finally, measure the response values of oil and the standard sample in the prepared solution by means of a chromatograph (Agilent 7890B). The weight of the light hydrocarbons in the expelled oil can be calculated based on the ratio of the C6–C14 chromatographic peak area (A1) to C24D50 peak area (A2). After the light hydrocarbons are quantified, wait until all the dichloromethane in the 4 mL glass is volatilized and the weight reaches a constant value, and then weigh the rest, which is the weight of C14+. After the expelled oil is quantified, separate and quantify group compositions, and analyze the gas chromatography (GC) and gas chromatography–mass spectrometry (GC-MS) of the saturated hydrocarbons and aromatic hydrocarbons. After the reactor cools, take out the pyrolytic residual, and extract the residual oil using dichloromethane. The residual oil is quantified in the same method as expelled oil. After the quantification of the residual oil, separate and quantify group compositions, and analyze the GC and GC-MS of the saturated hydrocarbons and aromatic hydrocarbons.

3.2. Accumulative Oil and Gas Yield

The oil generated in the pyrolysis experiment of retained oil is mainly composed of expelled oil and residual oil [1,24,25,26]. Residual oil is the oil remaining between the alumina particles in the high-pressure reactor after extraction using dichloromethane after the ending of each group. Generated oil is the sum of expelled oil and residual oil [27,28,29]. Expelled oil, residual oil, and generated oil can be subdivided into light oil C6–14 and heavy oil C14+ according to molecular size [9]. The variation characteristics of expelled oil, residual oil, and generated oil generated in the process of pyrolysis with temperature are shown in Table 1.
As for expelled oil (Figure 3a), the generation rates of light oil (C6–14) and heavy oil (C14+) are lower at the temperature of 300–320 °C. After the temperature reaches 320 °C, the generation rate of heavy oil increases rapidly and then reaches the maximum value at 380 °C. Afterwards, the percentage of heavy oil in the expelled oil begins to decrease gradually, which means that heavy oil with large molecules begins to crack when the temperature is higher than 380 °C. The generation rate of light oil is lower at the temperature of 300–320 °C, which is similar to heavy oil. At the temperature of 320–400 °C, the generation rate of light oil increases gradually. After the temperature reaches 400 °C, the generation rate of light oil decreases gradually. The variation law of C6+ in expelled oil is similar to that of heavy oil.
As for residual oil (Figure 3b), the generation rate of light oil (C6–14) is always very low, and the generation rate of heavy oil (C14+) decreases continuously during the whole process of the pyrolysis simulation experiment (300–420 °C), which means that, with the increase of temperature, heavy oil cracks gradually into light oil. The slope of the curve in the temperature interval of 300–320 °C is the lowest, which means that a small amount of residual oil is cracked in this stage. The slope of the curve in the temperature interval of 320–360 °C increases gradually, which means the cracking rate of the residual oil increases gradually in this stage. The slope of the curve at 360–420 °C is the largest, which means that the cracking rate of residual oil is the greatest in this stage. As shown in Figure 3b, C14+ controls the trend of C6+, indicating that the residual oil is dominated by the heavy oil. In other words, the residual oil is mainly composed of C14+, with C6–14 accounting for a small percentage.
Generated oil is the sum of expelled oil and residual oil, so it is the sum of Figure 3a–c. The variation law in Figure 3c is similar to that in Figure 3b, indicating that C14+ in the generated oil controls the trend of the whole curve. With the increase of the temperature, the generation rate of C14+ decreases gradually, indicating that the increasing temperature leads to the cracking of heavy oil, so it is favorable for the lightening of shale oil and improves the efficiency of in situ conversion. As for the production of shale oil, expelled oil has a higher economic value (Figure 3a), so considerable economic benefit cannot be achieved unless more residual oil is converted into expelled oil. The experiment verifies that the increase of pyrolysis temperature is favorable for the generation of more expelled oil.
The oil expulsion efficiency is calculated through the following formula:
E o = C 6 + expelled   oil C 6 + generated   oil × 100 %
where Eo is the oil expulsion efficiency; C6+expelled oil is the sum of light oil and heavy oil in expelled oil; and C6+generated oil is the sum of light oil and heavy oil in generated oil.
The variation of oil expulsion efficiency with pyrolysis temperature in the whole process of the pyrolysis simulation experiment is calculated using the above formula (Figure 4).
The hydrocarbon expulsion efficiency is calculated through the following formula:
E h = C 6 + expelled   oil + C 1 5 C 6 + generated   oil + C 1 5 × 100 %
where Eh is the hydrocarbon expulsion efficiency; C6+expelled oil + C1–5 is the sum of the light oil and heavy oil in expelled oil and the generated gaseous hydrocarbons (C1–5); and C6+generated oil + C1–5 is the sum of light oil and heavy oil in generated oil and the generated gaseous hydrocarbons (C1–5).
The variation of hydrocarbon expulsion efficiency with pyrolysis temperature in the whole process of the pyrolysis simulation experiment is calculated using the above formula (Figure 4).
Figure 4 shows that the oil expulsion efficiency and hydrocarbon expulsion efficiency are lower (<5%) at the temperature of 300–320 °C. The oil expulsion efficiency and hydrocarbon expulsion efficiency increase gradually at 320–360 °C, and their difference is small. The oil expulsion efficiency and hydrocarbon expulsion efficiency are nearly 10% at 360 °C. The oil expulsion efficiency and hydrocarbon expulsion efficiency increase rapidly at 360–420 °C, and their difference increases gradually. This indicates that the further increase of the temperature leads to the increase of the oil expulsion efficiency and hydrocarbon expulsion efficiency and generates more gas compositions, so as to increase their difference. At the end of the experiment, the oil expulsion efficiency is nearly 20%, and the hydrocarbon expulsion efficiency is nearly 50%.
As for the expelled hydrocarbon gas (C1–5) (Figure 5), the slope of the curve is lower in the temperature interval of 300–320 °C, which means the generation rate of gaseous hydrocarbon (C1–5) is lower in this stage. The slope of the curve in the temperature interval of 320–360 °C is slightly higher than that in the former interval, which means the generation rate of gaseous hydrocarbon (C1–5) increases gradually in this stage. The slope of the curve is the highest after the temperature reaches 360 °C, which means the generation rate of gaseous hydrocarbon (C1–5) increases rapidly in this stage. Figure 5 also shows that the cumulative expelled oil is always more than the hydrocarbon gas (C1–5) before the temperature reaches 400 °C, but less than the hydrocarbon gas (C1–5) after the temperature reaches 400 °C, indicating that, after the temperature exceeds 400 °C, the generated gaseous hydrocarbon (C1–5) exceeds the cumulative expelled oil (C6+) gradually due to oil pyrolysis.
The gas product is collected and its carbon isotope value is tested and analyzed (Figure 6). It shows that the carbon isotope value of gaseous hydrocarbon follows the law of δ13C1 < δ13C2 < δ13C3, and the carbon isotope value of ethane δ13C2 is lower than −28‰, indicating that oil cracking is the only origin of the natural gas generated in the pyrolysis simulation. This also suggests that, when the temperature is less than 420 °C (1.47%Ro), there will be no carbon isotopic reversal for the alkane gas generated by the same source rock.

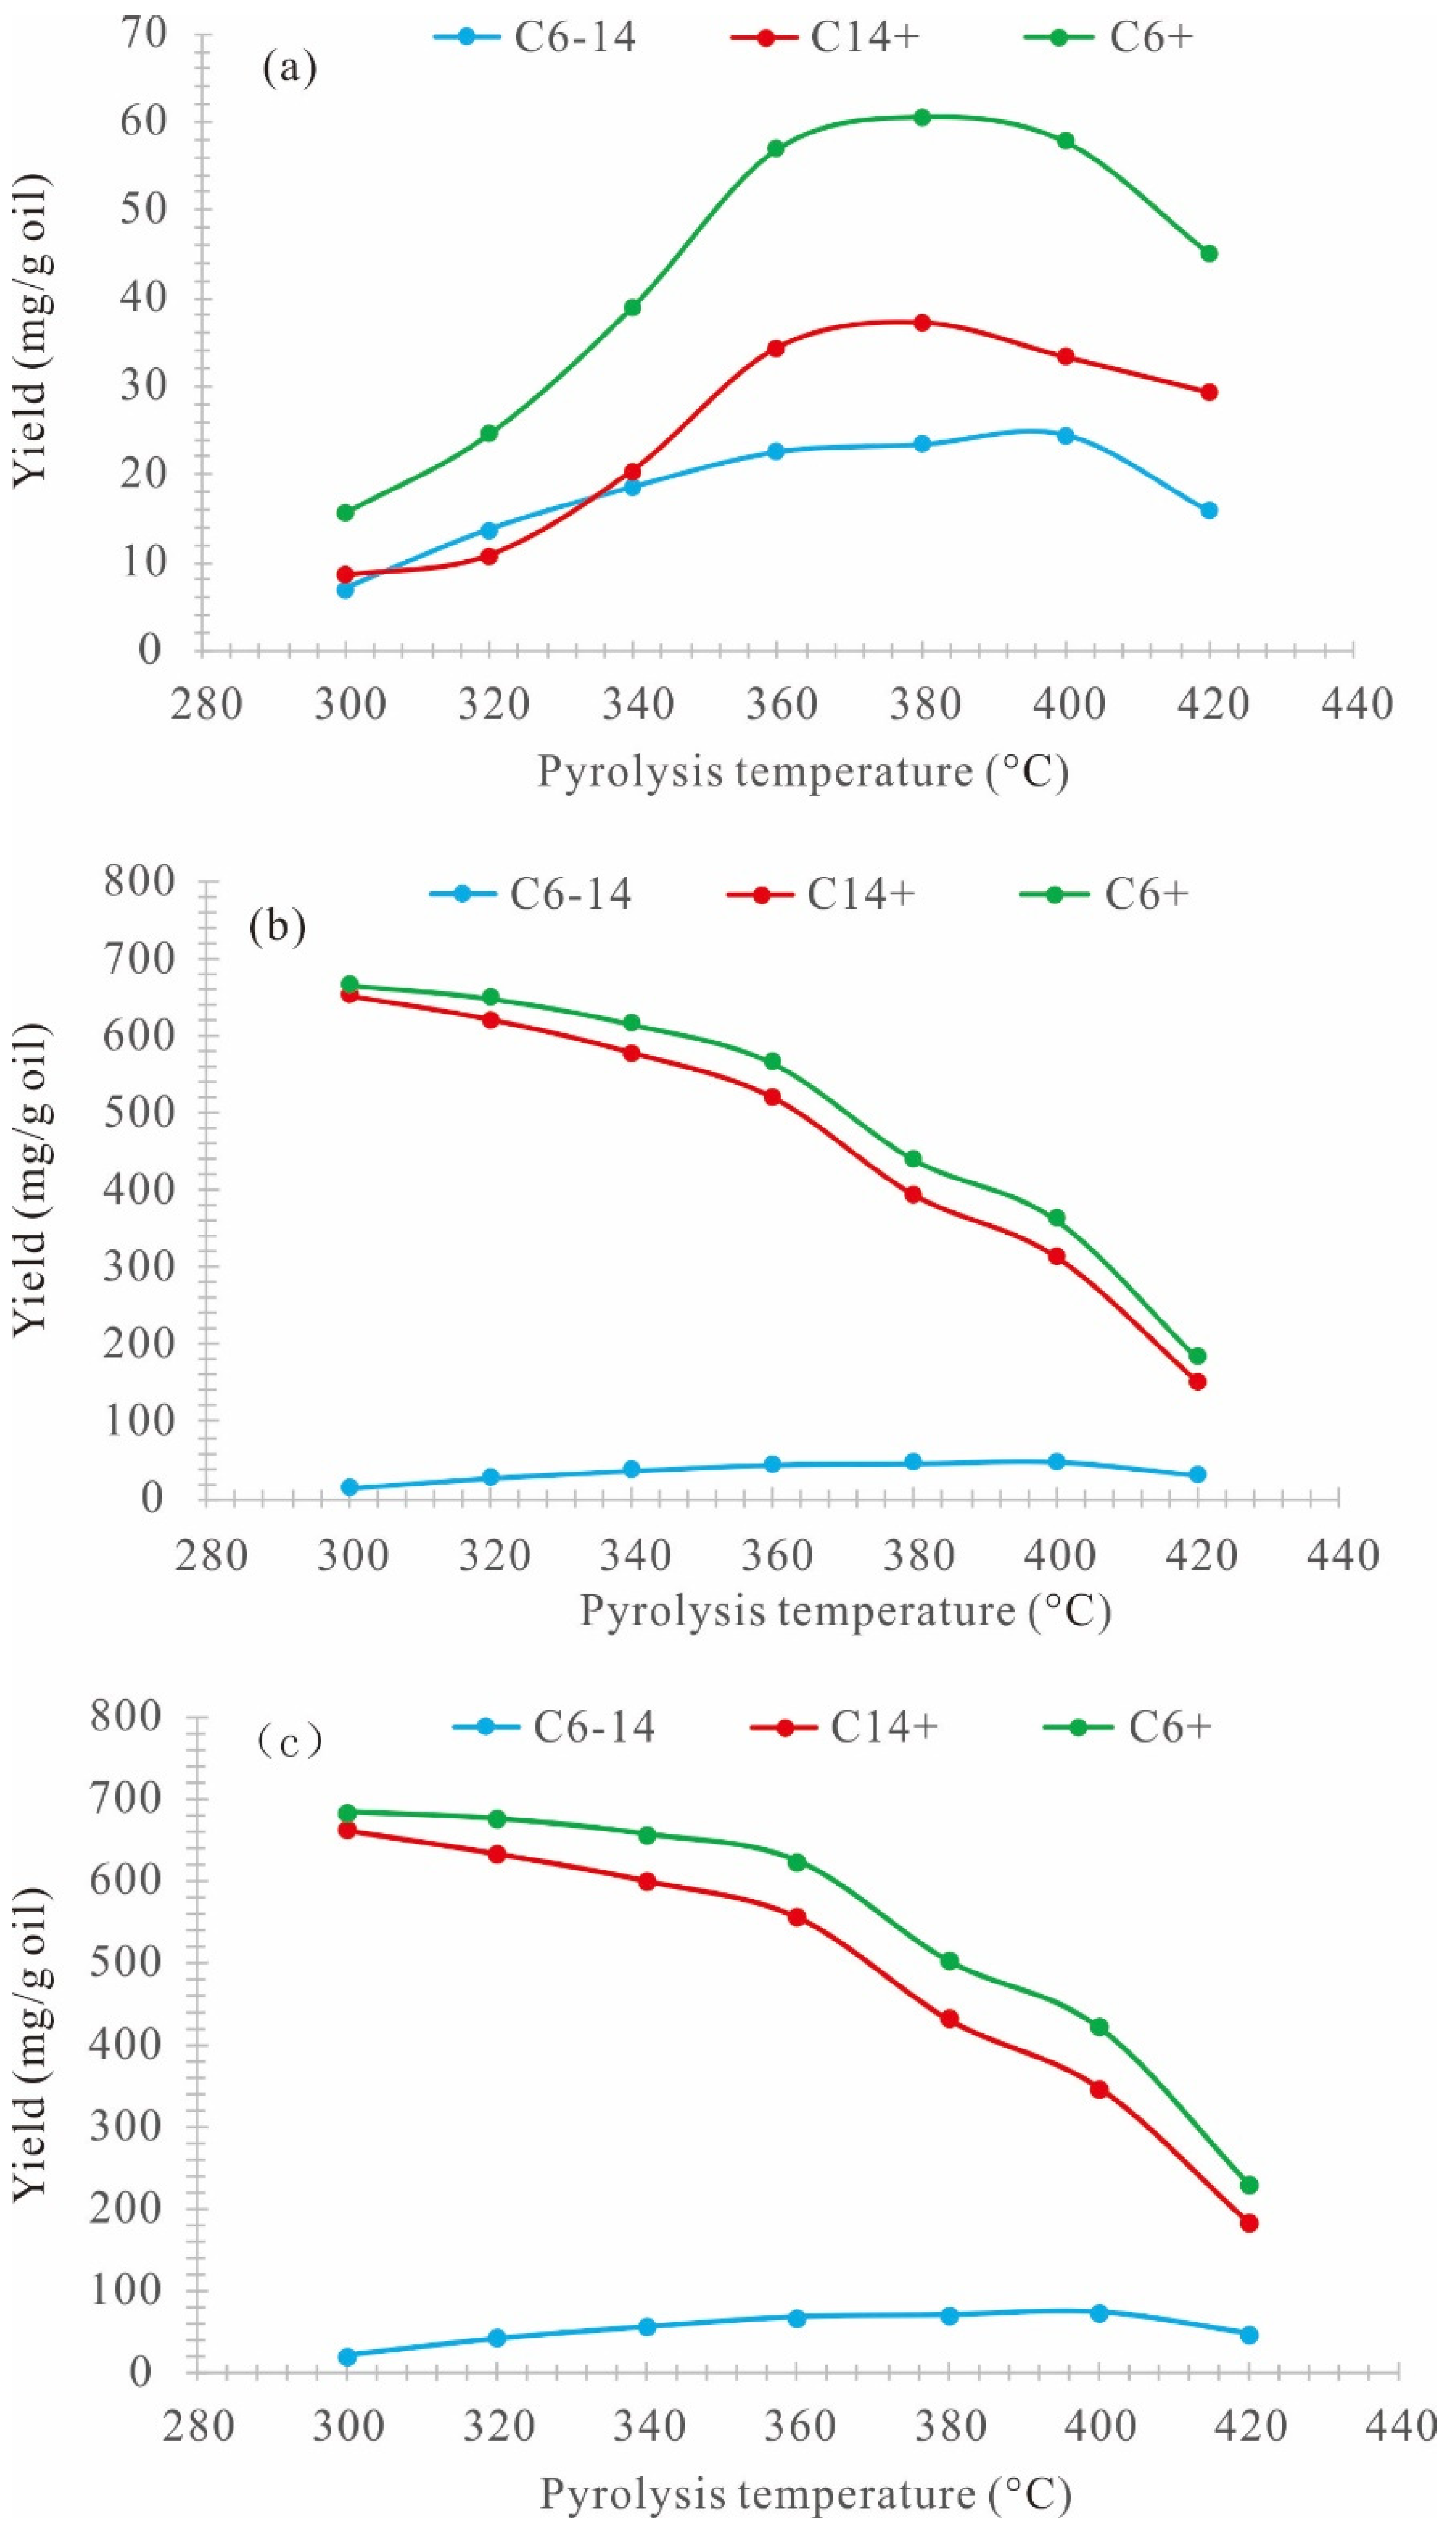
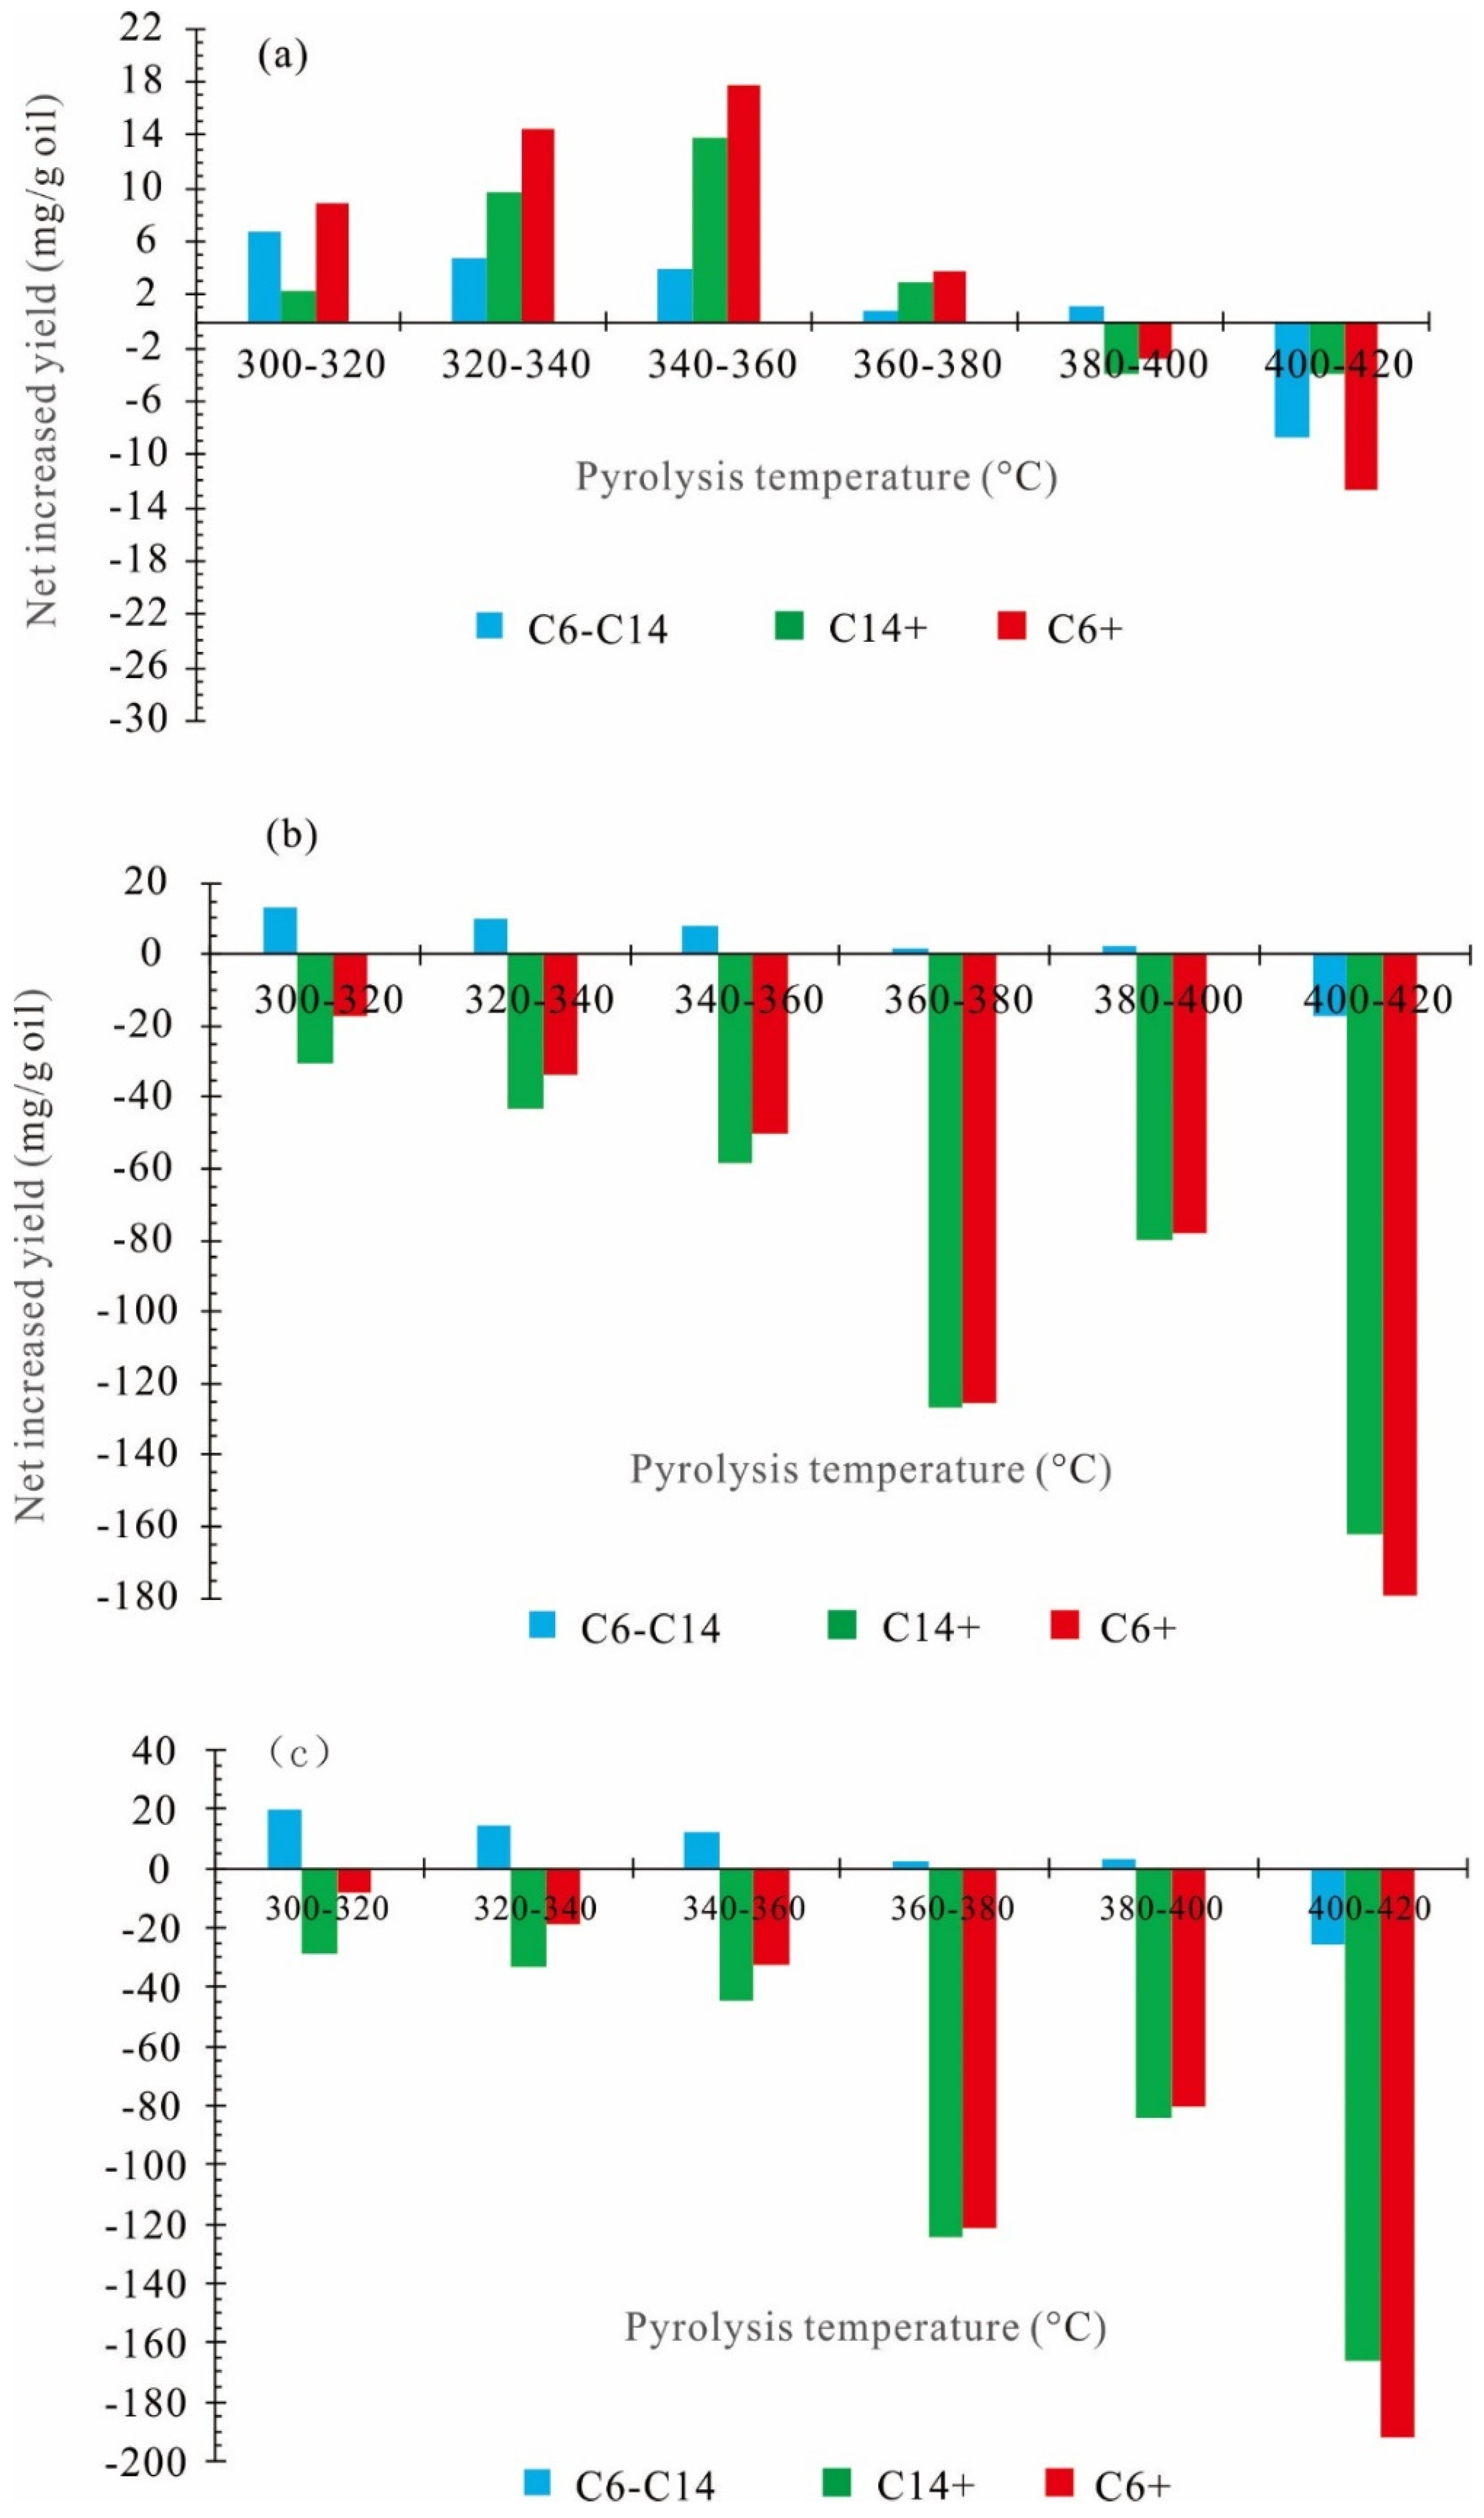
3.3. Net Increased Oil Yield

The net increased oil yield in one temperature interval is the subtraction result of the cumulative oil yields in two groups of experiments at neighboring pyrolysis temperature points. It can reflect the characteristics of the products in one temperature interval [7,24,25]. The net increased oil yield in each temperature interval is calculated (Table 2).
As for the net increased expelled oil, light oil (C6–14), heavy oil (C14+), and expelled oil (C6+) are nearly positive before the temperature reaches 380 °C (Figure 7), indicating that light oil and heavy oil are generated before the temperature reaches 380 °C. Compared with the net increased heavy oil, the net increased light oil is more at the temperature of 300–320 °C, but less at the temperature of 320–380 °C. The net increased light oil is always positive at the temperature of 300–400 °C, indicating that the generation rate of light oil is higher than its cracking rate in this temperature interval. At the temperature of 380–420 °C, the net increased heavy oil and the net increased expelled oil are both negative, indicating that heavy oil pyrolysis occurs in this temperature interval.
As for the net increased residual oil, the net increased heavy oil (C14+) is always negative in the whole temperature interval (Figure 7), indicating that, in the process of hydrocarbon generation, the residual oil pyrolyzes all the time to convert into expelled oil. In the whole temperature interval, except 400–420 °C, the net increased light oil is positive, indicating that the cracking rate of light oil is lower than its generation rate. As for the net increased residual oil, the light oil (C6–14) is less than the heavy oil (C14+), indicating that, in the hydrocarbon-generating pyrolysis simulation process of retained oil, the light oil is rarely retained in the alumina particles in the high-pressure reactor, and the residual oil is mainly heavy oil. The net increased generated oil is similar to the net increased residual oil (Figure 7c).

3.4. Chromatographic Characteristics of Generated Oil

The oil chromatography with pyrolysis temperature can reflect the information of oil mass [30,31,32,33]. Figure 8 shows the variation characteristics of all oil chromatography of the cumulative expelled oil with the pyrolysis temperature. As for the expelled oil, the carbon number of the main peak is smaller and the Y-axis signal is weaker in the temperature interval of 300–320 °C, indicating that the expelled oil is lighter and its generation rate is lower in this stage. In the temperature interval of 320–360 °C, the Y-axis signal becomes stronger gradually, and the carbon number of the main peak deviates to the right and increases, indicating that a great amount of oil and gas begins to generate in this stage. In the temperature interval of 360–420 °C, the peak turns to the left gradually, indicating that, with further increase of the temperature, heavy oil gradually cracks, and the oil becomes light gradually.
As for the residual oil, the Y-axis value decreases gradually with the temperature, indicating that the residual oil cracks and is expelled with the increase of the temperature (Figure 9). In the temperature interval of 300–320 °C, their peak types are relatively accordant, and the decreasing amplitude of the Y-axis value is smaller, indicating that no large-scale cracking happens in this stage. In the temperature interval of 320–360 °C, the peak narrows gradually, and the Y-axis value decreases gradually, indicating that the residual oil cracks gradually in this stage. In the temperature interval of 380–420 °C, the Y-axis value decreases further, indicating that severe pyrolysis occurs and the residual oil cracks and is expelled gradually in this stage.

3.5. Stages of Hydrocarbon Generation of Retained Oil

Based on the experiments and analysis, the inductive theoretical model of hydrocarbon generation of retained oil is divided into three stages (Figure 10):
(1)
300–320 °C (0.48%Ro–0.57%Ro): Slow hydrocarbon generation stage. In this stage, the increasing amplitude of the expelled oil rate, the decreasing amplitude of the residual oil rate, and the generation rate of gas hydrocarbons (C1–5) are smaller, and most retained oil remains in the alumina particles in the high-pressure reactor and can hardly be expelled.
(2)
320–360 °C (0.57%Ro–0.79%Ro): Rapid hydrocarbon generation stage. In this stage, the expelled oil rate increases rapidly, the residual oil rate decreases rapidly, and the generation rate of gas hydrocarbons (C1–5) increases gradually.
(3)
360–420 °C (0.79%Ro–1.47%Ro): Residual oil pyrolysis stage. The continuous increase of the temperature leads to the pyrolysis of the residual oil retained in the alumina particles in the reactor. As a result, the total residual oil decreases rapidly, the expelled oil continues to increases rapidly, and the generation rate of gas hydrocarbons (C1–5) increases rapidly.
Figure 10. Hydrocarbon generation model of retained oil.
Processes 12 00121 g010

4. Conclusions

Previous studies have mainly focused on evaluating the hydrocarbon generation potential of the Chang 7 shale, with very few studies focusing on the extracts from the source rocks. Based on the hydrocarbon-generating pyrolysis simulation experiment of a semi-open–semi-closed system, this study carried out hydrocarbon-generating pyrolysis simulation experiments on the liquid sample of Chang 7 Member shale in the Ordos Basin after the extraction of chloroform bitumen “A” (i.e., retained oil) under different temperatures (300 °C, 320 °C, 340 °C, 360 °C, 380 °C, 400 °C, and 420 °C). On this basis, the hydrocarbon generation and expulsion characteristics of retained oil were researched, and the hydrocarbon generation model of retained oil was established. Based on the simulation experiment, an inductive theoretical model of hydrocarbon generation of retained oil is established.
(1)
300–320 °C (0.48%Ro–0.57%Ro) stage is the slow hydrocarbon generation stage, when the increasing amplitude of the expelled oil rate and the decreasing amplitude of residual oil rate are smaller, and most of the retained oil remains in the alumina particles in the reactor and can hardly be expelled.
(2)
320–360 °C (0.57%Ro–0.79%Ro) stage is the rapid hydrocarbon generation stage, when the expelled oil rate increases rapidly, the residual oil rate decreases rapidly, and the generation rate of gaseous hydrocarbons (C1–5) increases rapidly as well.
(3)
360–420 °C (0.79%Ro–1.47%Ro) stage is the pyrolysis stage, when the continuous increase of the temperature leads to the pyrolysis of the residual oil retained in the alumina particles in the reactor.
As a result, the total residual oil decreases rapidly, the expelled oil continues to increase rapidly, and the generation rate of gaseous hydrocarbons increases rapidly.

Author Contributions

Conceptualization, W.H.; data curation, Z.P.; formal analysis, S.L.; methodology, X.L. and Y.L.; resources, L.H.; software, Z.Z.; supervision, L.Z. All authors have read and agreed to the published version of the manuscript.

Funding

This study is financially supported by the National Natural Science Foundation of China (Grant No. 41872162), and Research on the Basic Theory and Key Technologies of in situ Conversion Process of Medium and Low Maturity Shale Oil (Grant No. 2021DJ5202).

Data Availability Statement

All data are contained within the article.

Conflicts of Interest

Authors Xia Luo, Lianhua Hou, Zhongying Zhao, Senhu Lin, Zhenglian Pang and Lijun Zhang were employed by the company PetroChina. The remaining authors declare that the research was conducted in the absence of any commercial or financial relationships that could be construed as a potential conflict of interest.

References

  1. Zhang, B.; Mao, Z.G.; Zhang, Z.Y.; Yuan, Y.L.; Chen, X.L.; Shi, Y.X.; Liu, G.L.; Shao, X.Z. Black shale formation environment and its control on shale oil enrichment in Triassic Chang 7 Member, Ordos Basin, NW China. Pet. Explor. Dev. 2021, 48, 1304–1314. [Google Scholar] [CrossRef]
  2. Cao, H.R.; Lei, Y.; Wang, X.Y.; Zou, Y.R.; Peng, P.A. Molecular structure evolution of Type I kerogen during pyrolysis: Case study from the Songliao Basin, NE China. Mar. Pet. Geol. 2021, 134, 105338. [Google Scholar] [CrossRef]
  3. Dieckmann, V.; Schenk, H.J.; Horsfield, B. Kinetics of petroleum generation and cracking by programmed-temperature closed-system pyrolysis of Toarcian Shales. Fuel 1998, 77, 23–31. [Google Scholar] [CrossRef]
  4. Gai, H.F.; Tian, H.; Cheng, P.; Zhou, Q.; Li, T.F.; Wang, X.; Xiao, X.M. Influence of retained bitumen in oil-prone shales on the chemical and carbon isotopic compositions of natural gases: Implications from pyrolysis experiments. Mar. Pet. Geol. 2019, 101, 148–161. [Google Scholar] [CrossRef]
  5. Hill, R.J.; Tang, Y.; Kaplan, I.R. Insights into oil cracking based on laboratory experiments. Org. Geochem. 2003, 34, 1651–1672. [Google Scholar] [CrossRef]
  6. Li, E.T.; Pan, C.C.; Yu, S.; Jin, X.D.; Liu, J.Z. Interaction of coal and oil in confined pyrolysis experiments: Insight from the yields and carbon isotopes of gas and liquid hydrocarbons. Mar. Pet. Geol. 2016, 69, 13–37. [Google Scholar] [CrossRef]
  7. Huang, W.K.; Zeng, L.F.; Pan, C.C.; Xiao, Z.Y.; Zhang, H.Z.; Huang, Z.B.; Zhao, Q.; Yu, S.; Xu, H.; Chen, C.S.; et al. Petroleum generation potentials and kinetics of coaly source rocks in the Kuqa Depression of Tarim Basin, northwest China. Org. Geochem. 2019, 133, 32–52. [Google Scholar] [CrossRef]
  8. Zeng, L.F.; Huang, W.K.; Pan, C.C.; Jin, J.; Ma, W.Y.; Yu, S.; Xu, H.; Liu, D.Y.; Liao, Y.H.; Liu, J.Z. Assessment of oil potentials for humic coals on the basis of flash Py-GC, Rock-Eval and confined pyrolysis experiments. Org. Geochem. 2020, 148, 104097. [Google Scholar] [CrossRef]
  9. Wang, Q.T.; Liu, W.H.; Pei, L.X.; Cai, Z.H.; Luo, H.Y.; Wang, X.F.; Zhang, D.D.; Liu, J.Z. Hydrocarbon generation from calcium stearate: Insights from closed-system pyrolysis. Mar. Pet. Geol. 2021, 126, 104923. [Google Scholar] [CrossRef]
  10. Jin, X.D.; Li, E.T.; Pan, C.C.; Yu, S.; Liu, J.Z. Interaction of coal and oil in confined pyrolysis experiments: Insight from the yield and composition of gas hydrocarbons. Mar. Pet. Geol. 2013, 48, 379–391. [Google Scholar] [CrossRef]
  11. Wang, Q.T.; Lu, H.; Greenwood, P.; Shen, C.C.; Liu, J.Z.; Peng, P.A. Gas evolution during kerogen pyrolysis of Estonian Kukersite shale in confined gold tube system. Org. Geochem. 2013, 65, 74–82. [Google Scholar] [CrossRef]
  12. Pan, C.C.; Jiang, L.L.; Liu, J.Z.; Zhang, S.C.; Zhu, G.Y. The effects of pyrobitumen on oil cracking in confined pyrolysis experiments. Org. Geochem. 2012, 45, 29–47. [Google Scholar] [CrossRef]
  13. Jia, W.; Wang, Q.; Liu, J.; Peng, P.; Li, B.; Lu, J. The effect of oil expulsion or retention on further thermal degradation of kerogen at the high maturity stage: A pyrolysis study of type II kerogen from Pingliang shale, China. Org. Geochem. 2014, 71, 17–29. [Google Scholar] [CrossRef]
  14. Sun, J.; Xiao, X.M.; Cheng, P.; Tian, H. Formation and evolution of nanopores in shales and its impact on retained oil during oil generation and expulsion based on pyrolysis experiments. J. Pet. Sci. Eng. 2019, 176, 509–520. [Google Scholar] [CrossRef]
  15. Liu, C.; Lei, M.Y.; Sun, B.L.; Wang, X. Origin and process of carbon isotopic reversal of tight sandstone gas in the Shixi gas field, eastern margin of Ordos Basin. Int. J. Coal Geol. 2023, 276, 104327. [Google Scholar] [CrossRef]
  16. Su, K.M.; Chen, S.J.; Hou, Y.T.; Zhang, H.F.; Zhang, X.L.; Zhang, W.X.; Liu, G.L.; Hu, C.; Han, M.M. Geochemical characteristics, origin of the Chang 8 oil and natural gas in the southwestern Ordos Basin, China. J. Pet. Sci. Eng. 2021, 200, 108406. [Google Scholar] [CrossRef]
  17. Yang, S.R.; Gang, W.Z.; Cao, J.J.; Liu, J.P.; Gao, G.; Dang, W.L. Geochemical characteristics, origin and carbon isotope reversal of the presalt natural gas in the Lower Paleozoic Ordovician carbonates, Ordos Basin, China. Mar. Pet. Geol. 2022, 139, 105577. [Google Scholar] [CrossRef]
  18. Lotfy, N.M.; Qteishat, A.; Farouk, S.; Ahmad, F.; Al-Kahtany, K.; Hsu, C.S. Geochemical characteristics and genetic types of Ordovician tight gas in the Risha Gas Field, Eastern Jordan based on carbon and hydrogen isotope compositions. Mar. Pet. Geol. 2022, 143, 105810. [Google Scholar] [CrossRef]
  19. Hakimi, M.H.; Abass, A.N.; Lashin, A.; Gharib, A.F.; Radwan, A.E.; Rahim, A.; Ahmed, A.; Asiwaju, L.; Afify, W.E. Geochemical investigation and basin modelling of the Al renk shale formation in the Melut Basin, south Sudan: Implications for estimation of thermogenic gas generation potential. Mar. Pet. Geol. 2022, 146, 105926. [Google Scholar] [CrossRef]
  20. Sun, J.; Xiao, X.M.; Cheng, P.; Wang, M.L.; Tian, H. The relationship between oil generation, expulsion and retention of lacustrine shales: Based on pyrolysis simulation experiments. J. Pet. Sci. Eng. 2021, 196, 107625. [Google Scholar] [CrossRef]
  21. Elzain, H.E.; Abdullatif, O.A.; Senapathi, V.; Chung, S.Y.; Sabarathinam, C.; Sekar, S. Lithofacies modeling of Late Jurassic in upper Ulayyah reservoir unit at central Saudi Arabia with inference of reservoir characterization. J. Pet. Sci. Eng. 2020, 185, 106664. [Google Scholar] [CrossRef]
  22. Jin, X.; Li, G.X.; Meng, S.W.; Wang, X.Q.; Liu, C.; Tao, J.P.; Liu, H. Microscale comprehensive evaluation of continental shale oil recoverability. Pet. Explor. Dev. 2021, 48, 256–268. [Google Scholar] [CrossRef]
  23. Wang, X.L.; Zhang, G.S.; Tang, W.; Wang, D.H.; Wang, K.; Liu, J.Y.; Du, D. A review of commercial development of continental shale oil in China. Energy Geosci. 2022, 3, 282–289. [Google Scholar] [CrossRef]
  24. Guo, Q.H.; Li, S.X.; Jin, Z.K.; Zhou, X.P.; Liu, C.L. Characteristics and exploration targets of Chang 7 shale oil in Triassic Yanchang Formation, Ordos Basin, NW China. Pet. Explor. Dev. 2023, 50, 878–893. [Google Scholar] [CrossRef]
  25. Wang, G.P.; Zhang, Q.; Zhu, R.K.; Tang, X.; Liu, K.Q.; Jin, Z.J. Geological controls on the pore system of lacustrine unconventional shale reservoirs: The Triassic Chang 7 member in the Ordos Basin, China. Geoenergy Sci. Eng. 2023, 221, 111139. [Google Scholar] [CrossRef]
  26. Zhou, Y.; Xu, Z.G.; Wu, Z.H. R Molecular and experimental study on hydrogen sulfide formation mechanism during Chang 7 type-II oil shale kerogen pyrolysis. Fuel 2023, 340, 127552. [Google Scholar] [CrossRef]
  27. Vandenbroucke, M.; Behar, F.; Espitalie, J. Characterization of sedimentary organic matter by preparative pyrolysis: Comparison with Rock Eval pyrolysis and pyrolysis-gas chromatography techniques. Energy Fuels 1988, 2, 252–258. [Google Scholar] [CrossRef]
  28. Tang, X.; Zhang, J.C.; Jiang, Z.X.; Zhao, X.Z.; Liu, K.Y.; Zhang, R.F.; Xiong, J.Y.; Du, K.F.; Huang, Z.L.; Yu, J.D. Characteristics of solid residue, expelled and retained hydrocarbons of lacustrine marlstone based on semi-closed system hydrous pyrolysis: Implications for tight oil exploration. Fuel 2015, 162, 186–193. [Google Scholar] [CrossRef]
  29. Shao, D.Y.; Zhang, T.W.; Ko, L.T.; Li, Y.F.; Yan, J.P.; Zhang, L.L.; Luo, H.; Qiao, B. Experimental investigation of oil generation, retention, and expulsion within Type II kerogen-dominated marine shales: Insights from gold-tube nonhydrous pyrolysis of Barnett and Woodford Shales using miniature core plugs. Int. J. Coal Geol. 2020, 217, 103337. [Google Scholar] [CrossRef]
  30. Bowden, S.A.; Farrimond, P.; Snape, C.E.; Love, G.D. Compositional differences in biomarker constituents ofthe hydrocarbon, resin, asphaltene and kerogen fractions:An example from the Jet Rock (Yorkshire, UK). Org. Geochem. 2006, 37, 369–383. [Google Scholar] [CrossRef]
  31. Meredith, W.; Snape, C.E.; Carr, A.D.; Nytoft, H.P.; Love, G.D. The occurrence of unusual hopenes in hydropyrolysates generated from severely biodegraded oil seep asphaltenes. Org. Geochem. 2008, 39, 1243–1248. [Google Scholar] [CrossRef]
  32. Vuković, N.; Zivotic, D.; Filho, J.G.M.; Stevovic, T.K.; Vido, M.H.; Mendonca, J.D.O.; Stojanovic, K. The assessment of maturation changes of humic coal organic matter—Insights from closed-system pyrolysis experiments. Int. J. Coal Geol. 2016, 154, 213–239. [Google Scholar] [CrossRef]
  33. Chen, J.; Jia, W.L.; Yu, C.L.; Zhang, X.Y.; Peng, P.A. Bound hydrocarbons and structure of pyrobitumen rapidly formed byasphaltene cracking: Implications for oil–source correlation. Org. Geochem. 2020, 146, 104053. [Google Scholar] [CrossRef]
Figure 1. Experimental device for press hydrocarbon generation–expulsion research of retained oil.
Processes 12 00121 g001
Figure 2. Schematic experimental device for press hydrocarbon generation–expulsion research of retained oil. V1: Valve 1; V2: Valve 2; V3: Valve 3. 1: Top support beam; 2: Asbestos cleading; 3: Upper fixed plunger; 4: Graphite seal ring; 5: Chloroform “A” sample; 6: Upper movable piston; 7: Sample cylinder; 8: Alumina; 9: Cold trap; 10: Electric furnace; 11: Pressure sensor; 12: Lower movable piston; 13: Pressure transmission and oil–water separator; 14: Lower fixed plunger; 15: Asbestos cleading; 16: Hoisting jack; 17: Vacuum valve; 18: Gas-collecting bottle; 19: Water pump.
Processes 12 00121 g002
Figure 3. Variation of pyrolytic products with temperature. (a) Cumulative expelled oil vs. pyrolysis temperature; (b) cumulative residual oil vs. pyrolysis temperature; and (c) cumulative generated oil vs. pyrolysis temperature.
Processes 12 00121 g003
Figure 4. Correlation of oil/hydrocarbon expulsion efficiency and pyrolysis temperature.
Processes 12 00121 g004
Figure 5. Variation of pyrolytic products with temperature.
Processes 12 00121 g005
Figure 6. Relationship between carbon isotope and pyrolysis temperature of gaseous pyrolytic products.
Processes 12 00121 g006
Figure 7. Relationship between net increased oil yield and pyrolysis temperature. (a) Expelled oil; (b) residual oil; and (c) total oil.
Processes 12 00121 g007
Figure 8. Variation characteristics of all oil chromatography of expelled oil.
Processes 12 00121 g008
Figure 9. Variation characteristics of all oil chromatography of residual oil.
Processes 12 00121 g009
Table 1. Relationship of pyrolysis temperature vs. expelled oil, retained oil, and generated oil.
Sample No.TemperatureC6–14C14+C6+
°Cmg/g Oilmg/g Oilmg/g Oil
Expelled oil
H-1E3007.078.5815.64
H-2E32013.7610.8424.60
H-3E34018.6020.5039.10
H-4E36022.5934.3756.96
H-5E38023.4437.2660.70
H-6E40024.5533.3757.92
H-7E42015.8929.3645.25
Residual oil
H-1R30014.14653.40667.54
H-2R32027.53622.68650.20
H-3R34037.20579.55616.75
H-4R36045.18521.13566.31
H-5R38046.88394.13441.01
H-6R40049.11314.11363.21
H-7R42031.78151.89183.67
Generated oil
H-1T30021.20661.98683.18
H-2T32041.29633.52674.81
H-3T34055.80600.04655.85
H-4T36067.77555.50623.27
H-5T38070.32431.39501.71
H-6T40073.66347.47421.14
H-7T42047.67181.25228.92
Notes: C6–14 refers to light oil, C14+ refers to heavy oil, and C6+ includes light oil (C6–14) and heavy oil (C14+).
Table 2. Net increased oil yield of expelled oil, residual oil, and total oil at different pyrolysis temperatures.
Expelled Oil
Temperature IntervalC6–14C14+C6+
°Cmg/g oilmg/g oilmg/g oil
300–3206.692.268.96
320–3404.849.6614.50
340–3603.9913.8717.86
360–3800.852.893.74
380–4001.12−3.89−2.78
400–420−8.67−4.01−12.67
Residual Oil
Temperature IntervalC6–14C14+C6+
°Cmg/g oilmg/g oilmg/g oil
300–32013.39−30.73−17.34
320–3409.68−43.13−33.46
340–3607.98−58.42−50.44
360–3801.70−126.99−125.30
380–4002.23−80.03−77.80
400–420−17.33−162.21−179.54
Generated Oil
Temperature IntervalC6–14C14+C6+
°Cmg/g oilmg/g oilmg/g oil
300–32020.08−28.46−8.38
320–34014.52−33.47−18.96
340–36011.97−44.55−32.58
360–3802.55−124.11−121.56
380–4003.35−83.92−80.58
400–420−26.00−166.22−192.22
Disclaimer/Publisher’s Note: The statements, opinions and data contained in all publications are solely those of the individual author(s) and contributor(s) and not of MDPI and/or the editor(s). MDPI and/or the editor(s) disclaim responsibility for any injury to people or property resulting from any ideas, methods, instructions or products referred to in the content.

