Article

Discrete Meta-Simulation of Silage Based on RSM and GA-BP-GA Optimization Parameter Calibration

1
College of Mechanical and Electrical Engineering, Xinjiang Agricultural University, Urumqi 830052, China
2
Institute of Agricultural Mechanization, Xinjiang Academy of Agricultural Sciences, Urumqi 830091, China
3
Route Department, Xinjiang Division, China Southern Airlines Technical Branch, Urumqi 830002, China
*
Authors to whom correspondence should be addressed.
Processes 2023, 11(9), 2784; https://doi.org/10.3390/pr11092784
Submission received: 4 July 2023 / Revised: 26 August 2023 / Accepted: 14 September 2023 / Published: 18 September 2023
(This article belongs to the Section Materials Processes)

Abstract

:
The EDEM software (Altair EDEM 2022.0 professional version 8.0.0) was used to create a discrete element model of silage to address the lack of silage evidence parameters and contact parameters between silage and conveying equipment when using the discrete element method to simulate and analyze crucial aspects of silage conveying and feeding. Physical tests and simulations were used to calibrate the significant parameters, and the silage stacking angle obtained from simulation and tests was then validated. The response value of the stacking angle (38.65°) obtained from the physical examination was used as the response value. The response surface (RSM) finding and the GA finding based on the genetic algorithm (GA) artificial neural network (BP) model were used to compare the significance parameters. The PB and steepest climb tests were used to screen the significant factors. Results indicate that the static friction coefficient between silage and silage, the rolling friction coefficient between silage and silage, and the static friction coefficient between silage and the steel body are significant factors affecting the stacking angle of numerical simulation; the parameter optimization effect of GA-BP-GA is superior to that of RSM; the optimal parameter combinations are as follows: 0.495, 0.194, and 0.420, respectively, and the simulated stacking angle is 39.1510°, which matches the empirical test result. The relative error between the simulated and stacking angles derived from the physical test was 1.3%. The results demonstrate that the silage model is reliable within the parameters derived from the calibration, and that the calibrated parameters can be used in other discrete element simulation studies of silage.

1. Introduction

China’s agricultural production structure has been adjusted, transformed from a binary agricultural planting structure to a ternary structure. The favorable characteristics of silage straw, such as low cost and an extended storage cycle, make it a significant raw material in animal husbandry for ruminants like cattle and sheep [1,2,3]. The animal husbandry sector is moving towards standardized scale farming at an accelerated pace, with a constant improvement in mechanization [4]. Automatic feeding facilities and batching can significantly boost the degree of automation and management efficiency, while studying the characteristic parameters of silage is highly relevant to understanding its conveyor mechanism and simulation experiments.
In recent years, the discrete element (EDEM) technique has been utilized extensively to provide a new method for analyzing the force, collision, and stacking angle of bulk feed and investigating the mechanism of bulk feed conveyance [5,6,7]. Liu Peng et al. [8] analyzed the motion process and force changes of the crushed rods in the crushing chamber at various crushing knife shaft speeds for the problem of the motion mechanism of the crushed corn rods after the crushing of the straw returning machine using CFD-DEM coupling. The findings indicate that the crushing knife shaft speed adversely affects the uniformity of tossing. Zhang Tao et al. [9] used the contact parameters in the straw kneading process as factors, the relative error value of the stacking angle as an evaluation index, and an orthogonal method for the discrete element parameter calibration of maize straw to determine the optimal combination of contact parameters. Zhang Fengwei et al. [10] selected four distinct lengths and widths of corn straw to establish a BPM bonding model for crushing simulation and verification; the results demonstrated that the simulation and test results were consistent and that the discrete element simulation to simulate the corn straw kneading and the crushing process was feasible. Wu Hong-arrow et al. [11] investigated the forward inclination angles of the blades used in the silage harvester throwing mechanism, created a 3D model using CATIA, imported it into EDEM to simulate motion, and determined the ideal forward inclination angle. Coetzee C.J. et al. [12] used EDEM to simulate the testing of machinery and granular materials, determined the internal friction angle and stiffness of the materials, and more accurately predicted the discharge container’s flow rate and flow pattern. Wang L J et al. [13] determined the rolling friction coefficient of irregularly shaped maize particles via a combination of the discrete element method and physical experiments. The simulation results were compared to the physical test results to ascertain the rolling friction coefficients between the maize particles and the galvanized plate.
Currently, the majority of research on contact parameters of silage consists of physical test measurements, while numerical simulation research is limited. To investigate the pertinent contact parameters of silage, physical, mechanical, and simulation tests of Xinjiang corn silage fed to beef cattle were conducted to calibrate its defining parameters. The significant contact parameters of silage were optimized through the stacking angle simulation test and combined with the response surface model and the BP neural network model based on the genetic algorithm; the test results were compared and analyzed to determine the optimal parameter combination to improve the accuracy of the contact parameters required for the discrete element silage model. This provided a basis for the simulation of essential links, such as feeding.

2. Material and Methods

2.1. Test Samples

Fresh silage from the Xinjiang Academy of Agricultural Sciences’ An Ning Qu Livestock Experimental Field Station was used in the test because it was loose, separated, similar in shape, and a bulk material [14], as shown in Figure 1. The exterior dimensions, moisture content, bulk density, and other fundamental parameters of silage are listed here. Depending on the aim of the determination, it may also be necessary to determine the silage’s coefficient of friction, shear modulus, and Poisson’s ratio to establish a foundation for the calibration study of the discrete element approach [15].

2.2. Determination of Characteristic Parameters

2.2.1. Geometrical Characteristics

A random silage sample is taken from the silage kiln at the test site, and it is sieved and determined using a sieving machine, along with a chosen set of sieve bodies, an electronic balance, calipers, and other instruments. The sieving, size, and mass determination should be carried out at least ten times, concurrently, during the determination process, and the measurement results are displayed in Table 1.

2.2.2. Water Content

Dry-based and wet-based methods are used to determine the moisture content of bulk materials, respectively. Dry-based methods are based on the mass of the material’s dry components, whereas wet-based methods are based on the amount of water it contains [16,17]. The following equation is used in this paper to express the wet-based moisture content:
M W = m w m w + m v × 100 %
where Mw is the moisture content on a wet basis, %; mw is the mass of moisture contained, kg; and mv is the mass of the dry substance contained, kg.
For information on the silage moisture content determination test, see standard NY/T1881.2-2010 [18]. A 101-type electric constant temperature blast drying oven (Beijing Yong Guangming, high-precision display instrumentation, accuracy of 0.1 degrees), and a BSA3202S-type electronic balance (maximum weighing capacity of 3200 g, resolution of 0.01 g, Sartorius Scientific Instruments (Beijing) Co., Ltd., Beijing, China, were used. The results are detailed in Table 2, and the calculated water content of the silage is 69.16%.

2.2.3. Bulk Density

The material’s bulk density is the unit mass of the substance packed beneath the designated container’s filling volume. Its mathematical equation is:
ρ b = m 2 m 1 V d
where ρb is the stacking density, kg/m3; m1 is the mass of the container, kg; m2 is the mass of filler material, kg; and Vd is the filled volume of the container, m3.
The silage’s bulk density was measured per standard NY/T1881.6-2010 [19]. Electronic scales, measuring cups, and other tools were the primary equipment. At least ten parallel tests were conducted to assess the material component stacking density, and the findings are displayed in Table 3. The silage’s stacking density was 491.68 kg/m3.

2.2.4. Friction Coefficient

The static and dynamic friction coefficients are two categories of silage friction coefficients. The rolling coefficient describes the ratio of resistance to gravity when the object is rolling, and the static coefficient describes the maximum amount of static friction required when the thing is at rest. It is proportional to the positive pressure between the contacting surfaces. Both of these constant values represent the amount of friction. The forces acting on the material’s inclined surface are depicted in Figure 2, and show results for after the coefficient of friction between silage and silage and silage and steel bodies was calculated, using an inclinometer and the hydrostatics principle [20,21].
As the slope’s inclination gradually increases, the silage will incline to slide if the slope’s preference corresponds to the maximum static friction angle of the silage, as defined by the following equation:
{ G = m g F n = m g cos θ F = m g sin θ f = μ F n
where G is the material gravity, N; m is the material mass, kg; m/s2; Fn is the support force, N; f is the friction force, N; µ is the friction factor; and θ is the inclination angle of the inclinometer, (°).
The inclinometer utilized during the test is depicted in Figure 3. To determine the coefficient of static friction between the silage and the steel plate, first lay the silage flat on a table and compact it slightly. Then, position the silage on the steel plate so it is in complete contact with its surface. Slowly turn the nut to increase the angle of inclination of the flat plate. If the silage suddenly slips and does not fall, the force applied exceeds the minimum force required to set the object in motion (i.e., static friction). Stop increasing the angle of inclination and record the angle of inclination at this point. To determine the coefficient of static friction between silage and silage, the silage must be glued flat to a flat plate to form a silage plate surface. The test procedure is the same as described above, and the silage’s angle of static friction and coefficient of static friction are measured and calculated. Each set of experiments was conducted ten times, and the average coefficient of static friction was estimated to be 0.465 between silage and silage and 0.367 between silage and steel plates.
To determine the silage–silage rolling friction and the silage–steel plate rolling friction, the test procedure is identical to that described above, except that the silage is lifted continuously and slowly by the flat plate when the applied force has exceeded the static friction to which the object is subjected and which causes the object to start moving; if the applied force is maintained, the object will slide at a constant speed and a uniform rate. When a uniform descent occurs, the elevation of the flat plate ceases, and the angle of inclination at this point is the silage’s rolling friction angle. The two tests were replicated ten times each, and the average coefficient of rolling friction was calculated. The average rolling friction coefficient between silage and silage was 0.176, whereas it was 0.138 between silage and the steel plate.

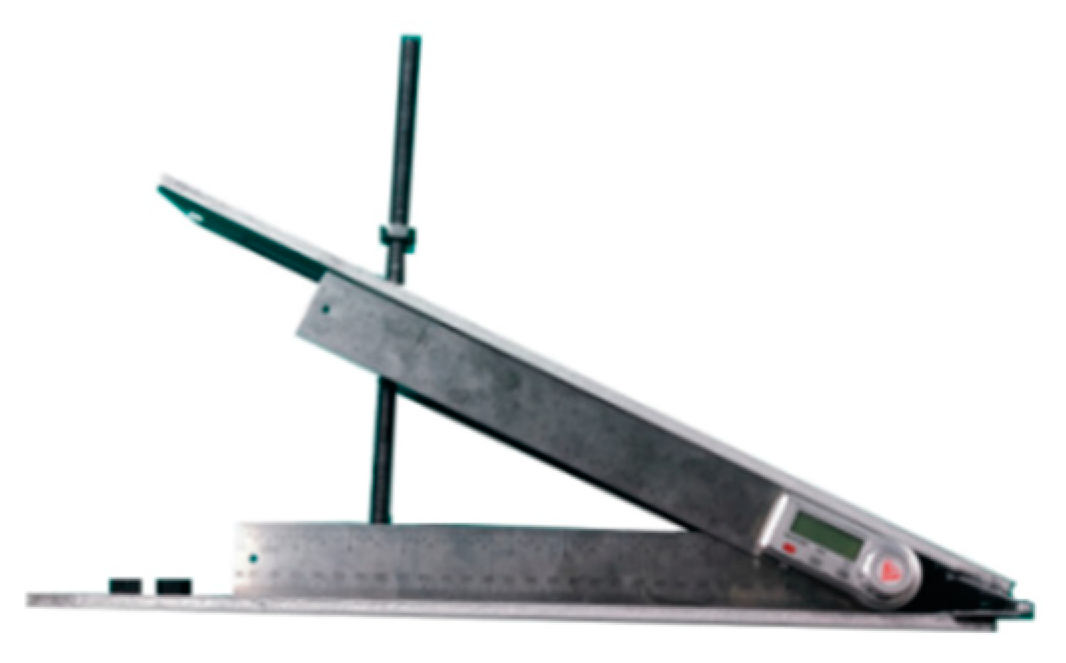
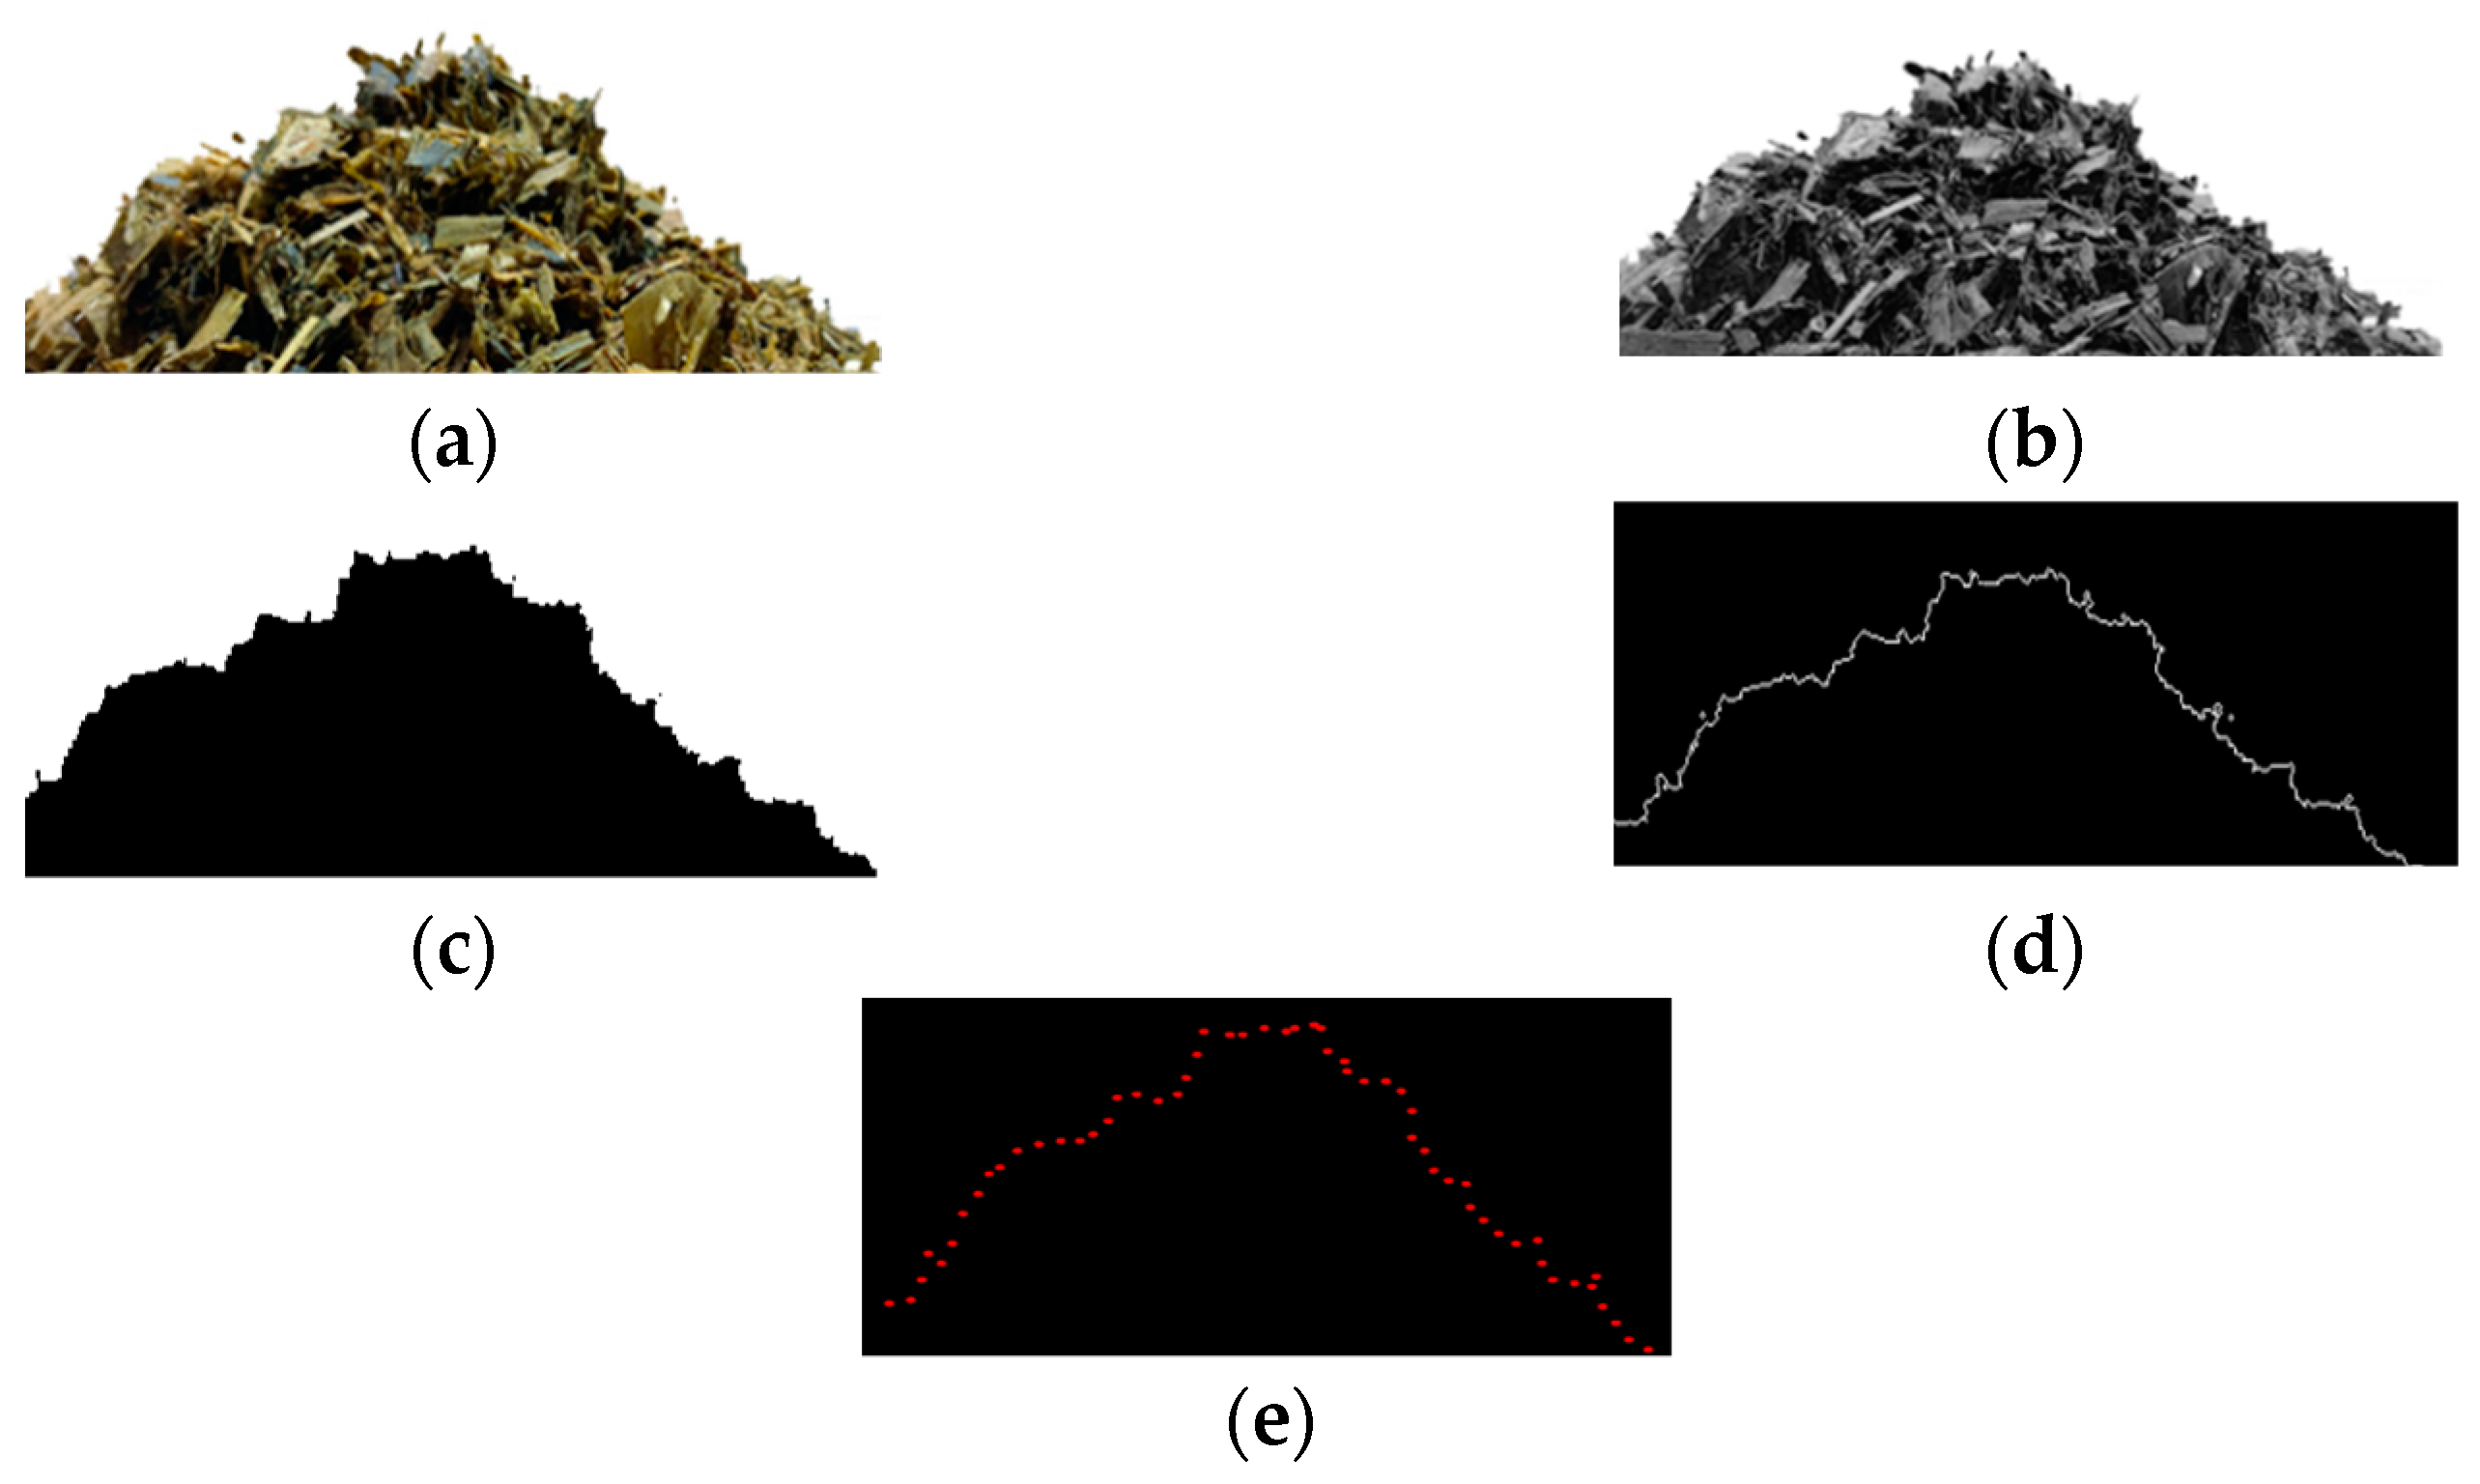
2.2.5. Stacking Angle

The angle in which bulk materials are stacked significantly impacts their harvesting, transport, and storage. Different measurement methods, such as the angling method, funnel method, cylinder lifting method, injection method, etc., can be selected based on the characteristics of the bulk material [22,23]. The results of a preliminary comparison of several methods indicate that the cylinder lifting method in the pile angle dispersal state is superior; therefore, this paper employs the cylinder lifting method for silage pile angle testing; the test apparatus is depicted in Figure 4.
The silage is placed in a steel body cylinder of 90 mm in diameter and 180 mm in height; the cylinder is clamped and raised by the CMT-6103 microcomputer-controlled electronic universal testing machine (which has high precision and sensitivity for the measurement and control of load, deformation, and displacement, and can also perform the automatic control test of isochronous loading, isochronous deformation, and isochronous displacement). The slope of the silage pile was simpler to stabilize when the lifting speed was set to 0.6 m/s, so the uniform lifting speed was set to 0.6 m/s, and the lifting time was set to 0.5 s. When the hoisting was complete, all silage pellets were stationary, and the slope was stable; a video camera was used to photograph the silage pile vertically. To reduce the problem of manual measurement error using a protractor, the pile angle images obtained from the test were processed with MATLAB R2020b V9.9.0 software. The camera image (Figure 5a) was first grayscaled (Figure 5b), then binarized using an iterative method to select an appropriate threshold (Figure 5c), the bwperim function was used to extract the image outline, and the imfill function was used to eliminate and fill the internal white dots when extracting the image outline to obtain a complete and clear outline (Figure 5d). The digitizer tool in the Origin 2019b (64-bit 9.6.5.169) software tools was then used to process the contour image to acquire the pixel coordinates of the contour image, which were then linearly fitted to the data. Table 4 displays the results of 10 repetitions of the above test procedure. The average of the 10 data sets yielded a stacking angle of 38.65 degrees for the silage physical stacking test.

2.3. Creation of the Simulation Model

2.3.1. Creation of the Particle Model

The discrete element method employs particle units with particular masses and shapes. The non-spherical particle model of each material component of the test diets was constructed using the multi-sphere superposition method to achieve moderate computational complexity and simulation accuracy [24]. Based on the material particle geometry characteristics of the measured test material fractions and combined with the agricultural material discrete element simulation parameters [25], a simplified model of silage particles of various shapes and sizes was developed, as depicted in Figure 6.

2.3.2. Steel Plate and Bottomless Steel Cylinder Model

Using Solid Works (R Premium 2020 SP0.0) software, a three-dimensional model of the identical steel plate and bottomless steel cylinder as the test set-up was made, saved as an STP file, and imported into EDEM software (EDEM 2022 professional version 8.0.0). The steel’s Poisson ratio was taken from references [26,27] as 0.28, the density as 7.85 g/cm3, and the shear modulus as 75 GPa.

2.3.3. Contact Model

During the test, there are forces between the particles and the steel body in addition to particle-to-particle contact. The Hertz–Mindlin with JKR cohesion contact model [28] was selected for this simulation because there is hardly any adhesion force between the silage and the steel body surface in the actual test. However, there is some adhesion phenomenon for granules with particle sizes less than 8 mm. The effect of cohesion forces on the movement of particles during transport is generally pertinent to modeling materials with substantial adhesion and agglomeration between particles due to factors such as moisture [29]. Small silage granules may bind during the compaction and form due to internal friction between the pellets. The discrete element parameters for silage were calibrated using the Hertz–Mindlin with JKR cohesion contact model, with the JKR surface energy set to 0.2735 J/m2 [30].

2.3.4. Simulation Parameter Settings

The particle model size and scale of Figure 6 were utilized to construct the simulation tests to guarantee the stability and continuity of the simulation process. To mimic the stacking-angle test illustrated in Figure 7, the simulation tests were created with a Rayleigh time step of about 25%, a total simulation period of 10 s, a data save interval of 0.1 s, and a grid size of 3 times the lowest particle radius.

3. RSM Tests

3.1. PB Tests

Not all factors significantly affect the stacking angle, and some canot be calibrated in terms of stacking angle since doing so would result in inaccurately calibrated parameters. For the screening (Plackett–Burman) experimental design and analysis of the intrinsic silage parameters (Poisson’s ratio, shear modulus and density) and contact parameters (silage–silage static friction coefficient, static-silage–steel static friction coefficient), static-silage-silage rolling friction coefficient, and silage–silage static friction coefficient), Design-Expert 11 1.0.1 software was used. According to references [31,32], silage has a shear modulus and Poisson’s ratio of 29 MPa and 0.31, and its collision recovery coefficients for silage–silage and silage–steel collisions are 0.35 and 0.3, respectively. Table 5 lists the eight calibration parameters, whereas Table 6 lists the Plackett–Burman test technique and results.
The importance of the simulation test parameters was determined using an analysis of variance on the Design Expert 11 1.0.1 software test results, as shown in Table 7.
According to the table, the simulation test is significantly impacted by the p-value of the rolling friction coefficient between silage and silage below 0.01, the p-value of the static friction coefficient between silage and between silage and steel body below 0.05, and the p-value of other simulation test parameters above 0.05. Since the coefficient of variation for this test was 1.72 percent or less than 15%, it may be concluded that the results are analytically significant and normal. A satisfactory fit of the regression model is shown by the calculated correction coefficient of determination R2adj, which was 0.9291, greater than 0.8. This test has high reliability, since the better the signal-to-noise ratio of the measurement, the more reliable the test. A ratio of more than four is preferred, and a ratio of 13.809 denotes an adequate signal.

3.2. Steepest Climb Test Design

Based on the Plackett–Burman test, the steepest climb test was conducted on the three significant factors screened out (static friction coefficient between silage and silage, rolling friction coefficient, and static friction coefficient between silage and the steel body), which can determine the optimal value of the factors and the relative error between the discrete element simulation analysis stacking angle and the actual stacking angle more quickly. The optimal range and relative error are computed using the following formula:
e = | y z | y × 100 %
where e is the relative error, %; y is the measured silage pile angle, (°); and z is the simulated silage pile angle, (°).
In the simulation test, the factors with insignificant effects on the stacking angle were selected at the middle level of their values, so the Poisson’s ratio of silage was set to 0.4, and the shear modulus was set to 22.5 MPa; the collision recovery coefficient between silage and silage was set to 0.325, the collision recovery coefficient between silage and the steel body was set to 0.35, and the rolling friction coefficient between silage and the steel body was set to 0.175. According to the results, the steepest climb test was conducted using the table values for the PB test factor level. The design scheme and results of the steepest climb test are shown in Table 8.
The results demonstrated that the stacking angle of the silage simulation results tended to increase as the selected values of the three significant factors increased, whereas the relative error value of the calculated stacking angle tended to decrease and then increase. The minimum relative error value for the fourth group of test results was 3.49 percent, so the fourth group near groups 3, 5, and 4 was chosen as the selected level for the test, and the RSM test was conducted to establish the regression model.

3.3. Central Combination Response Surface Test

The test analysis was performed using the Central Composite Design (CCD) test in the RSM test design, based on the results of the steepest ascent test. Table 9 displays the coding table for significance parameters and simulation factors.
The CCD test methodology was used, which included a total of 23 test measurement points, 9 zero-estimation errors, and 14 analysis components. Table 10 below displays the CCD test technique and the associated response values. The table’s coded values D′, E′, and F′ correspond to factors D, E, and F.
As shown in Table 11, the CCD test was analyzed, and the quadratic regression model was derived. On the silage stacking angle, the effects of the static friction coefficient between silage and silage (D), the rolling friction between silage and silage (E), the static friction coefficient between silage and the steel body (G), and the squared term of the static friction coefficient between silage and the steel body (G2) were extremely significant (p < 0.01). The squared term of the static friction coefficient between silage and silage (D2) was significant (p < 0.05). The p value of this quadratic regression model was less than 0.0001, indicating that the relationship between the simulated silage piling angle and the regression equation was highly significant. The misfit term p = 0.1073 was greater than 0.05, indicating that the regression model fits well and no misfit occurred. Its coefficient of variation was 4.29 percent, which was less than 15 percent, so the reliability of the test was high; the coefficient of determination of the regression model R2 was 0.9377, and the corrected coefficient of determination R2adj was 0.8945, so the reliability of the regression equation was high. The precision was 18.2051, so the precision of this regression model was high.
The optimized regression model’s ANOVA is displayed in Table 12, with a misfit term of 1.74 and an accuracy of 22.1848 after several inconsequential factors present in the original regression model were eliminated. The dependability and accuracy of the resulting regression equation are better than before optimization. The ideal regression formula is:
θ = 39.07 + 3.82 A + 2.26 B + 4.35 C + 0.9505 A 2 + 1.39 C 2 b 2 4 a c
where θ is the stacking angle, (°).

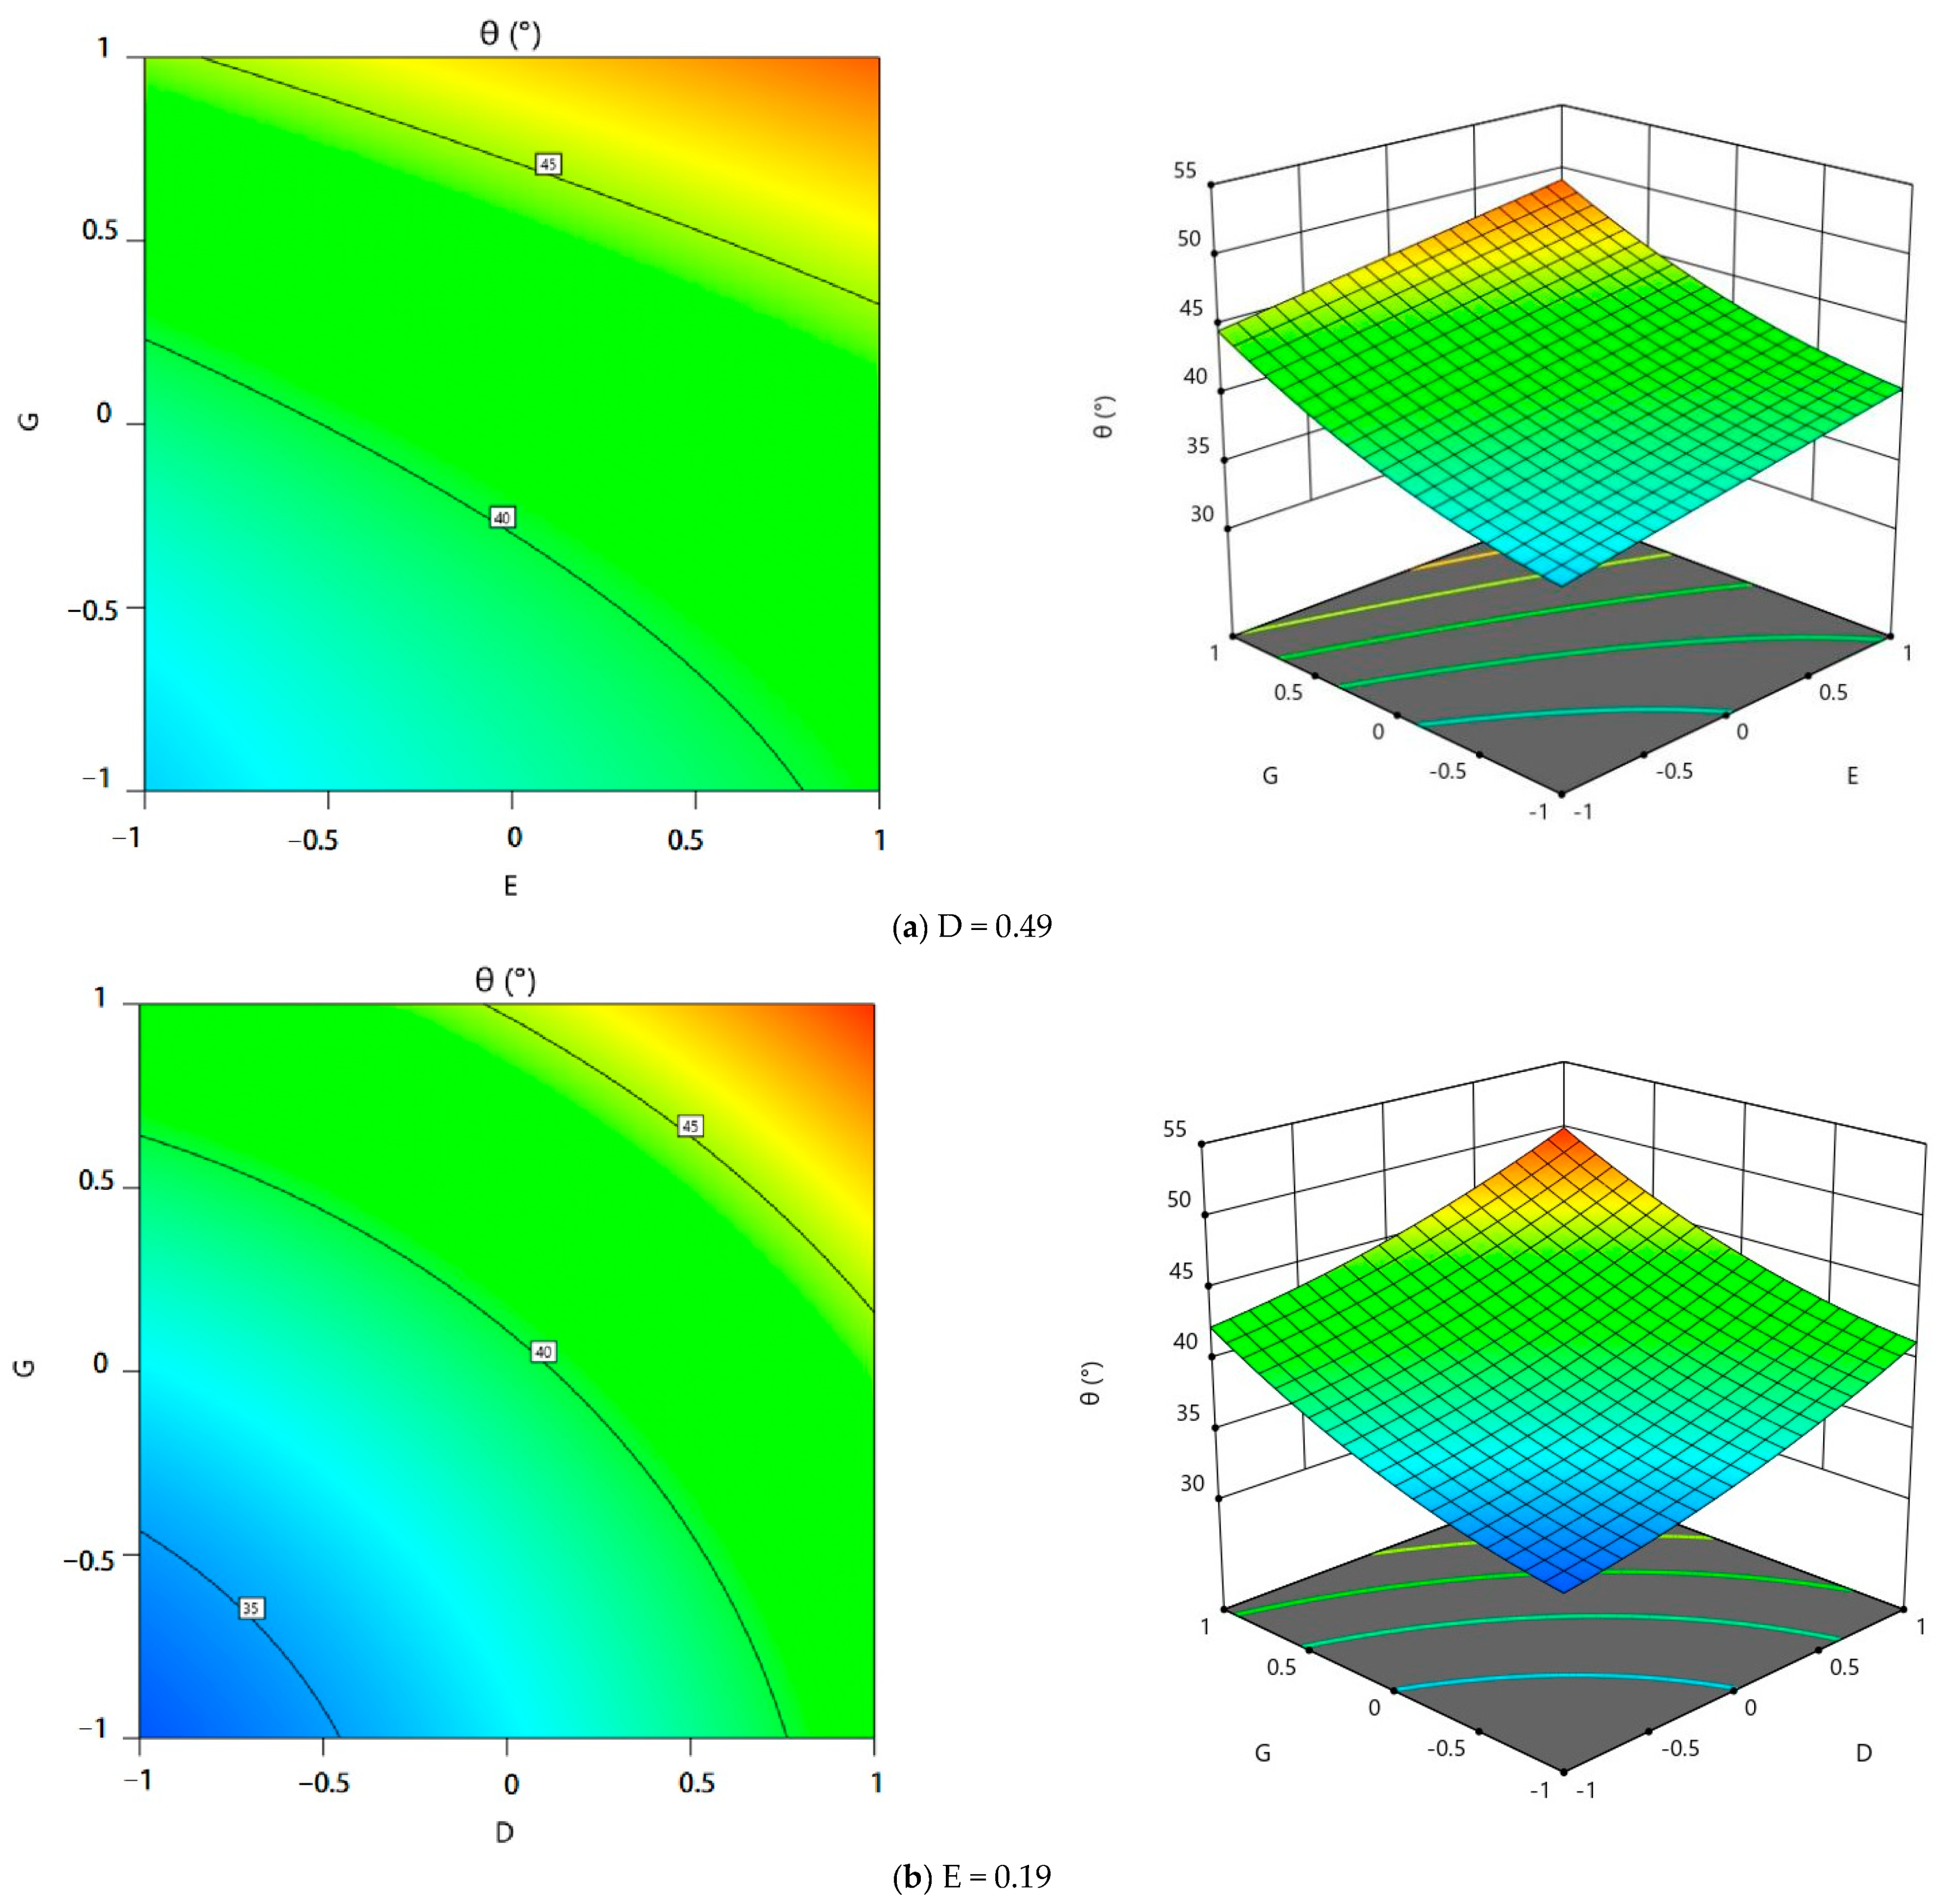
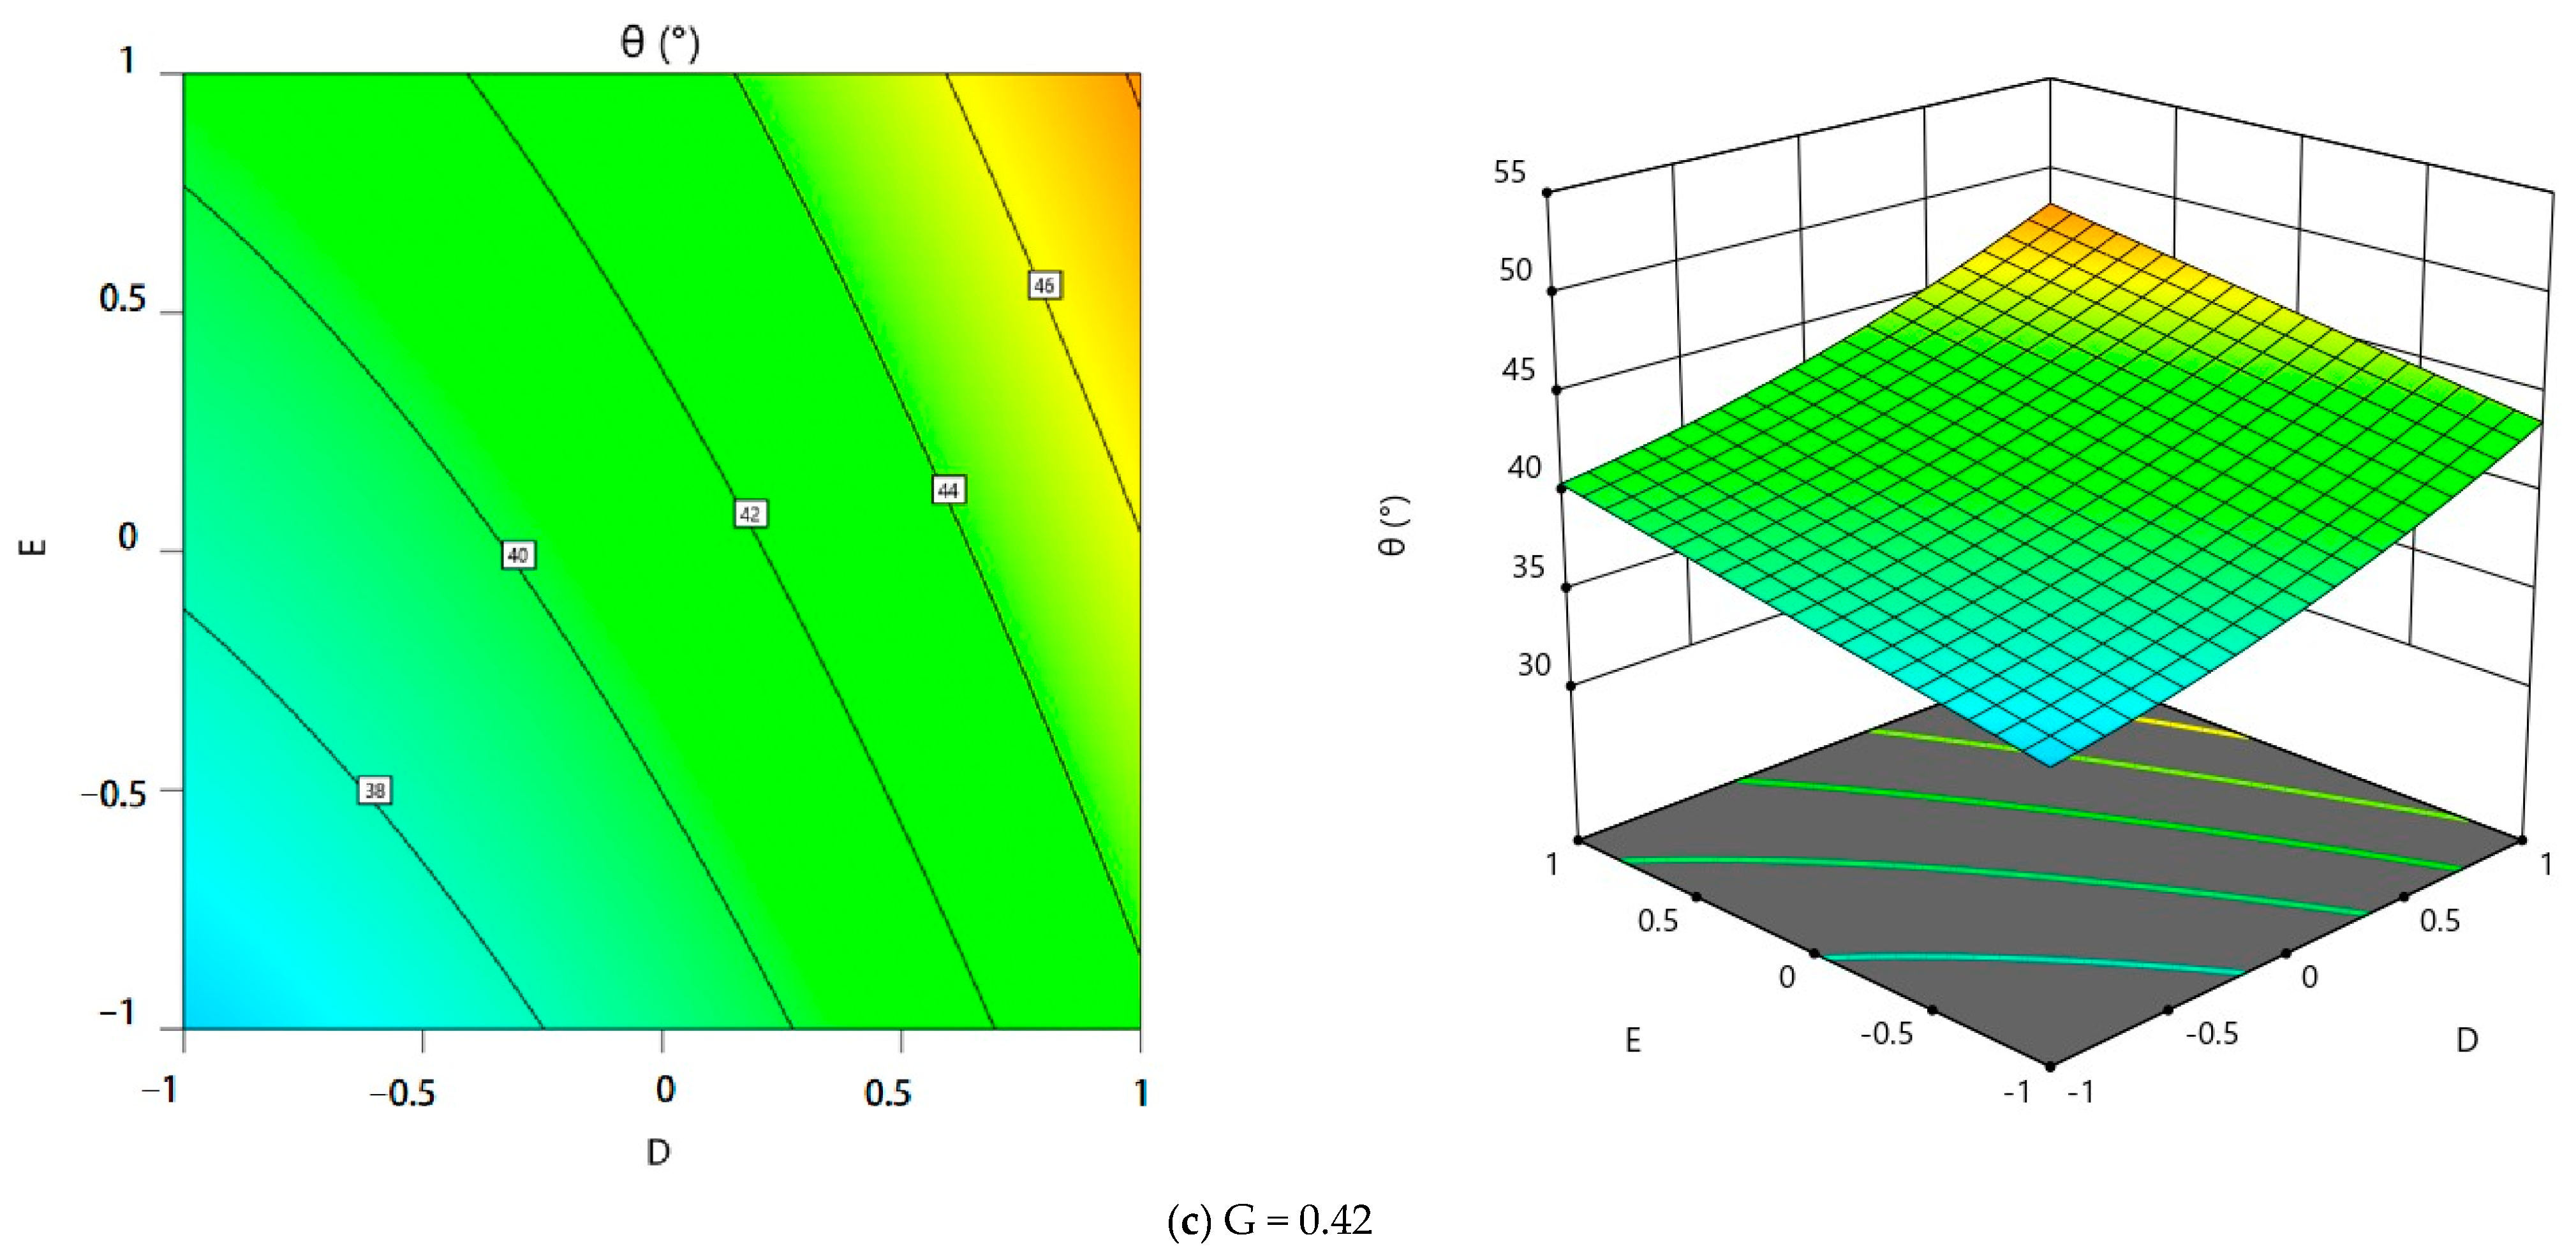
3.4. Effect of Interaction Factors on Stacking Angle

Figure 8 displays contour and surface plots for each interaction. Figure 8a shows that when the coefficient of static friction between silage and silage (D) is constant, increasing the coefficient of rolling friction between silage and silage (E) and the coefficient of static friction between silage and steel (G) leads to a gradual increase in the stacking angle. When the coefficient of rolling friction between silage and silage (E) is held constant, as illustrated in Figure 8b, the stacking angle increases gradually alongside the coefficient of static friction between silage and silage (D) and that between silage and steel (G), and the rate of increase is similar. When the coefficient of static friction between the silage and silage body (G) is kept constant, as shown in Figure 8c, the stacking angle gradually increases with an increase in the coefficient of static friction between silage and silage contacts (D) and the silage and steel (G). The change in the stacking angle demonstrates a clear trend according to the changing coefficient of static friction between the silage and silage contacts (D).
The interaction between the silage and silage static friction coefficient (D), the silage and silage rolling friction coefficient (E), and the silage and steel static friction coefficient (G) influence the silage stacking angle, which is determined by the static friction between the lower silage and the steel plate and the pressure exerted by the silage above on the silage below when the silage is stacked. In contrast, the rolling friction coefficient influences the pressure exerted by the upper object. As the upper silage slides or rolls, the pressure exerted on the lower silage decreases, causing the stacking angle to decrease. This is due to the fact that during the rolling or sliding process the contact area between the top and bottom silage becomes smaller, and the contact point changes, thereby reducing friction between them.

3.5. Optimization of RSM Result Parameters

The Numerical module of Design-Expert 11 1.0.1 software was used to optimally solve the regression model using the mean value of the actual silage stacking angle (38.65°) as the objective, and the optimization constraints were:
{ θ 38.65 ° s . t . { 0.46 D 0.52 0.16 E 0.22 0.38 G 0.46
The simulated silage stacking angle was obtained in multiple sets, and the closest location to the actual physical test was as follows: the static friction coefficient between silage and silage was 0.498, the rolling friction coefficient between silage and silage was 0.196, and the static friction coefficient between silage and the steel body was 0.404. The measured simulated silage stacking angle was 40.0526°, with a relative error of 3.6% compared to the actual physical silage stacking angle.

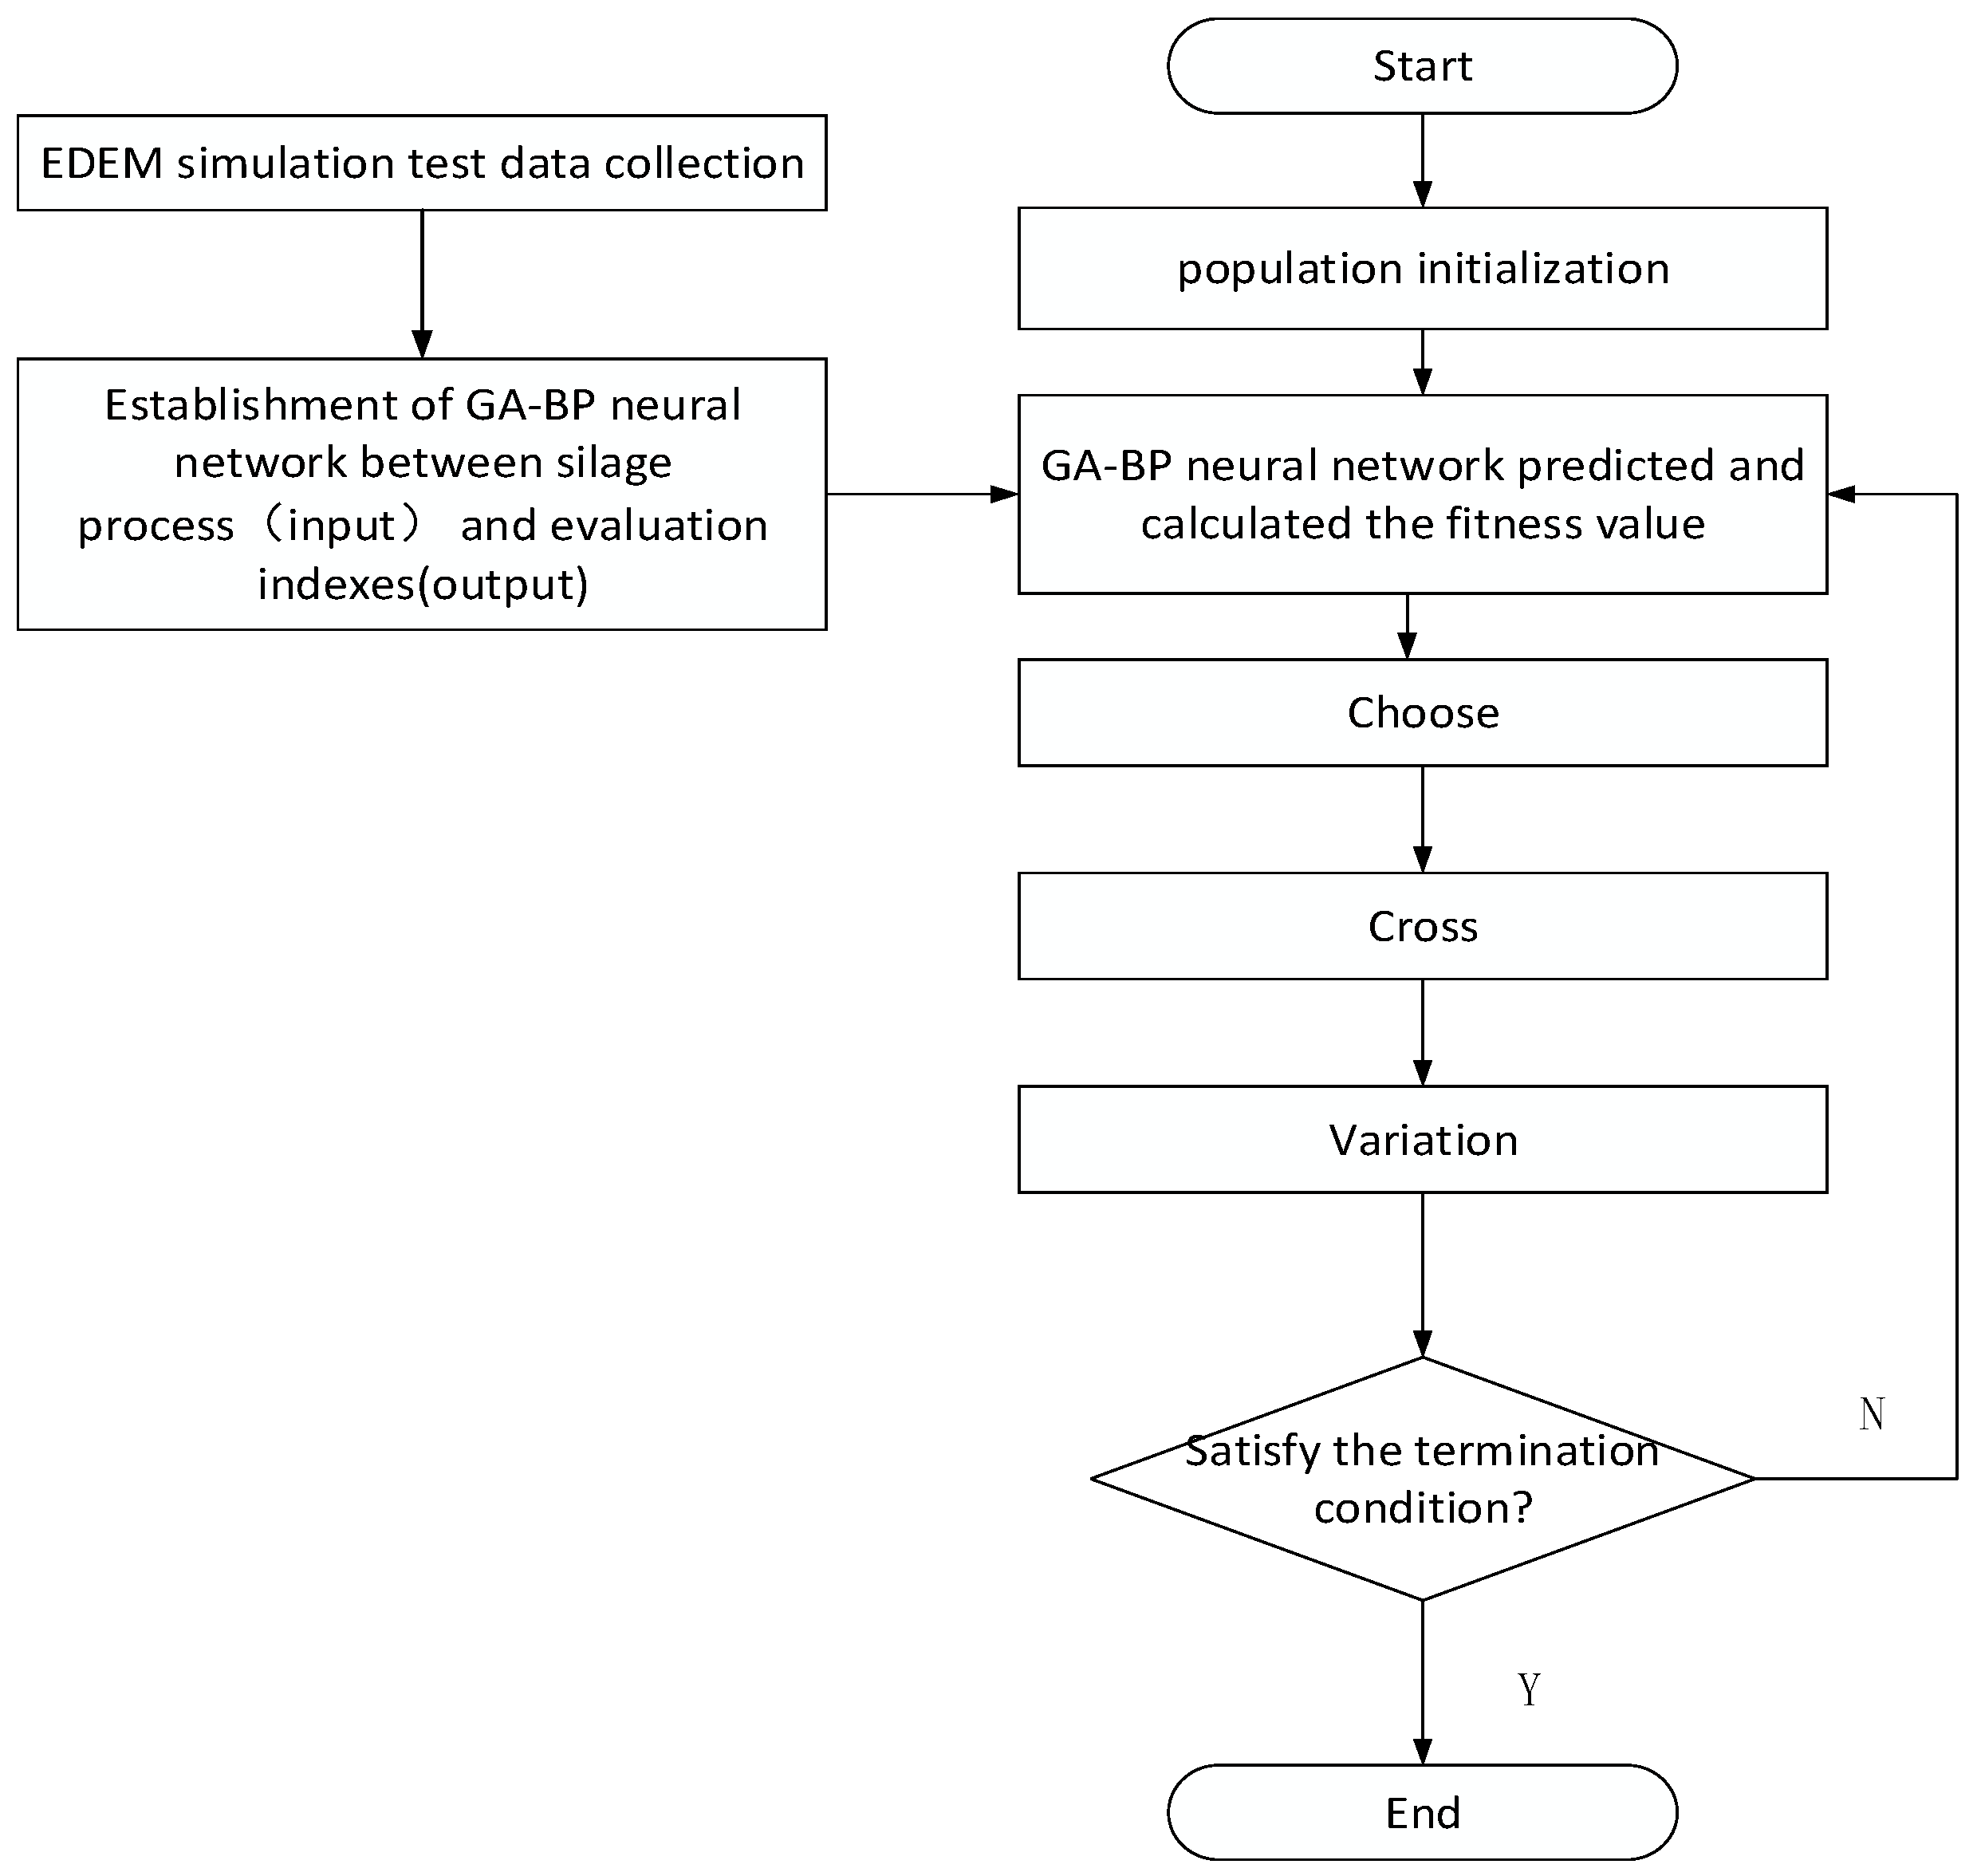
4. GA Optimization Based on the GA-BP Model
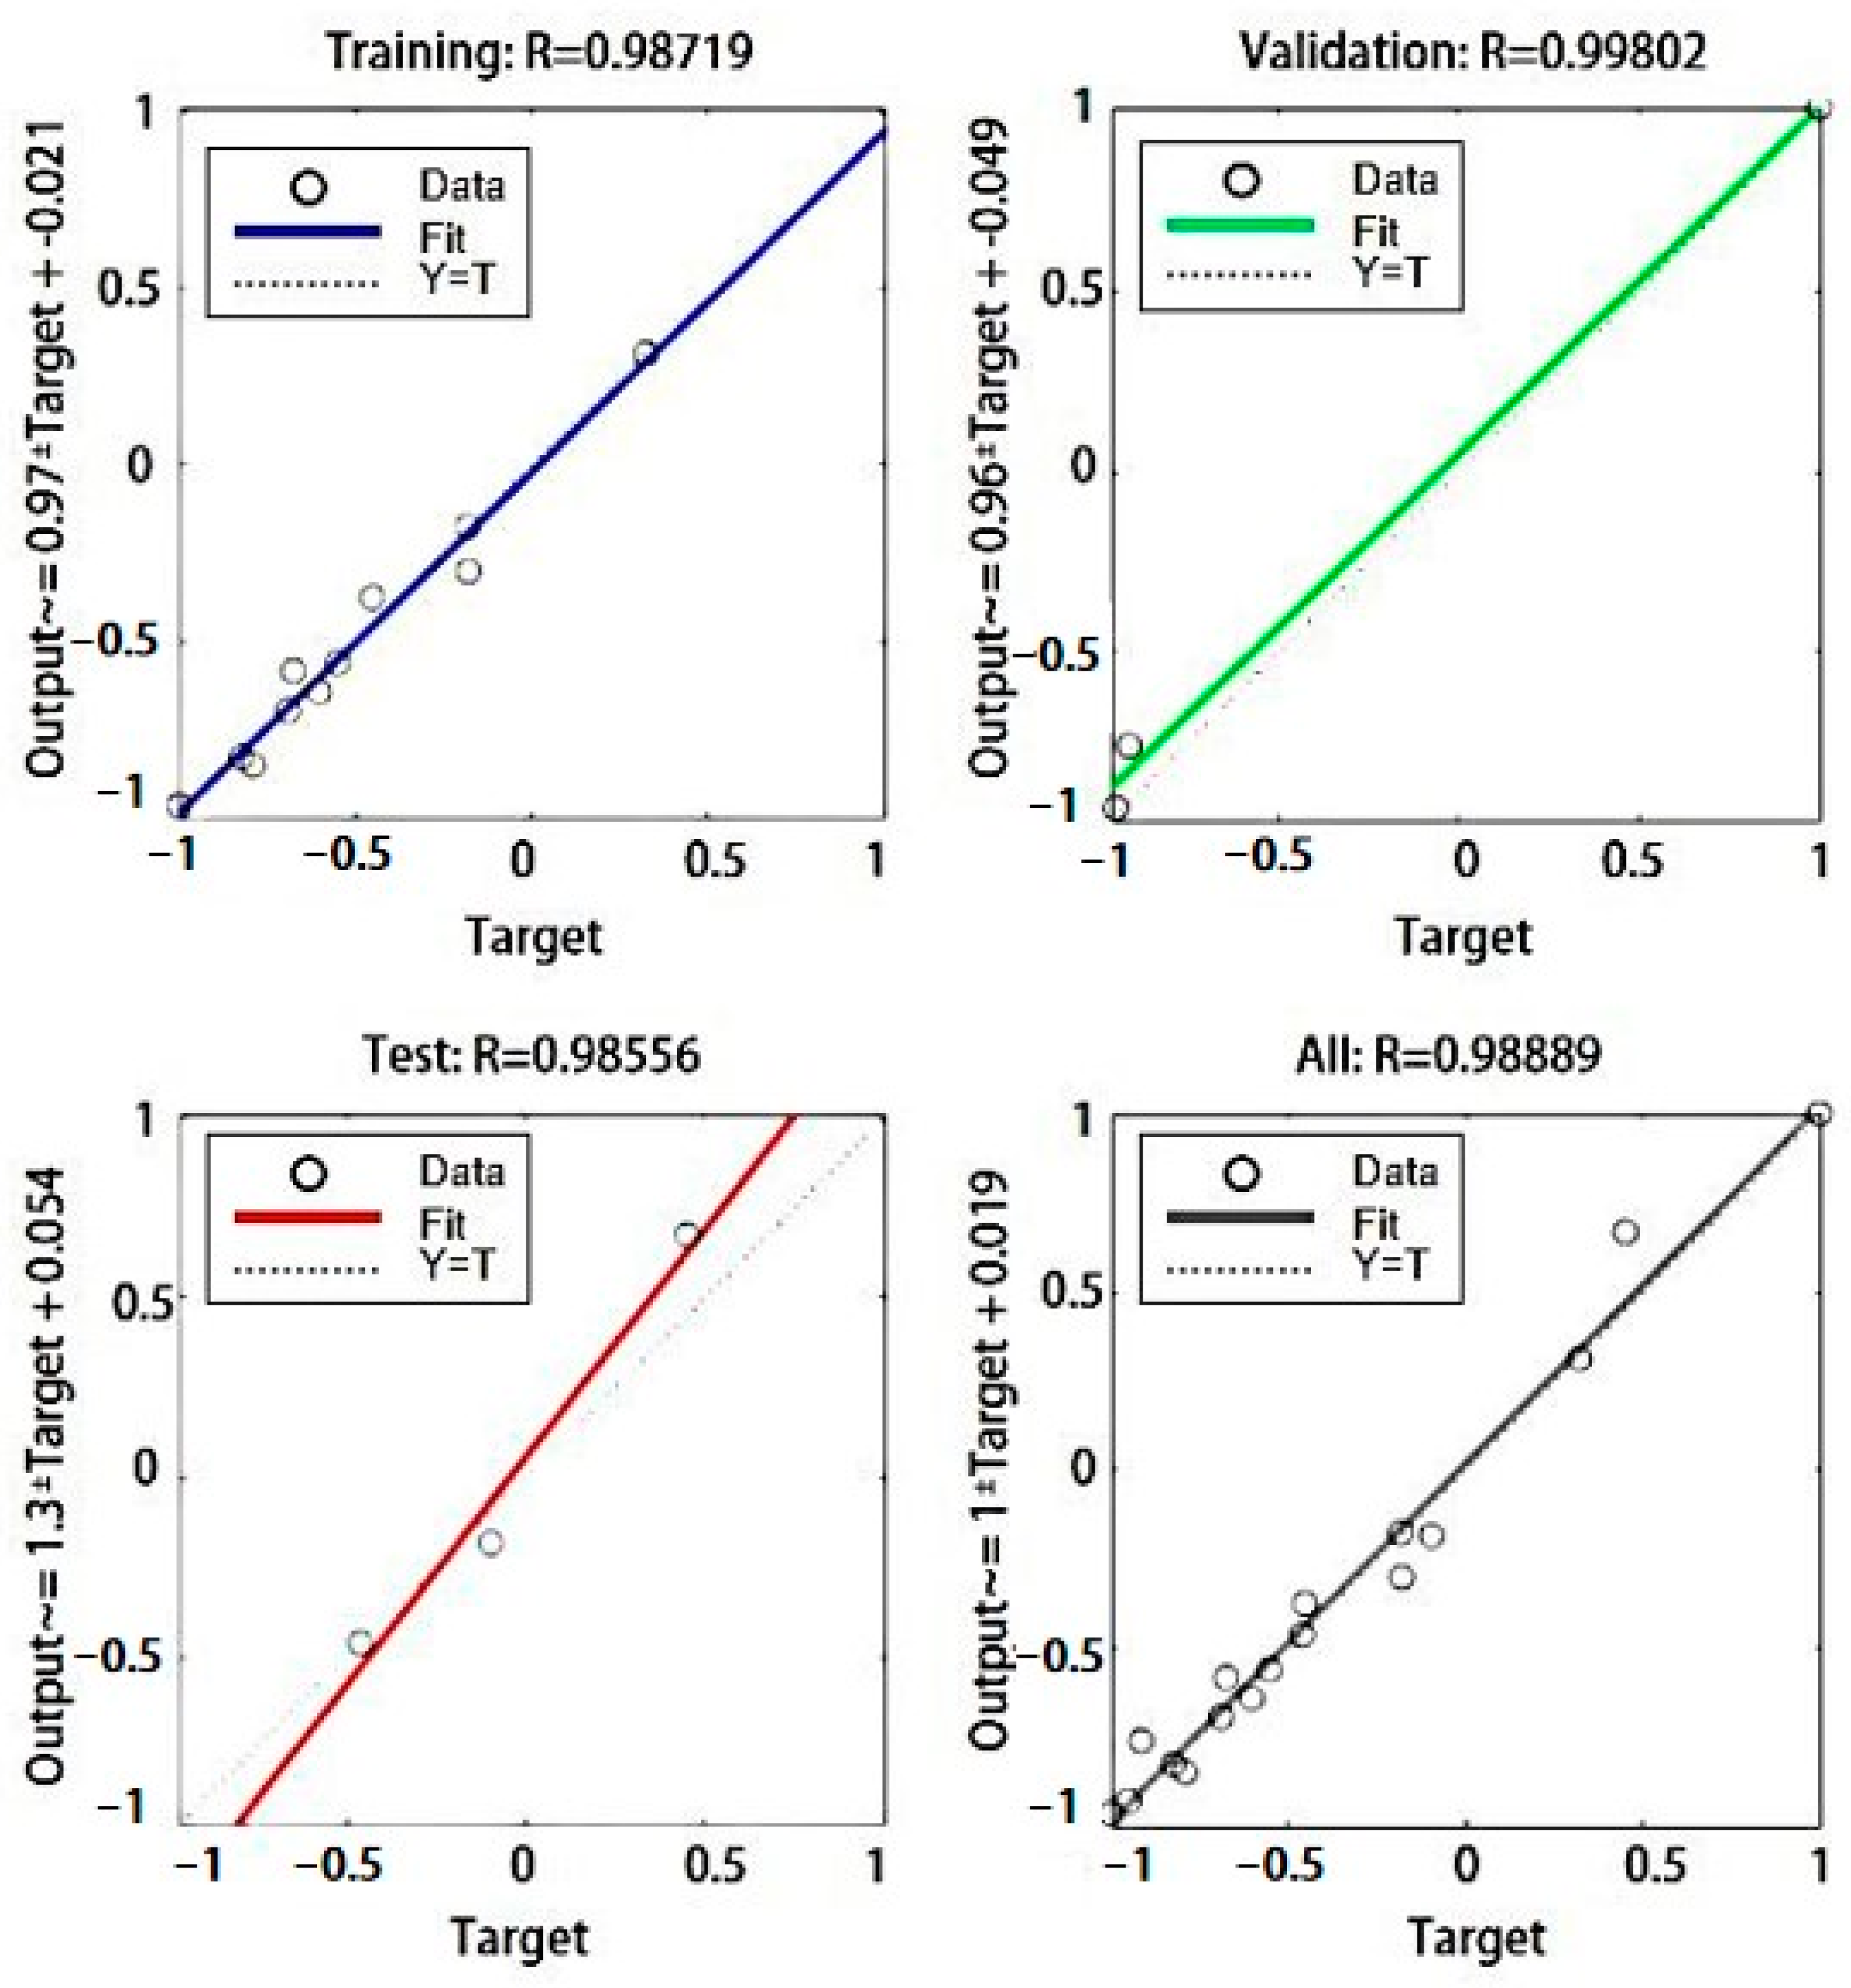
4.1. GA-BP Model

The BP neural network algorithm uses gradient descent to continuously correct network weights and thresholds by training the network until convergence yields an output value near the desired value [33]. Nevertheless, BP neural networks converge slowly, are sensitive to initial network weights and thresholds, and are susceptible to local search and other issues [34]. The initial weights and thresholds of the BP neural network are refined using the genetic algorithm (GA), thereby enhancing the convergence speed and accuracy of the neural network’s output values [35]. The initial weights and thresholds of the BP neural network are optimized using the GA algorithm, and the non-linear mapping relationship between the significant influencing factors and the stacking angle is determined through network training. Subsequently, three optimization objectives are converted into evaluation indices using the linear weighting method and hierarchical analysis, and an optimization search is conducted for the significant influencing parameters of the stacking angle using the genetic algorithm.
The parameters of the neural network were set as follows: the maximum number of iterations was 1000, the training target error was 0.001, the learning rate was set to 0.01, the input features (training set) were set to three neurons, which were the coefficient of static friction between silage and silage (D), the coefficient of rolling friction between silage and silage (E), and the coefficient of static friction between silage and the steel body (G), and the output features (test set) were set to silage-simulation stacking angle. There is a mapping relationship between the influence factor and the objective function. The network design training uses a three-layer network structure, in which the transport layer is three neurons (transport features); for the input layer neurons n1 between the number of neurons and the number of neurons in the implied layer n2 there is a certain approximation, n2 = 2n1 + 1 = 7, so the number of neurons in the hidden layer is set at 7, and the output neuron (target value) is 1 [36], which is the selection of the GA-BP. The optimal network topology is shown in Figure 9. The parameters of the genetic algorithm are set as follows: the number of genetic iterations is 200, the population size is 100, the selection function is (norm Geom Select), the parameter of the function is taken as 0.09, the crossover coefficient is taken as 1, and the coefficient of variation is taken as 0.2. The schematic diagram of the GA-BP neural network is shown in Figure 10.
The mean square error (MSE) measures the average error of the data based on the degree of data variation; the smaller its value, the more accurately the built model describes the experimental results. As depicted in Figure 11, the model achieved optimal validation performance in the second training phase, with an MSE of 0.0016583, indicating that the GA-BP network model converges rapidly and consistently and can better meet experimental requirements.

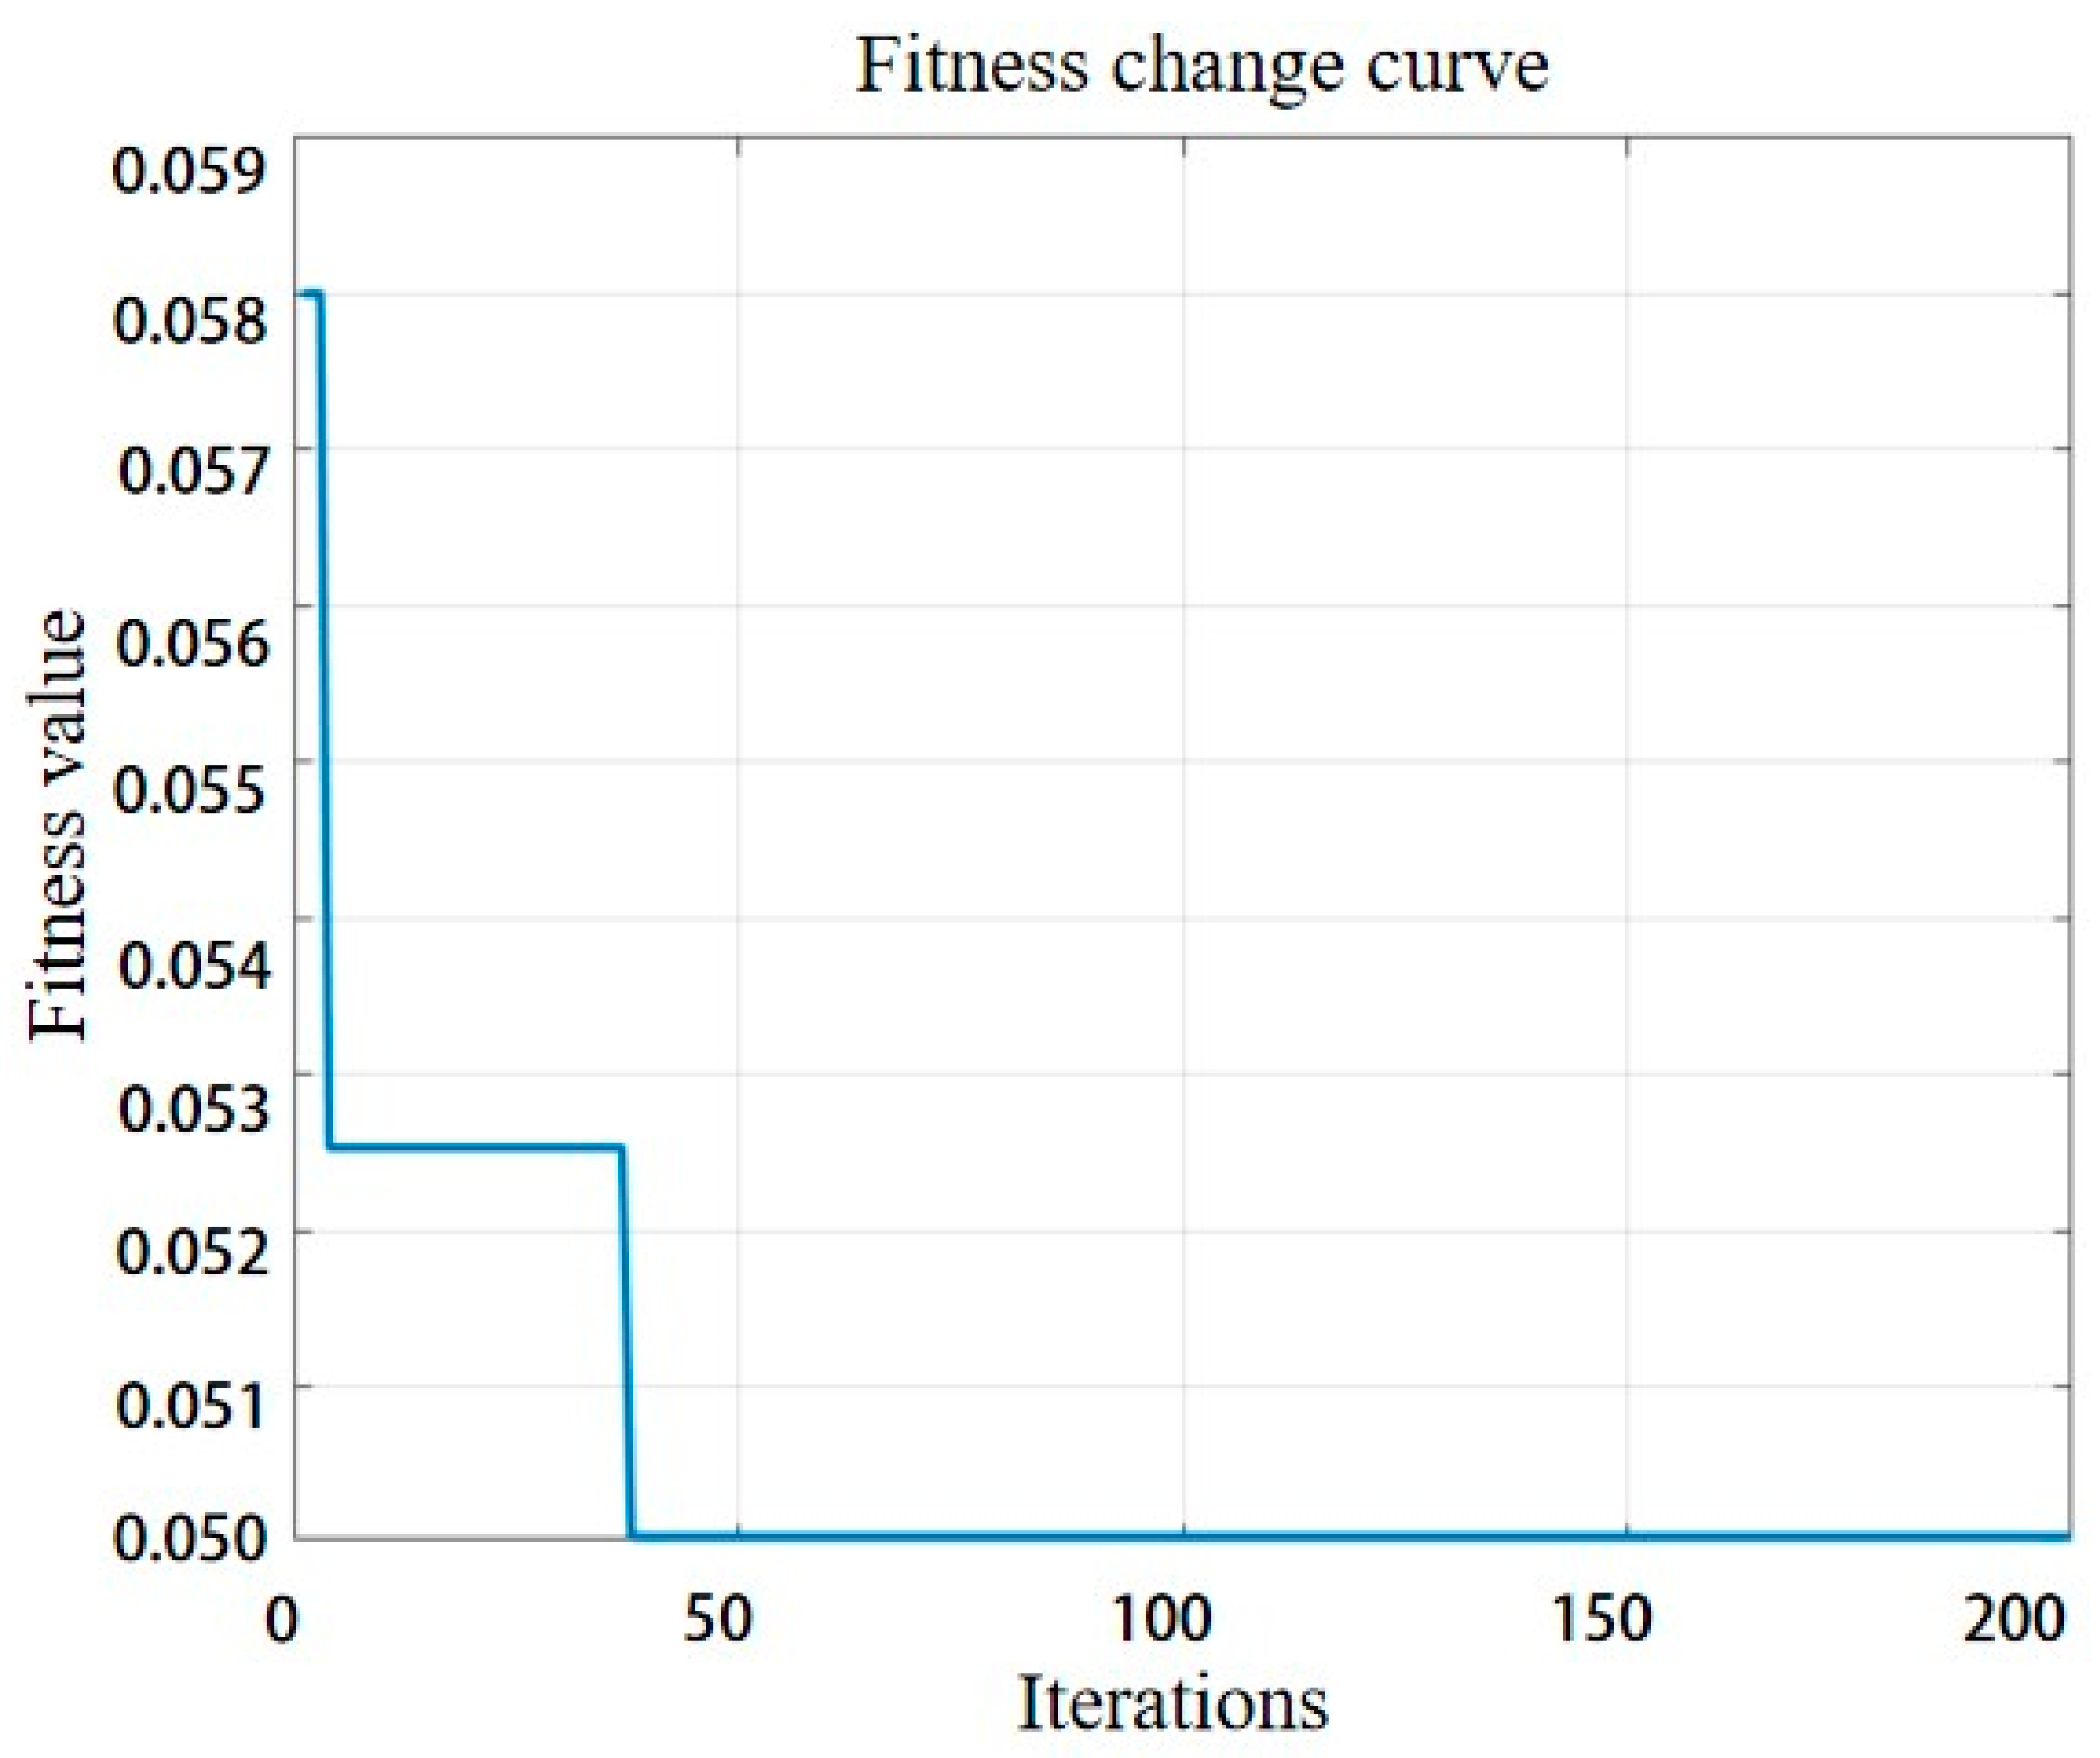
4.2. GA-BP-GA Parameter Optimization

The unknown nonlinear function’s optimization search for function extrema was conducted using the genetic algorithm. The fitness function of the genetic algorithm was the established neural network model, and the values of silage–silage static friction coefficient (D), silage–silage rolling friction coefficient (E), and silage–steel-body static friction coefficient (G) were searched with the silage stacking angle (38.65°) as the optimization objective. The number of genetic algorithm iterations was set to 100, the population size was 100, the selection function was Norm Geom Select, the parameters were set to 0.8, the crossover coefficient was set to 2, and the mutation coefficient was set to 0.2 [37,38]. The GA-BP-GA parameter optimization flowchart is shown in Figure 12.
According to Figure 13, after training and analysis, the optimized GA-BP neural network model had a training coefficient R-value of 0.98719, a validation coefficient R-value of 0.99802, a testing coefficient R-value of 0.98556, and an overall correlation coefficient R-value of 0.98889. The findings show a strong correlation between the anticipated and observed data, and the model is appropriate for experimental study [38].
Figure 14 depicts the change curve of the population’s fitness value throughout the optimization iteration using the relevant model established earlier as the fitness function of the GA genetic algorithm. The figure shows that the GA optimization uses the population search function, multiple crossovers, and a selection process to cause the fitness value of the chosen individuals to decrease abruptly two times and then gradually level off; when the 40th iteration is reached, the population’s fitness curve slowly converges to around 0.05, indicating that the difference between the predicted value and the target value is minimal; at 200 iterations, the GA ceases the merit search and determines the individual fitness value that is closest. The simulation yielded the following optimal parameters: static friction factor between silage and silage of 0.49, rolling friction factor between silage and silage of 0.19, and static friction factor between silage and the steel body of 0.42. The simulated silage stacking angle was determined to be 39.151°, with a relative error of 1.3% compared to the actual silage stacking angle.

4.3. Validation Test

The error between the simulated stacking angle and the actual stacking angle obtained after optimization by the above RSM model and GA-BP model is less than 5%, indicating that the values of the three significant parameters obtained above are accurate and reliable and that both models are suitable for stacking-angle prediction. The prediction accuracy after GA-BP-GA optimization is greater than that after RSM optimization, and the error values of stacking and actual stacking angles after GA-BP-GA optimization are smaller than those of RSM. After GA-BP-GA optimization, the error values of the stacking angle and actual stacking angle are less than those of RSM, indicating that the predicted values of GA-BP-GA are closer to the actual true values.
The optimized solution is simulated, and the results of the simulation test are compared with the results of the physical stacking test to identify the set of optimized solutions with the size and shape of the stacking angle most closely resembling the physical stacking test. Figure 15 illustrates the contrast between the simulation exam and the physical test. The results indicate that there is no significant difference between the simulation test results of the stacking angle and the physical test results of the stacking angle under the optimized simulation parameters, and that the shape profile and angle of the stacking angle of the two are similar, indicating that the simulation parameters of this group are set accurately and that the model and parameter calibration results constructed for the study of silage are reliable.

5. Conclusions

(1)
Experiments determined the physical- and mechanical-property parameters of silage. In three layers, the geometric size distribution of the silage was >19 mm, 8 mm ≤ particle size ≤ 19 mm, and <8 mm in three layers, representing 13.86%, 47.53%, and 38.61% of the bulk, respectively. The bulk density and moisture content were 69.16% and 491.68 kg/m3, respectively. The average static friction coefficient between silage and silage was 0.465, while the average static friction coefficient between silage and steel was 0.367. The average rolling friction coefficient between silage and silage was 0.176, and the average rolling friction coefficient between silage and steel was 0.138.
(2)
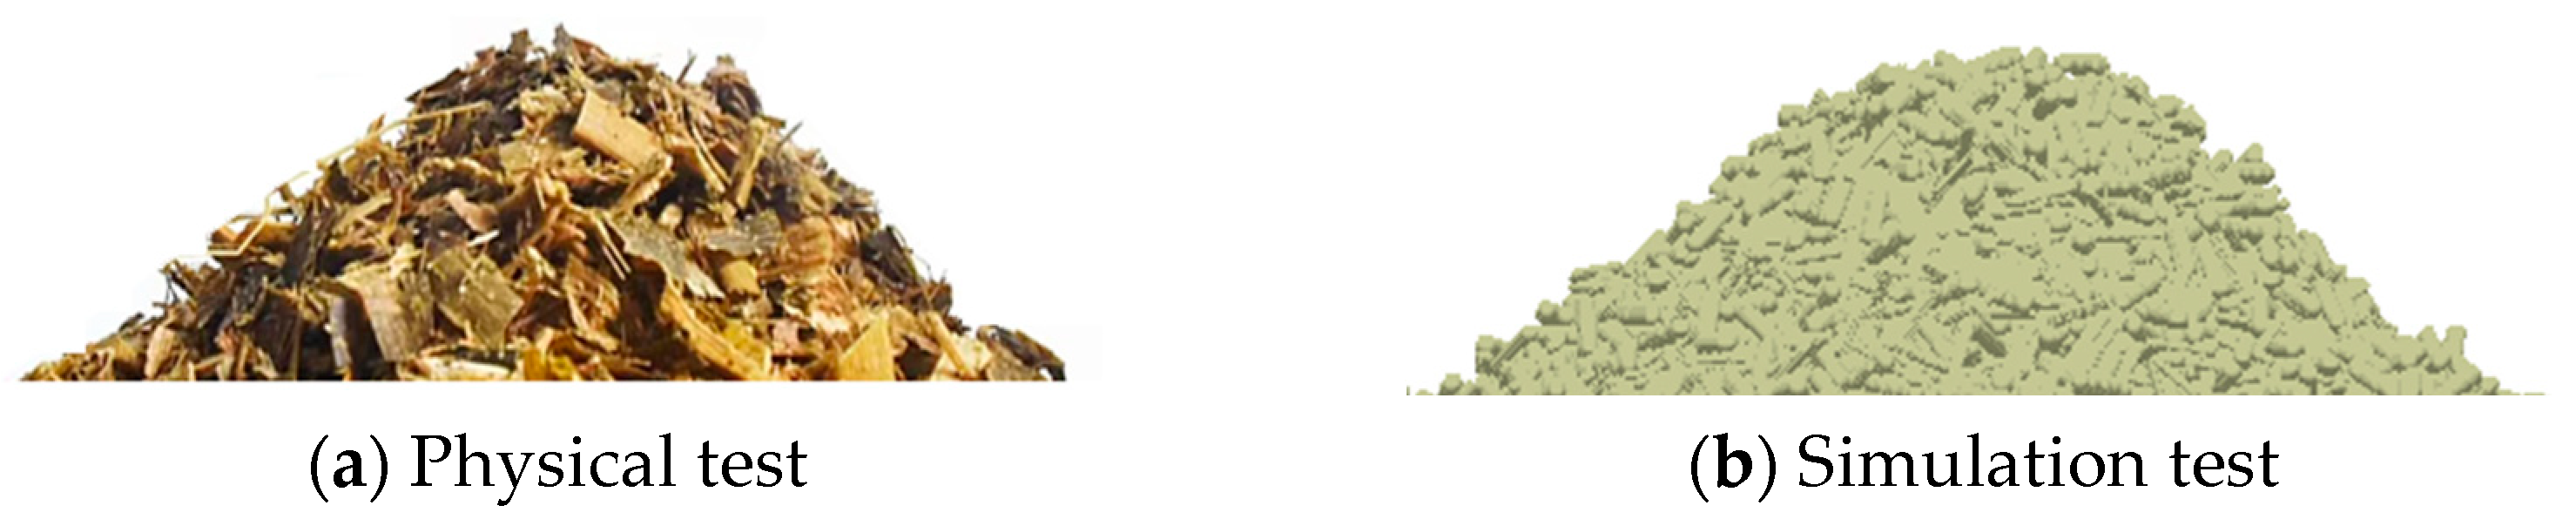
The physical stacking angle test was conducted on silage using a universal material tension tester and the cylinder hoisting method. The derived stacking-angle images were processed using MATLAB and Origin software, the contour pixel point coordinates were extracted, and linear fitting was used to determine a stacking angle of 38.65°.
(3)
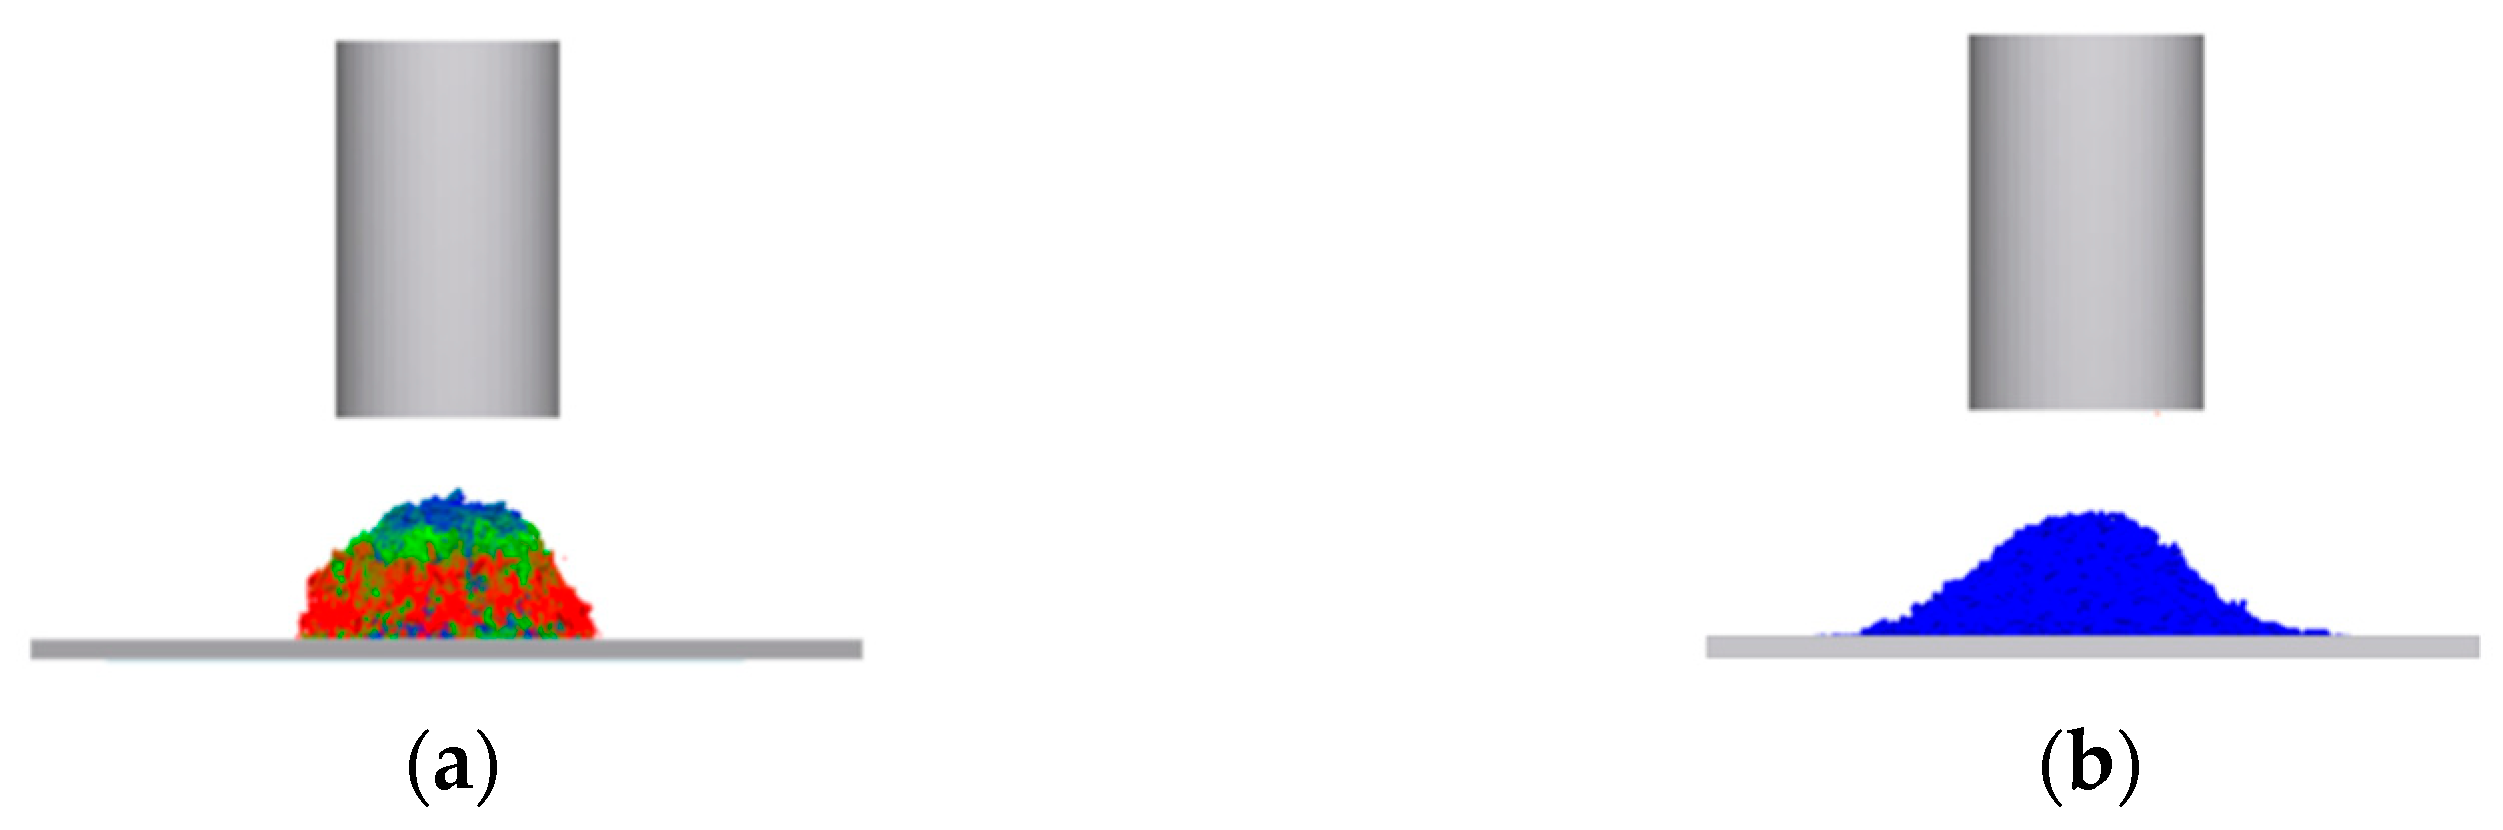
Establishing a discrete element simulation model based on the Hertz–Mindlin with JKR Cohesion contact model, the PB test and steepest climb test were used to screen the significant factors affecting the stacking angle, and the CCD test was used to optimize the values of the significant parameters further. The static friction coefficient between silage and silage was 0.498, the rolling friction coefficient between silage and silage was 0.196, and the static friction coefficient between silage and steel was 0.404. The measured simulated silage stacking angle was 40.0526°, with a relative error of 3.6% compared to the actual physical silage stacking angle.
(4)
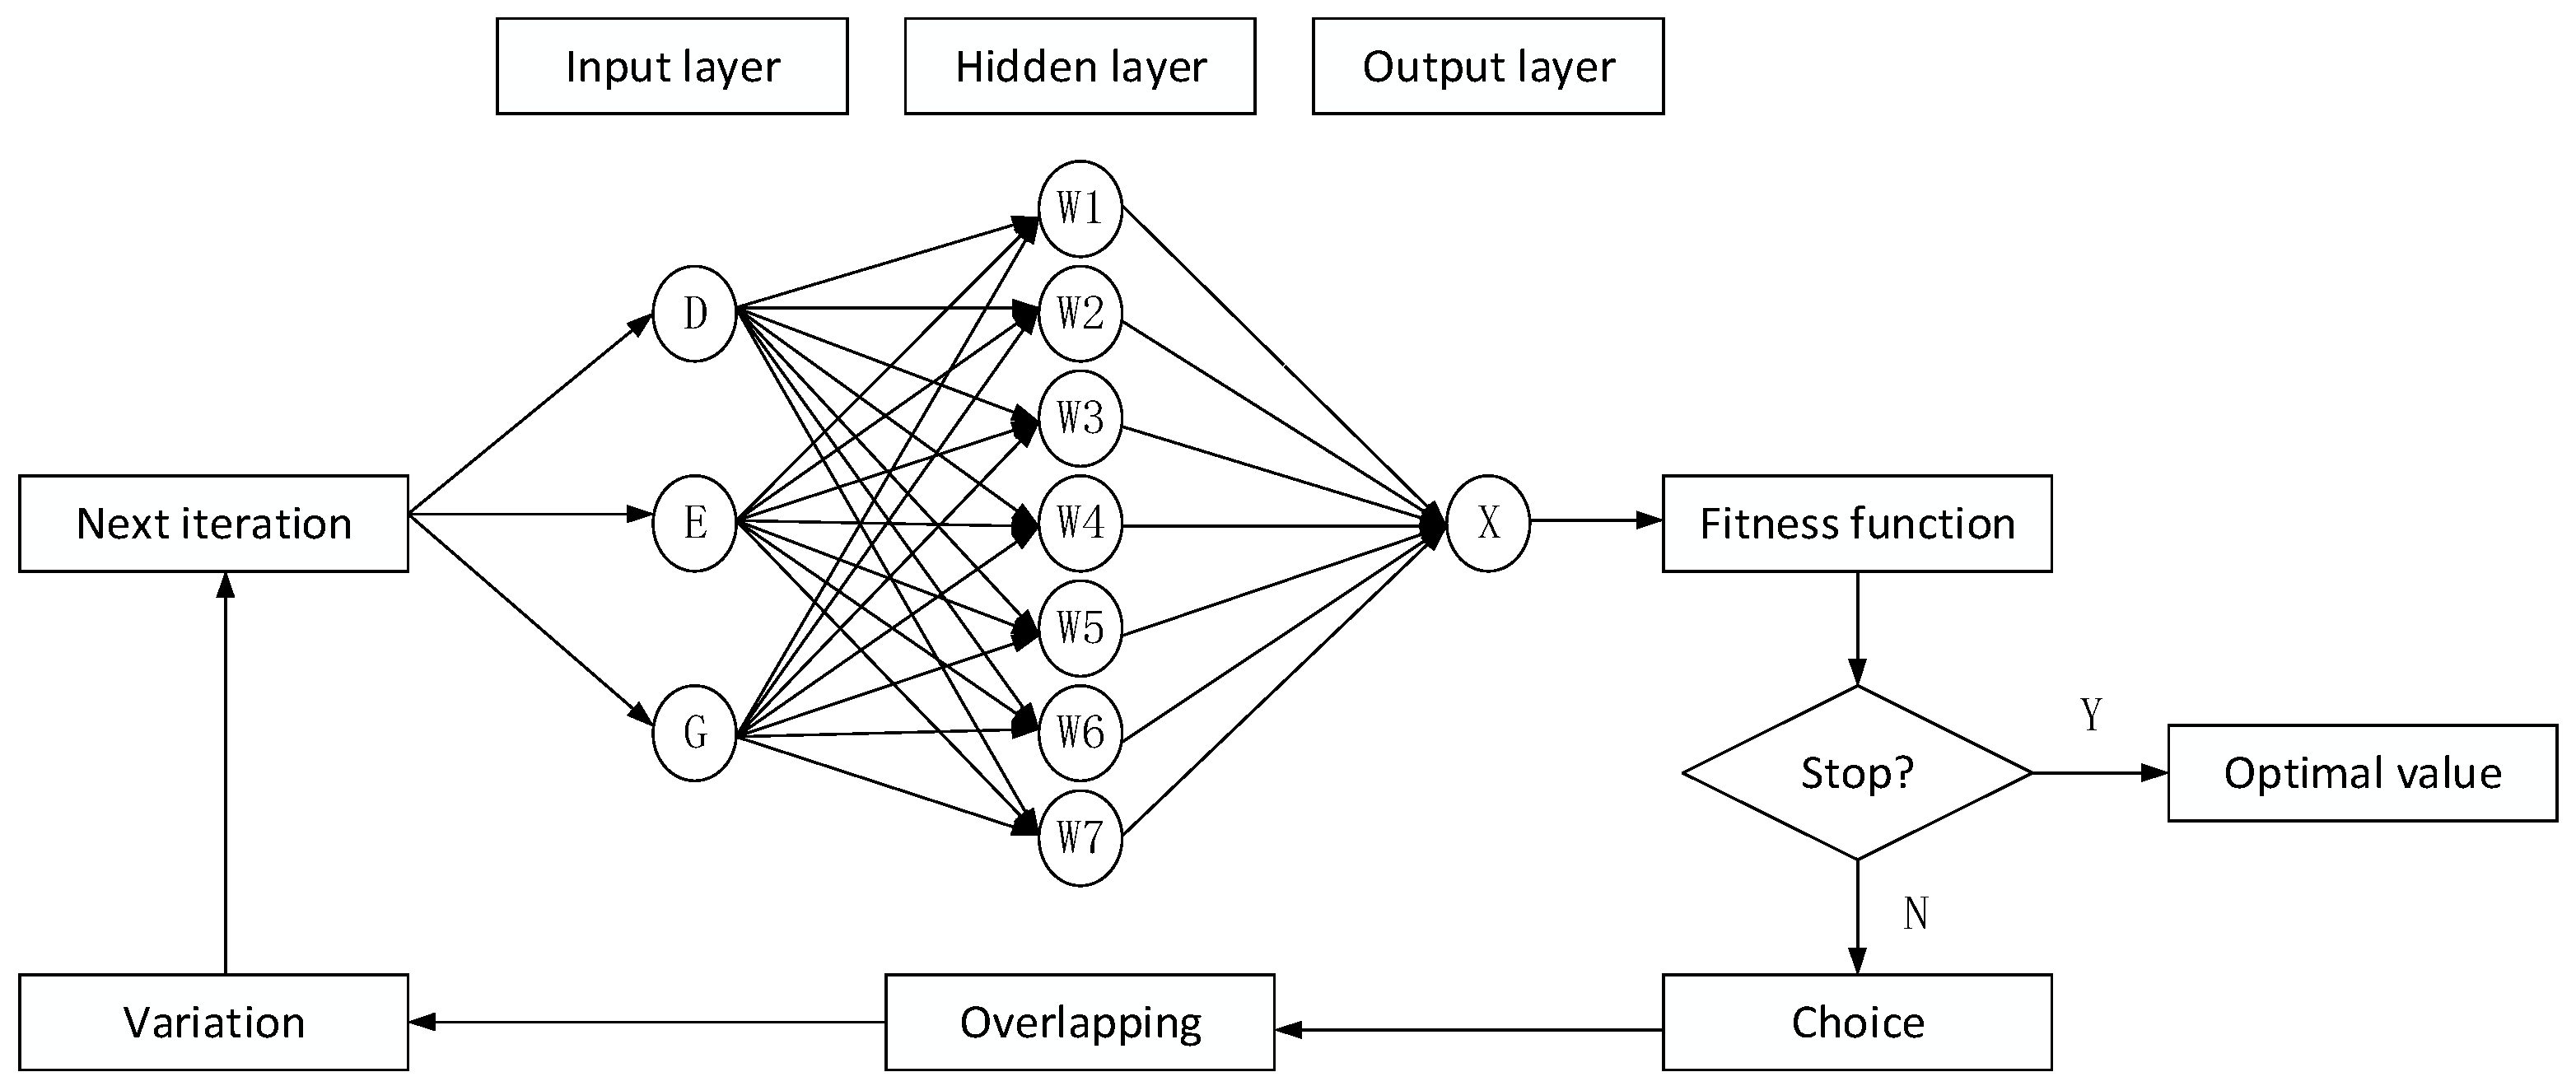
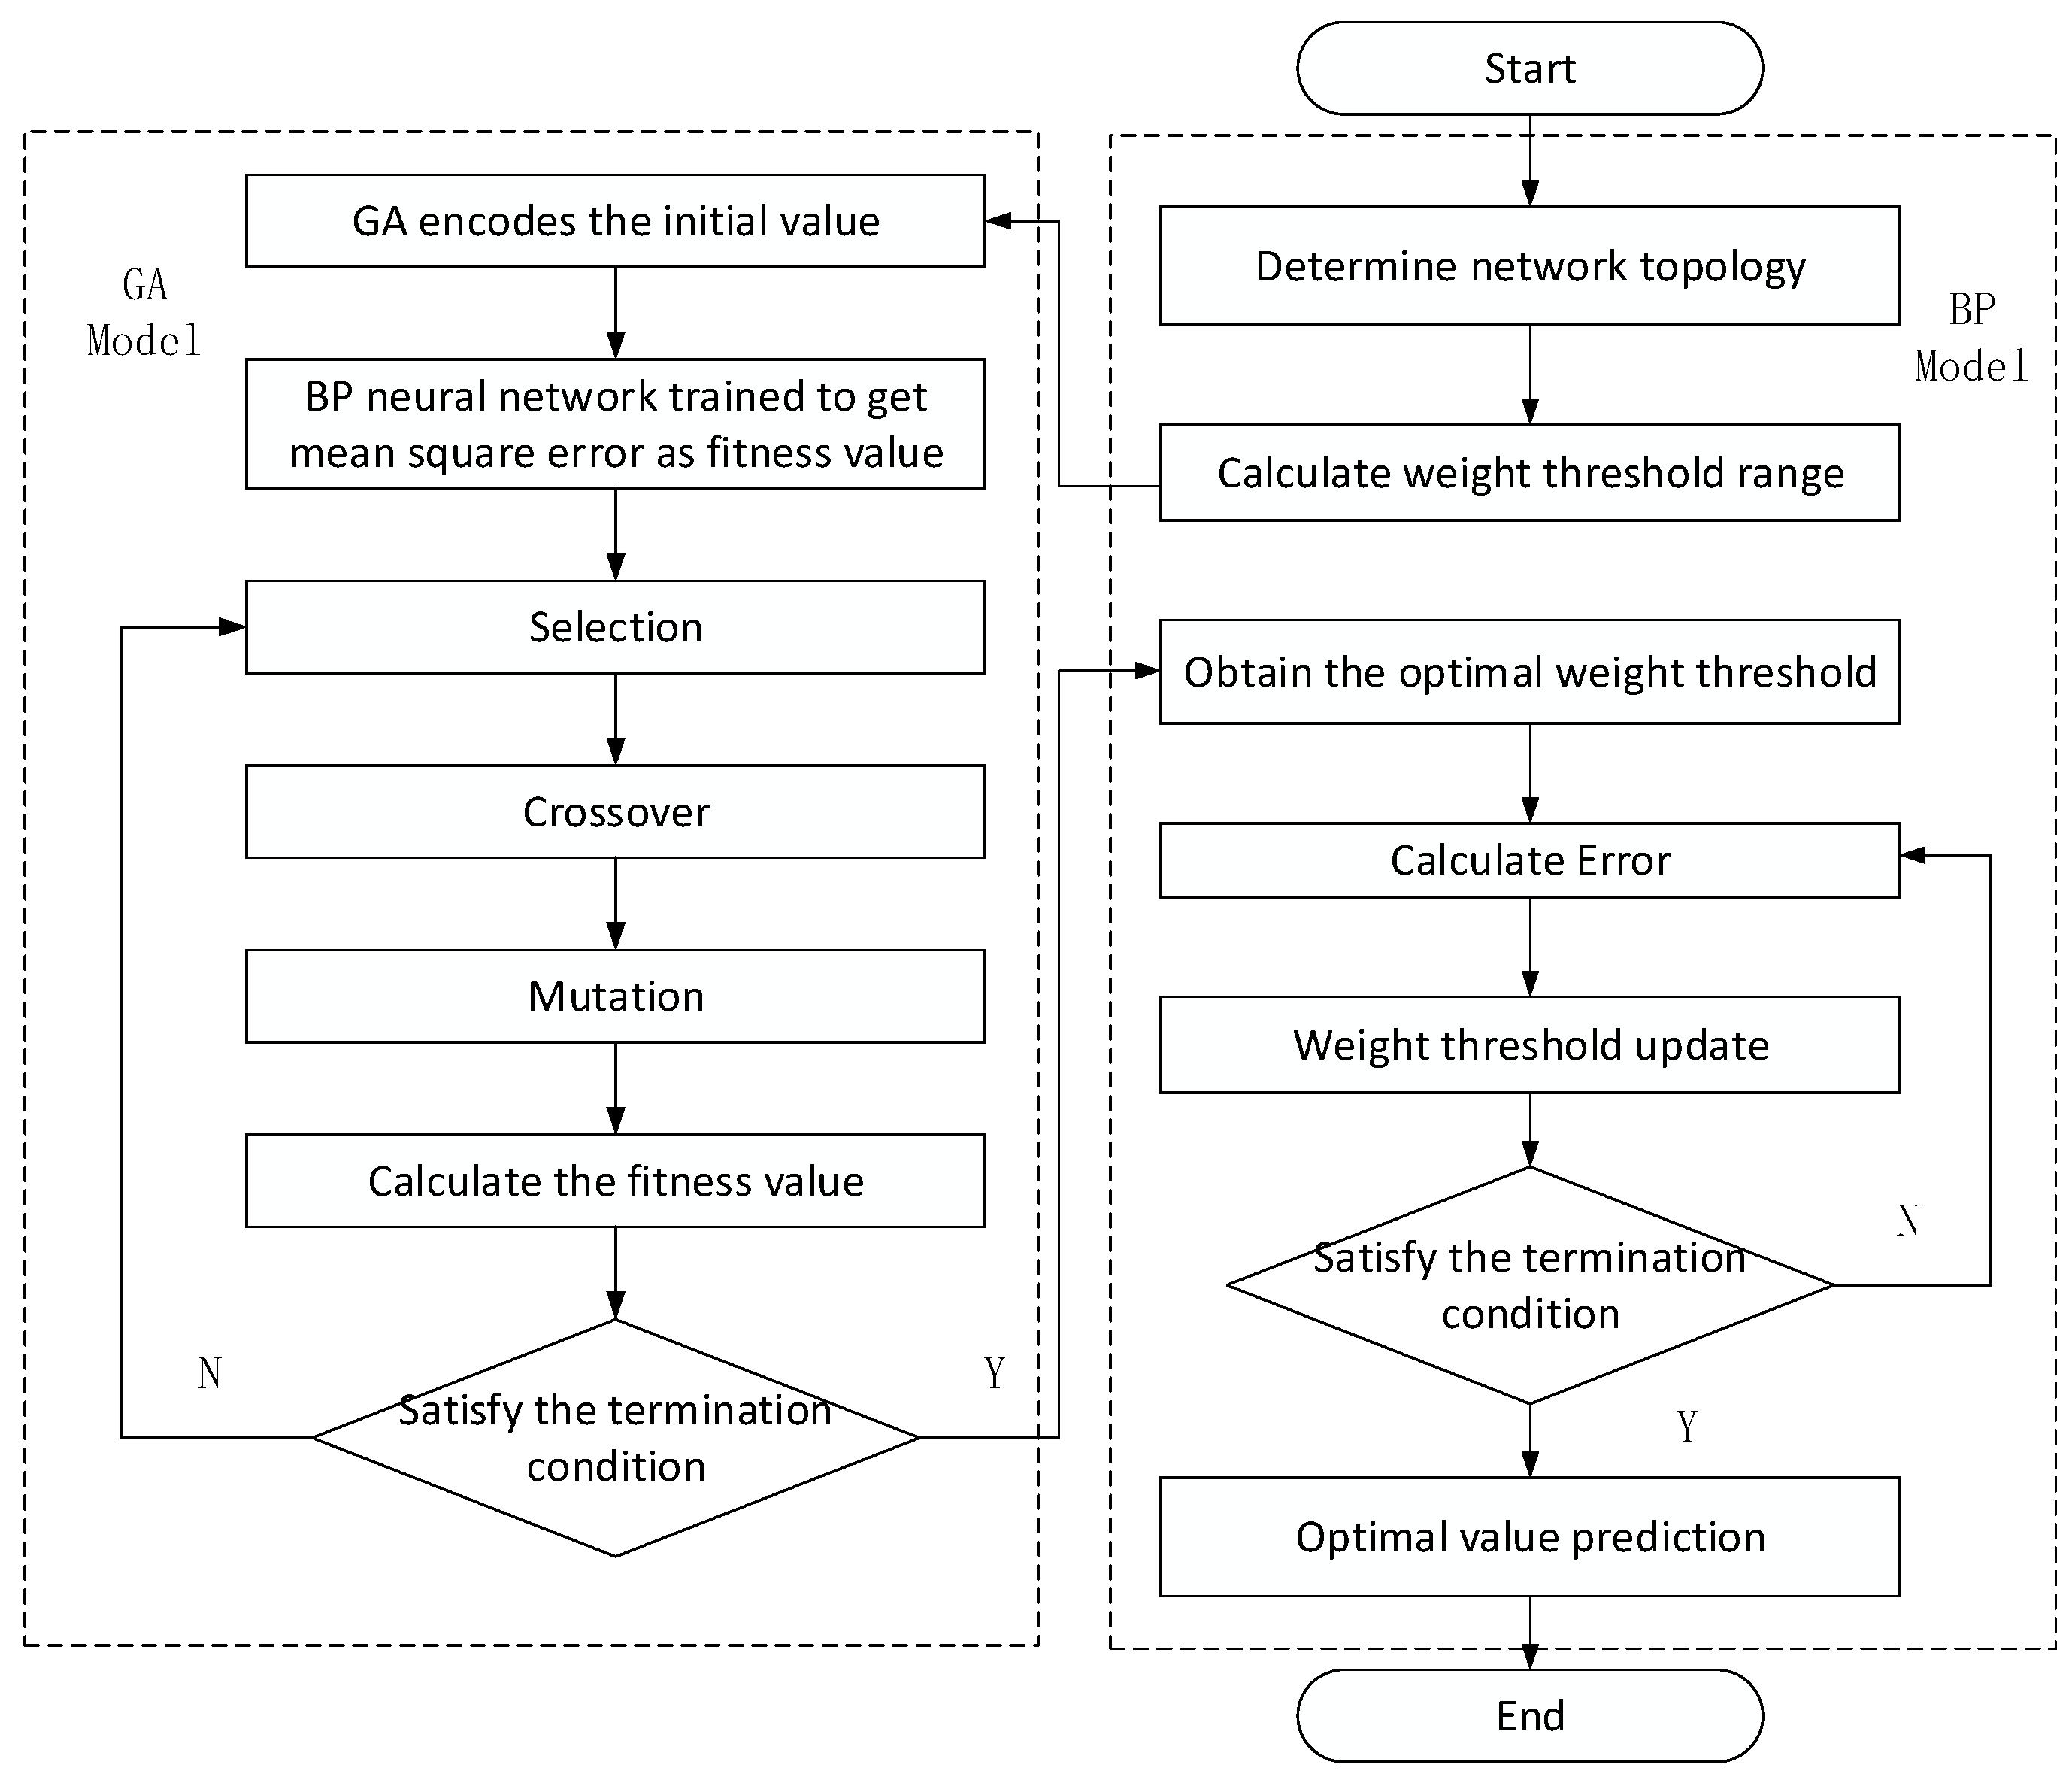
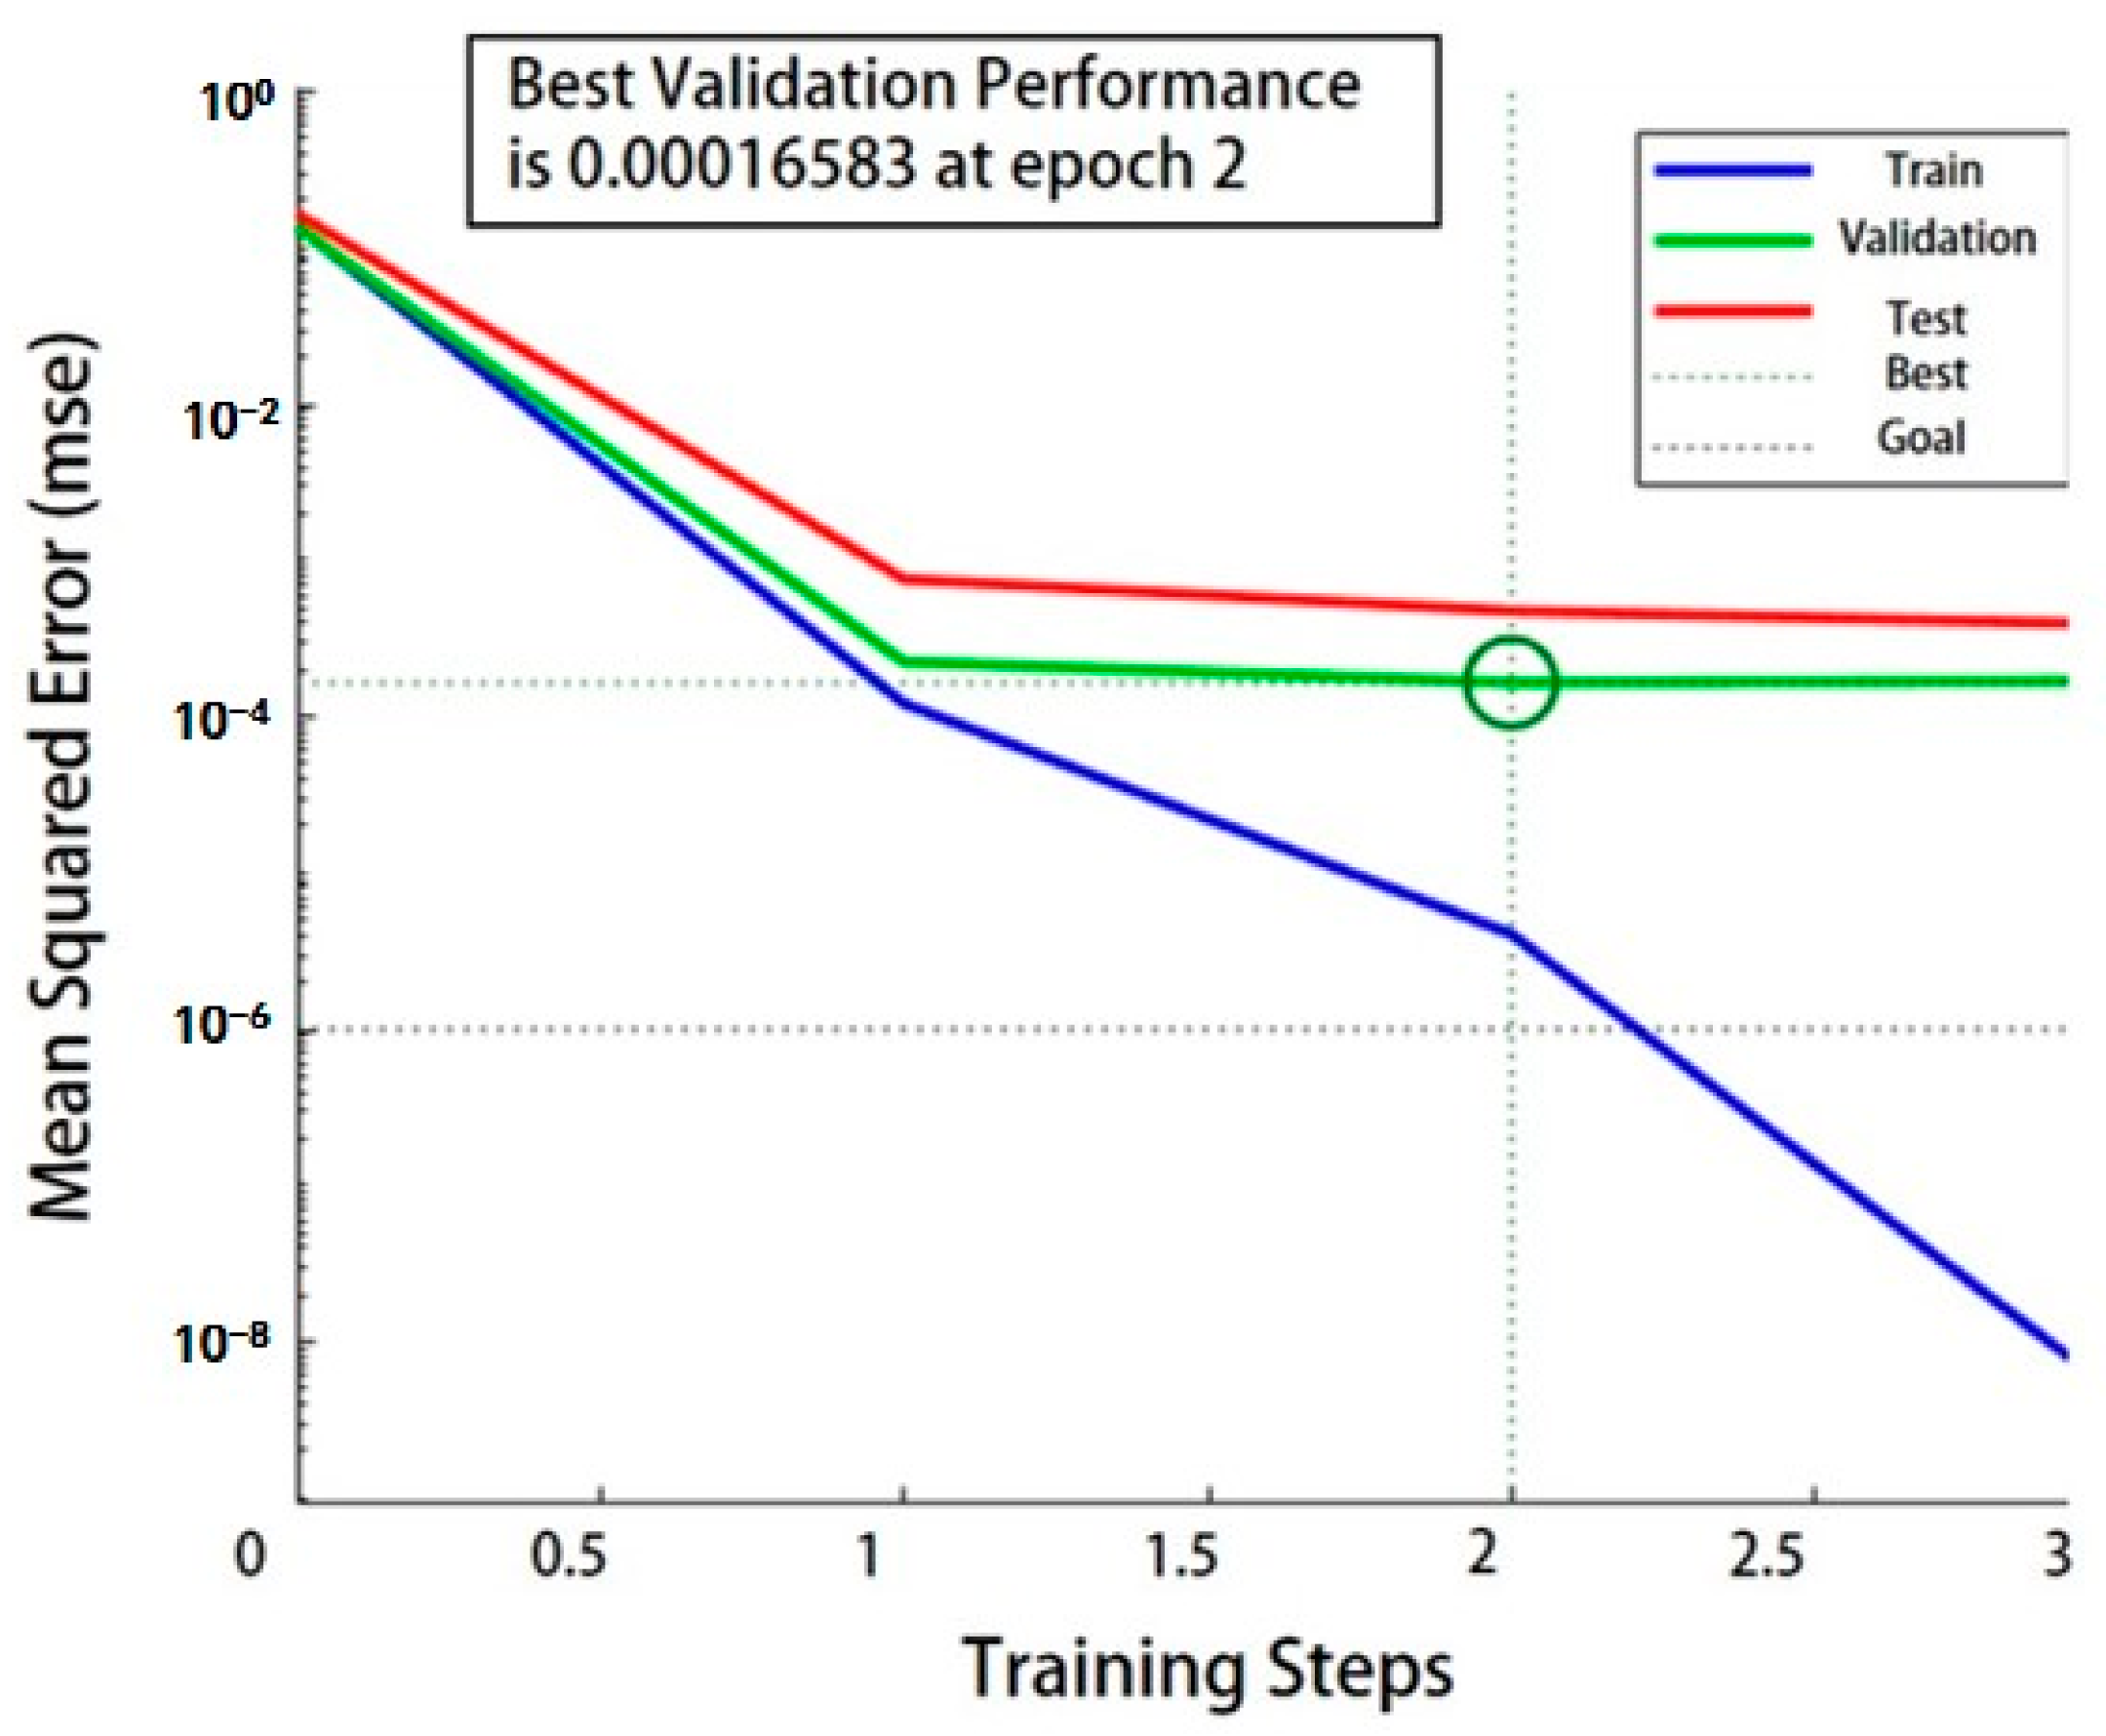
The topology of the GA-BP regression prediction model was 3-7-1, and the GA heritage algorithm was used to discover the inverse function for the GA-BP regression model. The simulation yielded the optimal parameters: the static friction factor between silage and silage was 0.495, the rolling friction factor was 0.194, and the static friction factor between silage and steel was 0.42. The measured simulated stacking angle of silage was 39.151°, and the relative error with the actual stacking angle of silage was 1.3%, which was better than the relative error of RSM (3.6%). This indicates that GA-BP-GA is superior to RSM for parameter optimization in silage parameter calibration.
(5)
The study demonstrates that the discrete element method is a scientific and reasonable approach for the parameter calibration of silage. Furthermore, GA-BP-GA’s parameter optimization effect is better than RSM’s. The results of this study provide scientific data to support the simulation and analysis of silage. Building on these findings, the discrete element model of silage-related conveyors offers a theoretical basis for revealing the conveyor’s silage mechanism and optimizing the design of conveyor machinery and equipment.

Author Contributions

Conceptualization, G.L. and S.A.; methodology, J.Z.; software, G.L. and S.A.; validation, G.L. and J.M.; formal analysis, G.L. and C.Z.; investigation, G.L.; resources, G.L. and J.Z.; data curation, G.L. and C.Z.; writing—original draft preparation, G.L.; writing—review and editing, G.L., X.T., R.G. and S.A.; project administration, B.F. and J.Z.; funding acquisition, B.F. and J.Z. All authors have read and agreed to the published version of the manuscript.

Funding

This study was supported by the Xinjiang Agricultural Machinery R&D, Manufacturing, Promotion, and Application Integration Project, Project leader: Bin Feng, Number: YTHSD202219. In the meantime, Autonomous Region Livestock and Poultry Breeding Industry Strengthening Project “Agricultural Area Highly Efficient Meat Sheep Breed Selection and Breeding Promotion Technical System Job Expert Task”, Project Leader: Jie Zhang, 2023, Number: xjnqry-g-2306.

Data Availability Statement

All data are presented in this article in the form of figures and tables.

Acknowledgments

We thank the Xinjiang Agricultural Machinery R&D, Manufacturing, Promotion, and Application Integration Project and the Autonomous Region Livestock and Poultry Seed Industry Improvement Project for their funding for this study.

Conflicts of Interest

The authors declare no conflict of interest.

References

  1. Zhang, L.; Chen, Z.; Yang, M.; Huang, H.; Ye, C. Analysis of spatial and temporal characteristics of maize production efficiency in China. J. Agric. Mach. 2018, 49, 183–193. [Google Scholar]
  2. Chu, T.S.; Yang, Z.L.; Han, L.J. Analysis of the satisfaction and dominance of crop straw fodder utilization in China. J. Agric. Mach. Eng. 2016, 32, 1–9. [Google Scholar]
  3. Chen, C.; Yang, Y.; Xie, G. Research on the development of straw resource management policy in China. J. China Agric. Univ. 2016, 21, 1–11. [Google Scholar]
  4. Opinions of the Ministry of Agriculture and Rural Affairs on accelerating the development of animal husbandry mechanization. In Xinjiang Agricultural Mechanization; Ministry of Agriculture and Rural Affairs of the People’s Republic of China: Beijing, China, 2020; pp. 39–41.
  5. Zeng, Z.; Ma, X.; Cao, X.; Li, Z.; Wang, X. Current status and outlook of the application of discrete element method in agricultural engineering research. J. Agric. Mach. 2021, 52, 1–20. [Google Scholar]
  6. Wang, X.; Li, P.; He, J.; Wei, W.; Huang, Y. Discrete element simulations and experiments of soil-winged subsoiler interaction. J. Agric. Biol. Eng. 2021, 14, 50–62. [Google Scholar] [CrossRef]
  7. Yuan, J.; Yin, R.; Liu, G.; Liu, X.; Mao, Z. Design and testing of a compound fruit tree planting machine with in-situ fertilizer mixer for digging and backfilling. J. Agric. Mach. 2021, 52, 110–121. [Google Scholar]
  8. Liu, P.; He, J.; Zhang, C.; Lu, C.; Zhang, Z.G.; Lin, H. CFD-DEM-based analysis and experiments on the movement characteristics of straw returning machine with broken stalks. J. Agric. Mach. 2020, 51 (Suppl. S1), 244–253. [Google Scholar]
  9. Zhang, T.; Liu, F.; Zhao, M.; Ma, Q.; Wang, W.; Fan, Q. Determination of physical parameters of corn stover contact with discrete element simulation calibration. J. China Agric. Univ. 2018, 23, 120–127. [Google Scholar]
  10. Zhang, F.; Song, X.; Zhang, X.; Zhang, F.; Wei, W.; Dai, F. Simulation and experiments on mechanical properties of corn straw kneading and crushing process. J. Agric. Eng. 2019, 35, 58–65. [Google Scholar]
  11. Wu, H.-A.; Wang, D.-C.; Gong, Z.-Q.; Zhang, X.M.; Wang, G.H. Optimized design of silage harvester throwing device based on EDEM. Chin. Dairy Cattle 2015, 18, 44–47. [Google Scholar]
  12. Coetzee, C.J.; Lombard, S.G. The destemming of grapes: Experiments and discrete element modelling. Biosyst. Eng. 2013, 114, 232–248. [Google Scholar] [CrossRef]
  13. Wang, X.; Yu, J.; Lv, F.; Wang, Y.; Fu, H. A multi-sphere based modelling method for maize grain assemblies. Adv. Powder Technol. 2017, 28, 584–595. [Google Scholar] [CrossRef]
  14. Gong, Y.; Wang, D.; Bai, X.; Qiu, S. A method for determining the parameters of the Burgers contact model for corn straw bulk particles. J. Shenyang Agric. Univ. 2019, 50, 306–313. [Google Scholar]
  15. Martina, C.L.; Bouvarda, D.; Shimab, S. Study of particle rearrangement during powder compaction by the Discrete Element Method. J. Mech. Phys. Solids 2003, 51, 667–693. [Google Scholar] [CrossRef]
  16. Huo, L.; Zhao, L.; Tian, Y.; Yao, Z.; Meng, H. Viscoelastic intrinsic modeling of biomass pellet fuel forming. J. Agric. Eng. 2013, 29, 200–206. [Google Scholar]
  17. Li, L. Experimental Study on Stalk and Leaf Separation Mechanism of Corn Stalks; Northeast Agricultural University: Harbin, China, 2014. [Google Scholar]
  18. NY/T 1881.2-2010; Test Method for Biomass Solid Forming Fuels Part 2: Full Moisture. China Agricultural Press: Beijing, China, 2010.
  19. NY/T 1881.6-2010; Test Methods for Biomass Solid-Forming Fuels, Part 6: Bulk Density. China Agricultural Publishing House: Beijing, China, 2010.
  20. Wang, L.; Fan, S.; Cheng, H.; Shen, Y.; Wang, J. EDEM-based calibration of swine manure contact parameters. J. Agric. Eng. 2020, 36, 95–102. [Google Scholar]
  21. Liu, W.; Xu, W.; Li, B.; Li, Y. Determination of rolling friction coefficient and EDEM simulation analysis. Mach. Des. Manuf. 2018, 9, 132–135. [Google Scholar]
  22. Liang, R.Q.; Chen, X.G.; Jiang, P.; Zhang, B.; Meng, H.; Peng, X.; Kan, Z. Calibration of the simulation parameters of the particulate materials in film mixed materials. Int. J. Agric. Biol. Eng. 2020, 13, 29–36. [Google Scholar] [CrossRef]
  23. Hao, J.; Wei, W.; Huang, P.; Qin, J.; Zhao, J. Calibration and experimental validation of discrete element parameters for oilseed sunflower seeds. J. Agric. Eng. 2021, 37, 36–44. [Google Scholar]
  24. Feng, J.; Lin, J.; Li, S.; Zhou, J.; Zhou, X. Calibration of discrete element parameters for particle mixing state in straw solid fermentation rotary cylinder. J. Agric. Mach. 2015, 46, 208–213. [Google Scholar]
  25. Horabik, J.; Molenda, M. Parameters and contact models for DEM simulations of agricultural granular materials: A review. Biosyst. Eng. 2016, 147, 206–255. [Google Scholar] [CrossRef]
  26. Liu, C.; Wang, Y.; Song, J.; Li, Y.; Ma, T. Discrete element modeling of rice seeds based on 3D laser scanning and experiments. J. Agric. Eng. 2016, 32, 294–300. [Google Scholar]
  27. Wen, B.; Wang, B.; Lu, X.C. Handbook of Metallic Materials; Electronic Industry Press: Beijing, China, 2013; p. 24. [Google Scholar]
  28. Luo, S.; Yuan, Q.; Gouda, S.; Yang, L. Parameter calibration of discrete element method for earthworm manure substrate based on JKR bonding model. J. Agric. Mach. 2018, 49, 343–350. [Google Scholar]
  29. Wang, W.; Cai, D.; Xie, J.; Zhang, C.; Liu, L.; Chen, L. Calibration of discrete element model parameters for dense forming of corn straw. J. Agric. Mach. 2021, 52, 127–134. [Google Scholar]
  30. Wang, B. Design and Optimization of a Self-Propelled Total Mixed Ration Preparation Machine; Shandong Agricultural University: Tai’an, China, 2022. [Google Scholar]
  31. Li, L. Analysis and Experimental Research on Mixing Mechanism of Drum-Type Grain Mixer; Northeast Agricultural University: Harbin, China, 2018. [Google Scholar]
  32. Yu, K.Q. Analysis and Experimental Research on the Mixing Mechanism of Rotor-Type Total Mixed Grain Mixer; Northeast Agricultural University: Harbin, China, 2015. [Google Scholar]
  33. He, Y.; Meng, Z.; Xu, H.; Zou, Y. A dynamic model of evaluating differential, automatic method for solving plane problems based on BP neural network algorithm. Phys. A Stat. Mech. Its Appl. 2020; 556, prepublish. [Google Scholar] [CrossRef]
  34. Bai, Y.L.; Xie, W.Y.; Zhao, M.T.; Zhou, K.M.; Fan, R.; Guan, T. MATLAB-based BP neural network for starch discrete element contact parameter calibration. Chin. J. Pharm. Sci. 2022, 57, 1268–1277. [Google Scholar]
  35. Yuan, S.C.; Jiang, X.Q. GA-BP neural network-based calibration of binocular cameras. J. Xi’an Univ. Archit. Technol. (Nat. Sci. Ed.) 2011, 43, 604–608. [Google Scholar]
  36. Jin, X.; Li, Y. Optimization of automotive wire harness cover stamping process based on BP-GA algorithm. Die Ind. 2022, 48, 17–21. [Google Scholar]
  37. Ding, X.; Li, K.; Hao, W.; Yang, Q.; Yan, F.; Cui, Y. Calibration of oilseed simulation parameters based on RSM and GA-BP-GA optimization. J. Agric. Mach. 2023, 54, 139–150. [Google Scholar]
  38. Gammoudi, N.; Mabrouk, M.; Bouhemda, T.; Nagaz, K.; Ferchichi, A. Modeling and optimization of capsaicin extraction from Capsicum a nuum L. using response surface methodology (RSM), artificial neural network (ANN), and Simulink simulation. Ind. Crops Prod. 2021, 171, 113869. [Google Scholar] [CrossRef]
Figure 1. Silage.
Figure 1. Silage.
Processes 11 02784 g001
Figure 2. Schematic representation of the principle.
Processes 11 02784 g002
Figure 3. Home-made inclined plane instrument.
Processes 11 02784 g003
Figure 4. Stacking angle physical test. Note: 1. Computer; 2. Universal material tension and pressure testing machine; 3. Fixture; 4. Cylinder; 5. Stacking angle; 6. High-definition camera.
Processes 11 02784 g004
Figure 5. Stacking-angle image processing. (a) Original image; (b) Grayscale processing; (c) Binarization; (d) Edge profile extraction; (e) Contour pixel point coordinates.
Processes 11 02784 g005
Figure 6. Discrete element model.
Processes 11 02784 g006
Figure 7. Stacking-angle simulation test. (a) Feed dispersal process; (b) Feed dispersal process.
Processes 11 02784 g007
Figure 8. Contour and surface maps of the interaction factors.
Processes 11 02784 g008aProcesses 11 02784 g008b
Figure 9. Optimal topology of GA-BP network.
Processes 11 02784 g009
Figure 10. Schematic diagram of GA-BP neural network.
Processes 11 02784 g010
Figure 11. Performance.
Processes 11 02784 g011
Figure 12. Flowchart of GA-BP-GA parameter seeking optimization.
Processes 11 02784 g012
Figure 13. Regression analysis.
Processes 11 02784 g013
Figure 14. Variation curve of the adaptation degree of the GA optimization process.
Processes 11 02784 g014
Figure 15. Comparison of physical and simulation tests. (a) Physical test; (b) Simulation test.
Processes 11 02784 g015
Table 1. Silage size and mass distribution.
Sieve BodiesUpper Sieve BodyMiddle Sieve BodyLower Sieve Body
Size/mm>198 ≤ particle size ≤ 19<8
Percentage of mass13.86%47.53%38.61%
Table 2. Silage moisture content.
Serial Number12345678910
Moisture content/%69.2370.1267.3668.2369.5672.3370.2867.3666.7270.36
Table 3. Silage stacking density.
Serial Number12345678910
Bulk density/kg/m3484.7481.5512.3475.3496.5487.5490.7483.6508.2496.5
Table 4. Silage stacking-angle measurement results.
Serial Number12345678910
Stacking angle/°39.3536.5038.6535.7537.5540.3542.2539.6536.2540.20
Table 5. Table of values for the screening parameters.
Test ParametersLow Level (−1)High Level (1)
Poisson’s ratio A0.30.5
Shear modulus B/MPa1035
Silage–silage collision recovery coefficient C0.250.4
The static friction coefficient between silage and silage D0.40.55
Rolling friction coefficient between silage and silage E0.10.25
Silage–steel inter-body collision recovery factor F0.150.35
The static friction coefficient between silage and steel body G0.30.5
Rolling friction coefficient between silage and steel body H0.10.25
Table 6. Plackett–Burman test protocol and results.
Serial NumberTest ParametersStacking Angle/(°)
ABCDEFGH
111−1111−1−138.74
2−111−1111−138.32
31−111−111136.52
4−11−111−11142.12
5−1−11−111−1139.02
6−1−1−11−111−137.36
71−1−1−11−11140.39
811−1−1−11−1134.34
9111−1−1−11−135.32
10−1111−1−1−1136.53
111−1111−1−1−139.34
12−1−1−1−1−1−1−1−134.13
130000000038.21
Table 7. Significance analysis of the Plackett–Burman test.
ParametersSum of SquaresDegrees of FreedomMean SquareF-Valuep-Value
Models63.9888.0019.030.0170 *
A0.667410.66741.590.2967
B0.161010.16100.38310.5798
C0.343410.34340.81710.4327
D6.8916.8916.380.0272 *
E46.93146.93111.660.0018 **
F1.0411.042.470.2140
G5.2415.2412.470.0386 *
H2.7212.726.460.0845
Discrepancy1.2630.4203
Total65.5012
Note: ** indicates an extremely significant effect (p < 0.01), and * indicates a significant effect (p < 0.05).
Table 8. Steepest climb test design and results.
Serial NumberFactorsStacking Angle/(°)Relative Error/%
DEG
10.40.10.329.1624.61
20.430.130.3436.615.35
30.460.160.3833.8612.46
40.490.190.4237.333.49
50.520.220.4641.086.2
60.550.250.547.1821.98
Table 9. CCD simulation factor coding table.
CodingFactors
DEG
−1.6820.4647730.1647730.386364
−10.4750.1750.40
00.490.190.42
10.5050.2050.44
1.6820.5152270.2152270.453636
Table 10. CCD scheme and results.
Serial NumberFactorsStacking Angle/(°)
D′E′G′
11−1146.65
200040.32
31.681790048.35
4001.6817950.02
500036.83
6−1−1143.72
71−1−138.78
800039.87
9−11−136.96
10−11143.78
11−1.681790032.56
1211−145.84
1300039.52
1400038.51
1500038.12
1601.68179043.12
1700038.35
1800040.98
19−1−1−132.06
2000−1.6817933.36
210−1.68179034.44
2200037.56
2311150.86
Table 11. CCD quadratic regression analysis of variance.
Source of VarianceSum of SquaresDegrees of FreedomMean SquareF-Valuep-Value
Model590.10965.5721.73<0.0001 **
D199.261199.2666.04<0.0001 **
E69.59169.5923.060.0003 **
G258.261258.2685.59<0.0001 **
DE4.9814.981.650.2214
DG3.9113.911.290.2757
EG7.3917.392.450.1415
D214.43114.434.780.0476 *
E22.0712.070.68570.4226
G230.69130.6910.170.0071 **
Residuals39.22133.02
Misfit24.4154.882.640.1073
Error14.8181.85
Total629.3222
Note: ** indicates an extremely significant effect (p < 0.01), and * indicates a significant effect (p < 0.05).
Table 12. Analysis of variance for CCD-optimized regression models.
Source of VarianceSum of SquaresDegrees of FreedomMean SquareF-Valuep-Value
Model571.765114.3533.77<0.0001 **
D199.261199.2658.84<0.0001 **
E69.59169.5920.550.0003 **
G258.261258.2676.26<0.0001 **
D214.36114.364.240.0551
G230.58130.589.030.0080 **
Residuals57.57173.39
Misfit42.7694.752.570.0996
Error14.8181.85
Total629.3222
Note: ** indicates an extremely significant effect (p < 0.01).
Disclaimer/Publisher’s Note: The statements, opinions and data contained in all publications are solely those of the individual author(s) and contributor(s) and not of MDPI and/or the editor(s). MDPI and/or the editor(s) disclaim responsibility for any injury to people or property resulting from any ideas, methods, instructions or products referred to in the content.

