Article

Applying a Novel Image Recognition Curve-Fitting Control Strategy Combined with a Cloud Monitoring Technique into an Electric Self-Driving Vehicle (ESDV) to Improve Its Operation Efficiency

1
Undergraduate Program of Vehicle and Energy Engineering, National Taiwan Normal University, Taipei 106, Taiwan
2
Department of Electrical Engineering, National Taiwan University of Science and Technology, Taipei 106, Taiwan
*
Author to whom correspondence should be addressed.
Processes 2023, 11(9), 2732; https://doi.org/10.3390/pr11092732
Submission received: 15 August 2023 / Revised: 10 September 2023 / Accepted: 11 September 2023 / Published: 13 September 2023
(This article belongs to the Section Energy Systems)

Abstract

:
This study aims to develop an image recognition curve-fitting (IRCF) control strategy integrated with a cloud monitoring technique for application in electric self-driving vehicles (ESDVs) to improve their operation efficiency. The study focuses on an electric vehicle designed to reduce the carbon emissions and promote sustainability. The main camera, combined with the IRCF control strategy, was used to control the ESDV to enhance its operational efficiency. The proposed ESDV employs a pair of cameras to capture images and transmit them to the cloud-based web monitoring platform in real time. This allows the researchers to adjust the control parameters and promptly remove the road obstacles. The ESDV is equipped with a horn, two ultrasonic sensors, and an LED display, which can instantly detect the obstacles ahead of and behind the vehicle. When there are obstacles on the road, the vehicle will automatically stop, and the LED display will provide a visual representation of the obstacles, accompanied by the sounding of the horn as a warning signal. Meanwhile, the secondary camera detects the signal mark and feeds it back to the LED display, thereby informing passengers and other road users about the prevailing driving conditions. The proposed IRCF control strategy was compared with the traditional Hough line detection method on a 110 m ring road. The results revealed that the proposed control strategy outperformed the traditional Hough line detection method in terms of speed, efficiency, and running dexterity. Therefore, integrating the proposed control strategy into the automatic assistance driving system can improve the ESDV’s operation efficiency. Furthermore, the combination of the obstacle detection and signal sign detection functions for the ESDV used in this study can better fulfill the actual ESDV operation requirements on the road.

1. Introduction

Automation technology has progressively advanced in the 21st century, profoundly improving the quality of people’s life and work. The automatic driver assistance system in vehicles is a hot topic in the contemporary automobile industry [1,2,3]. These systems offer the compelling advantages of reduced manpower, cost savings, and increased economic benefits. In addition, the development of electric vehicles has brought about substantial reductions in carbon emissions and an increased emphasis on environmental friendliness [4,5,6,7]. Small- and medium-sized computers and control boards are the indispensable key components of the automatic driver assistance system. The mini-computer and the control board receive the environmental data for calculations through different sensors, such as a camera, ultrasonic sensor, infrared, and LiDAR [8,9,10,11]. The computed results subsequently serve as navigational instructions for electric self-driving vehicles (ESDVs), ensuring safe and stable operation. If the ESDV detects obstacles or equipment failure, it will automatically stop the operations and promptly notify maintenance personnel to remove the road obstacles.
Figure 1 displays a schematic diagram of the components in the automatic driver assistance system for electric vehicles, encompassing the control, sensing, and input/output devices. The system includes sensors (camera, ultrasonic sensor), a personal computer, a miniature computer (Jetson Nano Kit), a control board (AT-Mega 1284p module), input devices (keyboard, joystick, and I/O modules), and output devices (DC motor, servo motor, LED display, and horn). The sensor transmits information to the miniature computer for calculation, while the miniature computer sends instructions to the control board. The control board governs various output devices that help the ESDV run on the right path. Additionally, the LED display and horn sounds in the output device inform other road users about the prevailing driving conditions through vision and sound, thus fostering a safer driving environment and reducing the likelihood of vehicular accidents.
In recent years, numerous scholars and technicians have developed automatic driver assistance systems for vehicles. Zhang et al. introduced an image processing technology for the open-source computer vision library (Open CV). They collected lane data using a camera, extracted crucial features, and monitored traffic signal signs and other variables to control ESDVs to ensure their correct and stable operation on roadways [12]. Das et al. proposed a camera-based road detection and developed an ESDV lane change safety trajectory and acceleration and deceleration control, thus humanizing ESDVs’ road behavior [13]. Saranya et al. used a camera to capture the front lane of the vehicle and the surrounding objects, subsequently deploying a convolutional neural network (CNN) for deep learning to obtain the most suitable ESDV driving trajectory in strong light, as well as in dark and wet environments, and ensuring obstacle alerts for enhanced safety [14]. Afor et al. explored the use of Open CV to perform image recognition processing combined with the Firebase database to allow vehicle computers to issue control commands through image processing and data analysis. This way, self-driving vehicles can run stably and arrive at their destination safely, thus promoting stable and secure autonomous driving [15]. Chaitra et al. introduced the integration of deep learning technology (such as CNN and the Hough transform algorithm) with Open CV in self-driving vehicles and sensors to detect lanes, lane objects, and traffic signals. The results revealed that the automatic driver assistance system controls the stability and safety of ESDVs [16]. Chen introduced a cruise control and lane change control technology for self-driving vehicles, focusing on vehicle steering control, acceleration, and deceleration control based on PID, which rapidly converges control signals to ensure the stability of ESDVs [17]. Kannapiran et al. discussed the multifaceted use of LiDAR, a camera, an ultrasonic sensor, and various sensory inputs to track lanes and lane objects. Real-time data transmission to control terminals through vision and deep learning algorithms facilitated the issuance of precise control commands that enable the vehicle to reliably and safely arrive at its destination [18]. Sai et al. explored the use of CNN combined with Open CV and the You Only Look Once (YOLO) algorithm to detect moving objects in the lane so that self-driving vehicles can clearly master environmental conditions, enabling stable and secure lane navigation [19]. Yogitha et al. introduced the use of CNN and the sparse structure learning algorithm (SSLA) to analyze the images detected by self-driving vehicle sensors. The proposed algorithm could accurately identify fuzzy, dark, and sharp objects, helping self-driving vehicles identify the real environment and drive safely to their destination [20]. Nguyen et al. proposed a self-driving vehicle with lane tracking and a GPS navigation system, where the camera can identify the lane and the moving objects. The GPS navigation system can position the ESDV and correctly drive it to the destination, thus, improving the reliability and safety of the ESDV [21].
This study introduces the automatic driver assistance system for ESDV, characterized by a main camera for lane tracking and the novel image recognition curve-fitting (IRCF) control strategy, ensuring the ESDV drives steadily in the lane. Meanwhile, the secondary camera identifies the lane markings, while the ultrasonic sensor detects obstacles ahead of and behind the ESDV to avoid a collision. The combination of the LED display and the horn can convey the real-time operational status to the road users through vision and sound (if there is an obstacle, the lane is marked with a signal), making the driving environment more friendly and reducing vehicle accidents. The ESDV has a real-time monitoring technology that sends images to the cloud, allowing the researchers to control and view the vehicle’s driving status to facilitate control parameter adjustment and maintenance, and improve the system’s stability.

2. Overview of Electric Self-Driving Vehicle System

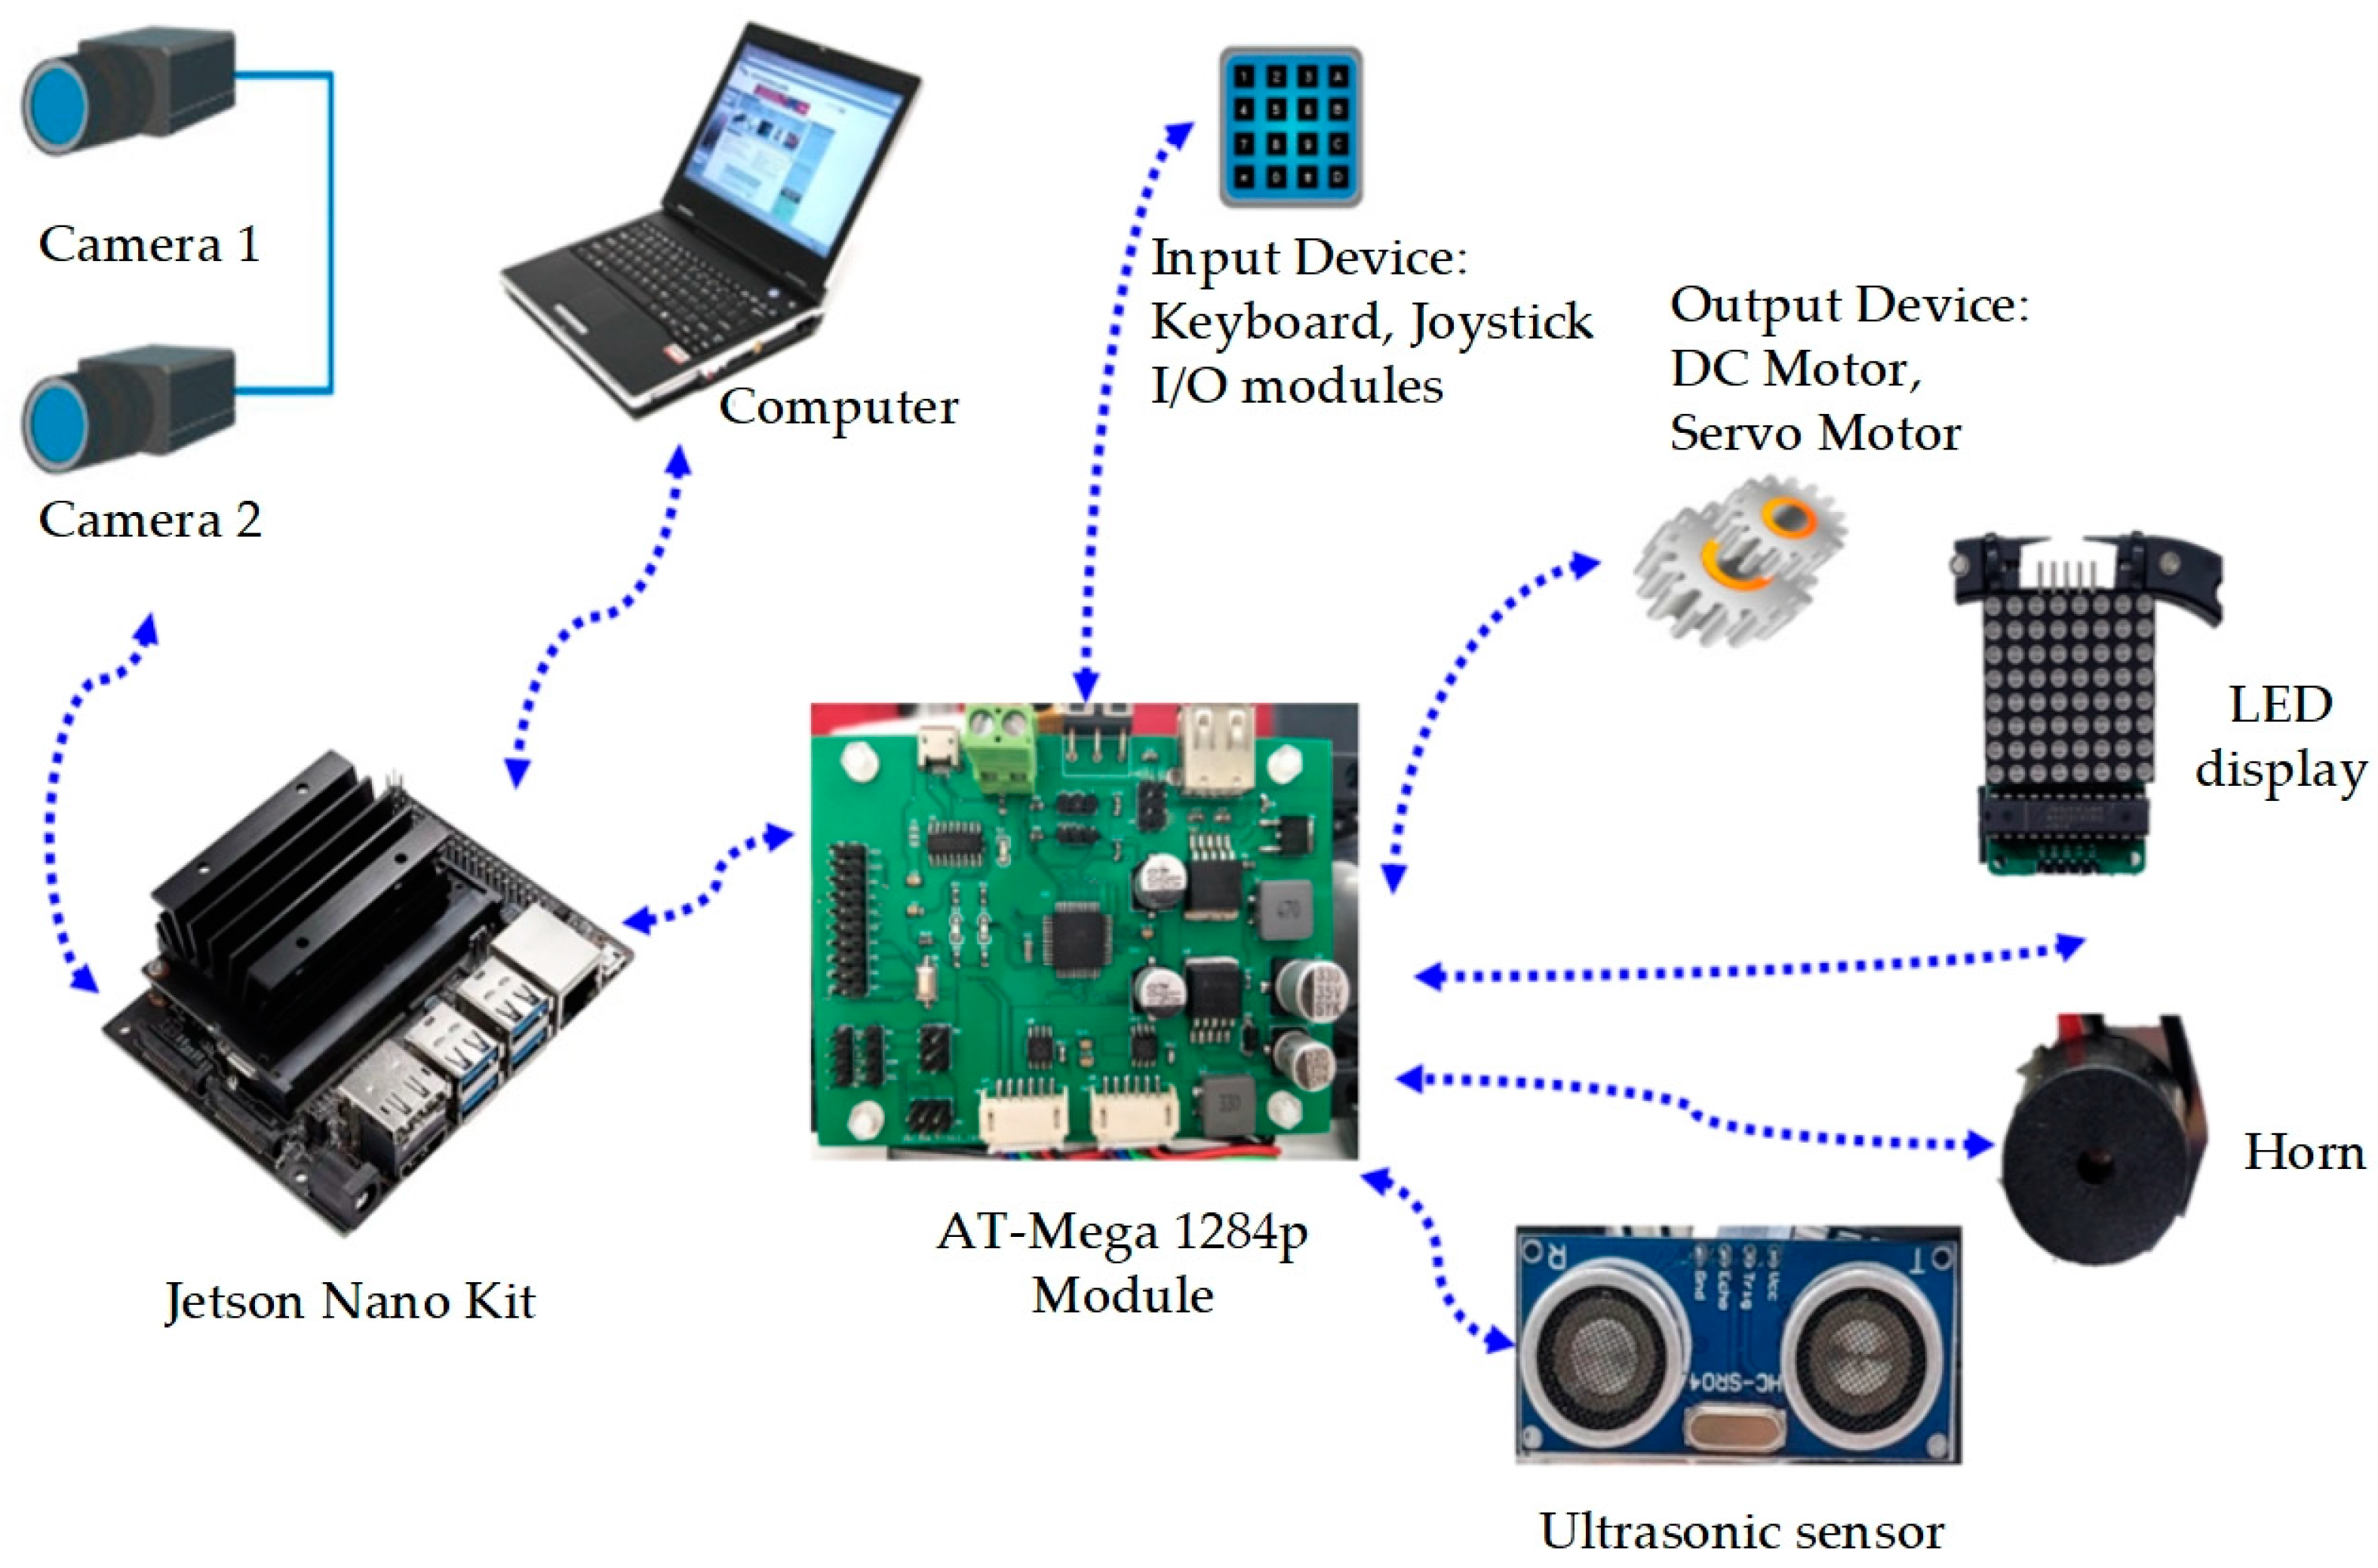
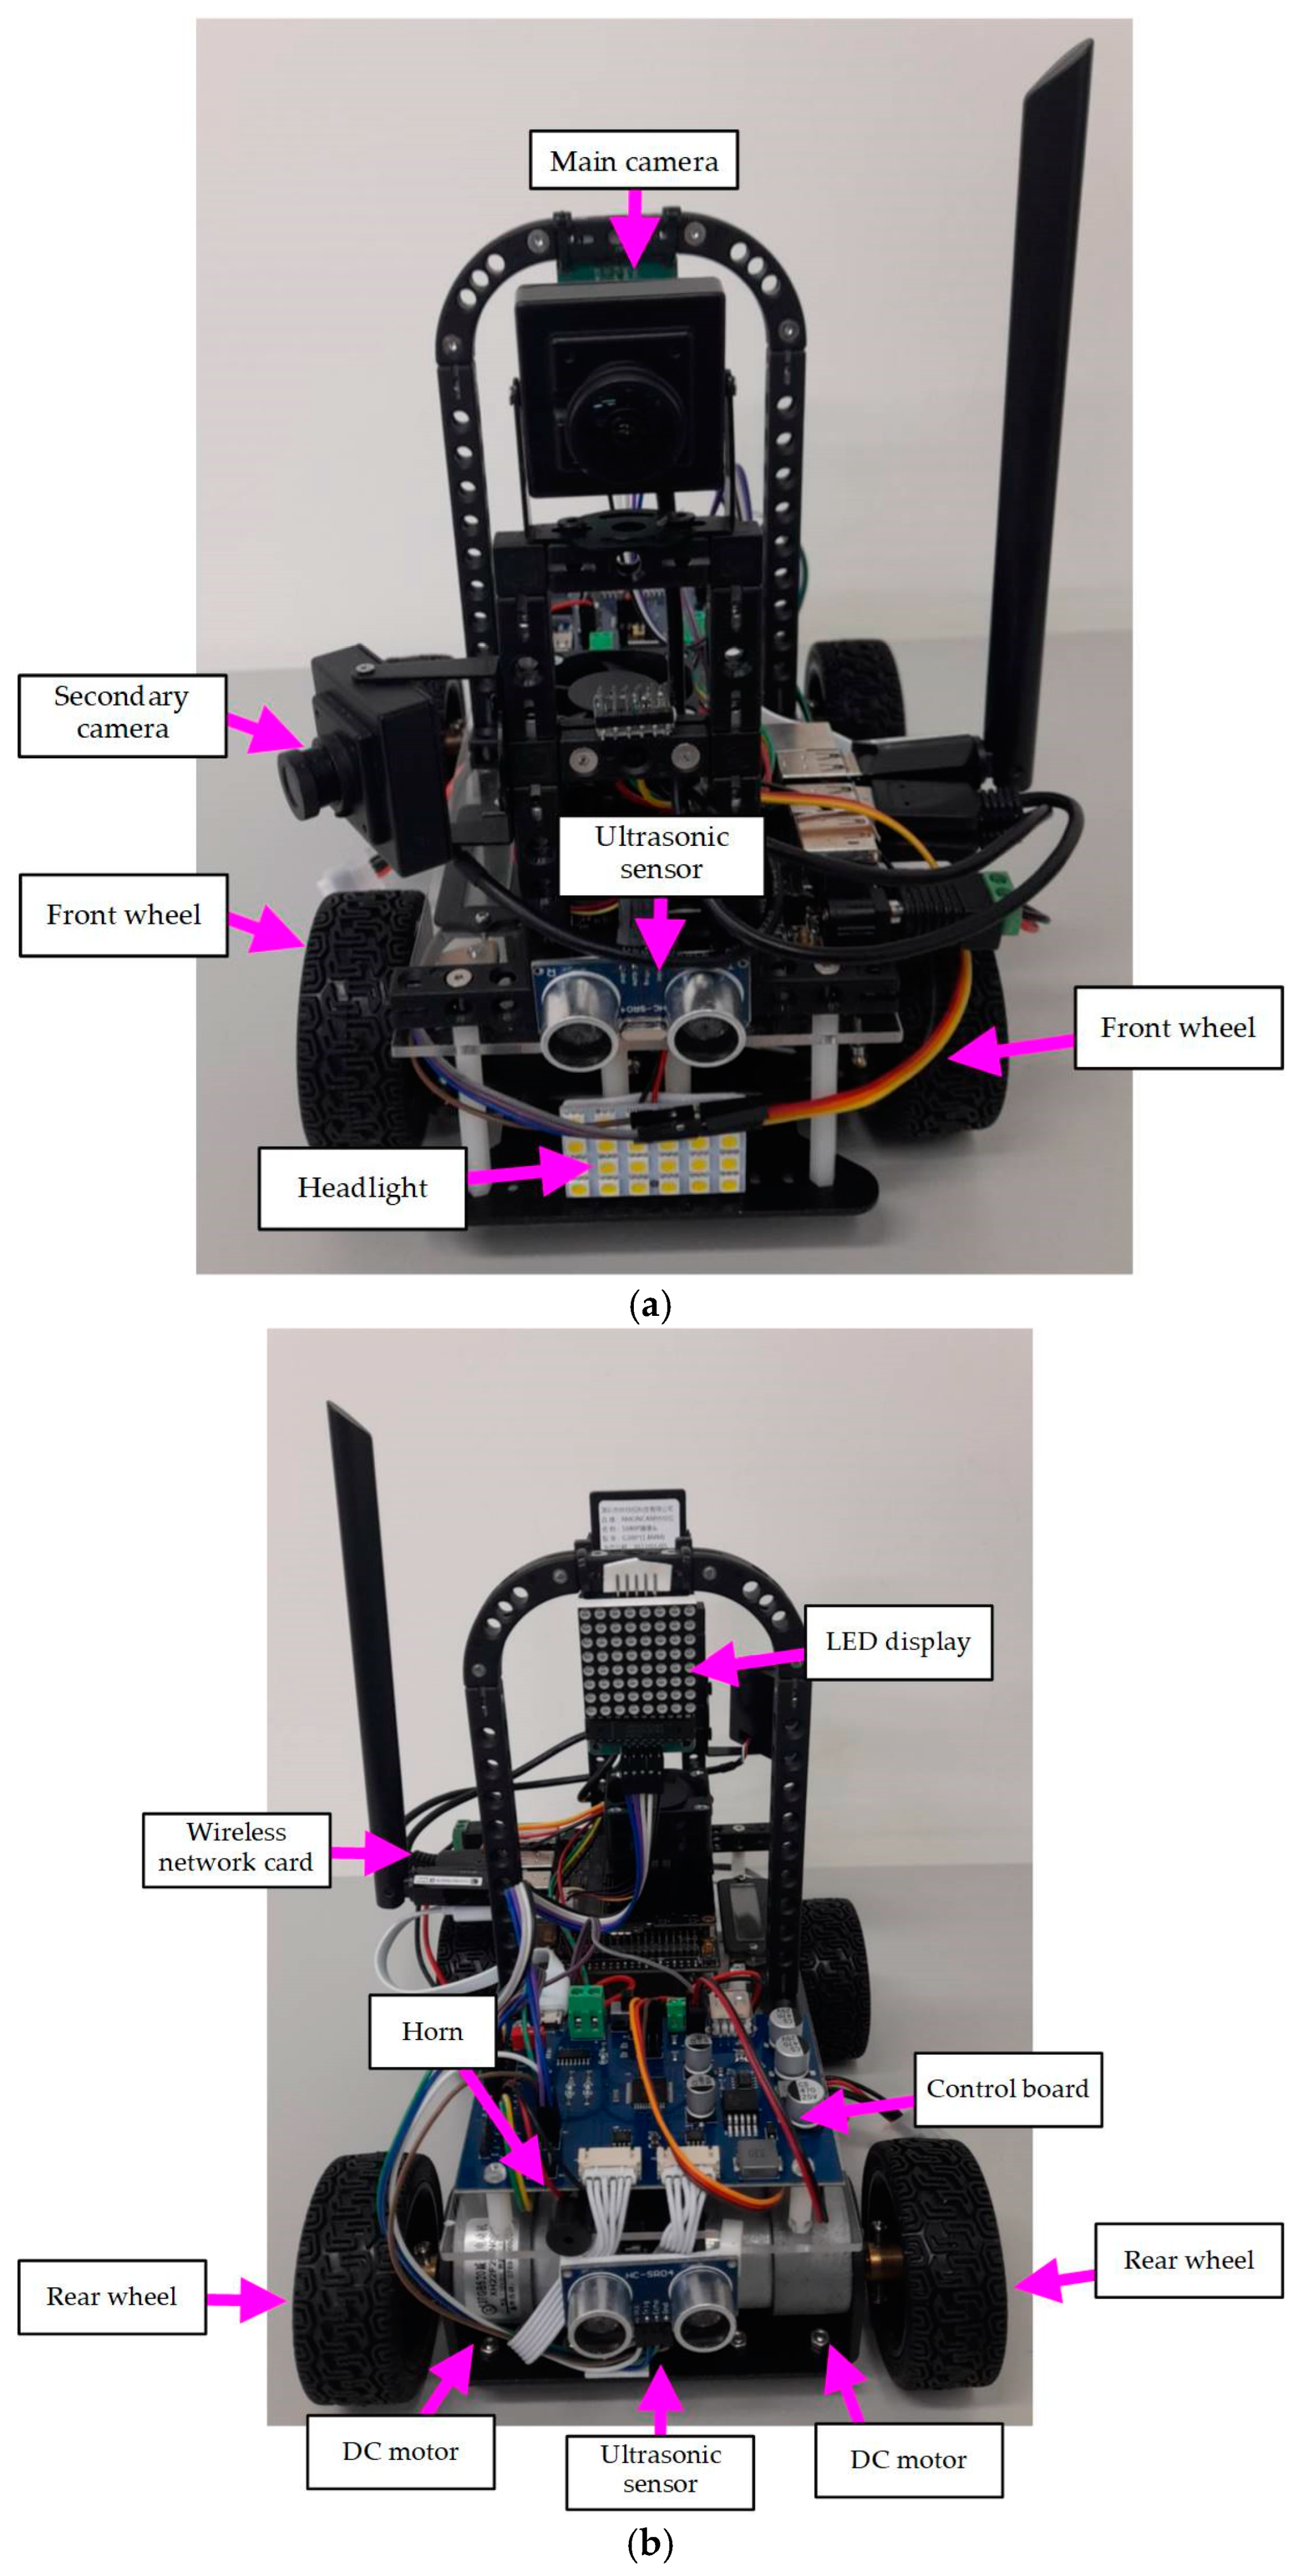
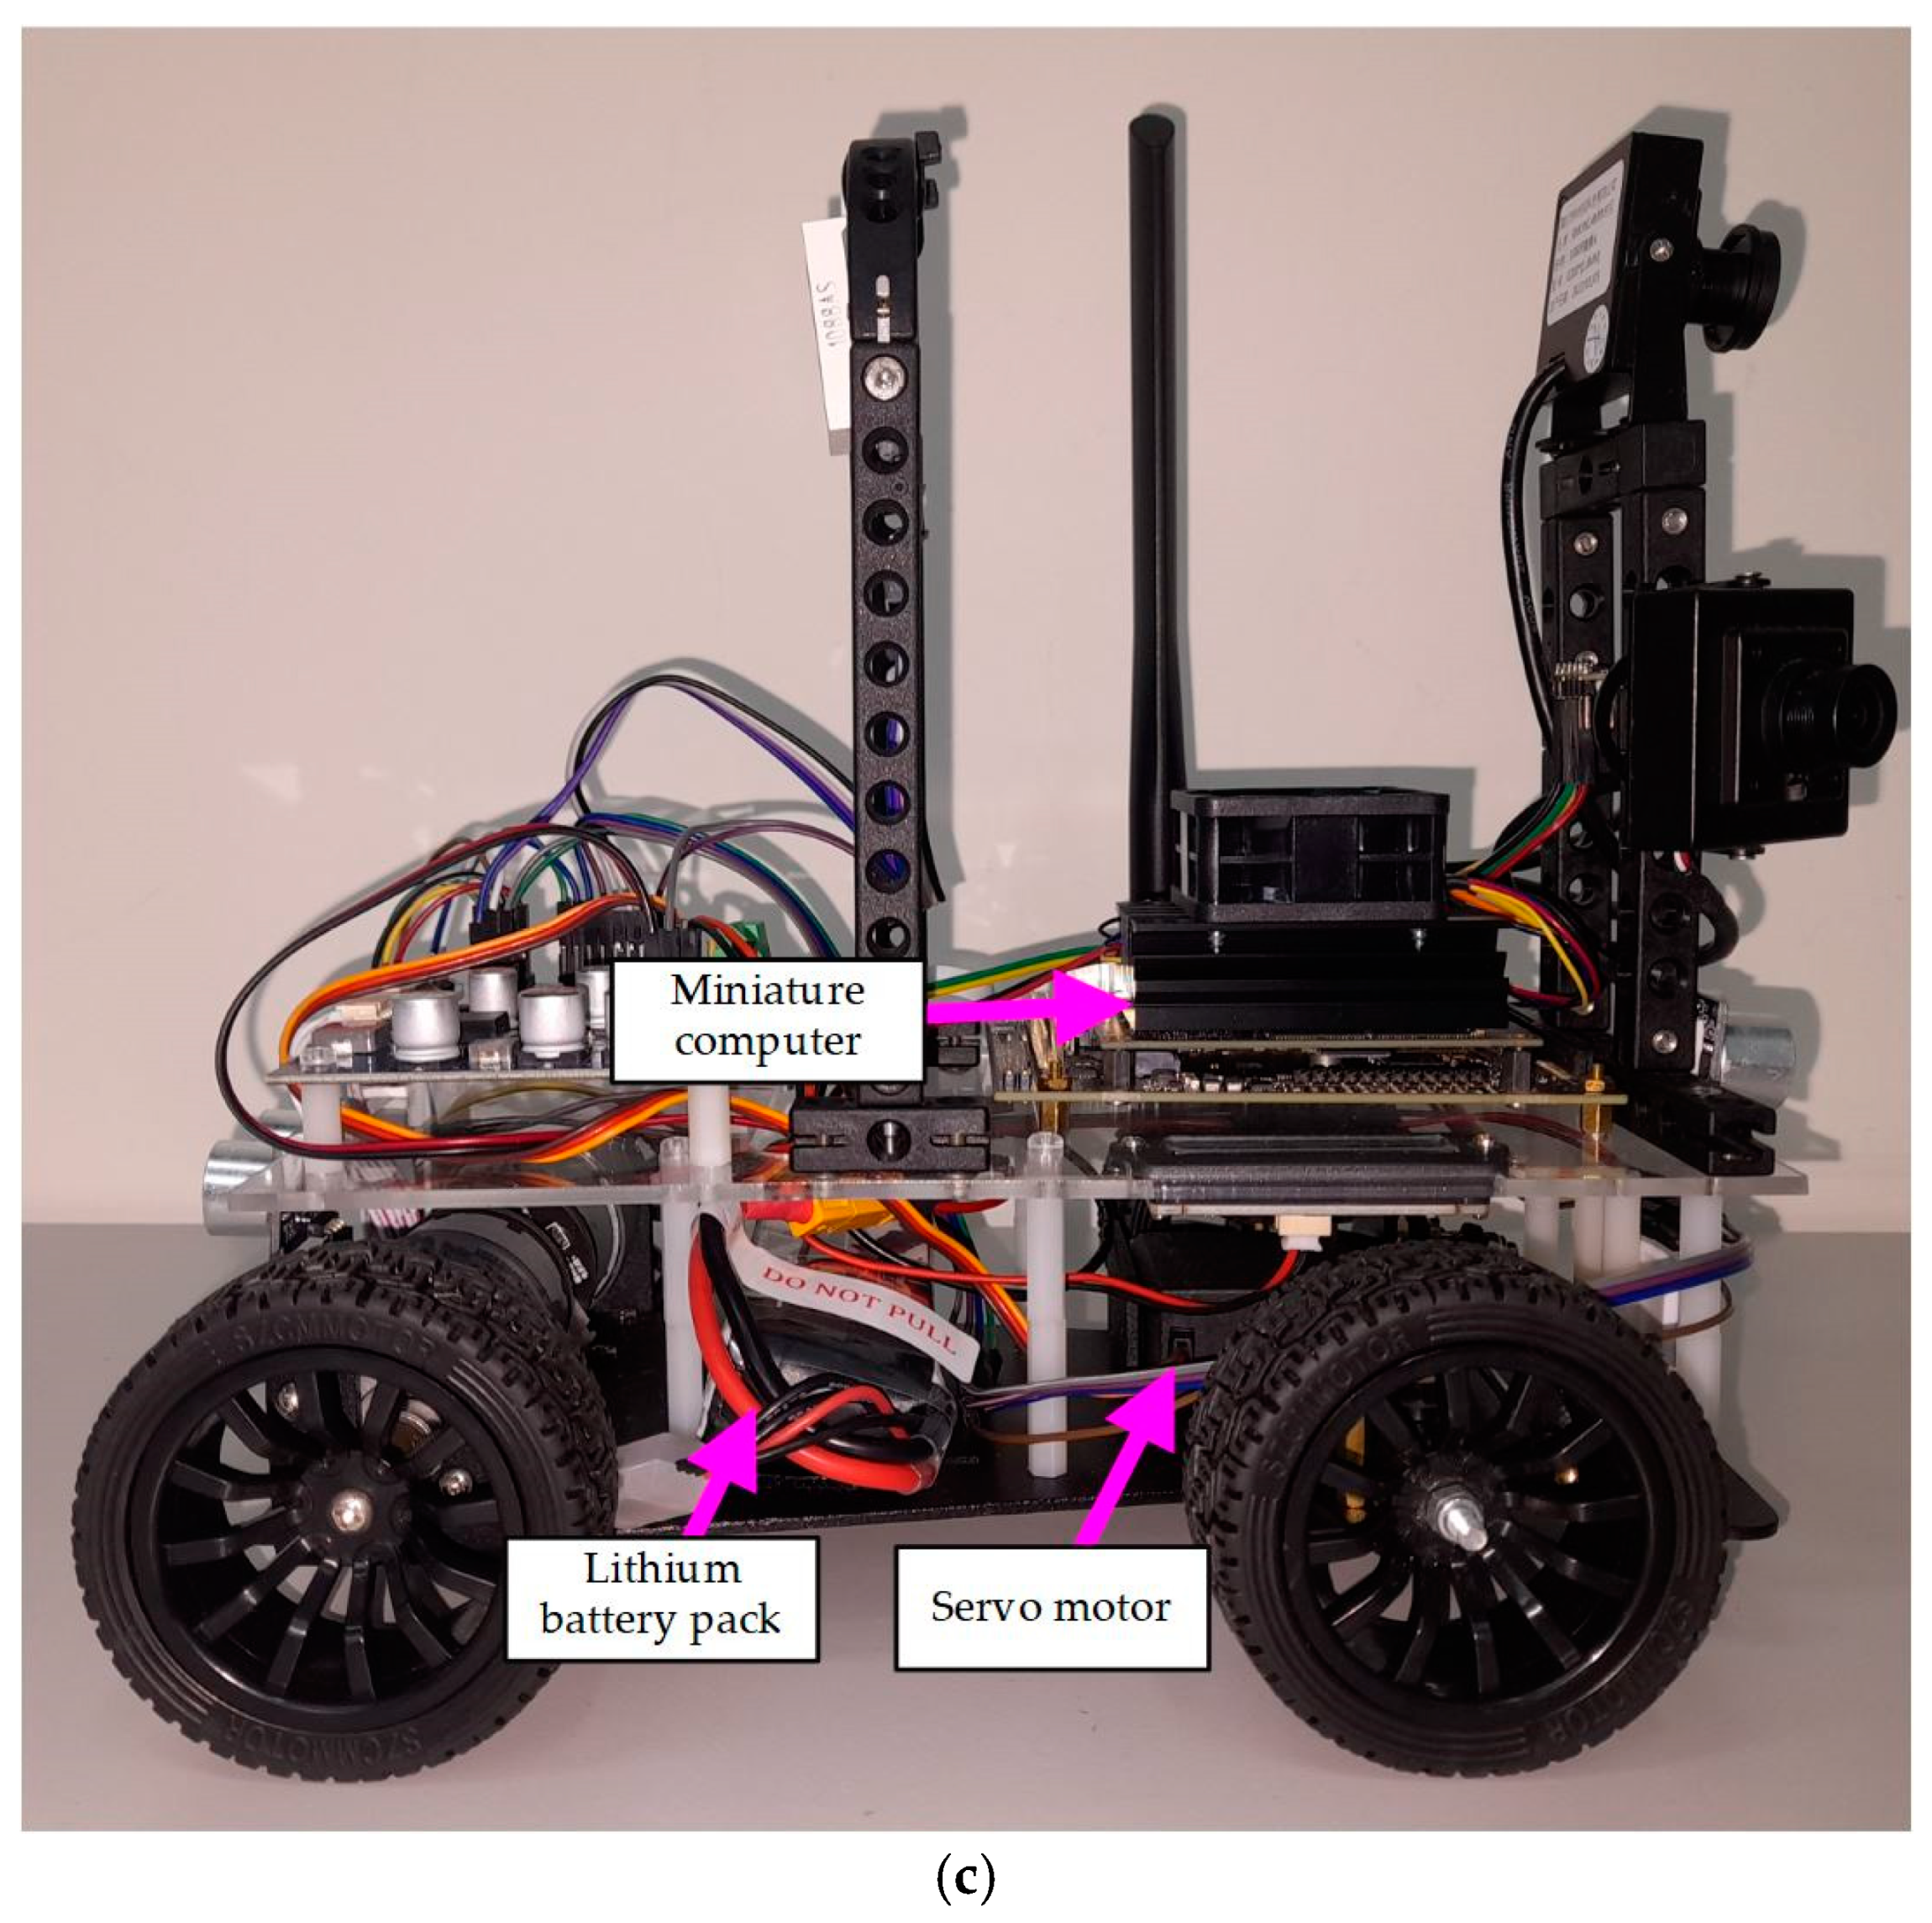
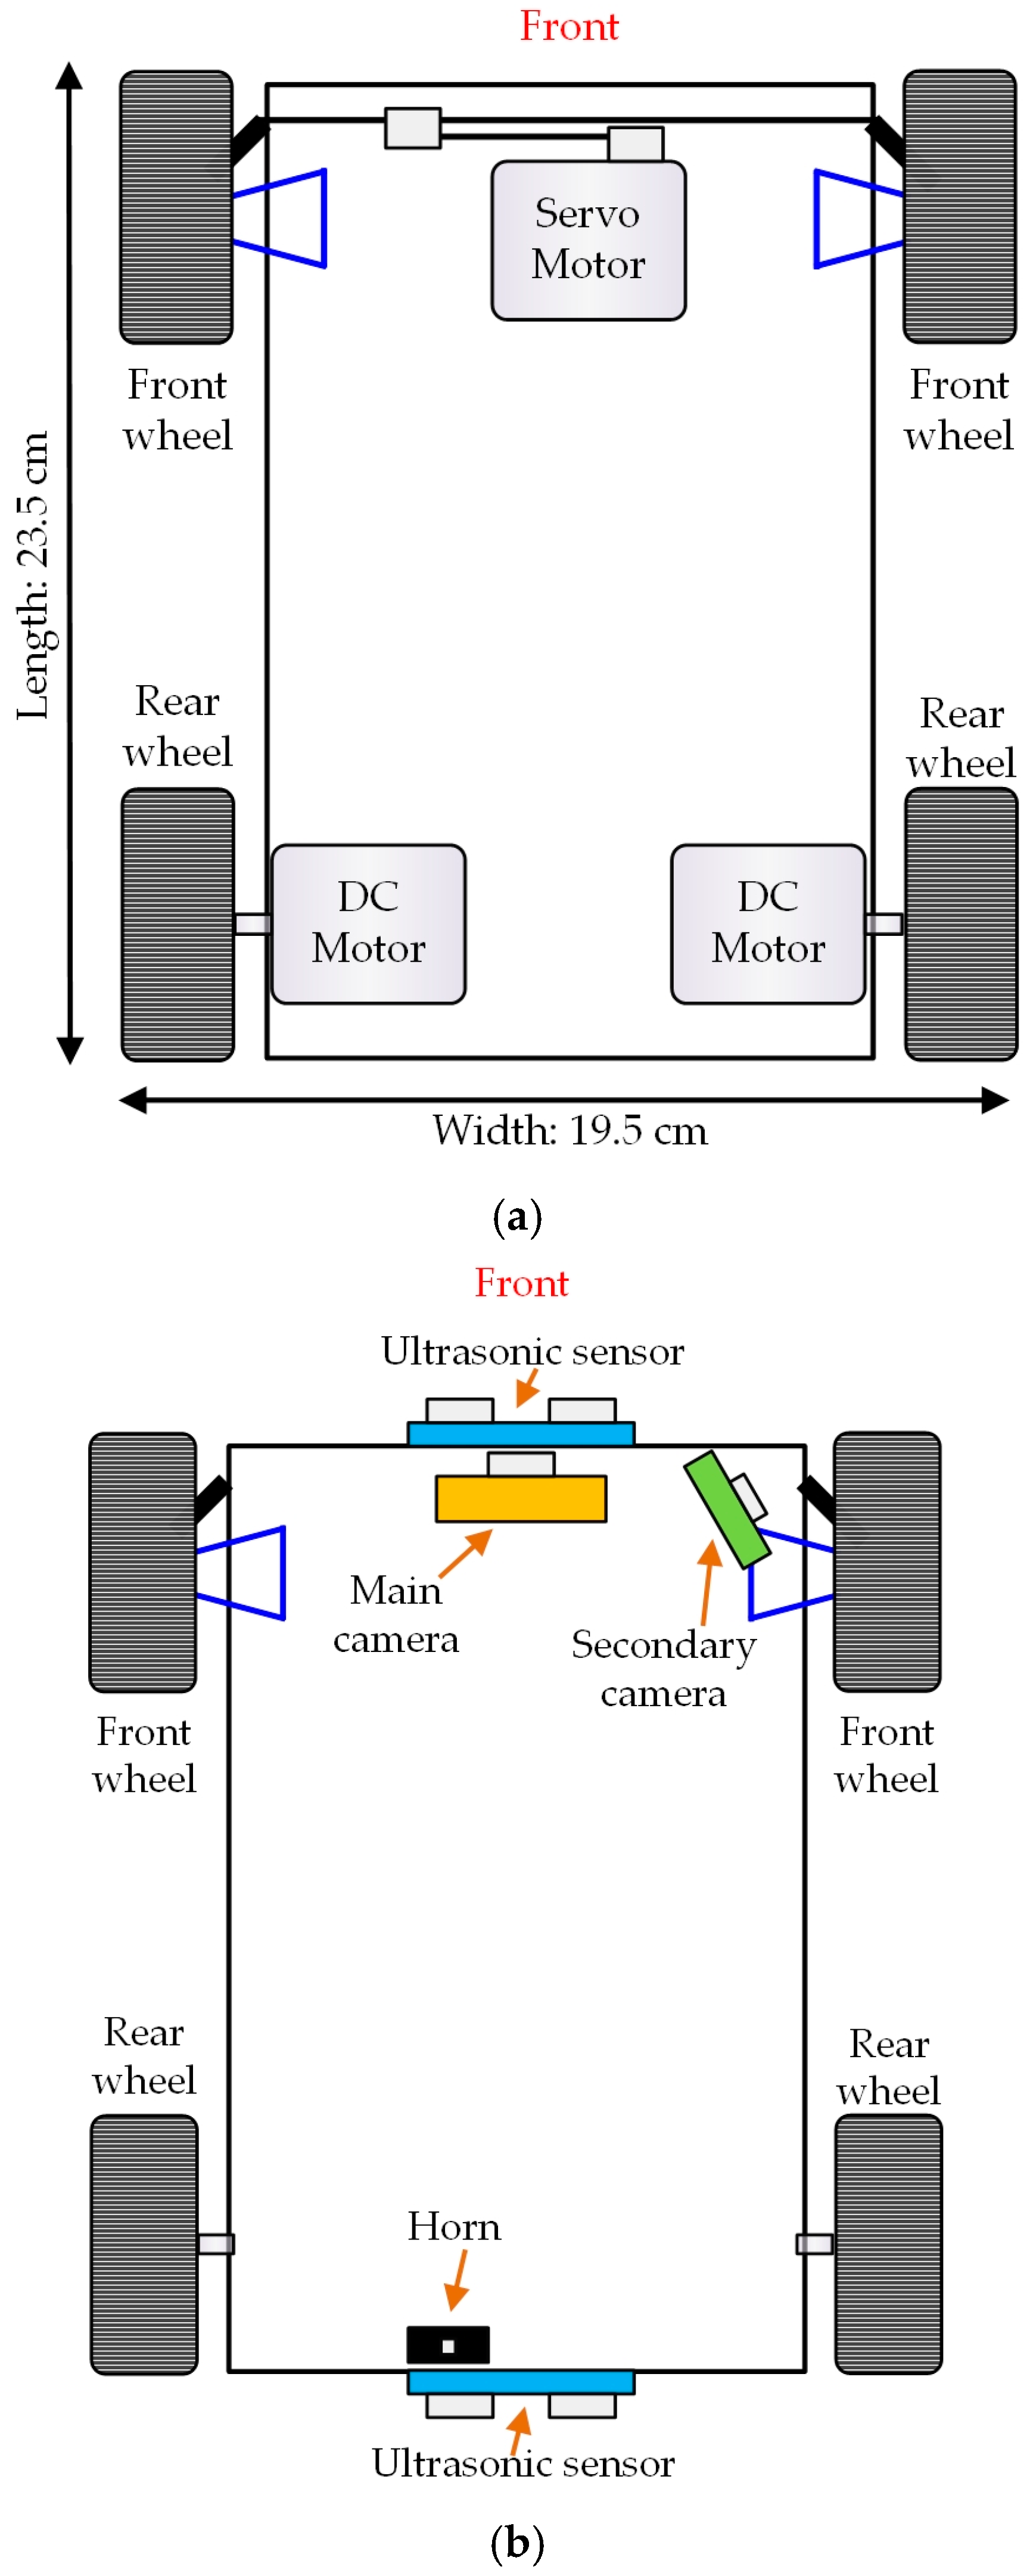
2.1. The Electric Self-Driving Vehicle Architecture and Component Description

Figure 2 shows a physical representation of the ESDV, and Figure 2a–c present the front view, rear view, and side view of the ESDV, respectively. The ESDV is an assembly of diverse components, including a headlight, two front wheels, two rear wheels, two DC motors, one servo motor, a miniature computer, a control board, and a lithium battery pack. Additionally, the automatic driver assistance system and visualization-related components include a main camera, a secondary camera, a wireless network card, two ultrasonic sensors, a LED display, a horn, and others. Specific details of these components are mentioned in Table 1.
Figure 3 displays the position of the ESDV’s components. Figure 3a shows a servo motor pulling the lateral guide rods of the two front wheels. The application of the proposed IRCF control strategy empowers the servo motor to execute precise turns and allow for steering angles of up to 45 degrees. A servo motor steers the ESDV’s two front wheels, and two DC motors drive the two rear wheels. The four wheels used here are anti-skid tires. Therefore, there will generally be no slippage problem in ambient operation and no significant wheel speed difference. The proposed IRCF control strategy ensures stable operation through these three motors. Figure 3b shows the position of a main camera, a secondary camera, two ultrasonic sensors, and a horn. In this study, the ESDV uses the main camera for road image recognition and controlling the vehicle to run in the lane, and the secondary camera for lane side marking recognition. The two ultrasonic sensors judge whether there are obstacles in the front and rear. When there are obstacles, the horn will emit a warning sound.
In this study, the image sensed by the main camera was sent to the miniature computer, where the intricate calculations are facilitated by the proposed IRCF control strategy to identify the lane and ensure the stability and safety of the ESDV during its journey. In addition, the road signs can be identified through the secondary camera and then displayed in the LED display so that the passengers or fellow road users will be familiar with the road condition. The wireless network connection of the ESDV used in this study allows sending images to the cloud computer for real-time monitoring, allowing the researchers to control and check the vehicle status, adjust the control parameters and maintenance, and improve the system’s stability.

2.2. Image Recognition System Description

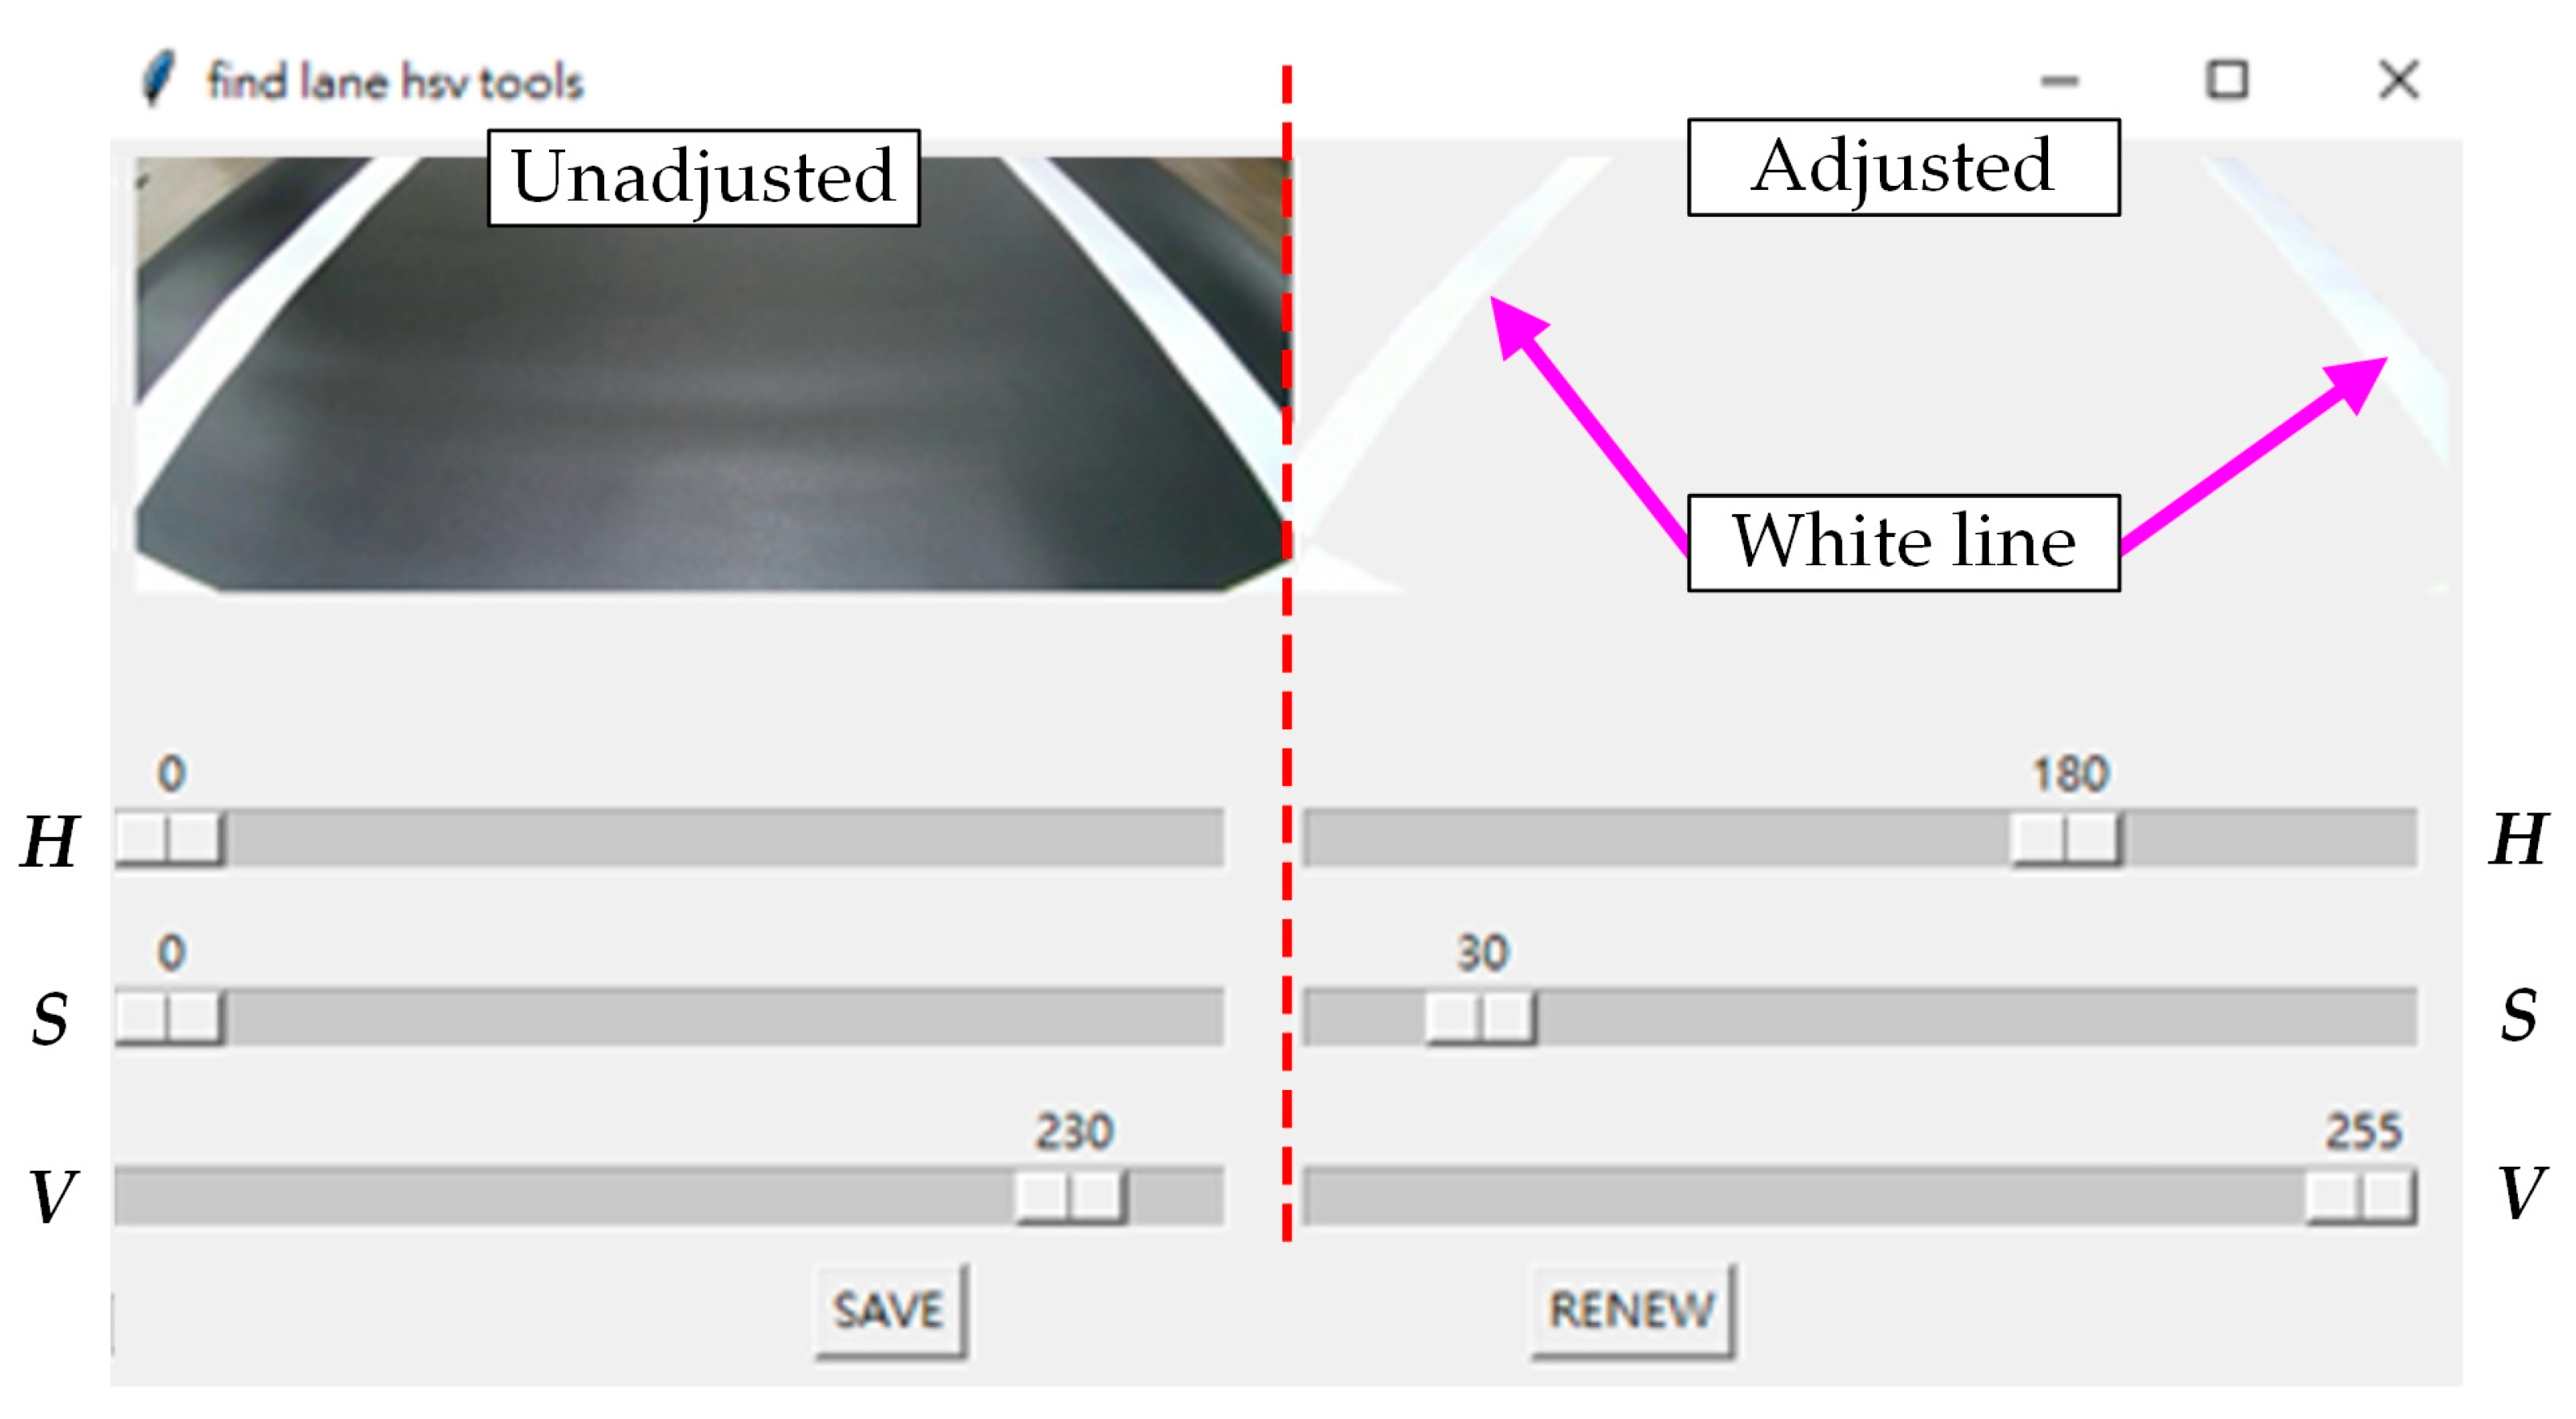
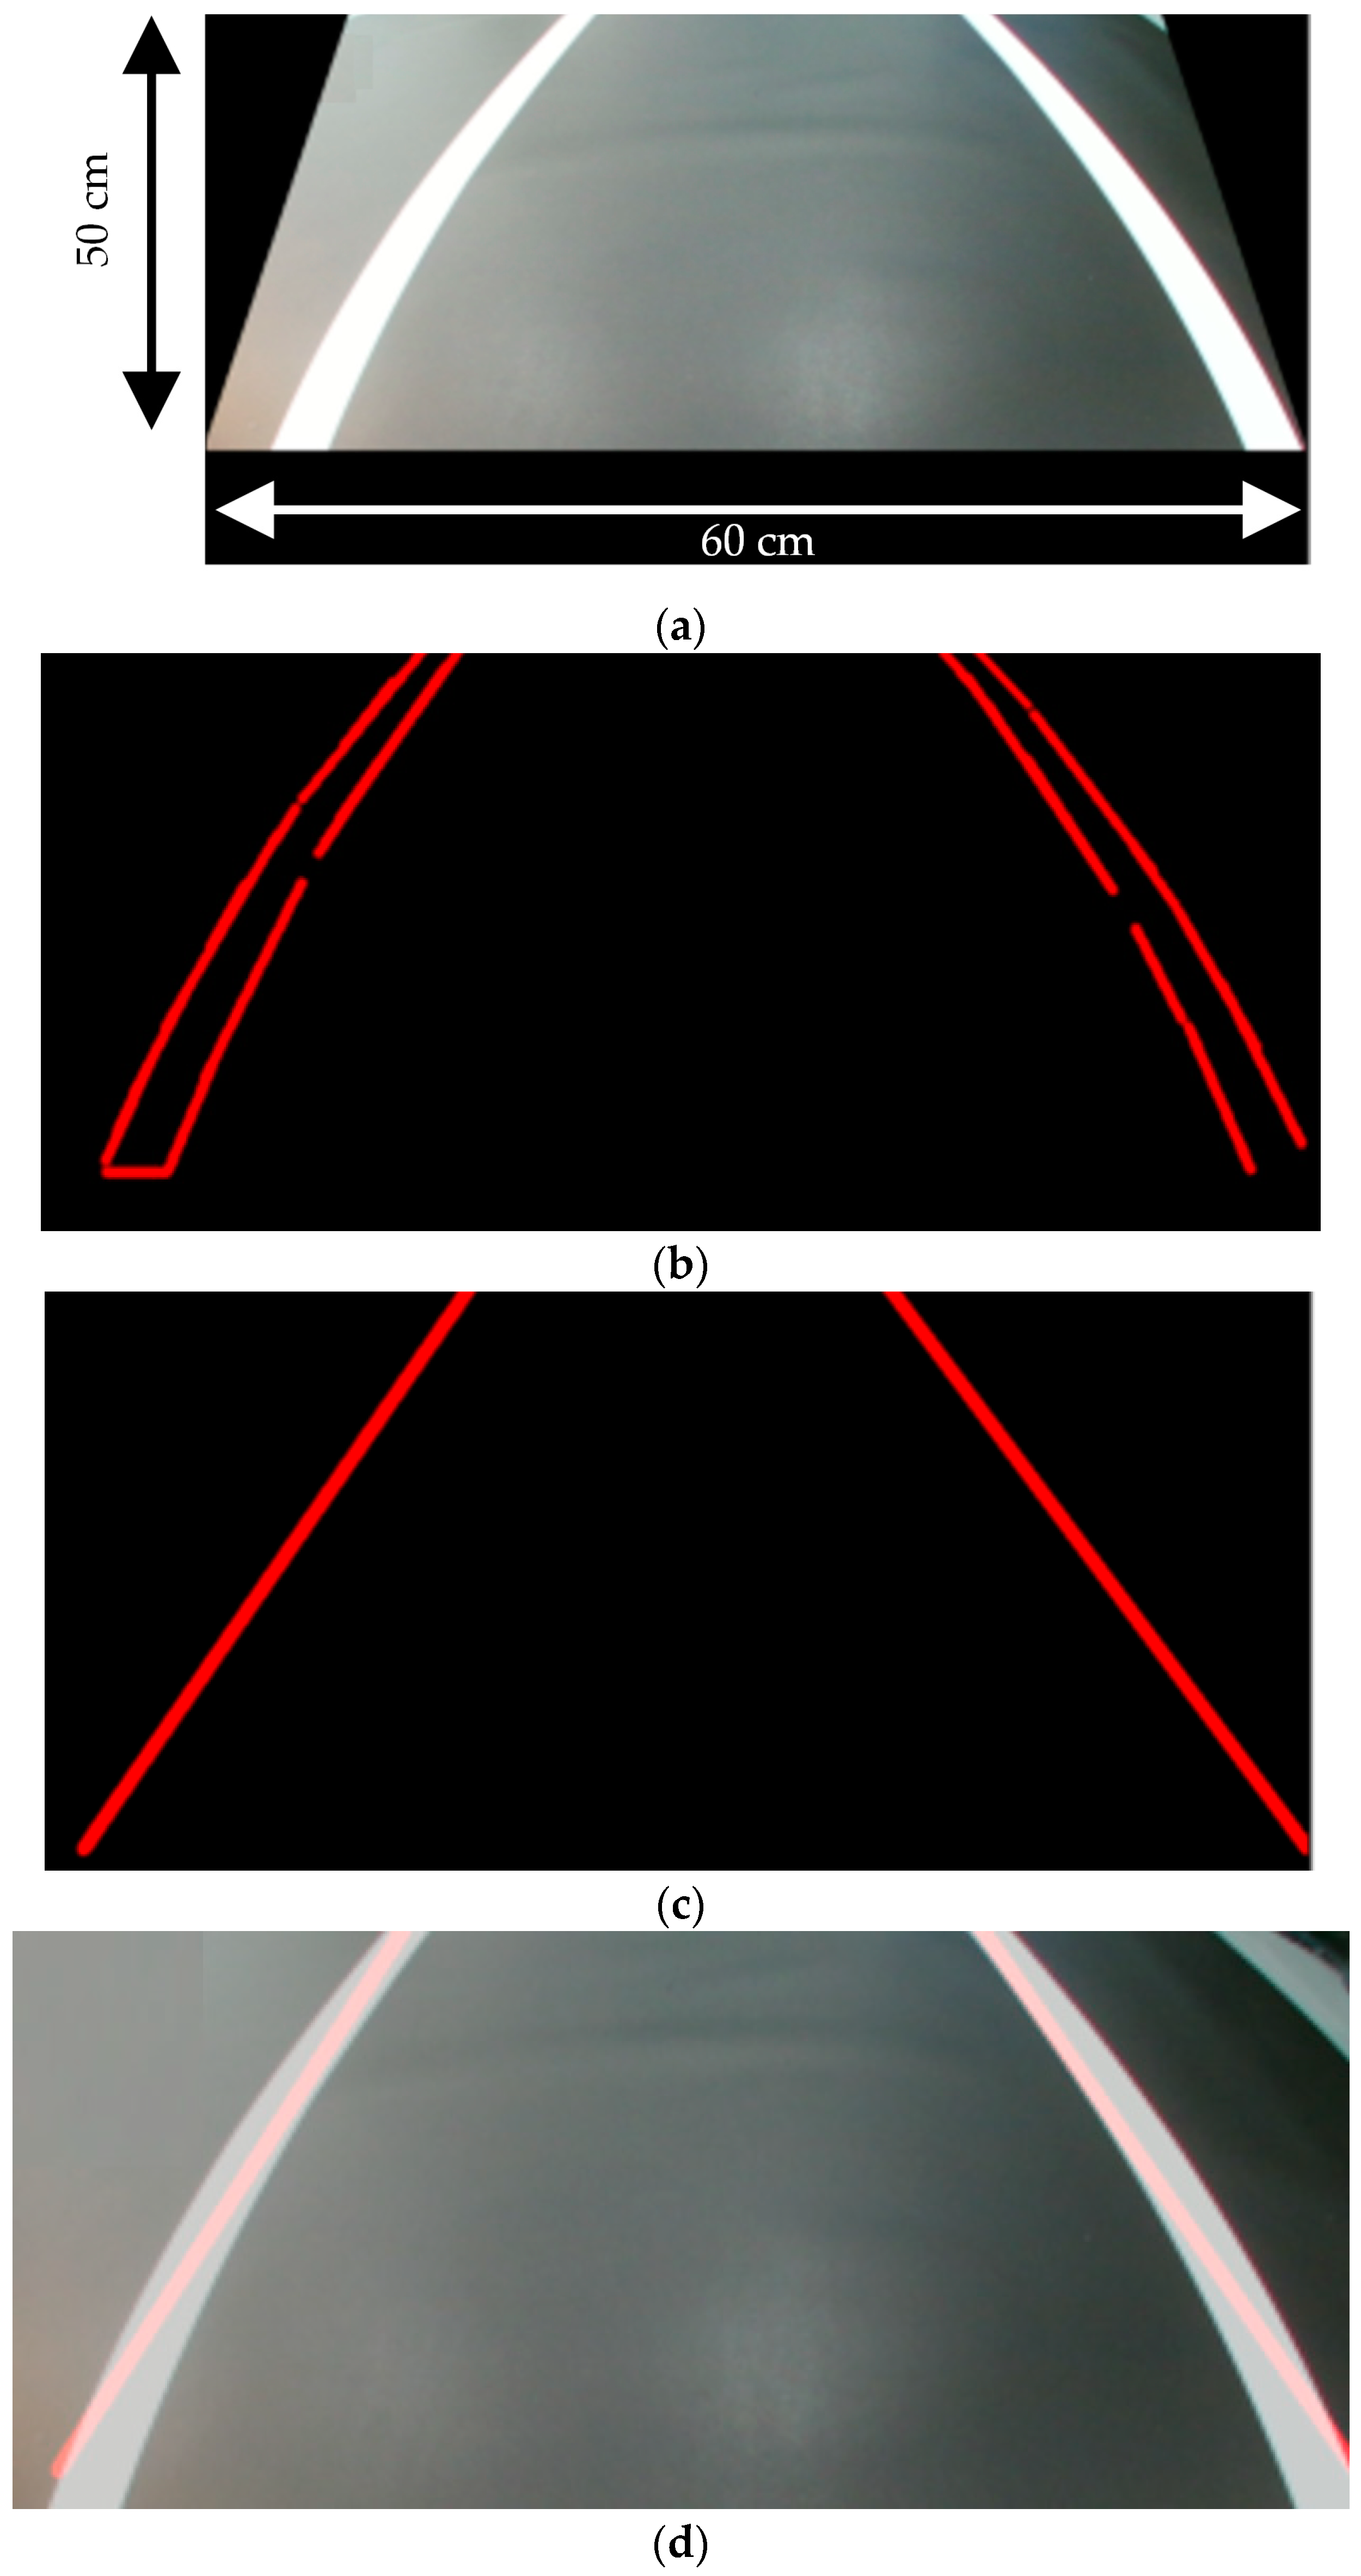
2.2.1. Image Adjustment and Lane Identification

The images captured by the main camera can be obtained via a personal computer connected wirelessly to an ESDV miniature computer and facilitate the real-time adjustments. This study utilized hue, saturation, and value (HSV) techniques for color adjustment. Figure 4 shows the HSV color adjustment window, where the values of H and S are 0 and the value of V is 230 for unadjusted colors. After the researcher performed the color adjustment, the values of H, S, and V became 180, 30, and 255, respectively. This adjustment enhances the image clarity, particularly highlighting two white lines representing lane boundaries, while the other images are all gray. The white lane boundary is calculated in the miniature computer through image processing technology, allowing the ESDV to run in the lane. Therefore, the miniature computer will issue control commands to the control board. Then, the control board will release control signals to control the two DC motors and the servo motor so that the ESDV can run stably in the lane.
Traditional lane boundary calculation uses Hough line detection [22,23,24], wherein changing white lane configurations lead to fluctuating slope values, enabling the ESDV to discern between straight paths and curves. Thus, the self-driving vehicle can operate stably in the lane. In contrast, the proposed IRCF control strategy simplifies lane identification, offering cost-effectiveness, ease of implementation, and efficiency.

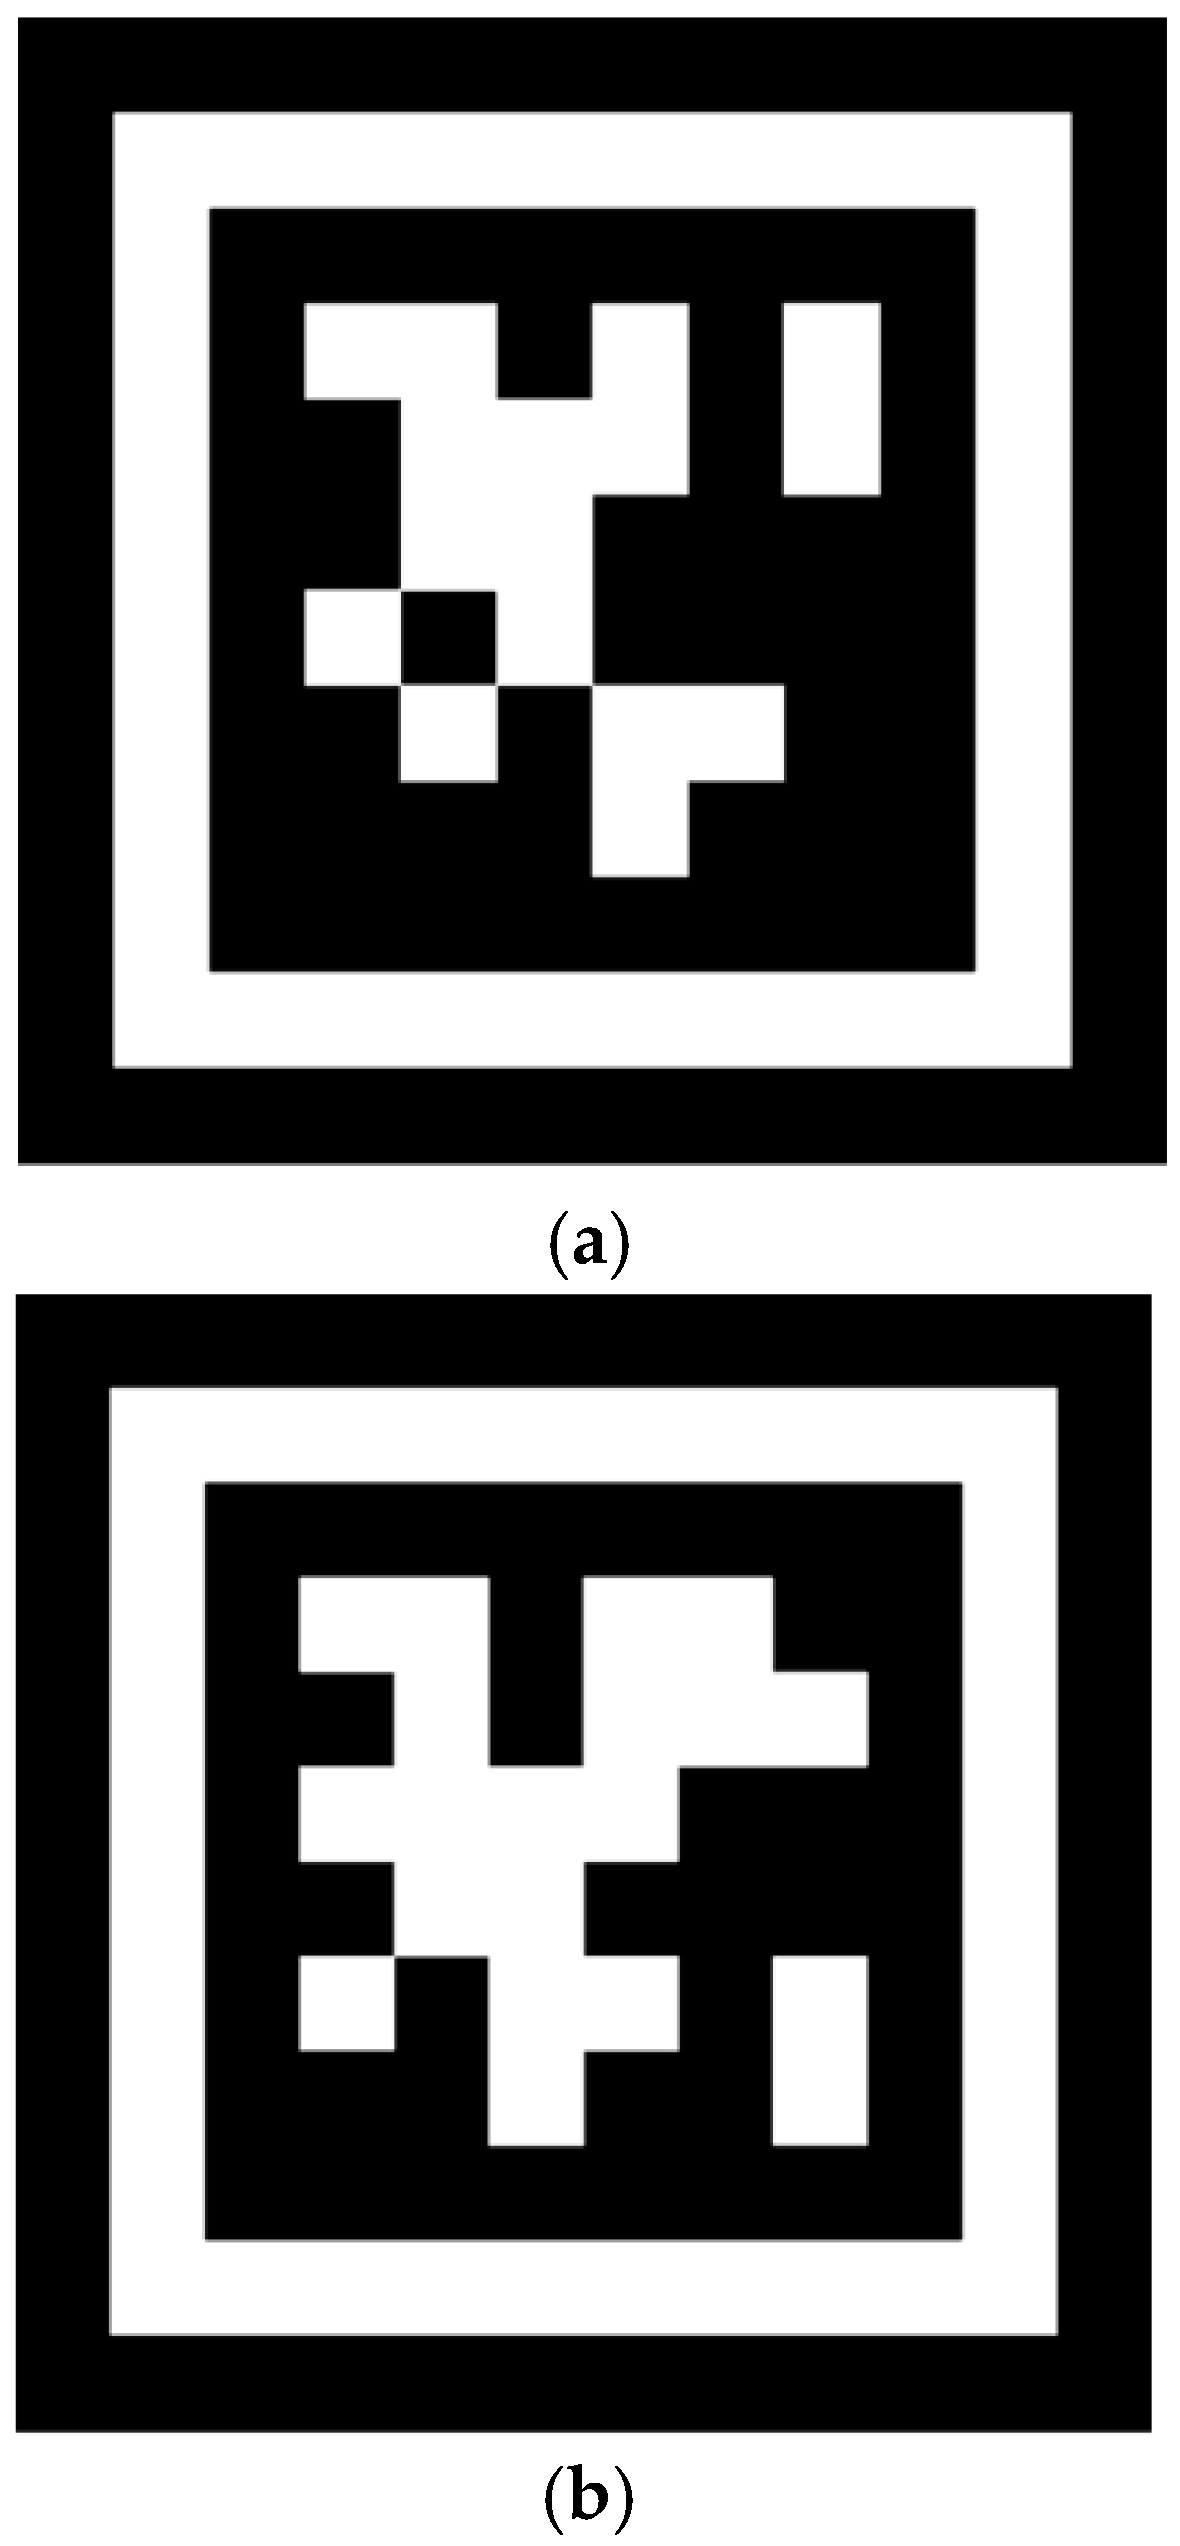
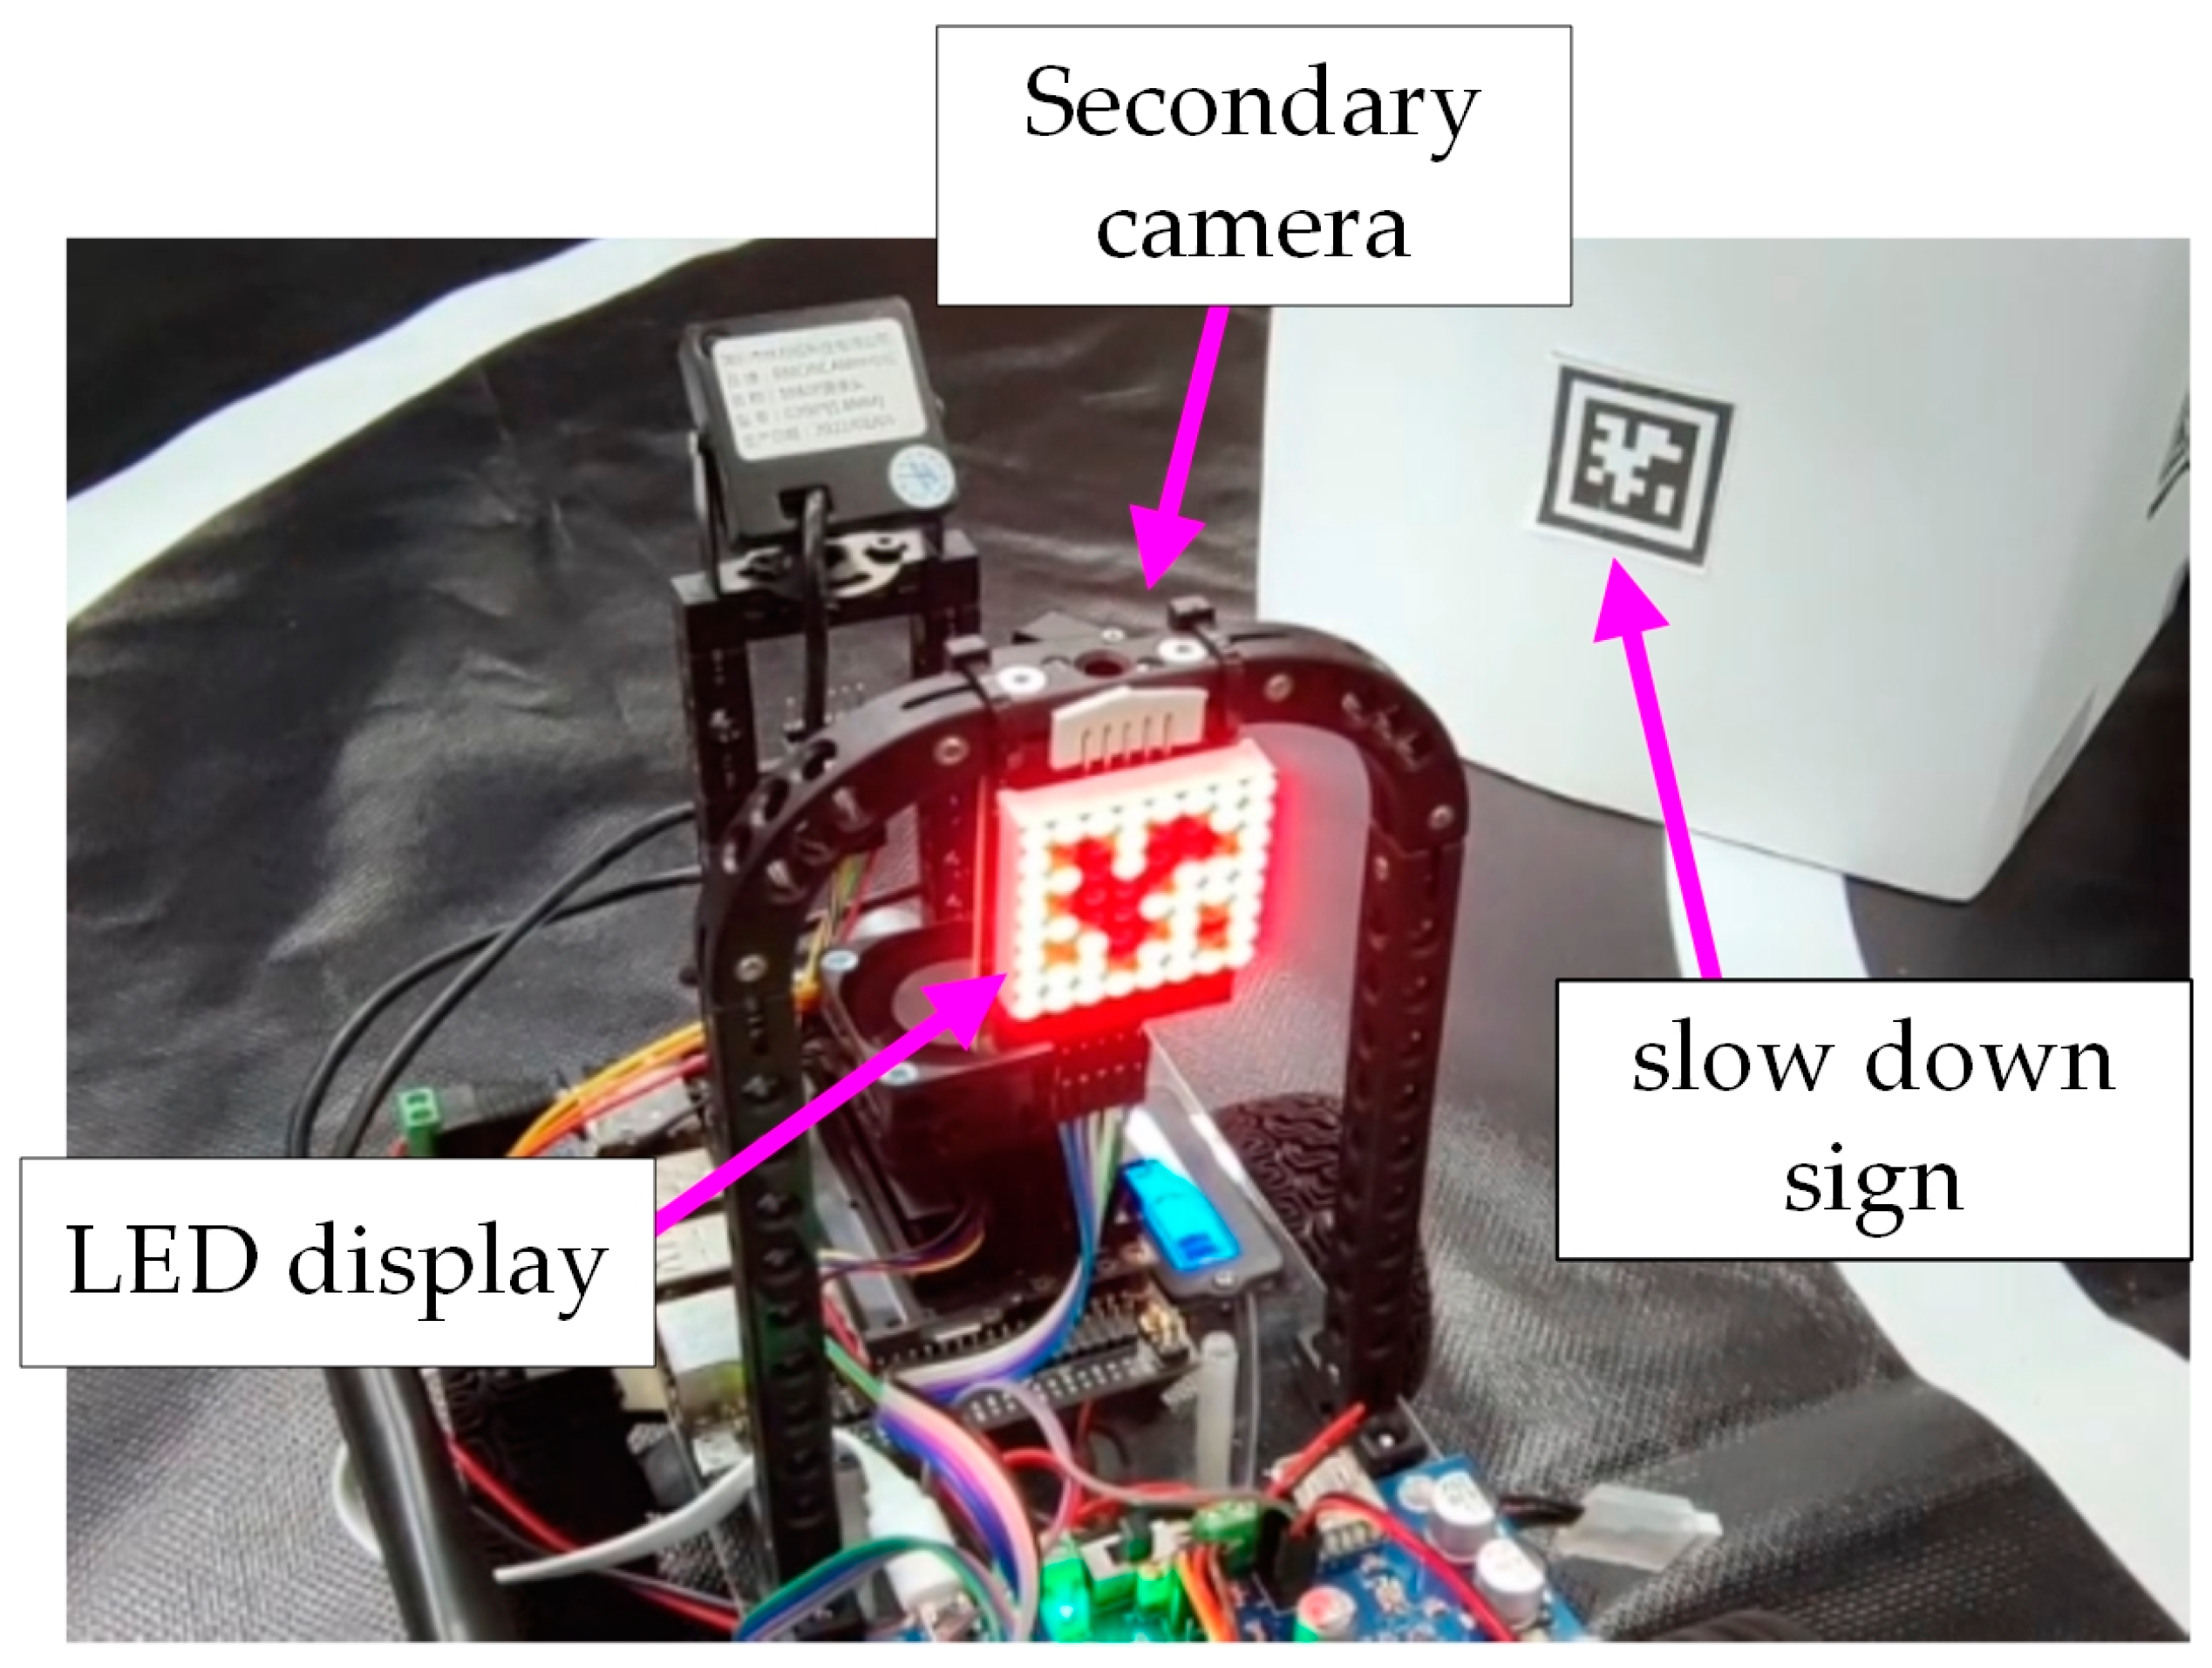
2.2.2. Sign Mark Recognition

Figure 5 shows the sign marks observed in this study. Figure 5a indicates the fenced railway level crossing, while Figure 5b indicates the slowdown. In this study, the ESDV uses the secondary camera to identify the sign marks on the road (as shown in Figure 5) and then transmits the captured image data to the miniature computer for analysis before further transmitting it to the control board. Lastly, the control board shows the information to the LED display, allowing the driver or road users to know the real-time condition of the self-driving vehicle on the road. Figure 6 visually demonstrates the LED display’s response upon detecting a slowdown sign. It is the slowdown sign shown in the LED display after the secondary camera detected the slowdown sign.

2.3. Alarm System Description

The ESDV used in this study was equipped with a horn, two ultrasonic sensors, and a LED display. When the ultrasonic sensors detect an obstacle ahead or behind, the horn makes an alarm sound. Simultaneously, the LED display will show that there are obstacles ahead or behind. Figure 7 shows the physical diagram of the ESDV while encountering obstacles. Figure 7a depicts an upward arrow on the LED display when obstacles are detected ahead, and Figure 7b shows a downward arrow when obstacles are detected behind. Therefore, the LED display and the horn sound can inform the drivers or road users that the ESDV has encountered an obstacle and shows them the obstacle location.

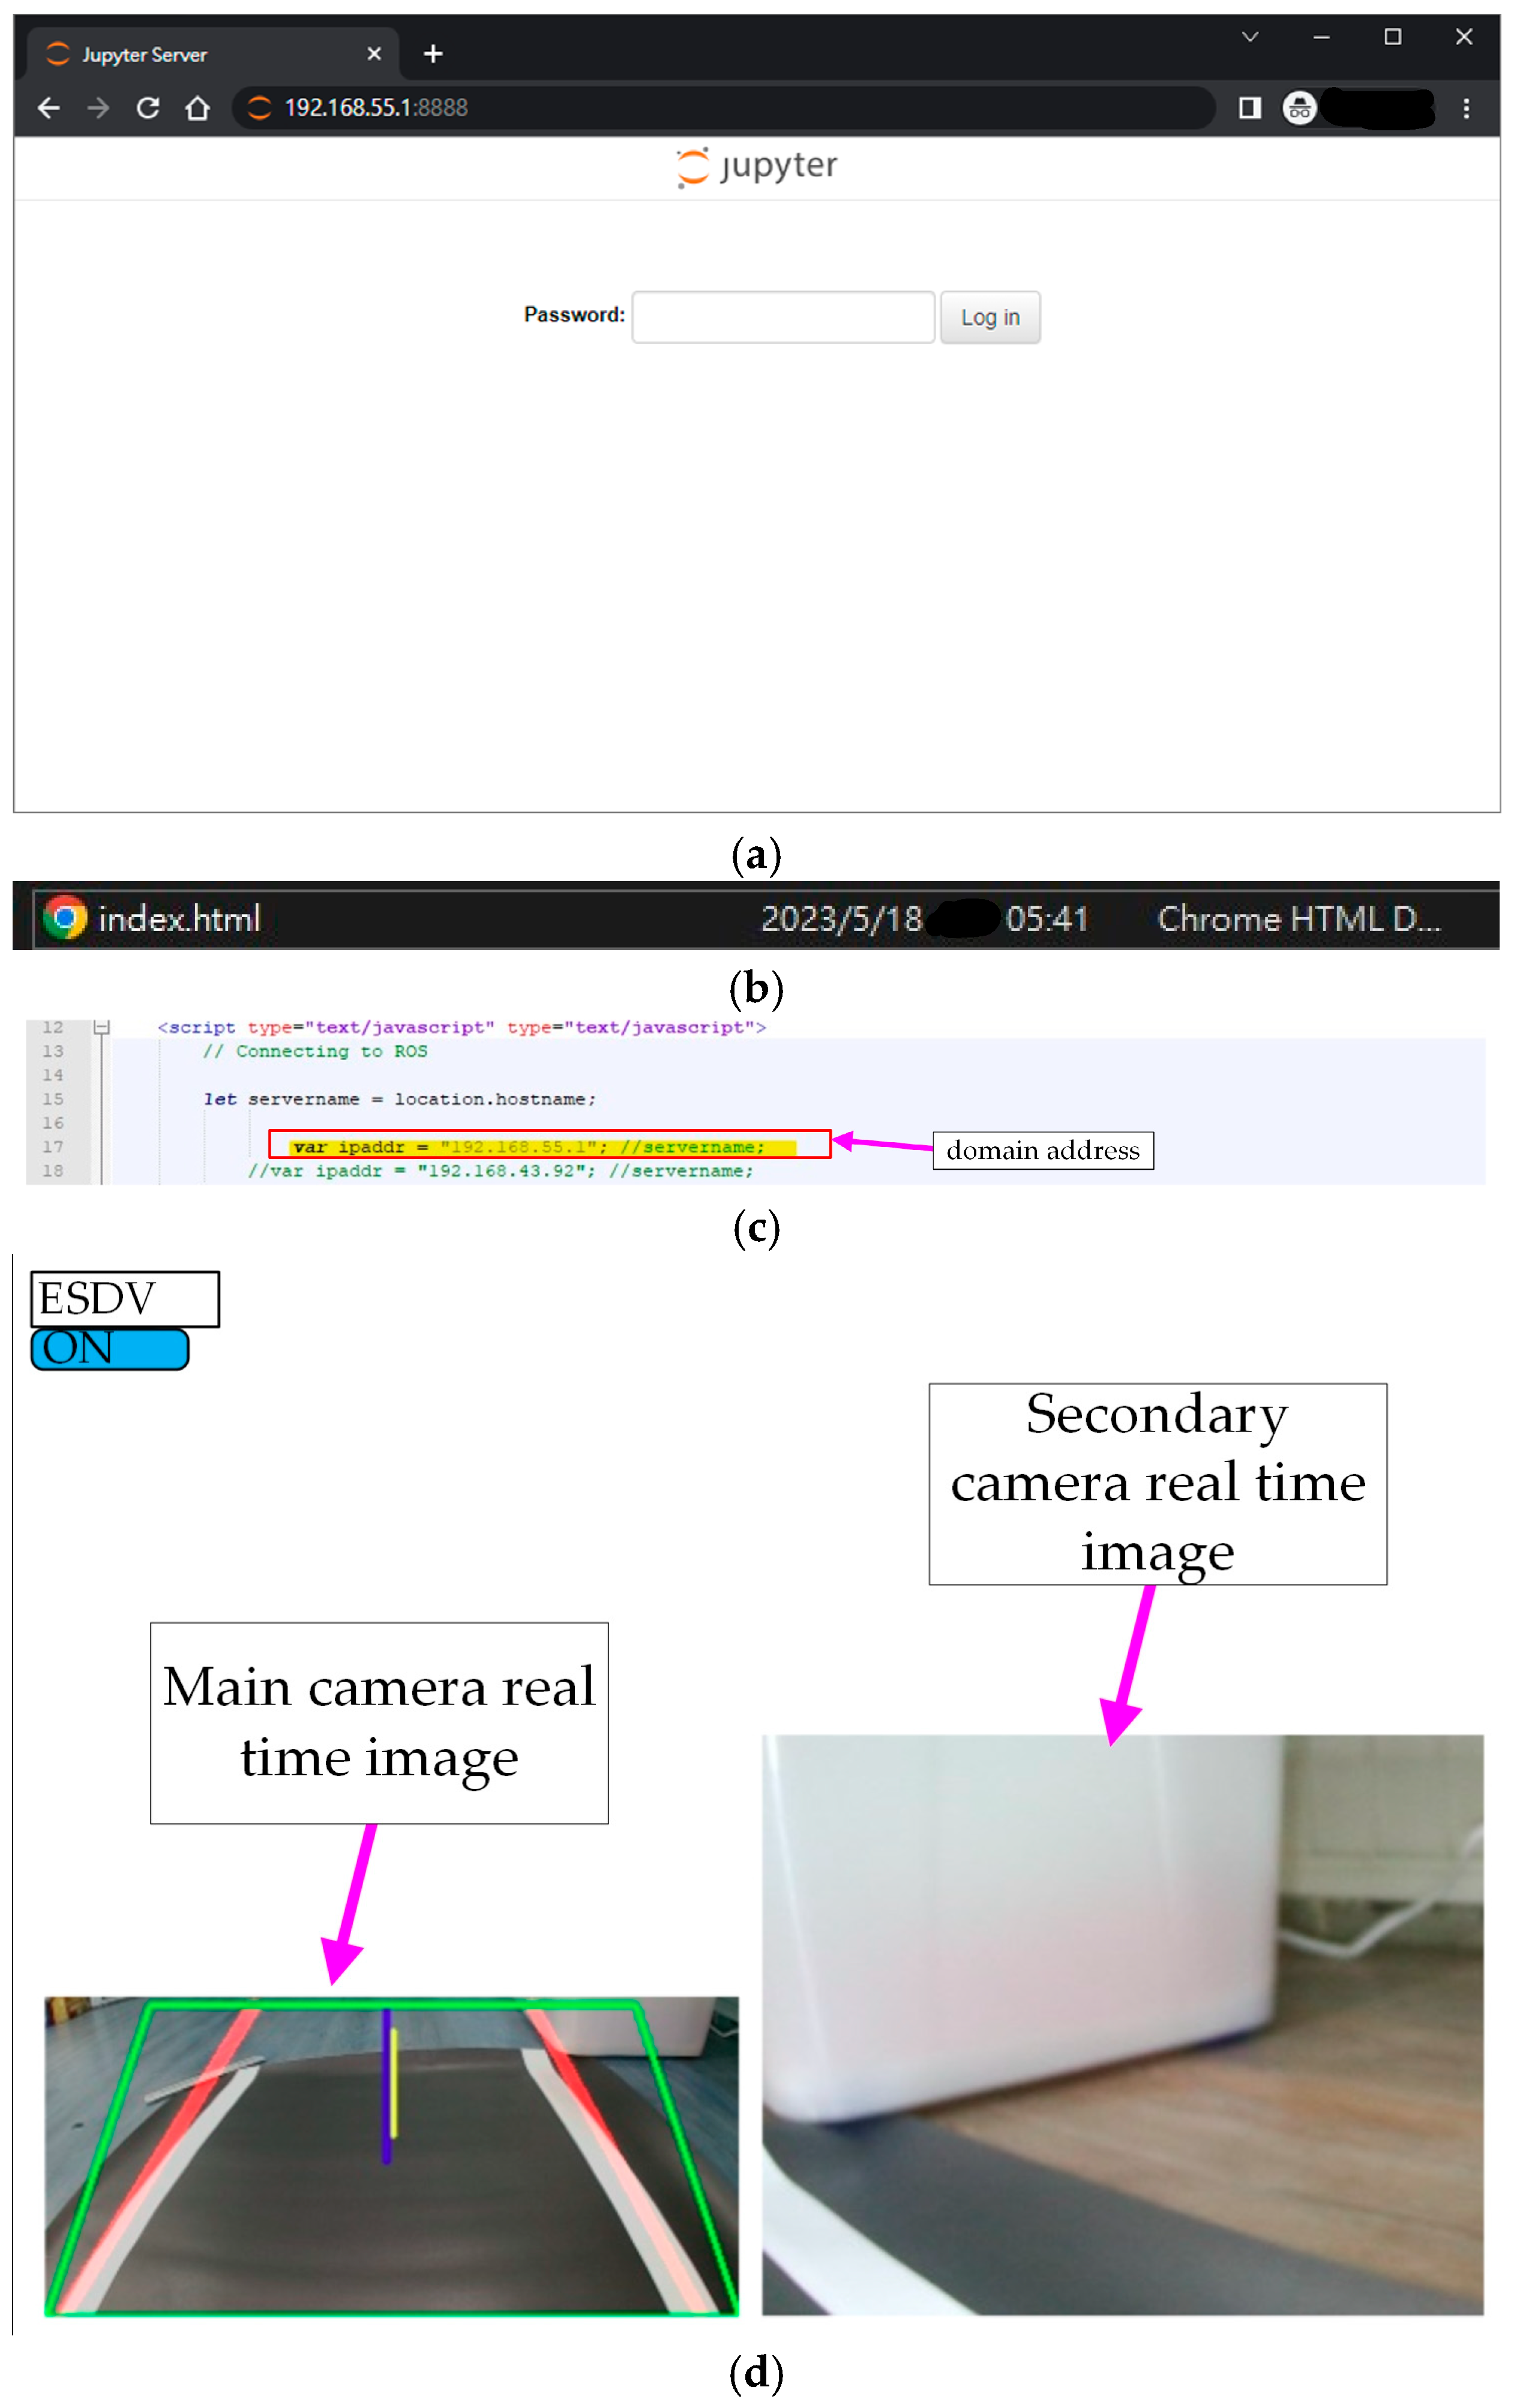
2.4. Cloud Monitoring Web System Description

Figure 8 shows the sequential process of transmitting real-time ESDV images to a cloud web page. It commences with Figure 8a, showing the opening of the web page to enter a password via the Jupyter Server on a personal computer. Figure 8b displays the physical diagram of the successful login to the cloud monitoring web page. On the other hand, Figure 8c demonstrates entering the domain address on the cloud monitoring web page. Lastly, Figure 8d depicts a personal computer connected to the ESDV’s miniature computer through a wireless network card, which transmits the images captured by the main and secondary camera to the cloud web page.

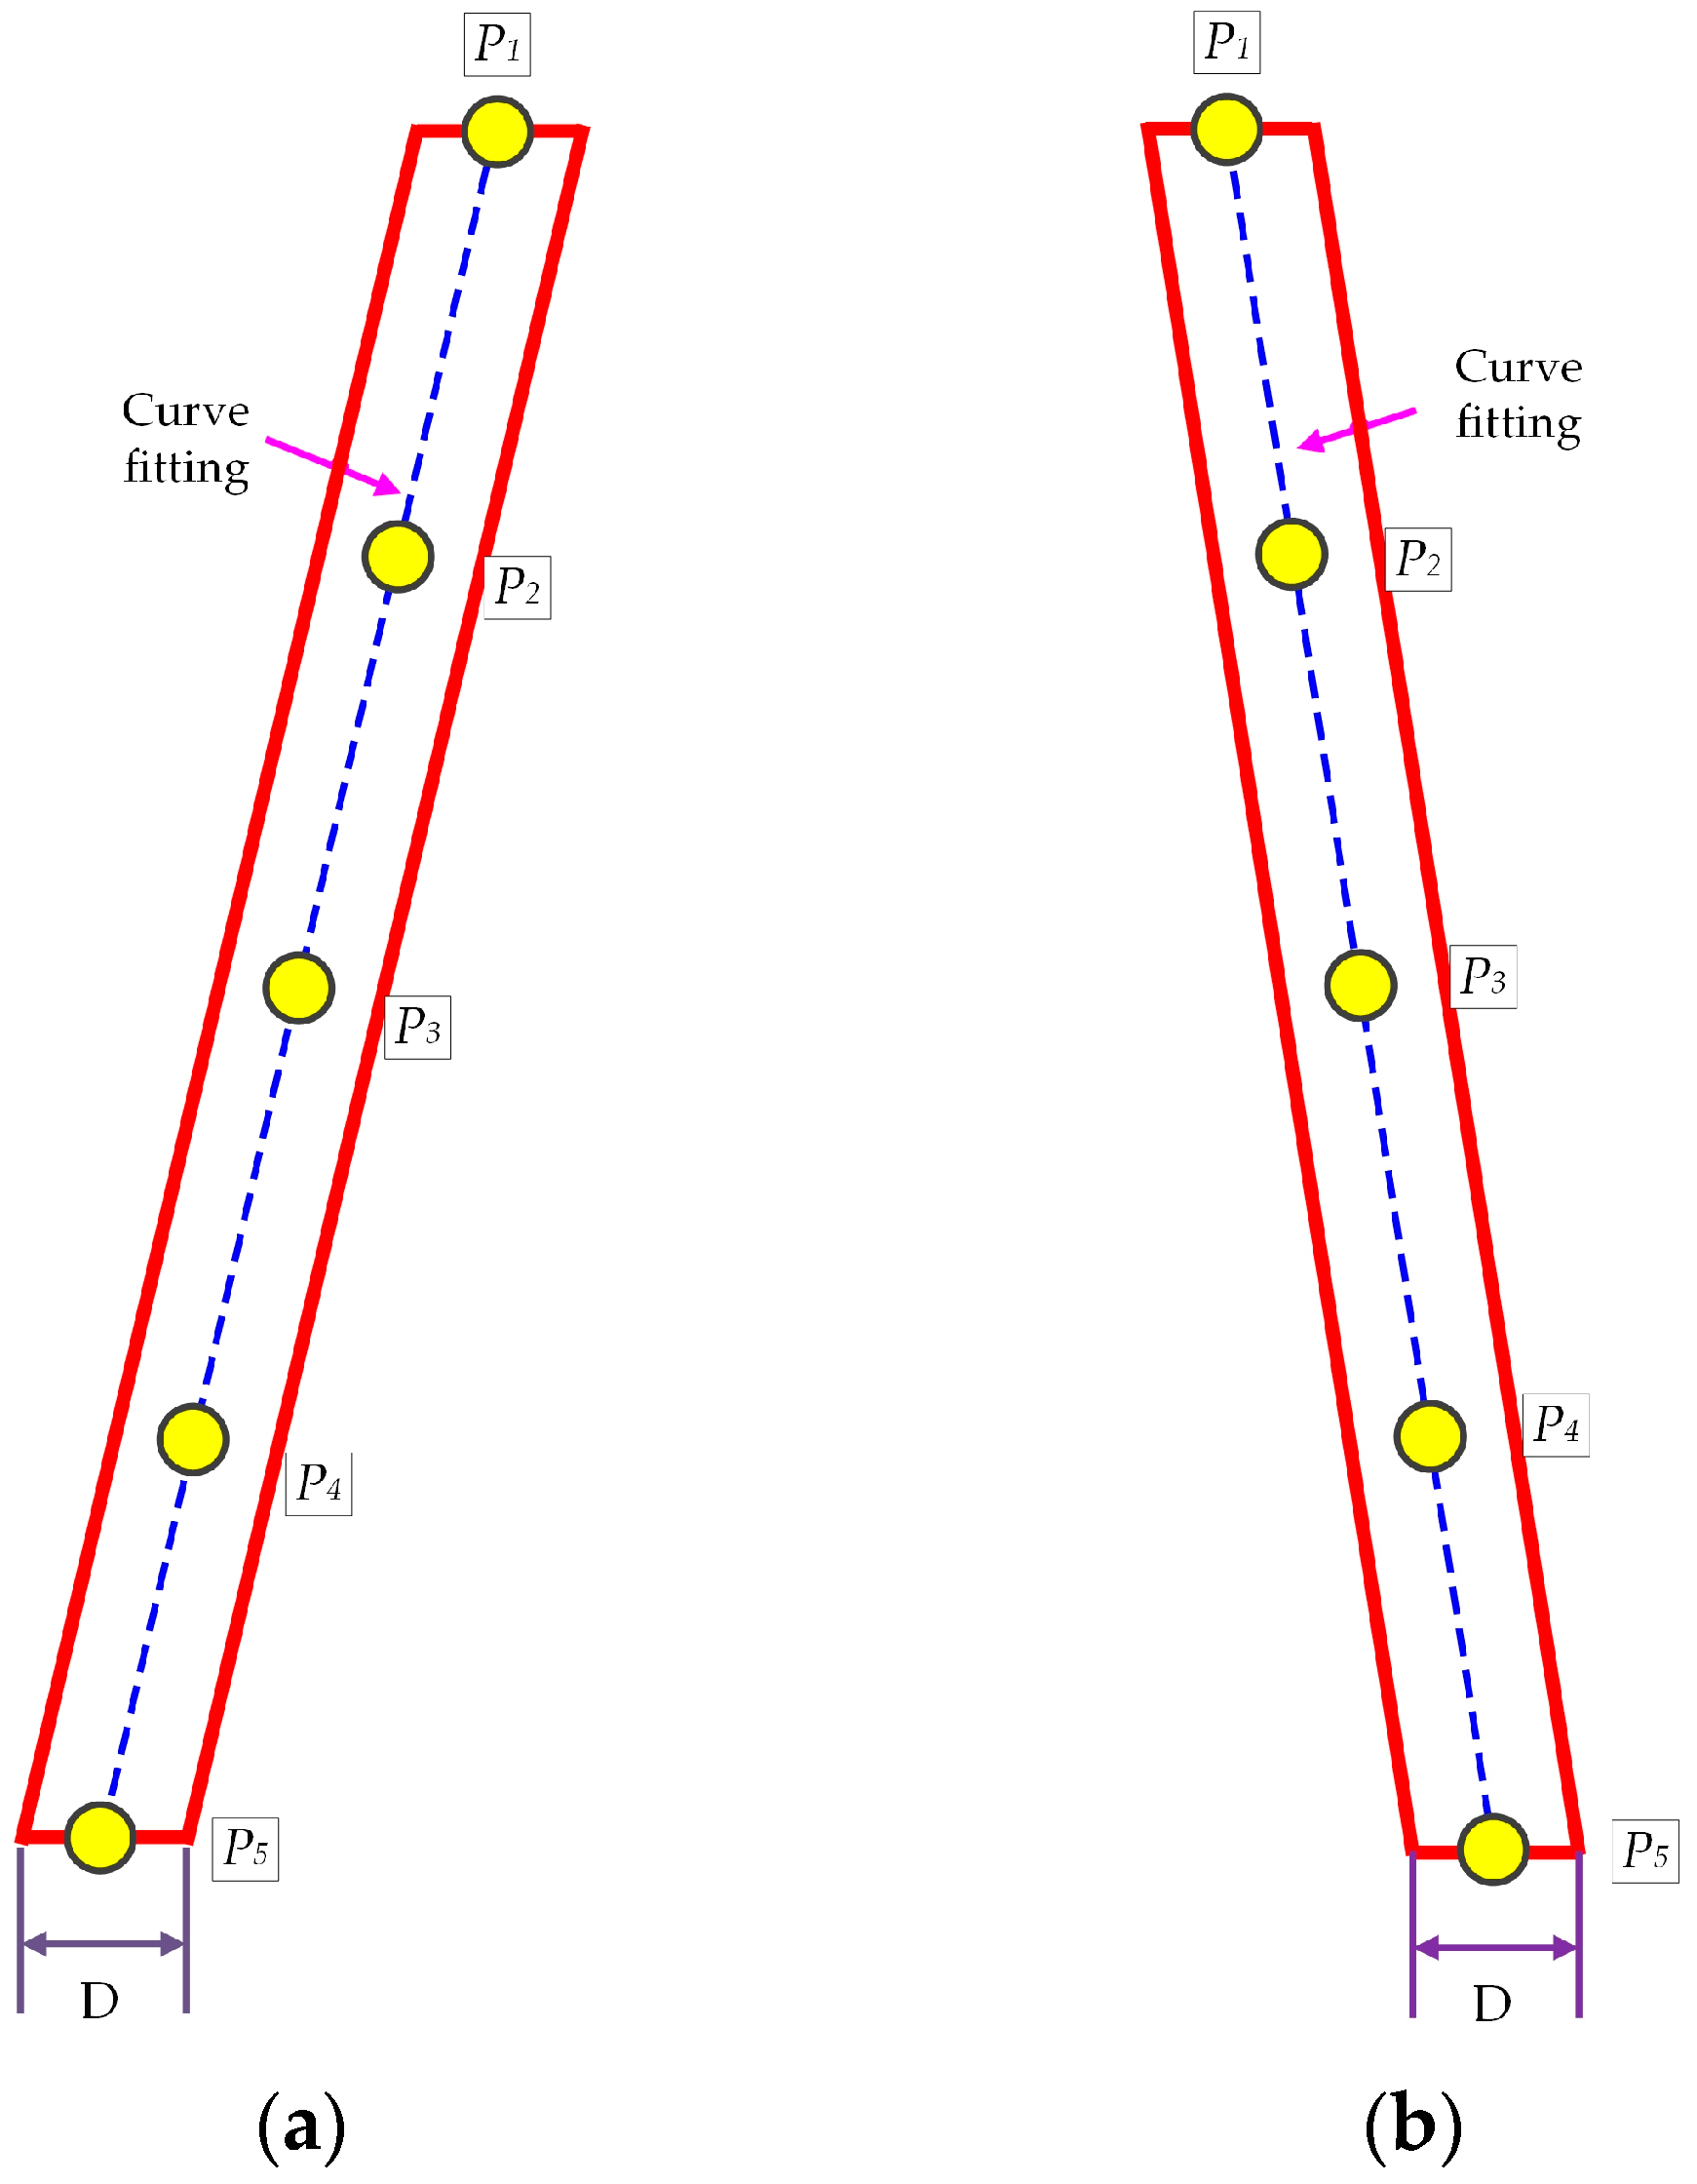
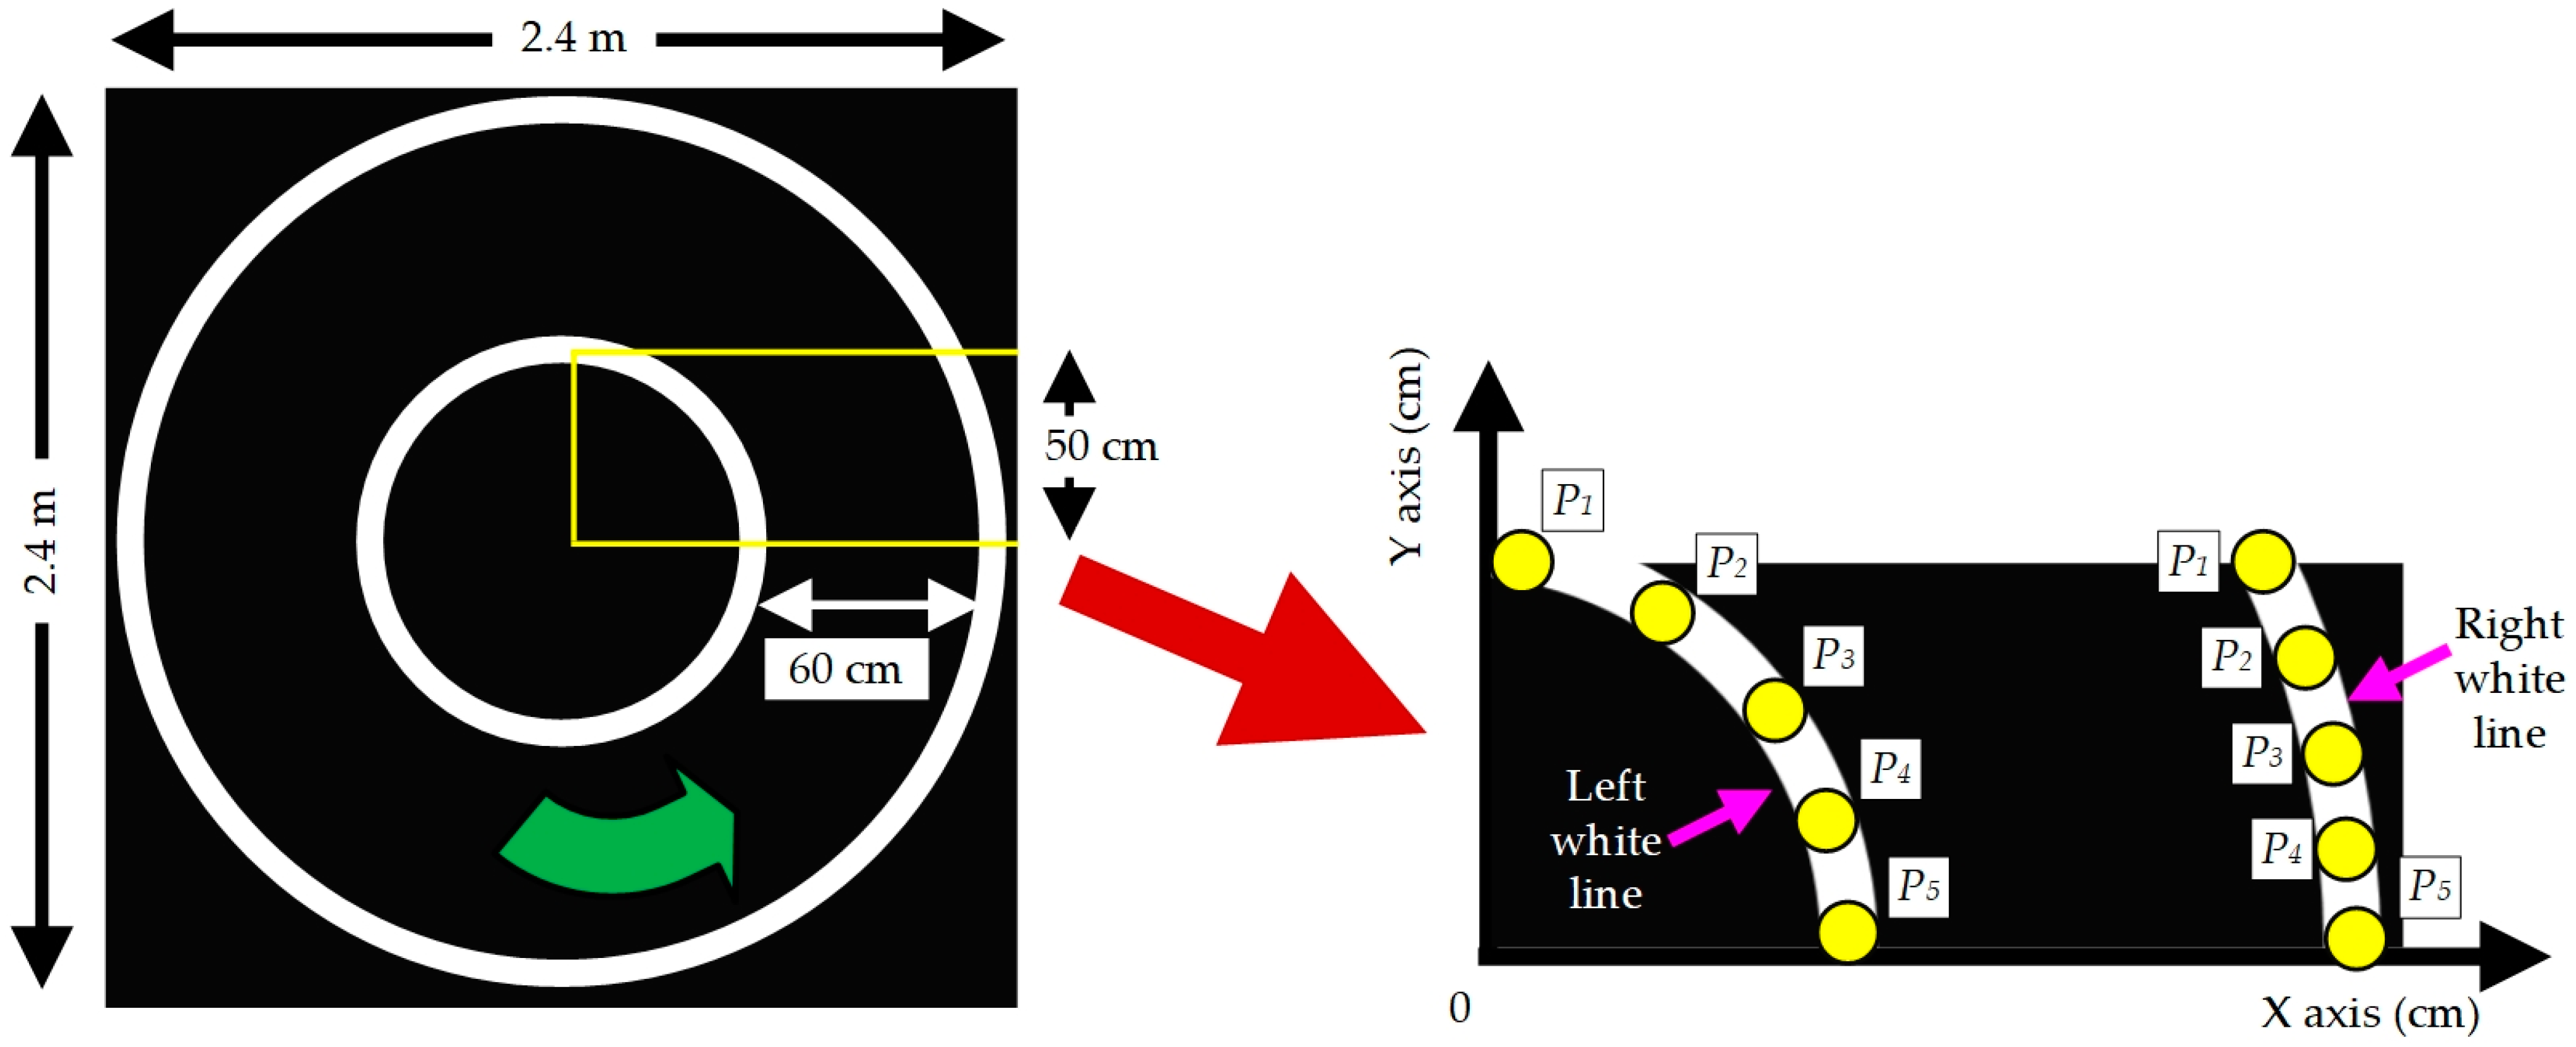
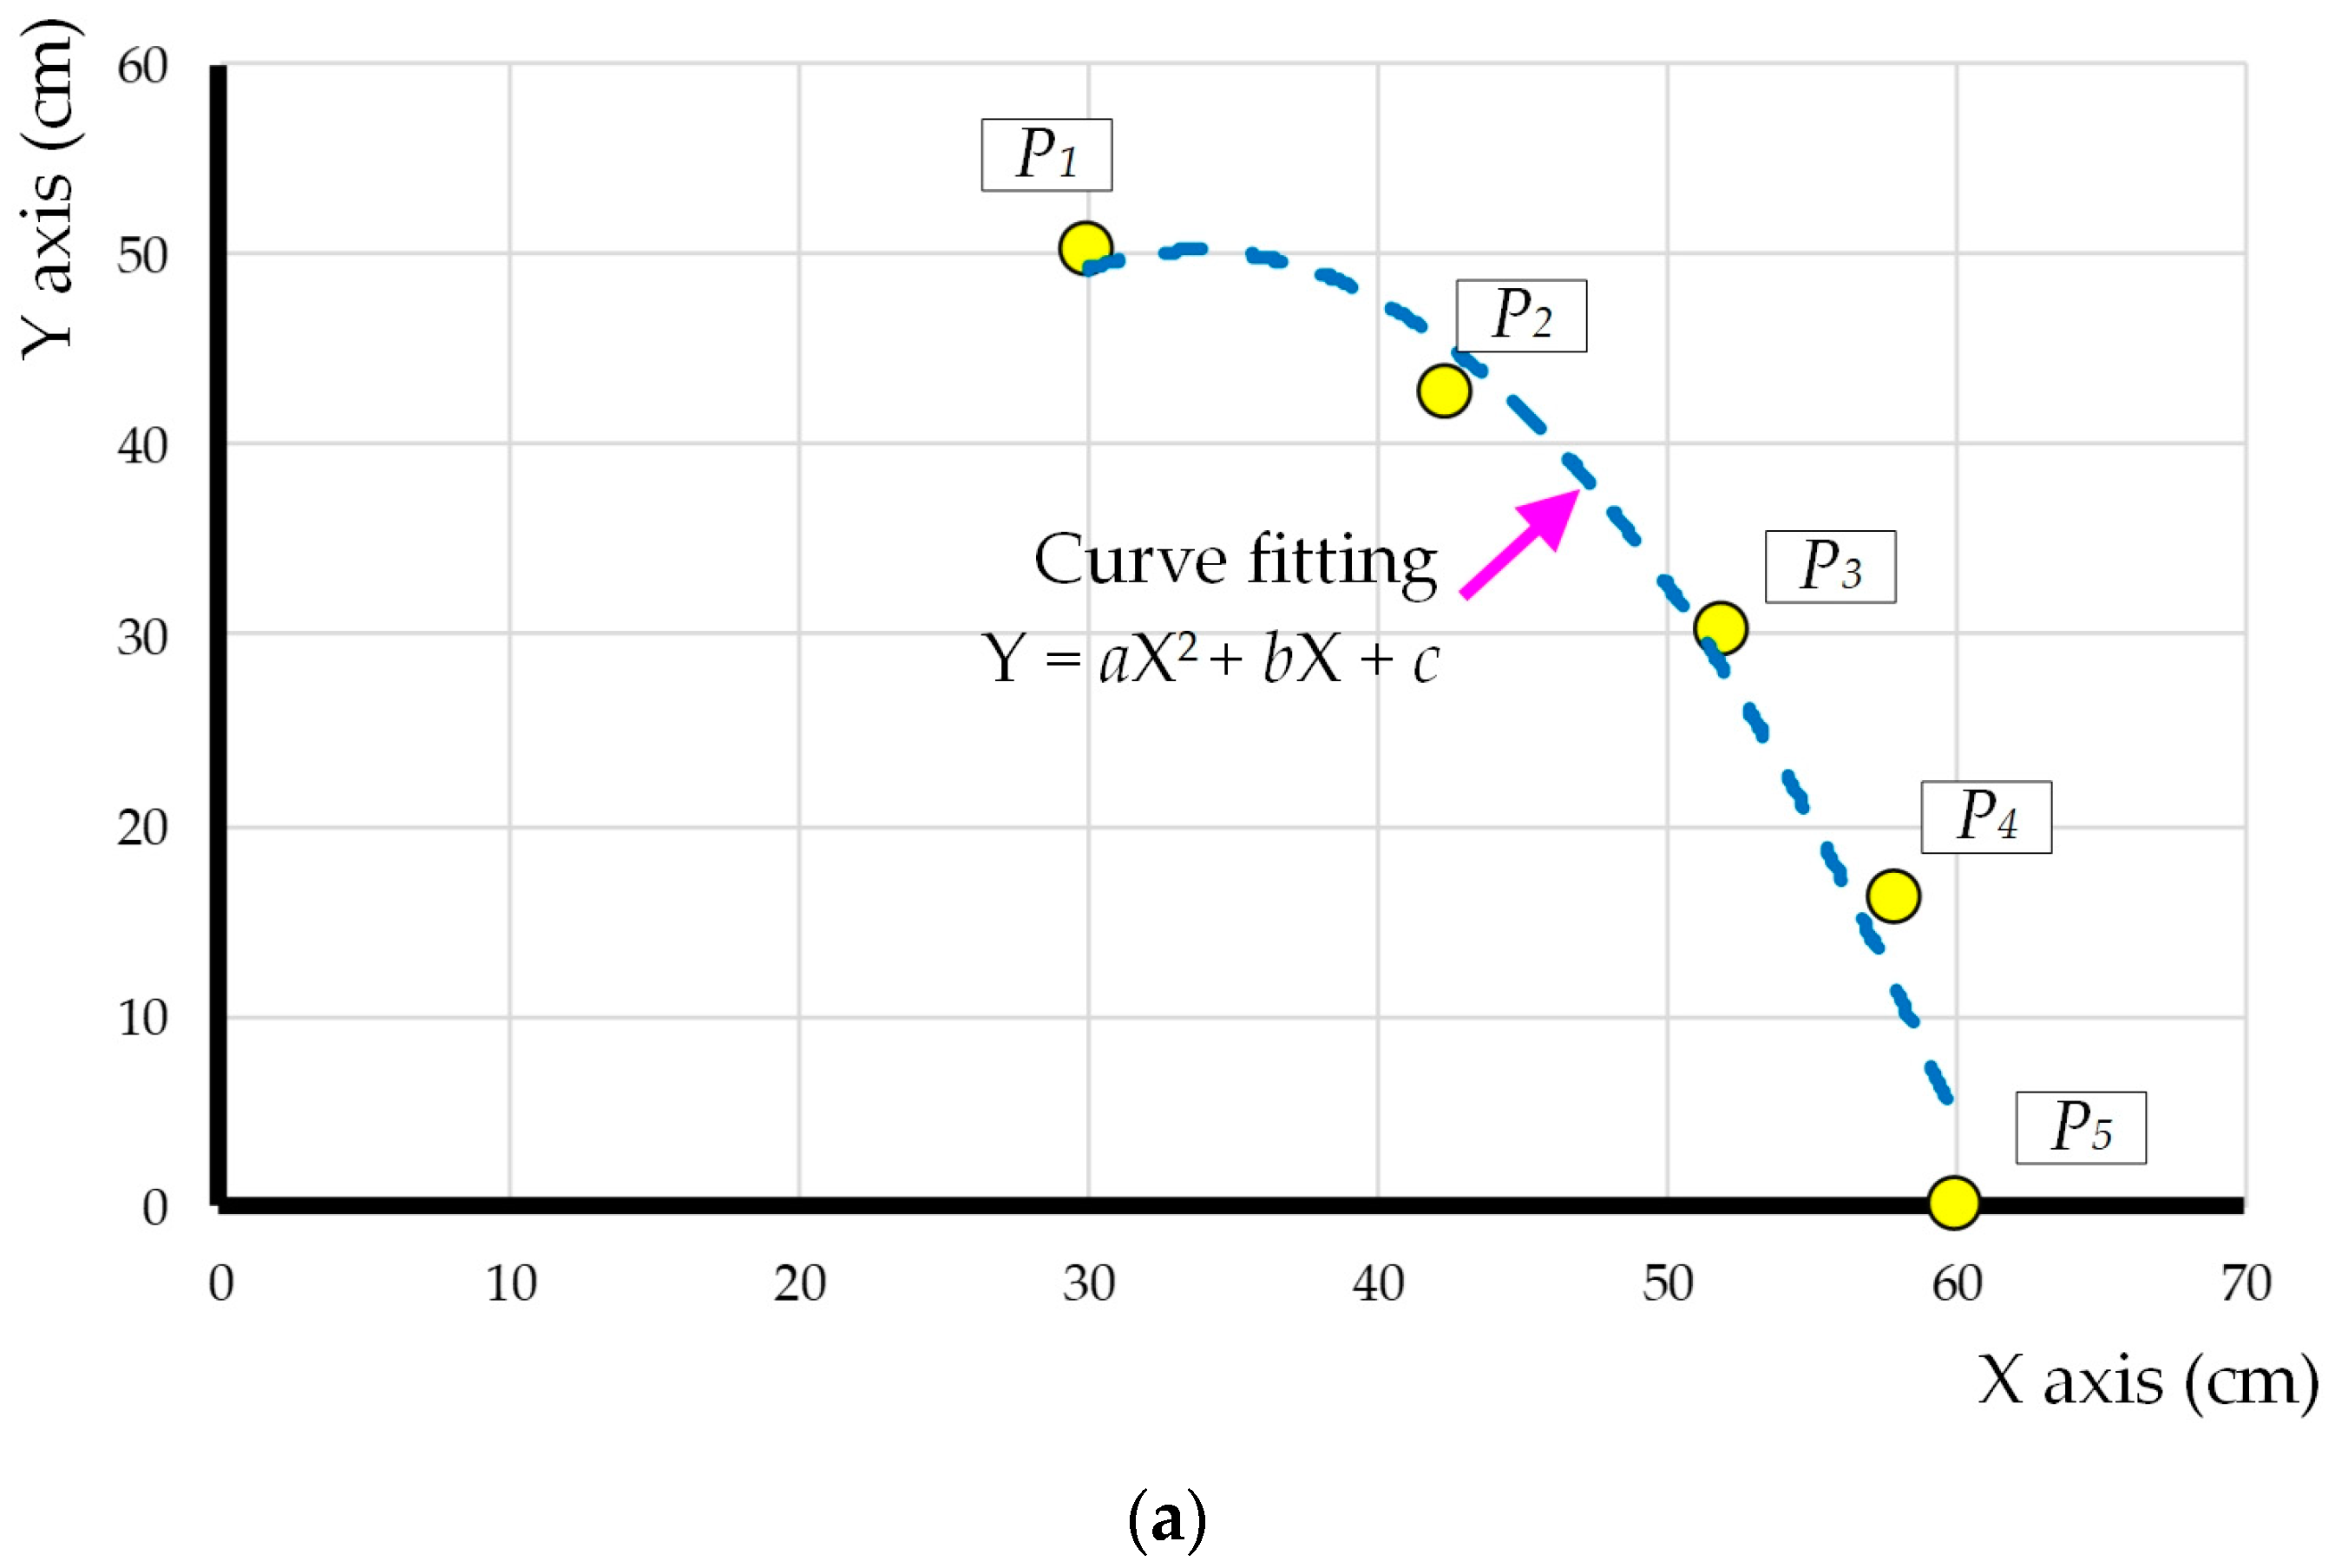
3. Proposed Image Recognition Curve-Fitting Control Technology

An advanced image recognition curve-fitting (IRCF) technology has been proposed in this study, which is depicted in Figure 9. Figure 9a illustrates that the main camera captured the actual image of the lane, with an image identification range of 60 cm on the x-axis and 50 cm on the y-axis. Figure 9b displays the two white lines on the road captured by the miniature computer using HSV technology (as shown in Figure 4). These white lines were then transformed into two groups of red frame lines through image processing. Subsequently, Figure 9c demonstrates the transformation of these frame lines into two red lines using the proposed curve-fitting technology. Figure 9d displays the corresponding diagram of the two actual white lines and the red lines on the road. The ESDV continuously analyzed the transformation of the two white lines on the road into red lines, stably controlling the driving within the two red lines.
Figure 10 further elucidates the transformation of the two white lines on the road into two groups of red frame lines. Figure 10 corresponds directly to Figure 9b. Figure 10a shows the red box line on the left, denoting the five points (P1P5), along with a dashed line representing curve fitting, where the red box was generated through image processing transformation (as shown in Figure 9b). The five points in this interval were first divided into equal proportions: P1, P2, P3, P4, and P5. These points were then determined by calculating the length of D via image processing and a miniature computer, then taking the intermediate value. Lastly, the curve-fitting technique yielded the plotted blue dashed lines. Figure 10b shows the red box line on the right, the five points (P1P5), and the dashed line fitted into the curve, where the red box was generated through image processing transformation. After curve fitting, the ESDV adhered to this defined range between the two lines, simplifying and optimizing the computational load on the miniature computer.
Figure 11 provides an overview of the actual road configuration utilized in our research for ESDV navigation. This circular road exhibits a maximum length and width of 2.4 m, and the road width is 60 cm. In this context, the ESDV operates counterclockwise, with the main camera capable of detecting a width of 60 cm and a forward detection distance of 50 cm. The proposed IRCF control strategy initially divided the left white line into five points (P1, P2, P3, P4, and P5) and then performed the curve fitting (as shown in Figure 12a). Subsequently, the IRCF control strategy extended to the right white line, following the same procedure of segmenting it into five points (P1, P2, P3, P4, and P5) and performing curve fitting (as depicted in Figure 12b). In addition, the ESDV in this study operated in a circular lane, and the researchers randomly placed the ESDV in the lane. If the ESDV is running counterclockwise, the left white line’s zero-point position at the x-axis is 60 cm, and at the y-axis is 0 cm (as in Figure 12a), while the right white line’s zero-point position at the x-axis is 120 cm, and at the y-axis is 0 cm (as in Figure 12b). The IRCF control strategy starts from the zero point, and the maximum measurable length of the y-axis is 50 cm (as in Figure 9a). The ESDV detected the white lines at both ends of the lane through the proposed IRCF control strategy (as shown in Figure 9) and then performed curve-fitting estimation to control the ESDV in the lane operation, so the ESDV continuously ran and calculated these five points’ (P1, P2, P3, P4, and P5) positions.
Figure 12 shows a schematic diagram illustrating the curve fitting of the two white lines of the ESDV running road. The ESDV in this study followed a circular road. First, the ESDV was analyzed in a counterclockwise running state. Figure 12a shows the diagram of the curve fitting of the left white line. The corresponding equation is as follows:
Y = aX2 + bX + c
where parameters a = −0.066 cm−1, b = 4.48, and c = −25.6 cm.
Figure 12b shows the diagram of the curve fitting of the right white line. The corresponding equation is as follows:
Y = dX2 + eX + f
where parameters d = −0.417 cm−1, e = 91.37, and f = −4951 cm.
Figure 12a,b correspond to Figure 11. The unit of both the x- and y-axis is cm. The two white lines were analyzed by image processing technology and then converted into 5 points (P1, P2, P3, P4, and P5), further deriving Equations (1) and (2) by curve fitting.
Similarly, the ESDV was analyzed in a clockwise running state. The curve-fitting equation of the left white line is shown in Equation (2), while the curve-fitting equation of the right white line is shown in Equation (1). In summary, the curve fitting in this study was carried out through a road analysis, allowing the ESDV to drive on the road accurately and stably. Furthermore, this study is supported by a cloud web image monitoring technology, which allowed the researchers to adjust the parameters to achieve optimal control through real vehicle operation conditions. The IRCF technology can be extended to different road types. The advantages of the control technology are its simple structure, low cost, easy implementation, and high stability.
This study proposed to take the circular road as an example as well as the ESDV stable operation from the proposed IRCF control strategy. The proposed IRCF control strategy adopts the analysis of the two white lines of the road to take five points and perform curve fitting to allow the ESDV to operate in the lane. If the driving lane path is non-linear, the proposed IRCF control strategy will continuously analyze the two white lines on the road and let the ESDV operate in the lane. The advantage of the IRCF control strategy is that it can analyze the actual white markings on the road so that it can promptly find the lane boundary and is flexible.
Figure 13 displays the proposed ESDV control technology flowchart. The initiation sequence commenced with the activation of the two cameras, the two ultrasonic sensors, the horn, and the LED display. Then, the ESDV determined whether there were obstacles ahead or behind. The ESDV stopped if there were obstacles. The horn’s siren sound and the LED display were used to determine the presence of obstacles. Next, when there were no obstacles ahead or behind the vehicle, the main camera detected two white lines on the road, while the secondary camera detected the road signs. Lastly, the proposed IRCF performed the calculations and controlled the ESDV to drive, the LED displays to demonstrate the signs, and the miniature computer and the cloud web monitoring system to link the web page to present real-time images.
In this study, the proposed IRCF control strategy analyzed the left and right white lines, and the left and right white lines were divided into five points, respectively. Then, the road boundary was drawn by curve fitting. If the white line in a local section is blurred, it will cause deviation in the road boundary drawn by curve fitting, but the ESDV will continue to run. As soon as this short fuzzy white line section passes, the proposed IRCF control strategy will continue to analyze the white line boundary of the road, and the ESDV will quickly correct and drive on the road planned by the proposed IRCF control strategy. If the left and right white lines become dirty in a large area, the proposed IRCF control strategy cannot operate normally. First, the ESDV will stop when it encounters an obstacle. Further, the ESDV has cloud monitoring technology, which can help researchers observe the operating status of the ESDV and perform troubleshooting, etc.

4. Experimental Results

Figure 14 demonstrates the overall view of the ESDV operation. The image recognition technology was transmitted on the 2.4 m × 2.4 m ring test road after connecting to the cloud web page, allowing the researchers to effectively examine the actual ESDV operation. Figure 14a shows the dynamic test diagram of the clockwise operation of the ESDV. Figure 14b shows the dynamic test diagram of the ESDV counterclockwise operation. The distance of the ESDV running one circle on the ring road was 5.5 m. The characteristics and efficiency of the ESDV were compared utilizing Hough linear detection and the proposed IRCF technology, running 20 cycles for a total of 110 m.
The Hough line detection method [15] uses image processing to analyze the two white lines on the road. Therefore, this study used the same ESDV to compare the performance of the proposed IRCF control strategy and the Hough line detection method. First, when encountering a curved road, multiple straight lines with different directions will be calculated through the Hough line detection method. This method’s calculation is complex, and the path is not smooth, thus resulting in a low ESDV operation performance. When encountering a curved road, the proposed IRCF control strategy will calculate a smooth path. This control strategy lets the ESDV operate on this road, thus demonstrating a high ESDV operation performance.
The comparison of the characteristics and effectiveness of the two control strategies are presented in Table 2. The proposed IRCF technique outperformed the Hough linear detection method at 110 m clockwise and counterclockwise running speeds. The ESDV was run utilizing the two methods. The proposed IRCF control strategy’s run time was shorter than the Hough line detection method [15], so the efficiency of the proposed IRCF control strategy was high. The proposed IRCF control strategy’s running dexterity is good because the curve fitting makes the lane smoother, allowing the ESDV to operate with greater flexibility and a higher speed. The proposed control technique is also superior in terms of efficiency and operating flexibility.
Figure 15 displays the physical diagram of the dynamic ESDV counterclockwise operation, and the real-time images displayed on the cloud web page. The experiment confirmed the feasibility of the proposed control system. The real-time image was then transmitted to the cloud web page so that the maintenance, research, and development personnel could obtain real-time operation. This facilitates timely control parameter adjustment and maintenance.

5. Discussion and Conclusions

The integration of image processing technology and the proposed IRCF control strategy within the ESDV self-driving assistance system has significantly enhanced its capability to operate stably, efficiently, and dexterously within the lane. The proposed strategy was compared with the Hough line detection method on a 110 m loop. The speeds of the proposed control strategy and the Hough line detection method were 2.13 km/h and 1.97 km/h, respectively. It is evident from the experimental results that the proposed control strategy outperformed the traditional Hough line detection method in terms of speed, efficiency, and running dexterity. Furthermore, the integration of ESDV with a cloud-based web page facilitated the real-time display of road conditions, as captured by its two cameras. This dynamic feature empowered the researchers to swiftly adapt the control parameters and promptly address vehicle-related issues and let the ESDV operate in the lane.
Moreover, the IRCF control strategy proved adaptable to non-linear driving lane paths. When the ESDV encountered blurred white lines in localized sections, it caused deviation in the road boundary drawn by curve fitting, but the ESDV continued its course. As soon as the short fuzzy white line segments passed, the proposed IRCF control strategy promptly recalibrated, ensuring the ESDV returned to its designated path. If the left and right white lines become dirty in a large area, the proposed IRCF control strategy cannot operate normally. Furthermore, the cloud monitoring technology of the ESDV enabled the researchers to monitor the operating status of the ESDV and troubleshoot any issues. Most conventional auxiliary control systems for self-driving cars use LiDAR for environmental analysis and stability control, incurring substantial costs and computational demands. In contrast, the IRCF control strategy demonstrated a particular aptitude for roads marked with white lane markings, such as campuses and industrial areas. This strategy not only curtailed design expenditures but also reduced the computational complexities.
Finally, the ESDV’s secondary camera has a signal sign detection function that can be shown on the LED display to inform passengers and road users of the current driving environment. In addition, the ESDV uses ultrasound to detect obstacles ahead and behind and provides alarm functions through the horn and LED display. Therefore, the ESDV control mechanism proposed in this study is closer to the practical requirements of the ESDV on the road, promoting the automatic assistance driving function to the next generation.
The IRCF control strategy can be applied to ESDV for future applications, including operation during rainy weather and humid conditions. The control parameters can be adjusted, allowing the ESDV to operate flexibly and stably during blurred image situations and on slippery roads. The proposed method can also be applied to a night test to determine whether the ESDV’s camera can still detect road images through headlamp lighting. Furthermore, the proposed control strategy may be extended to both day and night modes, allowing the automatic driving assistance system to be applied more comprehensively to the actual road environment.

Author Contributions

Conceptualization, H.-D.L., P.-J.L. and S.-X.L.; formal analysis, H.-D.L., P.-J.L. and S.-X.L.; investigation, H.-D.L., P.-J.L. and S.-X.L.; software, H.-D.L., P.-J.L. and S.-X.L.; methodology, H.-D.L., P.-J.L. and S.-X.L.; data curation, H.-D.L., P.-J.L. and S.-X.L.; visualization, H.-D.L., P.-J.L. and S.-X.L.; funding acquisition, H.-D.L.; supervision, H.-D.L.; writing—original draft, H.-D.L., P.-J.L., S.-X.L. and C.-H.L.; writing—review and editing, H.-D.L., P.-J.L., S.-X.L., C.-H.L. and S.-A.F. All authors have read and agreed to the published version of the manuscript.

Funding

This research is funded by the National Science and Technology Council, Taiwan, R.O.C., grant number NSTC 112-2221-E-003-003, and NTUS innovation cooperation 11212151003.

Data Availability Statement

Not applicable.

Conflicts of Interest

The authors declare no conflict of interest.

References

  1. Perozzi, G.; Rath, J.J.; Sentouh, C.; Floris, J.; Popieul, J.-C. Lateral Shared Sliding Mode Control for Lane Keeping Assist System in Steer-by-Wire Vehicles: Theory and Experiments. IEEE Trans. Intell. Veh. 2023, 8, 3073–3082. [Google Scholar] [CrossRef]
  2. Garcia-Garcia, J.A.; Arévalo, C.; Meidan, A.; Morillo-Baro, E.; Escalona, M.J. gPROFIT: A Tool to Assist the Automatic Extraction of Business Knowledge from Legacy Information Systems. IEEE Access 2021, 9, 94934–94952. [Google Scholar] [CrossRef]
  3. Zhang, J.; Akinsolu, M.O.; Liu, B.; Vandenbosch, G.A.E. Automatic AI-Driven Design of Mutual Coupling Reducing Topologies for Frequency Reconfigurable Antenna Arrays. IEEE Trans. Antennas Propag. 2021, 69, 1831–1836. [Google Scholar] [CrossRef]
  4. Gao, Y.; Ji, W.; Zhao, X. SOC Estimation of E-Cell Combining BP Neural Network and EKF Algorithm. Processes 2022, 10, 1721. [Google Scholar] [CrossRef]
  5. Shi, D.; Li, S.; Liu, K.; Wang, Y.; Liu, R.; Guo, J. Adaptive Energy Management Strategy Based on Intelligent Prediction of Driving Cycle for Plug−In Hybrid Electric Vehicle. Processes 2022, 10, 1831. [Google Scholar] [CrossRef]
  6. Zhang, Y.; Yan, S.; Yin, W.; Wu, C.; Ye, J.; Wu, Y.; Liu, L. HOMER-Based Multi-Scenario Collaborative Planning for Grid-Connected PV-Storage Microgrids with Electric Vehicles. Processes 2023, 11, 2408. [Google Scholar] [CrossRef]
  7. Feng, J.; Chang, X.; Fan, Y.; Luo, W. Electric Vehicle Charging Load Prediction Model Considering Traffic Conditions and Temperature. Processes 2023, 11, 2256. [Google Scholar] [CrossRef]
  8. Liu, Z.; Cai, Y.; Wang, H.; Chen, L.; Gao, H.; Jia, Y.; Li, Y. Robust Target Recognition and Tracking of Self-Driving Cars With Radar and Camera Information Fusion Under Severe Weather Conditions. IEEE Trans. Intell. Transp. Syst. 2022, 23, 6640–6653. [Google Scholar] [CrossRef]
  9. Bastos, D.; Brandão, A.; Lorences-Riesgo, A.; Monteiro, P.P.; Oliveira, A.S.R.; Pereira, D.; Olyaei, H.Z.; Drummond, M.V. Time-Frequency Range Estimation Method for Pulsed LiDAR. IEEE Trans. Veh. Technol. 2023, 72, 1429–1437. [Google Scholar] [CrossRef]
  10. Soman, S.P.; Kumar, G.S.; Abubeker, K.M. Internet-of-Things-Assisted Artificial Intelligence-Enabled Drowsiness Detection Framework. IEEE Sens. Lett. 2023, 7, 6003704. [Google Scholar] [CrossRef]
  11. Somerset, W.E.; Feeney, A.; Kang, L.; Li, Z.; Dixon, S. Design and Dynamics of Oil Filled Flexural Ultrasonic Transducers for Elevated Pressures. IEEE Sens. J. 2021, 22, 12673–12680. [Google Scholar] [CrossRef]
  12. Zhang, J.; Xu, Z.; Wu, J.; Chen, Q.; Wang, F. Lightweight intelligent autonomous unmanned vehicle based on deep neural network in ROS system. In Proceedings of the 2022 IEEE 5th International Conference on Information Systems and Computer Aided Education (ICISCAE), Dalian, China, 23–25 September 2022; pp. 679–684. [Google Scholar] [CrossRef]
  13. Das, S.; Mantri, T.; Tembhurkar, R. Trajectory Planning and Maneuver Control to Assist Lane Change. In Proceedings of the 2021 8th International Conference on Signal Processing and Integrated Networks (SPIN), Noida, India, 26–27 August 2021; pp. 191–197. [Google Scholar] [CrossRef]
  14. Saranya, M.; Archana, N.; Reshma, J.; Sangeetha, S.; Varalakshmi, M. Object detection and lane changing for self driving car using cnn. In Proceedings of the 2022 International Conference on Communication, Computing and Internet of Things (IC3IoT), Chennai, India, 10–11 March 2022; pp. 1–7. [Google Scholar] [CrossRef]
  15. Afor, M.E.; Ravulakollu, K.; Chhabra, M.; Sharma, P.; Dewingong, T.F.; Dewan, R. Automated Sign Detection in a Self-Driving Car. In Proceedings of the 2022 9th International Conference on Computing for Sustainable Global Development (INDIACom), New Delhi, India, 23–25 March 2022; pp. 272–276. [Google Scholar] [CrossRef]
  16. Chaitra, P.G.; Deepthi, V.; Gautami, S.; Suraj, H.M.; Kumar, N. Convolutional Neural Network based Working Model of Self Driving Car-A Study. In Proceedings of the International Conference on Electronics and Sustainable Communication Systems (ICESC 2020), Coimbatore, India, 2–4 July 2020; pp. 645–650. [Google Scholar] [CrossRef]
  17. Chen, K. The Design of Cruise control and lane-changing control for an autonomous vehicle. In Proceedings of the 2021 3rd International Academic Exchange Conference on Science and Technology Innovation (IAECST), Guangzhou, China, 10–12 December 2022; pp. 957–960. [Google Scholar] [CrossRef]
  18. Kannapiran, S.; Berman, S. Go-CHART: A miniature remotely accessible self-driving car robot. In Proceedings of the 2020 IEEE/RSJ International Conference on Intelligent Robots and Systems (IROS), Las Vegas, NV, USA, 24 October 2020–24 January 2021; pp. 2265–2272. [Google Scholar] [CrossRef]
  19. Sai, P.G.; Chandu, S.S.; Aishwarya, S.C.; Revanth, V.; Geetha, G. Detection of Lanes and Objects Using Deep Learning Techniques. In Proceedings of the International Conference on Inventive Research in Computing Applications (ICIRCA 2022), Coimbatore, India, 21–23 September 2022; pp. 446–450. [Google Scholar] [CrossRef]
  20. Yogitha; Subhashini, S.; Pandiyan, D.; Sampath, S.; Sunil, S. Review on Lane and Object Detection for Accident Prevention in Automated Cars. In Proceedings of the Second International Conference on Artificial Intelligence and Smart Energy (ICAIS-2022), Coimbatore, India, 23–25 February 2022; pp. 1794–1800. [Google Scholar] [CrossRef]
  21. Nguyen, H.-H.-N.; Pham, D.-H.; Le, T.-L.; Le, M.-H. Lane Keeping and Navigation of a Self-driving RC Car Based on Image Semantic Segmentation and GPS Fusion. In Proceedings of the 2022 6th International Conference on Green Technology and Sustainable Development (GTSD), Nha Trang City, Vietnam, 29–30 July 2022; pp. 601–606. [Google Scholar] [CrossRef]
  22. Lin, H.; Zeng, C.; Zhang, H.; Jiang, G. Radar Maneuvering Target Motion Parameter Estimation Based on Hough Transform and Polynomial Chirplet Transform. IEEE Access 2021, 9, 35178–35195. [Google Scholar] [CrossRef]
  23. Zhao, K.; Han, Q.; Zhang, C.-B.; Xu, J.; Cheng, M.-M. Deep Hough Transform for Semantic Line Detection. IEEE Trans. Pattern Anal. Mach. Intell. 2022, 44, 4793–4806. [Google Scholar] [CrossRef] [PubMed]
  24. Jue, W.; Pengwei, H.; Jianqiang, Q.; Lei, G. Confocal Ellipse Hough Transform for Polarization Compass in the Nonideal Atmosphere. IEEE Trans. Instrum. Meas. 2023, 72, 5010108. [Google Scholar] [CrossRef]
Figure 1. Illustration of the components in the automatic driver assistance system for an electric vehicle.
Processes 11 02732 g001
Figure 2. Physical representation of the ESDV: (a) front view, (b) rear view, and (c) side view.
Processes 11 02732 g002aProcesses 11 02732 g002b
Figure 3. Components’ configuration within the ESDV: (a) a servo motor and two DC motors, and (b) four sensors and a horn.
Processes 11 02732 g003
Figure 4. HSV color adjustment window.
Processes 11 02732 g004
Figure 5. Sign marks: (a) fenced railway level crossing and (b) slowdown.
Processes 11 02732 g005
Figure 6. LED display signaling a slowdown sign, triggered by secondary camera detection.
Processes 11 02732 g006
Figure 7. Physical representation of the ESDV encountering obstacles: (a) obstacles ahead and (b) obstacles behind.
Processes 11 02732 g007
Figure 8. Sequence of steps illustrating the real-time image transmission from the ESDV to the cloud web page: (a) accessing the web page to enter the password on the Jupyter server on a personal computer, (b) cloud monitoring web page interface, (c) input the domain address on the cloud monitoring web page, and (d) real-time images captured by the main and secondary cameras displayed on the cloud web page.
Processes 11 02732 g008
Figure 9. Proposed image recognition curve-fitting (IRCF) technology: (a) the actual image of the lane detected by the main camera, (b) transforming two white lines into two groups of red frame lines via image processing technology, (c) curve fitting of red frame lines into red straight lines, and (d) the corresponding diagram of the actual white lines and the red lines on the road.
Processes 11 02732 g009
Figure 10. Transformation of the two white lines on a road into two groups of red frame lines: (a) red frame line on the left with dotted five-point (P1P5) markings and curve fitting, and (b) red frame line on the right with dotted five-point (P1P5) markings and curve fitting.
Processes 11 02732 g010
Figure 11. Schematic diagram of the ESDV’s actual operation ring road in this research.
Processes 11 02732 g011
Figure 12. Visual representation of the curve fitting of two white lines on the ESDV road: (a) left white line and (b) right white line.
Processes 11 02732 g012aProcesses 11 02732 g012b
Figure 13. Flowchart of the proposed ESDV control technology.
Processes 11 02732 g013
Figure 14. Dynamic test diagram of the ESDV: (a) clockwise dynamic running test diagram and (b) counterclockwise dynamic running test diagram.
Processes 11 02732 g014
Figure 15. Physical diagram of the dynamic counterclockwise operation of the ESDV and real-time images displayed on the cloud web page.
Processes 11 02732 g015
Table 1. ESDV component specifications.
ItemSpecificationsQuantity
Self-driving electric vehicle bodyDimensions: 23.5 cm (length) × 19.5 cm (width) × 23.5 cm (height)1
Front wheelWheel diameter: 6.5 cm, width: 2.5 cm, type: skid tires2
Rear wheelWheel diameter: 6.5 cm, width: 2.5 cm, type: skid tires2
Miniature computerBrand: NVIDIA, model: Jetson Nano 4G1
Control boardBrand: Microchip, Model: ATMEGA 1284p1
Main cameraResolution 1920 × 1080, 160-degree wide-angle1
Secondary cameraResolution 1280 × 720, 120-degree wide-angle1
DC motorsInput voltage: 12 V, rotational speed: 330 rpm2
Lithium battery packRate voltage: 11.1 V, capacity: 2.25 Ah1
Servo motorInput voltage: 4.8 V~7.2 V, torque: 9.4 kg/cm~13.5 kg/cm1
Ultrasonic sensorSensing distance: 2 cm~450 cm, input voltage: 5 V2
HornInput voltage: 5 V, Decibel: 80 dB1
HeadlightInput voltage: 5 V, rate power: 15 W, color: white light1
LED displayLED color: red, input voltage: 5 V, dimensions: 54 mm × 22 mm1
Wireless network cardBrand: TP-LINK, model: AC13001
Table 2. Comparison of the characteristics and effectiveness of the two control strategies.
Control Method[15]Proposed IRCF
Run 110 m clockwise200 s185 s
Run 110 m counterclockwise201 s186 s
Speed1.97 km/h2.13 km/h
EfficacyMiddleHigh
Running dexterityMiddleGood
Disclaimer/Publisher’s Note: The statements, opinions and data contained in all publications are solely those of the individual author(s) and contributor(s) and not of MDPI and/or the editor(s). MDPI and/or the editor(s) disclaim responsibility for any injury to people or property resulting from any ideas, methods, instructions or products referred to in the content.

