Article

Optimization of Batch Crystallization of Magnetic Lysozyme Crystals and Study of the Continuous Crystallization Process

Chemical Engineering Institute, Hebei University of Technology, Tianjin 300400, China
*
Author to whom correspondence should be addressed.
Processes 2023, 11(9), 2644; https://doi.org/10.3390/pr11092644
Submission received: 16 July 2023 / Revised: 24 August 2023 / Accepted: 30 August 2023 / Published: 4 September 2023

Abstract

:
Protein crystallization is a widely employed technique for purifying protein drugs, offering notable benefits such as cost-effectiveness and high purity. However, the success of this method is influenced by factors such as the molecular weight and spatial structure of proteins. The challenges associated with achieving crystallization and the prolonged duration required for crystallization induction pose limitations on its widespread industrial implementation. In this study, we employed lysozyme derived from egg white as a representative protein to investigate the polymer-assisted self-assembly of magnetic lysozyme. Through the optimization of the initial interstitial crystallization process of magnetic lysozyme, we manipulated the supersaturation level of lysozyme and applied magnetic nanoparticle treatment. As a result, we successfully reduced the crystallization time from 24 h to 60 min. Subsequently, the findings derived from the analysis of data pertaining to the interstitial crystallization process of lysozyme were utilized to optimize the design and configuration of a push flow crystallizer (PFC) as well as a slug flow crystallizer (SFC). The analysis encompassed the examination of various factors, including the residence time of crystallization, the yield of the process, the shape of the crystals formed, and the distribution of crystal sizes. Ultimately, it was determined that the SFC demonstrated optimal suitability for the crystallization of magnetic lysozyme. The typical V-PFC crystal size is 16 m and the yield is 60%. V-SFC crystals have an average size of 13 m and a yield of 85%.

1. Introduction

Protein-based pharmaceuticals in a crystalline state exhibit enhanced stability, predictable dissolution properties, higher concentration levels, and extended shelf life [1]. Crystallization techniques offer a more efficient and simplified means of purifying individual proteins from intricate extracts. Hence, it is plausible that crystallization techniques may serve as a partial substitute for alternative purification methods, including chromatography and precipitation [2,3,4]. Batch crystallization remains the predominant procedure in industrial crystallization [5,6,7].
The current trend in medication manufacturing involves a shift from batch operation to continuous operation. The primary objective of this initiative is to decrease production expenses while simultaneously enhancing adaptability and quality [8]. Additionally, it enhances the management of uncertainty, nonlinearity, temporal expansion, spatial distribution, and the integration of continuous and discrete operations within the production process [9]. When comparing batch crystallization with continuous crystallization, it becomes evident that the latter method is more efficient in enhancing the particle size distribution. This is particularly true when aiming to produce crystals with a narrower and more precise crystal size distribution, as supported by previous studies [10,11,12].
The process of continuous stirring crystallization is a technique commonly employed in the field of chemical engineering for the purpose of producing crystalline materials. The MSMPR crystallizer is a widely adopted and highly efficient technology in the industry [13,14]. The MSMPR crystallizer typically employs a multi-stage classification process characterized by a slow crystallization rate, making it well-suited for systems with extended residence times [15,16,17,18]. Another technique that can be employed is the tubular crystallizer, which is particularly advantageous due to its ability to provide quicker dynamics and enhance temperature regulation. The continuous slug flow crystallizer is often employed in tubular molds. In real scenarios, the phenomenon of supersaturation is typically more pronounced in continuous crystallizer species compared to MSMPR crystalizer [19]. During the investigation of continuous slug flow tube crystallization, it was shown that slug flow crystallization has the potential to achieve cost-effectiveness and high production quality concurrently. Lysozyme seed induced crystallization in SFC crystallizers resulted in greater crystal size distribution width and reproducibility than batch crystallizers due to less random aggregation of tiny crystals generated. Due to the prevention of secondary nucleation, large and well-defined tetramysozyme crystals are generated at low flow rates below the minimum flow rate, whereas at high flow rates, the size of the lysozyme crystals made by SFC drops and the yield declines. Although increasing the length of the tube can boost yield, this may result in a lower yield. The crystallizer had no effect on the activity of lysozyme crystals [20].
The segmented flow crystallizer is distinguished by its simple design, excellent mixing, and high heat and mass transfer rates [10]. Furthermore, this process may generate larger and more structurally intact crystals when subjected to low shear stress [21]. The normal tube diameter of the slug flow crystallizer is generally smaller than 5 mm. Reduced pipe diameters were seen to decrease the occurrence of ineffective mixing while promoting enhanced heat and mass transfer. Each liquid unit within the tube exhibits identical physical and chemical conditions, rendering it conducive for the crystallization of unstable proteins that are prone to denaturation, such as insulin [22]. Nevertheless, tubular crystallizers have a higher susceptibility to fouling, clogging, and precipitation issues, hence posing significant challenges in terms of industrial implementation.
Previous research was conducted to examine the process of self-assembly in magnetic lysozyme crystals [23,24]. Among the three polymers investigated, it was observed that poly(aspartic acid) (PASP) exhibited a comparatively shorter induction time at lower supersaturation ratios. Following PASP, chondroitin sodium sulfate (Cs-Na) had a moderate induction time, while poly(succinimide) (PEI) necessitated the biggest supersaturation ratios and exhibited the longest induction time.
Prior research indicated that when the ratio of the length of the liquid section to the diameter of the tube approaches 1:1, there is an increase in particle yield and a decrease in the size distribution of the resulting crystal product [25]. The impact of three distinct materials on tube crystallizers: A study was conducted to investigate the impact of three distinct materials, namely polyvinyl chloride, silicone rubber, and polytetrafluoroethylene, on the process of nucleation. The reduction in crystal adherence to PTFE surfaces was observed, leading to a potential decrease in tube crystallizer blockage [23]. In the meantime, it is worth noting that PTFE tubes exhibit robust chemical stability, resistance to acids, alkalis, and high temperatures, as well as a low friction coefficient. Consequently, these tubes are considered very suitable for facilitating continuous crystallization processes. The peristaltic pump head poses a challenge in retaining magnetic particles due to their susceptibility to compression and subsequent loss within the tube. This ultimately leads to the depletion of magnetic particles. Nevertheless, the inevitability of this occurrence is attributed to the inherent traits of the peristaltic pump. This study focuses on the optimization of the batch crystallization process of magnetic proteins, with the ultimate goal of achieving a shift from intermittent to continuous crystallization. The National Institutes of Health developed Image J, an image processing programme built on the Java programming language, which is used to evaluate and analyze crystal size distributions quantitatively [26]. By measuring at least 500 crystals in the microscope image and applying an edge length fit for each crystal, a map of the crystals’ size distribution was created.

2. Materials and Methods

2.1. Materials

The lysozyme food additive utilized in the experiment was procured from Yuan Ye Biotechnology Co., Ltd. (Shanghai, China). It has a molecular weight of 14,300 and a BR value of ≥20,000 u/mg. This particular lysozyme was obtained through a process involving the extraction, evaporation, and drying of egg white. A 0.1M solution of sodium acetate buffer was made using sodium acetate (≥99.0%, Aladdin) and the pH was adjusted to 4.6 using acetic acid (Jiuding Chemical, Tianjin, China). The pH was measured using a DWB pH meter (MS-H-Pro+, FE28, Mettler Toledo, Shanghai, China). Solutions of NaCl and lysozyme were prepared using buffer solutions and afterwards subjected to filtration using a 0.22 μm syringe filter.

2.2. Methods

2.2.1. Preparation of PASP-Modified Fe3O4 nanoparticles

Su [24] successfully acquired magnetic nanoparticles. Magnetic Fe3O4 nanoparticles were combined with an excess of poly(aspartic acid-co-lysine) (PASP) at a mass ratio of 8:3 and introduced into distilled water for homogenization. The ultrasonic cell disruptor (SCIENTZ-IID, Xinzhi Biotechnology, Ningbo, China) was utilized at a power level of 150 watts. The system underwent sonication for a duration of 30 min to ensure thorough mixing, followed by continuous stirring for a period of 12 h. The magnetic nanoparticles that underwent modification were subjected to magnetic separation and afterwards rinsed four times with distilled water in order to eliminate any residual free PASP. A portion of the samples was employed immediately for the purpose of lysozyme crystallization subsequent to ultrasonic dispersion. The remaining substance was subjected to drying and ultrasonication prior to its utilization in the process of crystallization.

2.2.2. Screening of Batch Crystallization Conditions

The lysozyme solution exhibited a concentration of 30 mg/mL, whereas the sodium chloride solution possessed a concentration of 5.84% (v/v). The equation representing the degree of supersaturation of the solution is denoted as Equation (1), whereas the equation used to compute the crystallization efficiency is denoted as Equation (2), as presented in Table 1. The solubility values for lysozyme were acquired from the investigations conducted by Nobuko (25) and Skzaki (26). The experimental methodology involved a step-by-step process of introducing the precipitant sodium chloride, magnetic particles, and protein solution into the mold. The mixture was then subjected to crystallization with stirring using an OS20/40-S Mettler Toledo instrument operating at a speed of 120 revolutions per minute. The parameter ω, representing the ratio of the mass of magnetic particles to the mass of lysozyme, was determined to be 15%. The quantity of lysozyme was determined using a UV spectrophotometer (UV2700, Shimadzu, Shanghai, China), while the crystal shape was analyzed using an optical microscope (IX83, Olympus, Tokyo, Japan) and a field emission scanning electron microscope (Quanta 450 FEG, FEI, Shanghai, China).
S = C C
Y i e l d = C C i C × 100 %
The variable C represents the beginning concentration of the lysozyme solution. C denotes the solubility of lysozyme under specific conditions, namely at a temperature of 20 °C, pH of 4.6, and a certain NaCl content. C i refers to the standard curve of lysozyme, which is utilized to determine the actual concentration.

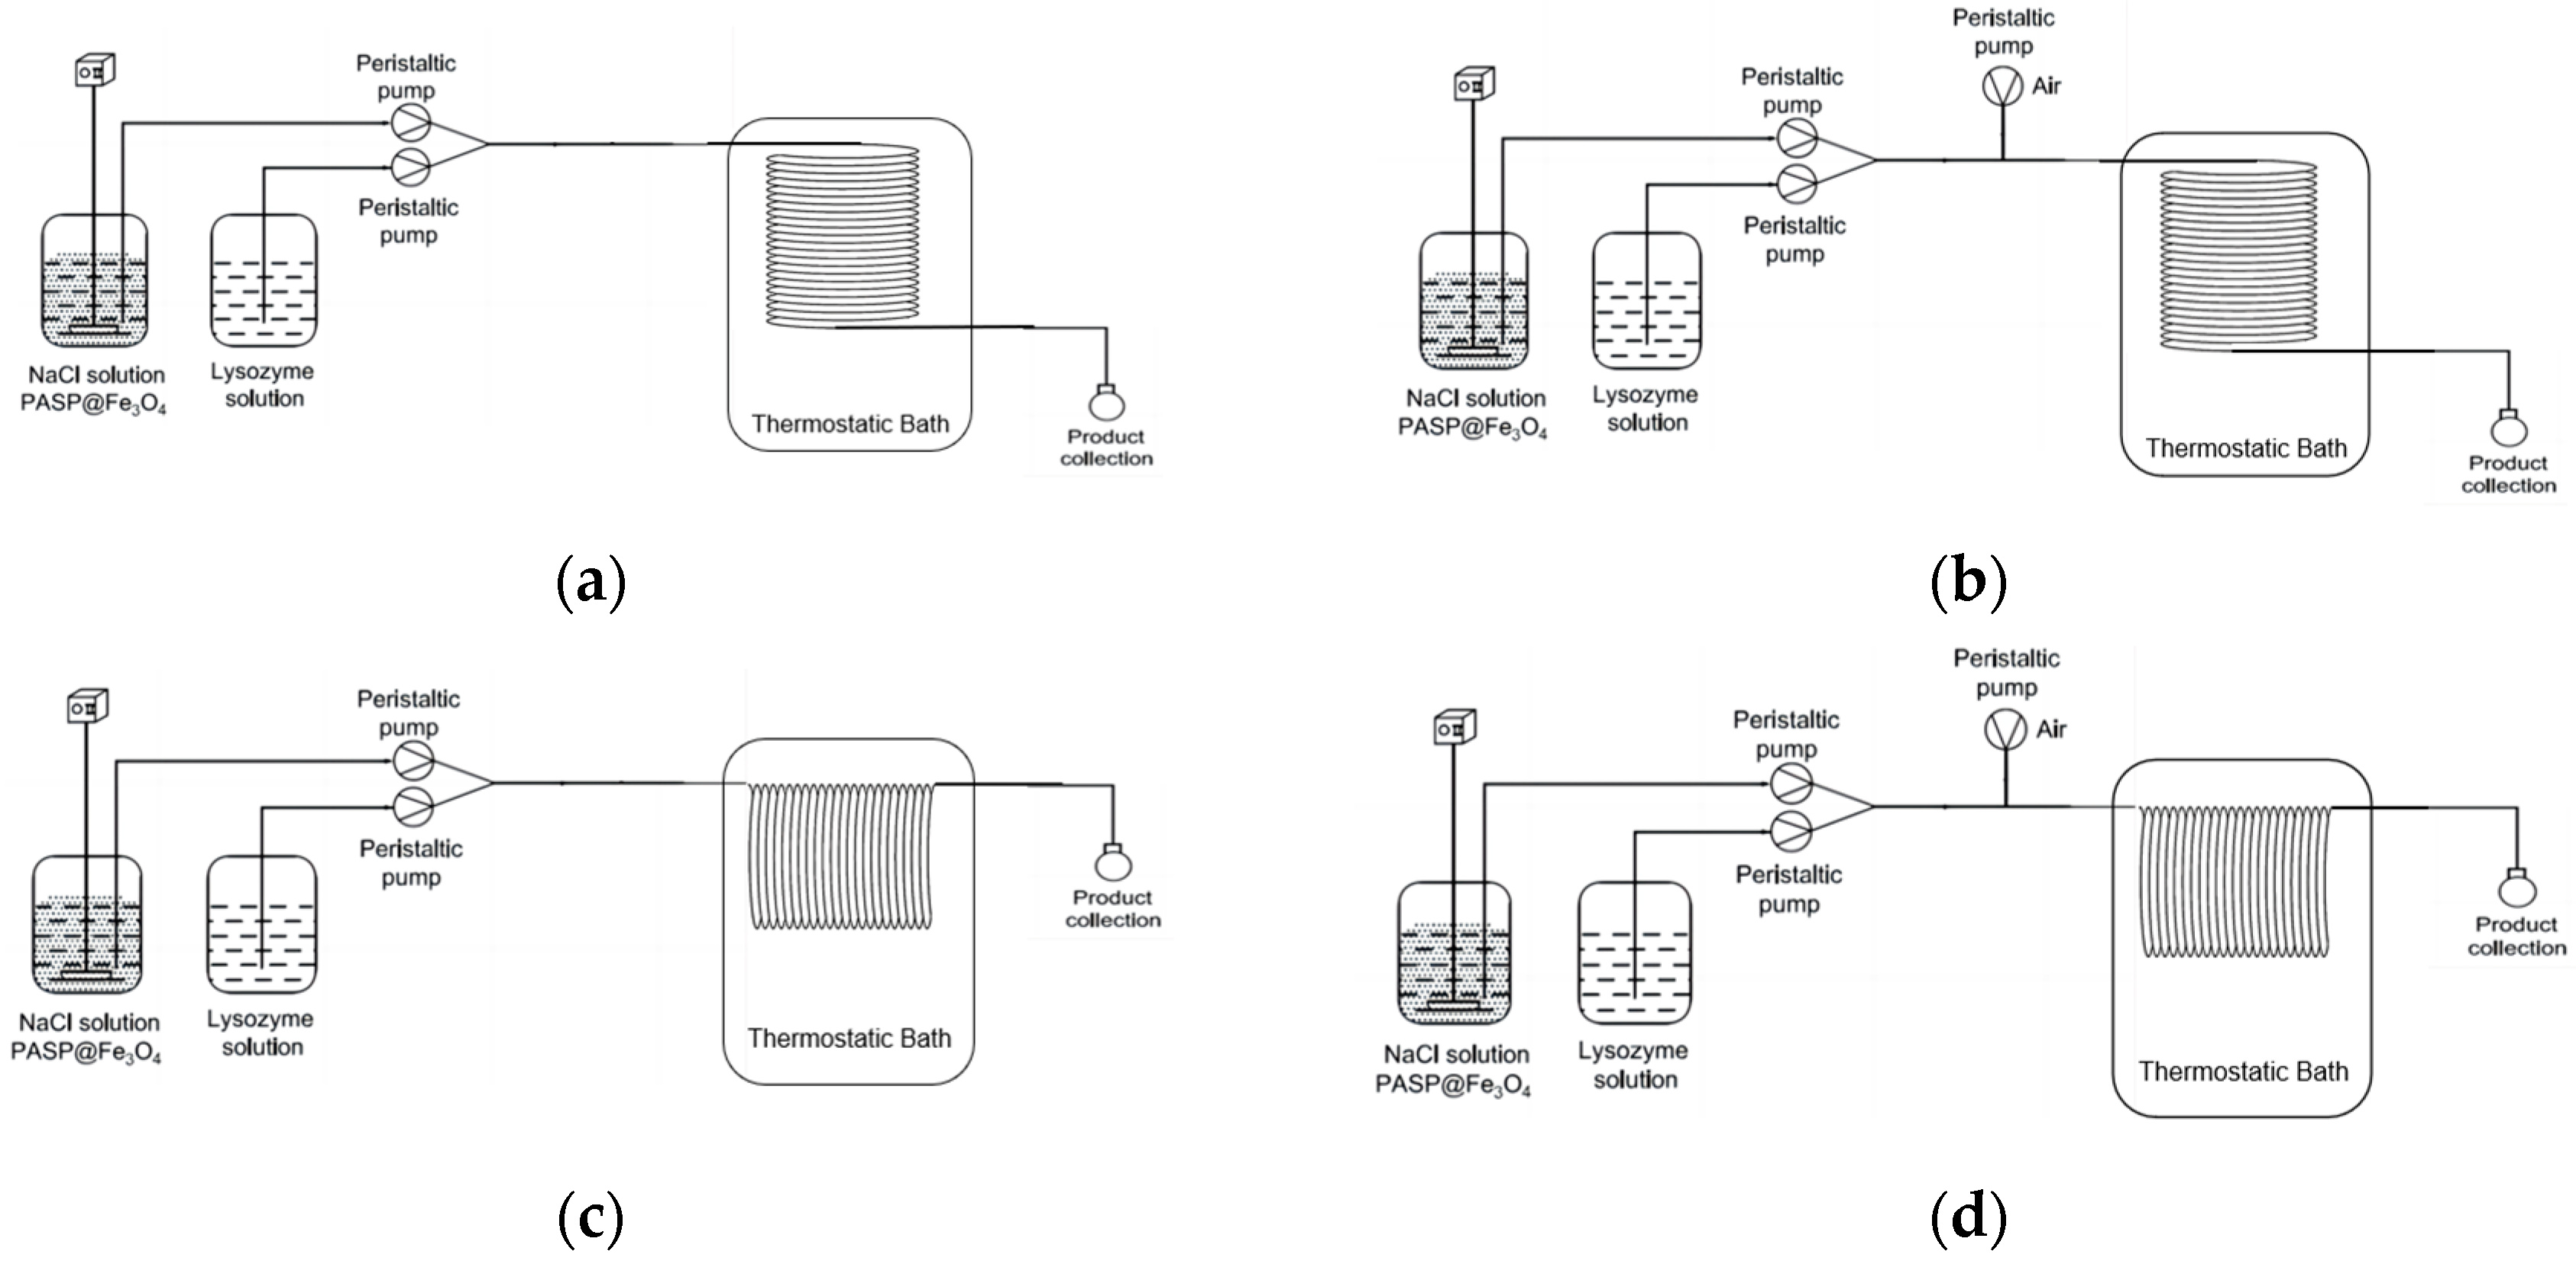
2.2.3. Selection of Continuous Crystallizer

The stability of the solution flow pattern in the pipeline is mostly influenced by the rate at which air and liquid move. The flow rate parameters necessary for achieving stabilization of the droplet size distribution were investigated in this study, with water serving as the liquid phase and air as the gas phase. The investigation focused on evaluating the stability of the droplet flow within the central region of the pipe using quantitative weighing. Subsequently, an optimal flow rate was determined. Upon the formation of stable droplets within the pipe, a total of 20 droplets were collected at the output of the pipe. The collector was subjected to pre- and post-collection weighing procedures, wherein the weight of the collected droplets was determined. Subsequently, the relative standard deviation (RSD) was computed.
q v L 1 = 1.8357 n L 1 0.0679 R 2 = 0.9999
q v L 2 = 1.8369 n L 2 + 0.1912 R 2 = 0.9993
q v G = 2.9681 n G 0.3369 R 2 = 0.9993
q v L = q v L 1 + q v L 2
The variables q v G , q v L and n G , n L represent the volumetric flow rate and rotational speed of the air–liquid peristaltic pump, measured in milliliters per minute (mL/min) and revolutions per minute (rpm), respectively.
R S D = S x × 100 % = i = 1 10 ( x i x ¯ ) 2 n 1 x ¯ × 100 %
In this context, the variable n represents the number of samples, s is the standard deviation, and x ¯ signifies the mean of the samples.

2.2.4. Push Flow Crystallization (PFC)

Magnetic particles, comprising 15% of the total mass of lysozyme, are introduced into the sodium chloride solution and subsequently agitated through stirring. The lysozyme concentration in the solution is 30 milligrams per milliliter, whereas the sodium chloride content is 5.84 percent by weight per volume. The flow rate within the tube crystallizer can be determined by adding together the individual flow rates of the lysozyme solution and the NaCl solution. The lysozyme and sodium chloride solutions are combined by using of Y-type tee and afterwards introduced into the tube. Experiments were conducted to investigate the horizontal and vertical location of the tube crystallizer, as depicted in Figure 1.

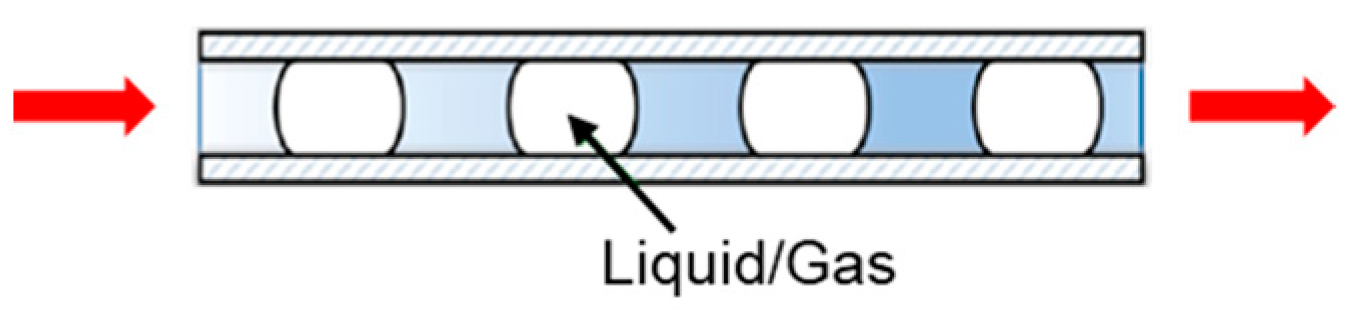
2.2.5. Slug Flow Crystallization (SFC)

Magnetic particles, comprising 15% of the total mass of lysozyme, are introduced into the sodium chloride solution and through stirring. The lysozyme concentration in the solution is 30 milligrams per milliliter, whereas the sodium chloride content is 5.84 percent by weight per volume. The flow rate within the tube crystallizer can be determined by adding together the individual flow rates of the lysozyme solution and the NaCl solution. The lysozyme and sodium chloride solutions are combined by using of a Y-type tee and afterwards introduced into the tube. Add a peristaltic pump after the Y-junction to force air into the conduit. Experiments were conducted to investigate the horizontal and vertical location of the tube crystallizer, as depicted in Figure 1.
ε L = q v L q v G
The variables q v L and q v G represent the respective flow rates of the liquid phase and the gas phase.

3. Results

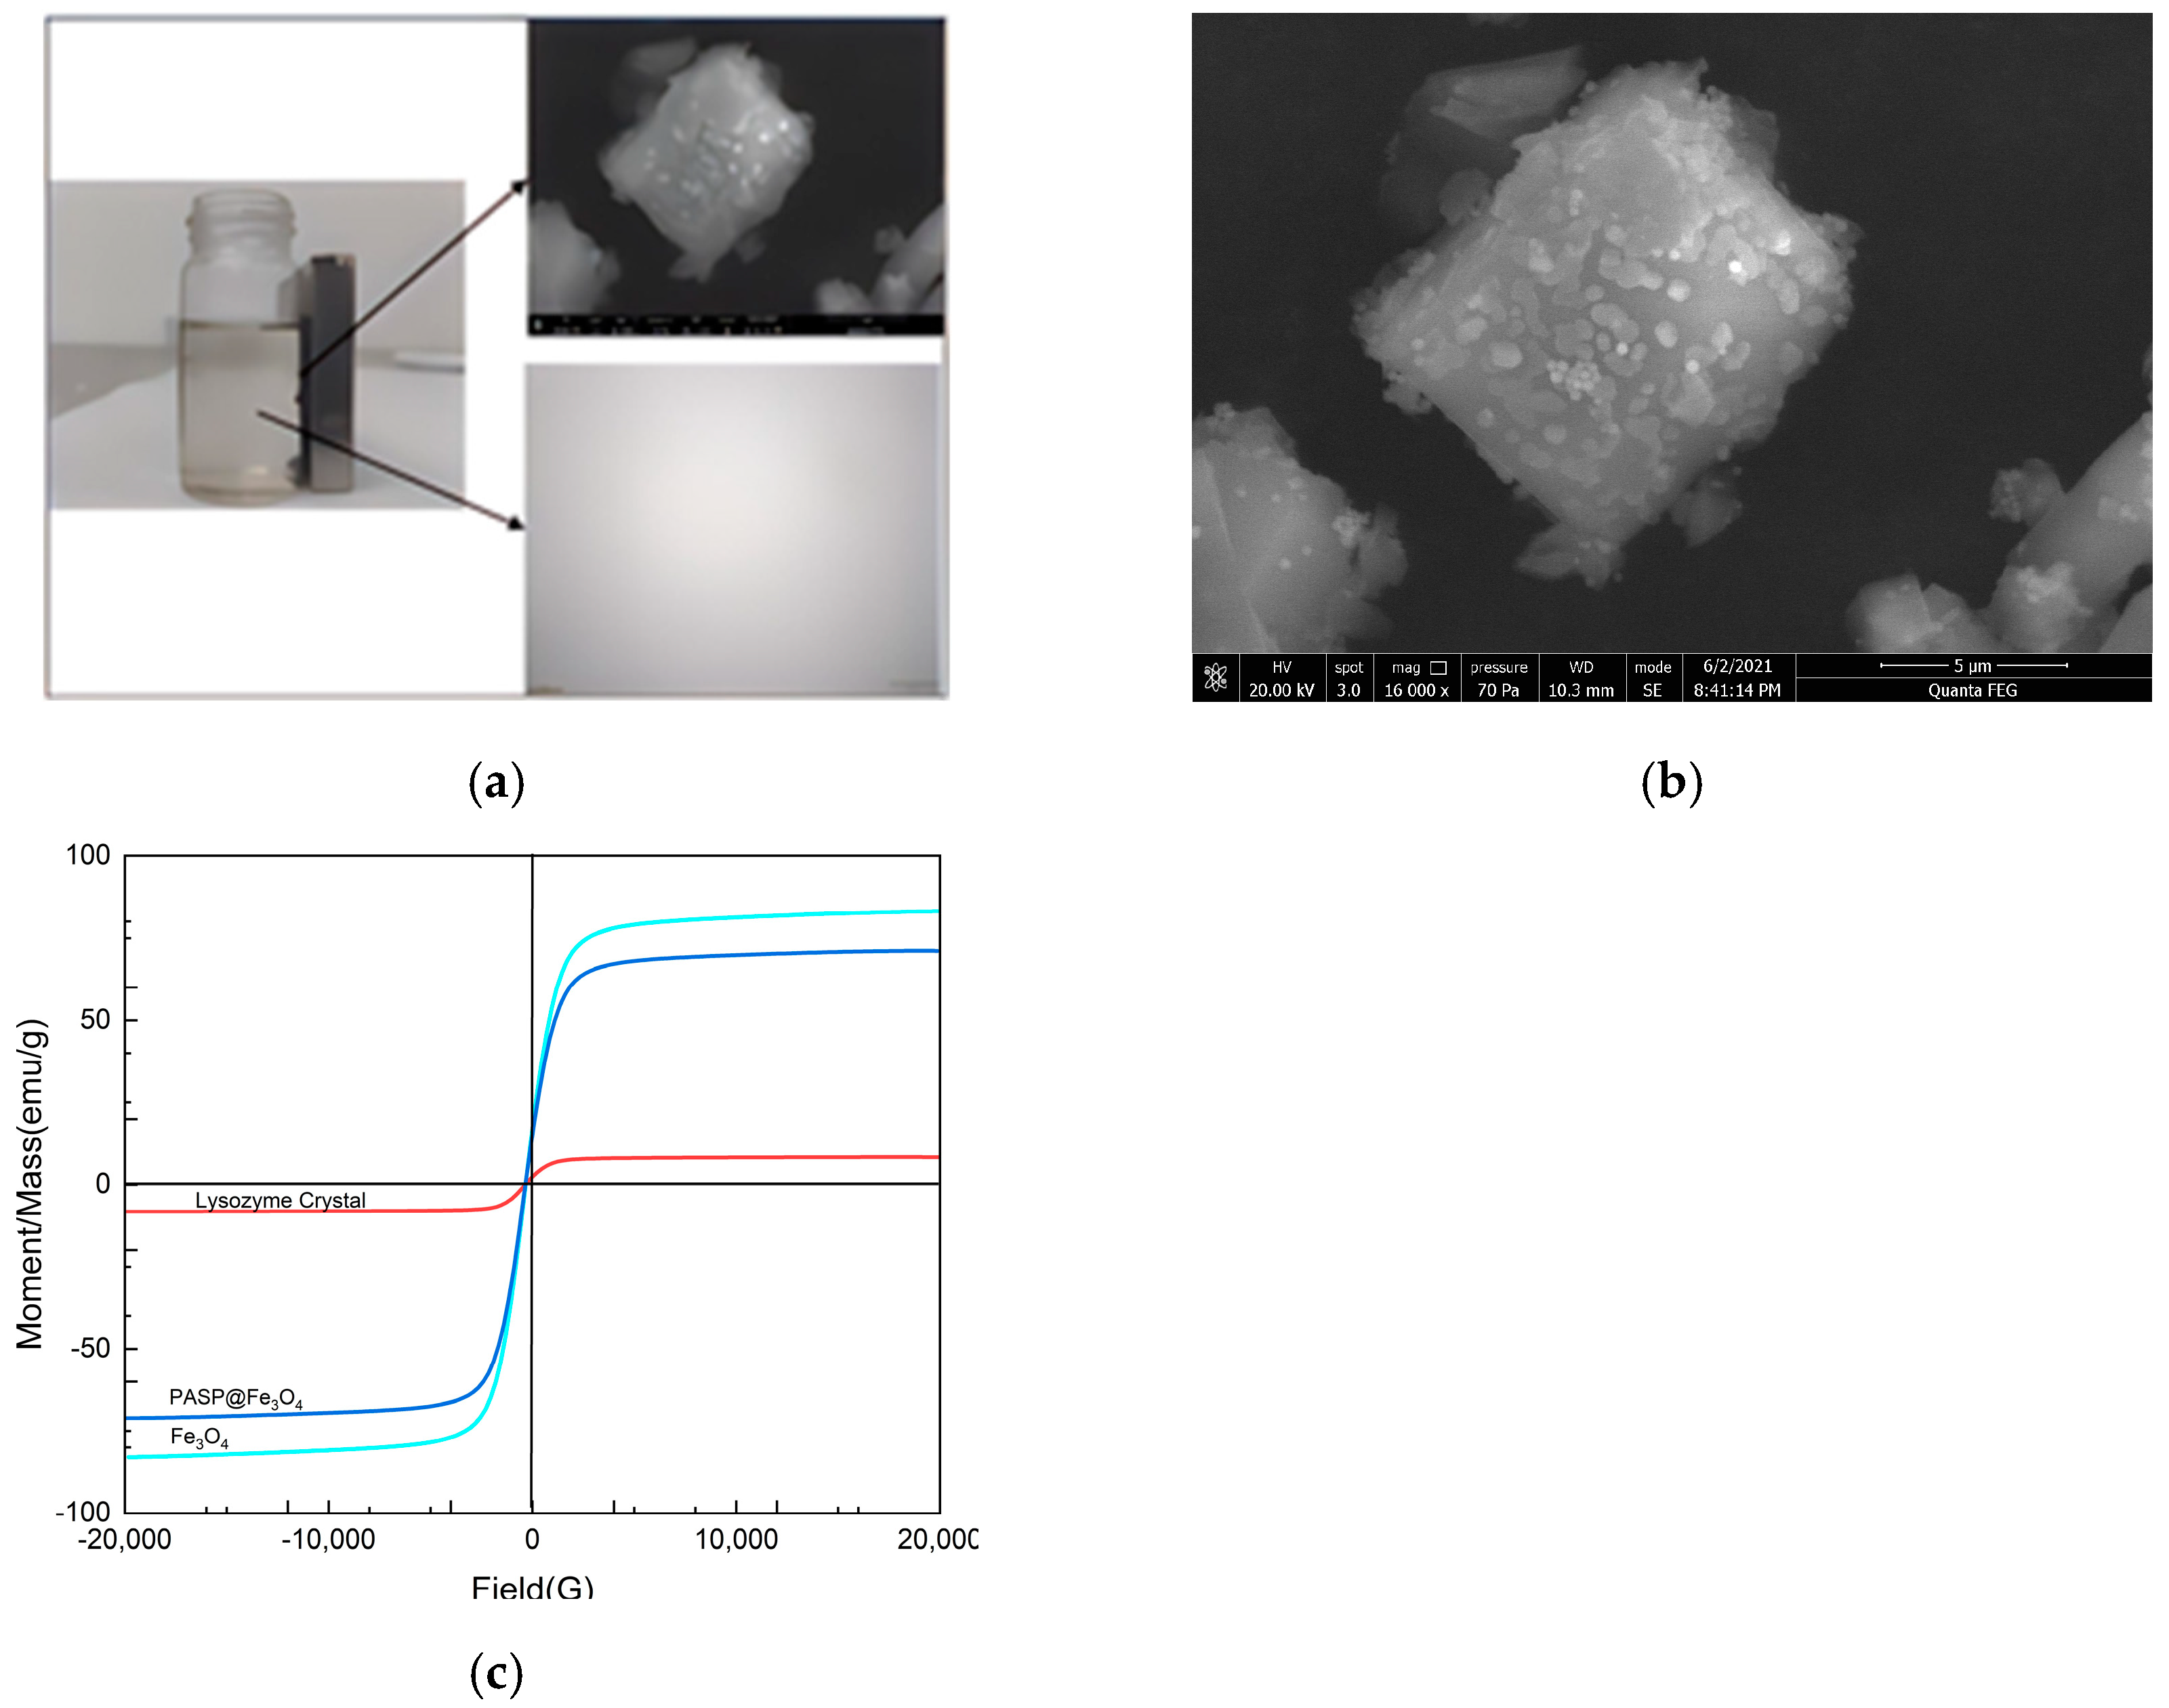
3.1. Characterization of PASP-Modified Fe3O4 Nanoparticles

The experiment employed magnetic Fe3O4 nanoparticles with a size ranging from 100 to 200 nm. The scanning electron microscopy (SEM) picture of Fe3O4 nanoparticles is depicted in Figure 2a. PASP exhibits solubility in aqueous solutions. Upon completion of the modification, the unbound polyacrylamide sodium polyphosphate (PASP) present in the water will undergo a comprehensive cleansing procedure to ensure its full removal. The findings are presented in Figure 2b, which illustrates a comparison of the infrared spectra (V80, AXS, Karlsruhe, German) of Fe3O4, PASP, and PASP @ Fe3O4. Both PASP and PASP @ Fe3O4 exhibit a large absorption band corresponding to the O-H stretching vibration, observed at around 3329 cm−1. The absorption peak observed at 1645 cm−1 corresponds to the stretching vibration of the C=O bond, while the absorption peak observed at 3075 cm−1 corresponds to the stretching vibration of the O-H bond. The presence of a distinct peak at 1400 cm−1 in the C-N stretching vibration spectrum provides evidence for the effective alteration of Fe3O4 via PASP. The absorption peak seen at around 574 cm−1 corresponds to the stretching vibration characteristic absorption peak of the Fe-O bond in the metal tetrahedron structure. This peak provides evidence for the presence of Fe3O4 in the magnetic particles.

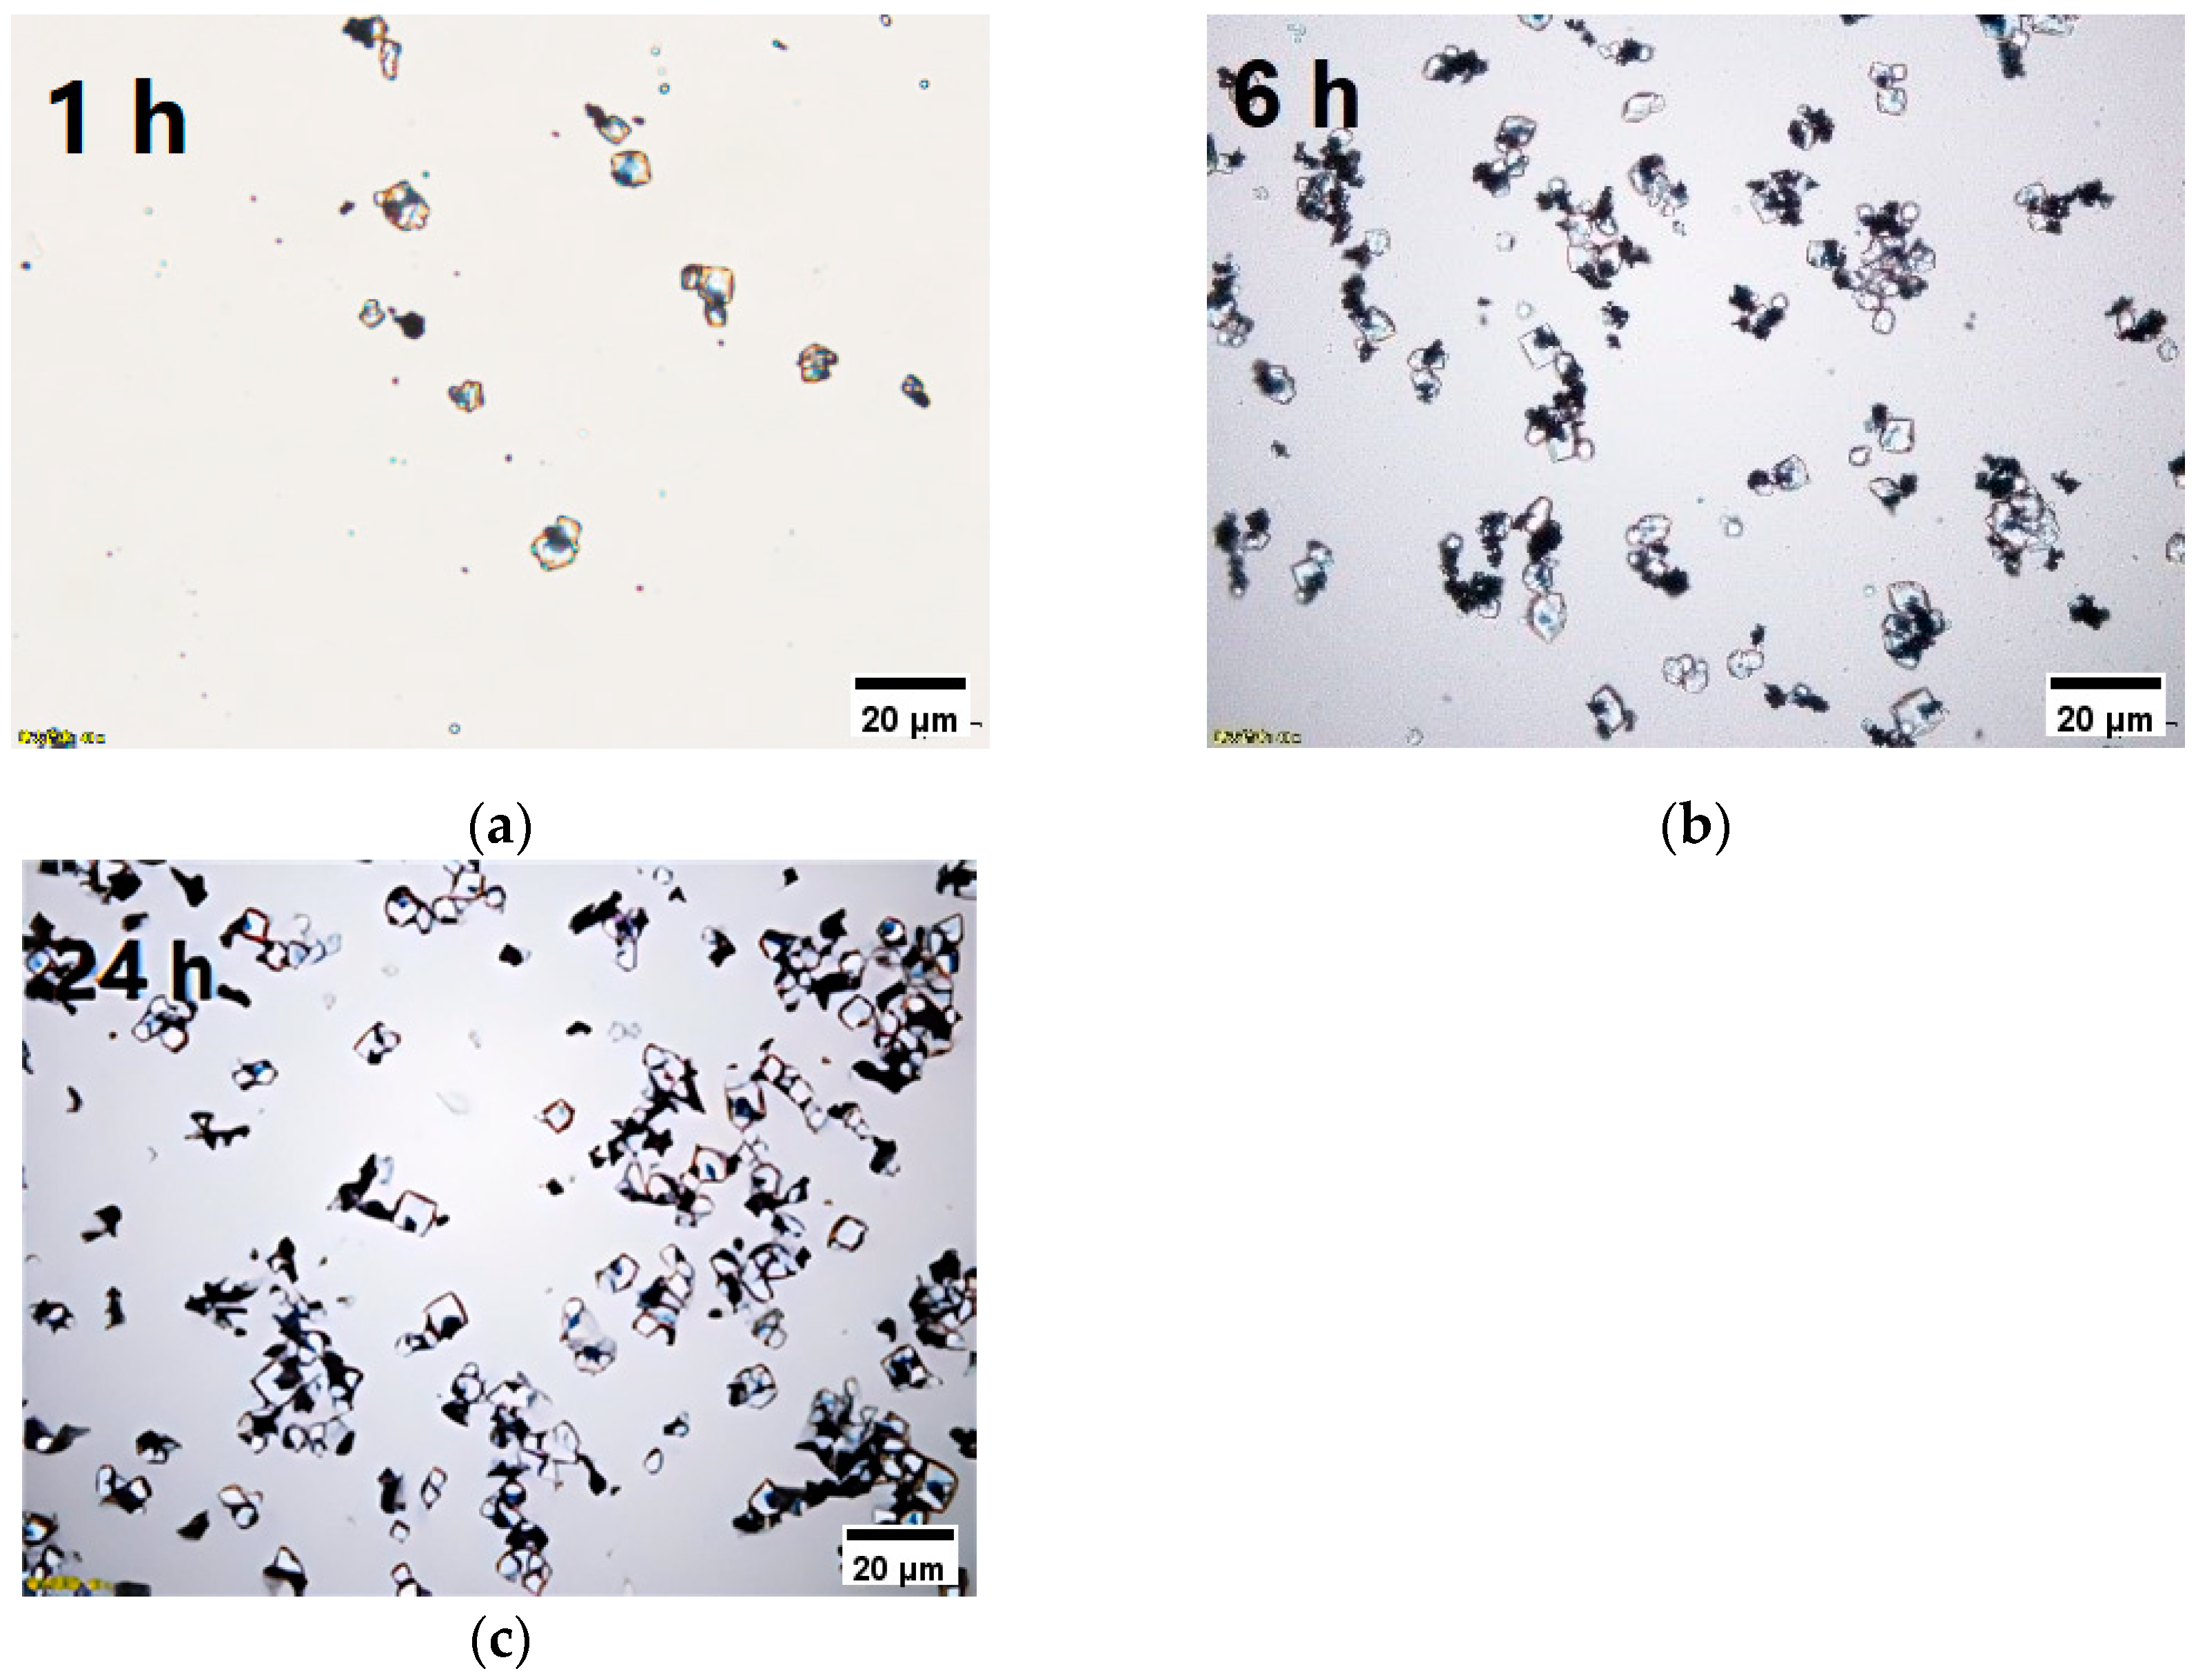
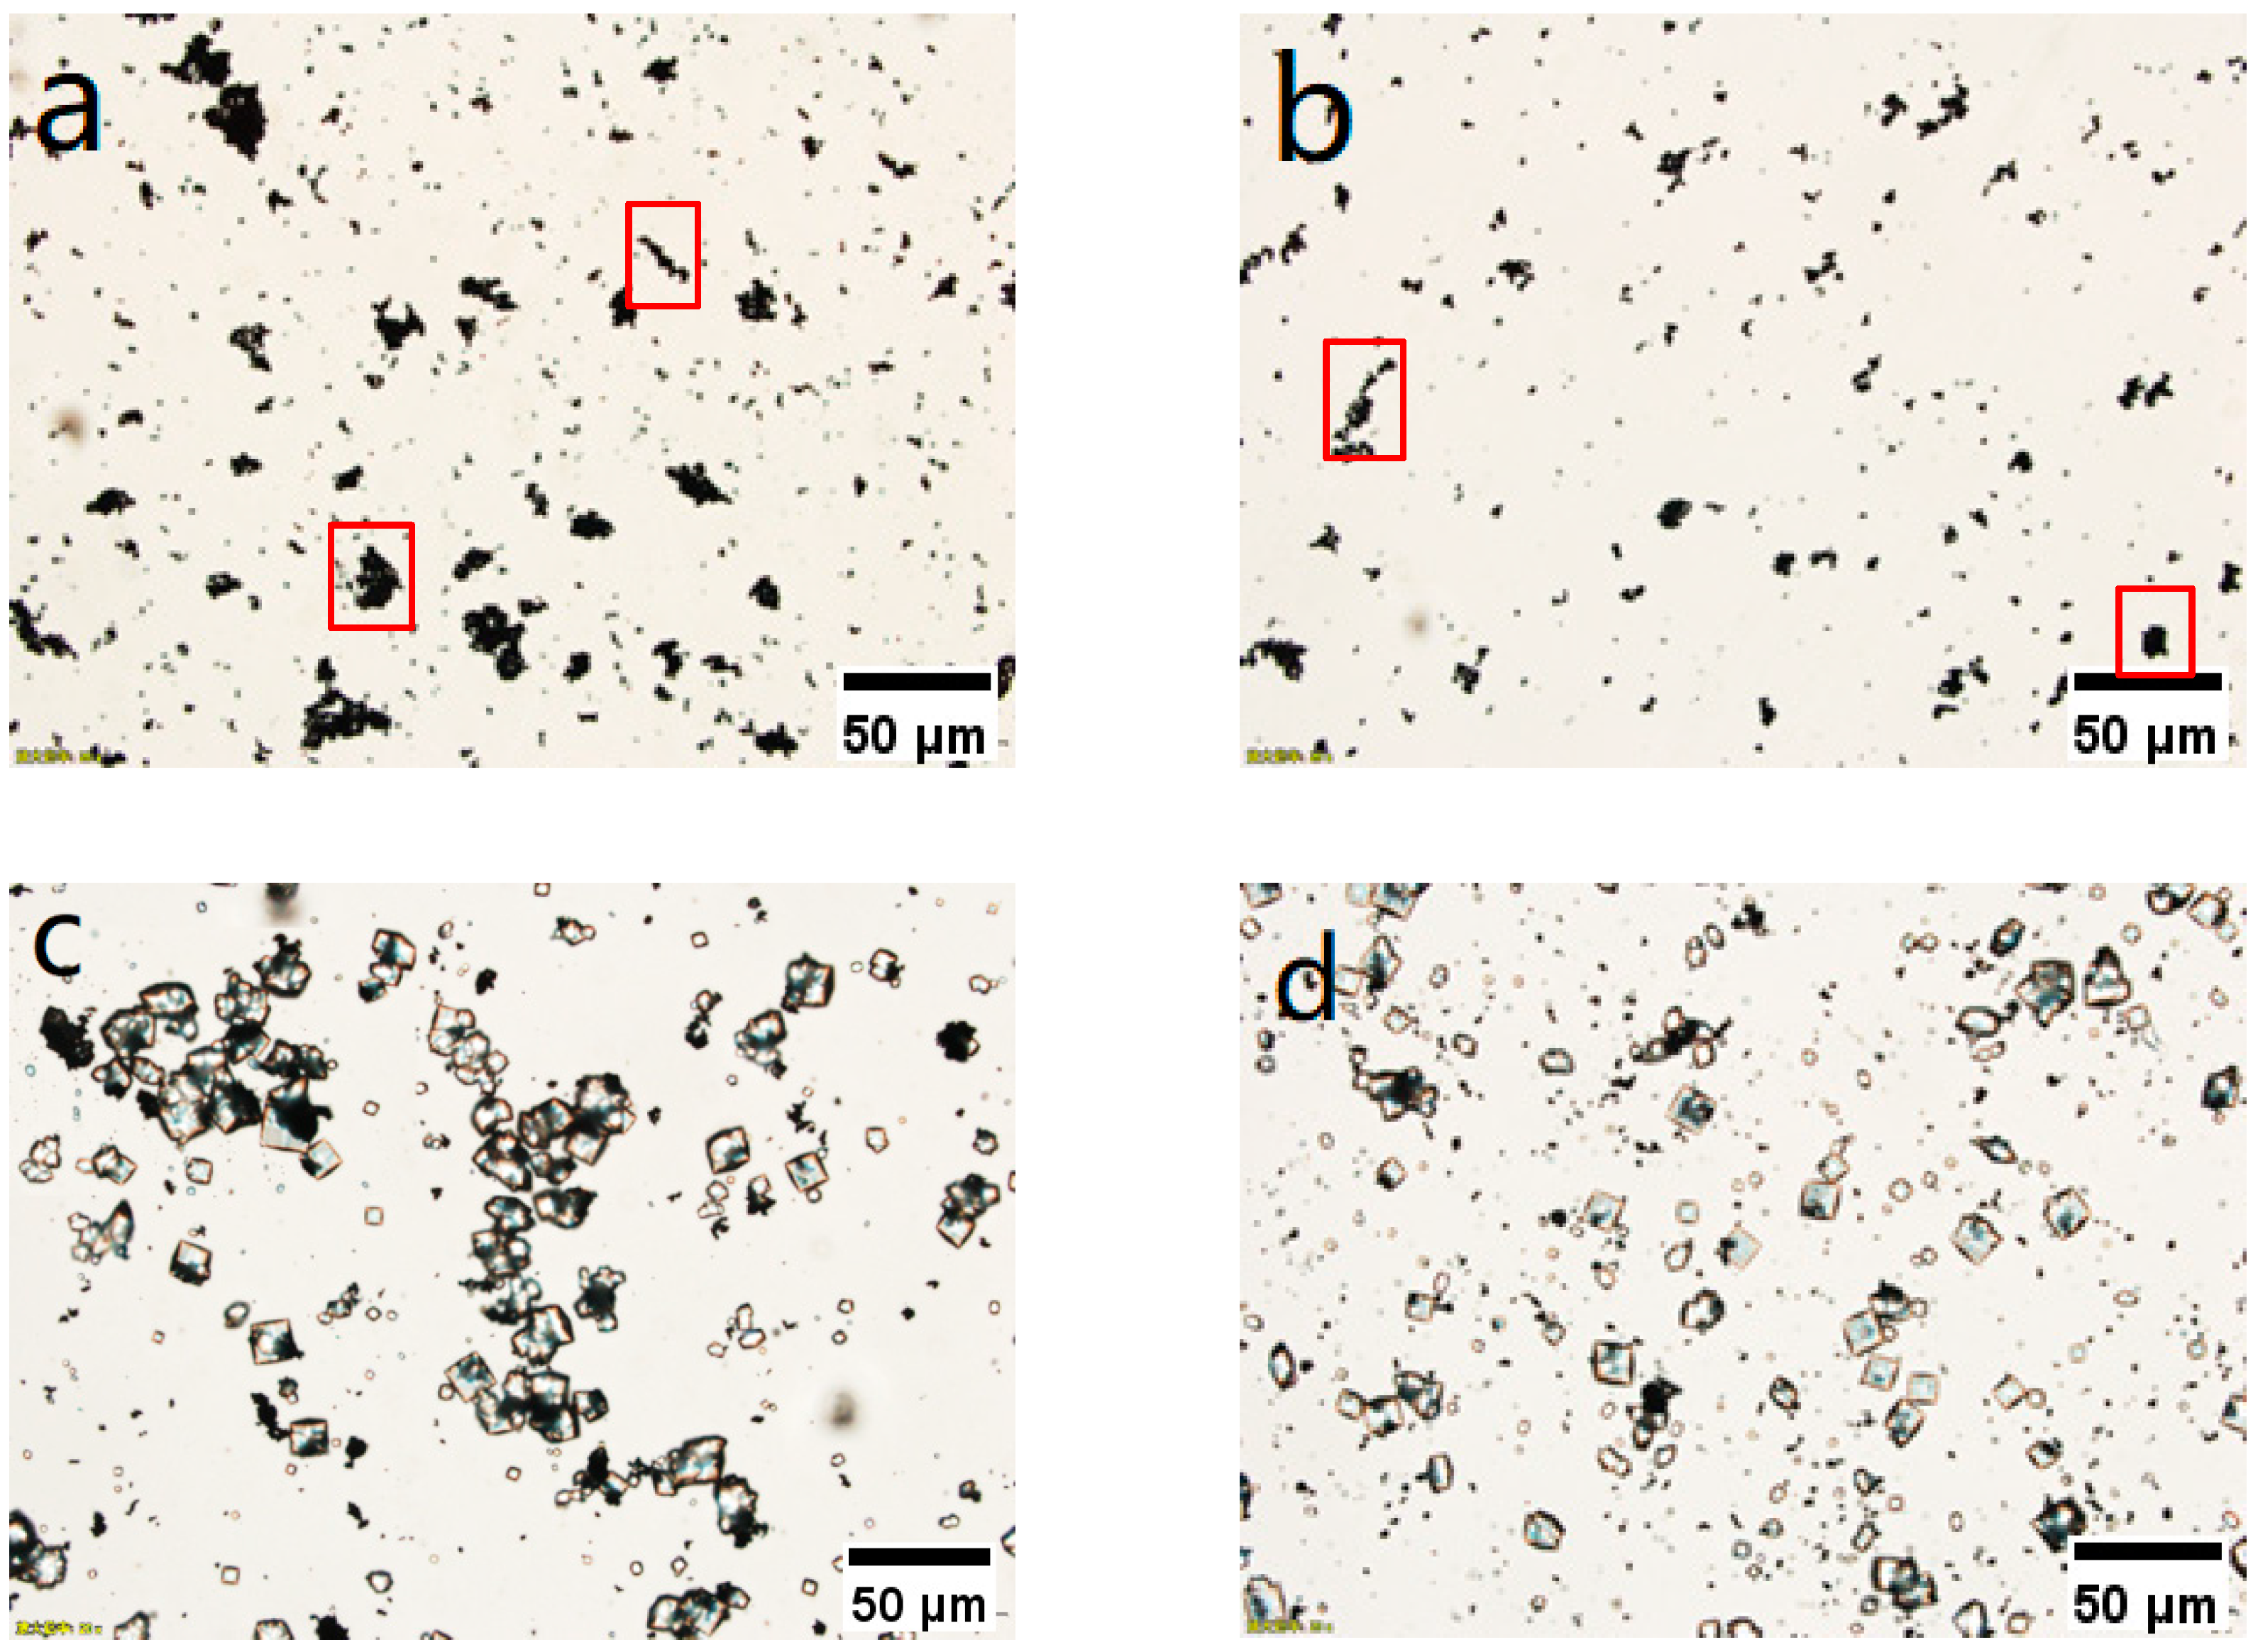
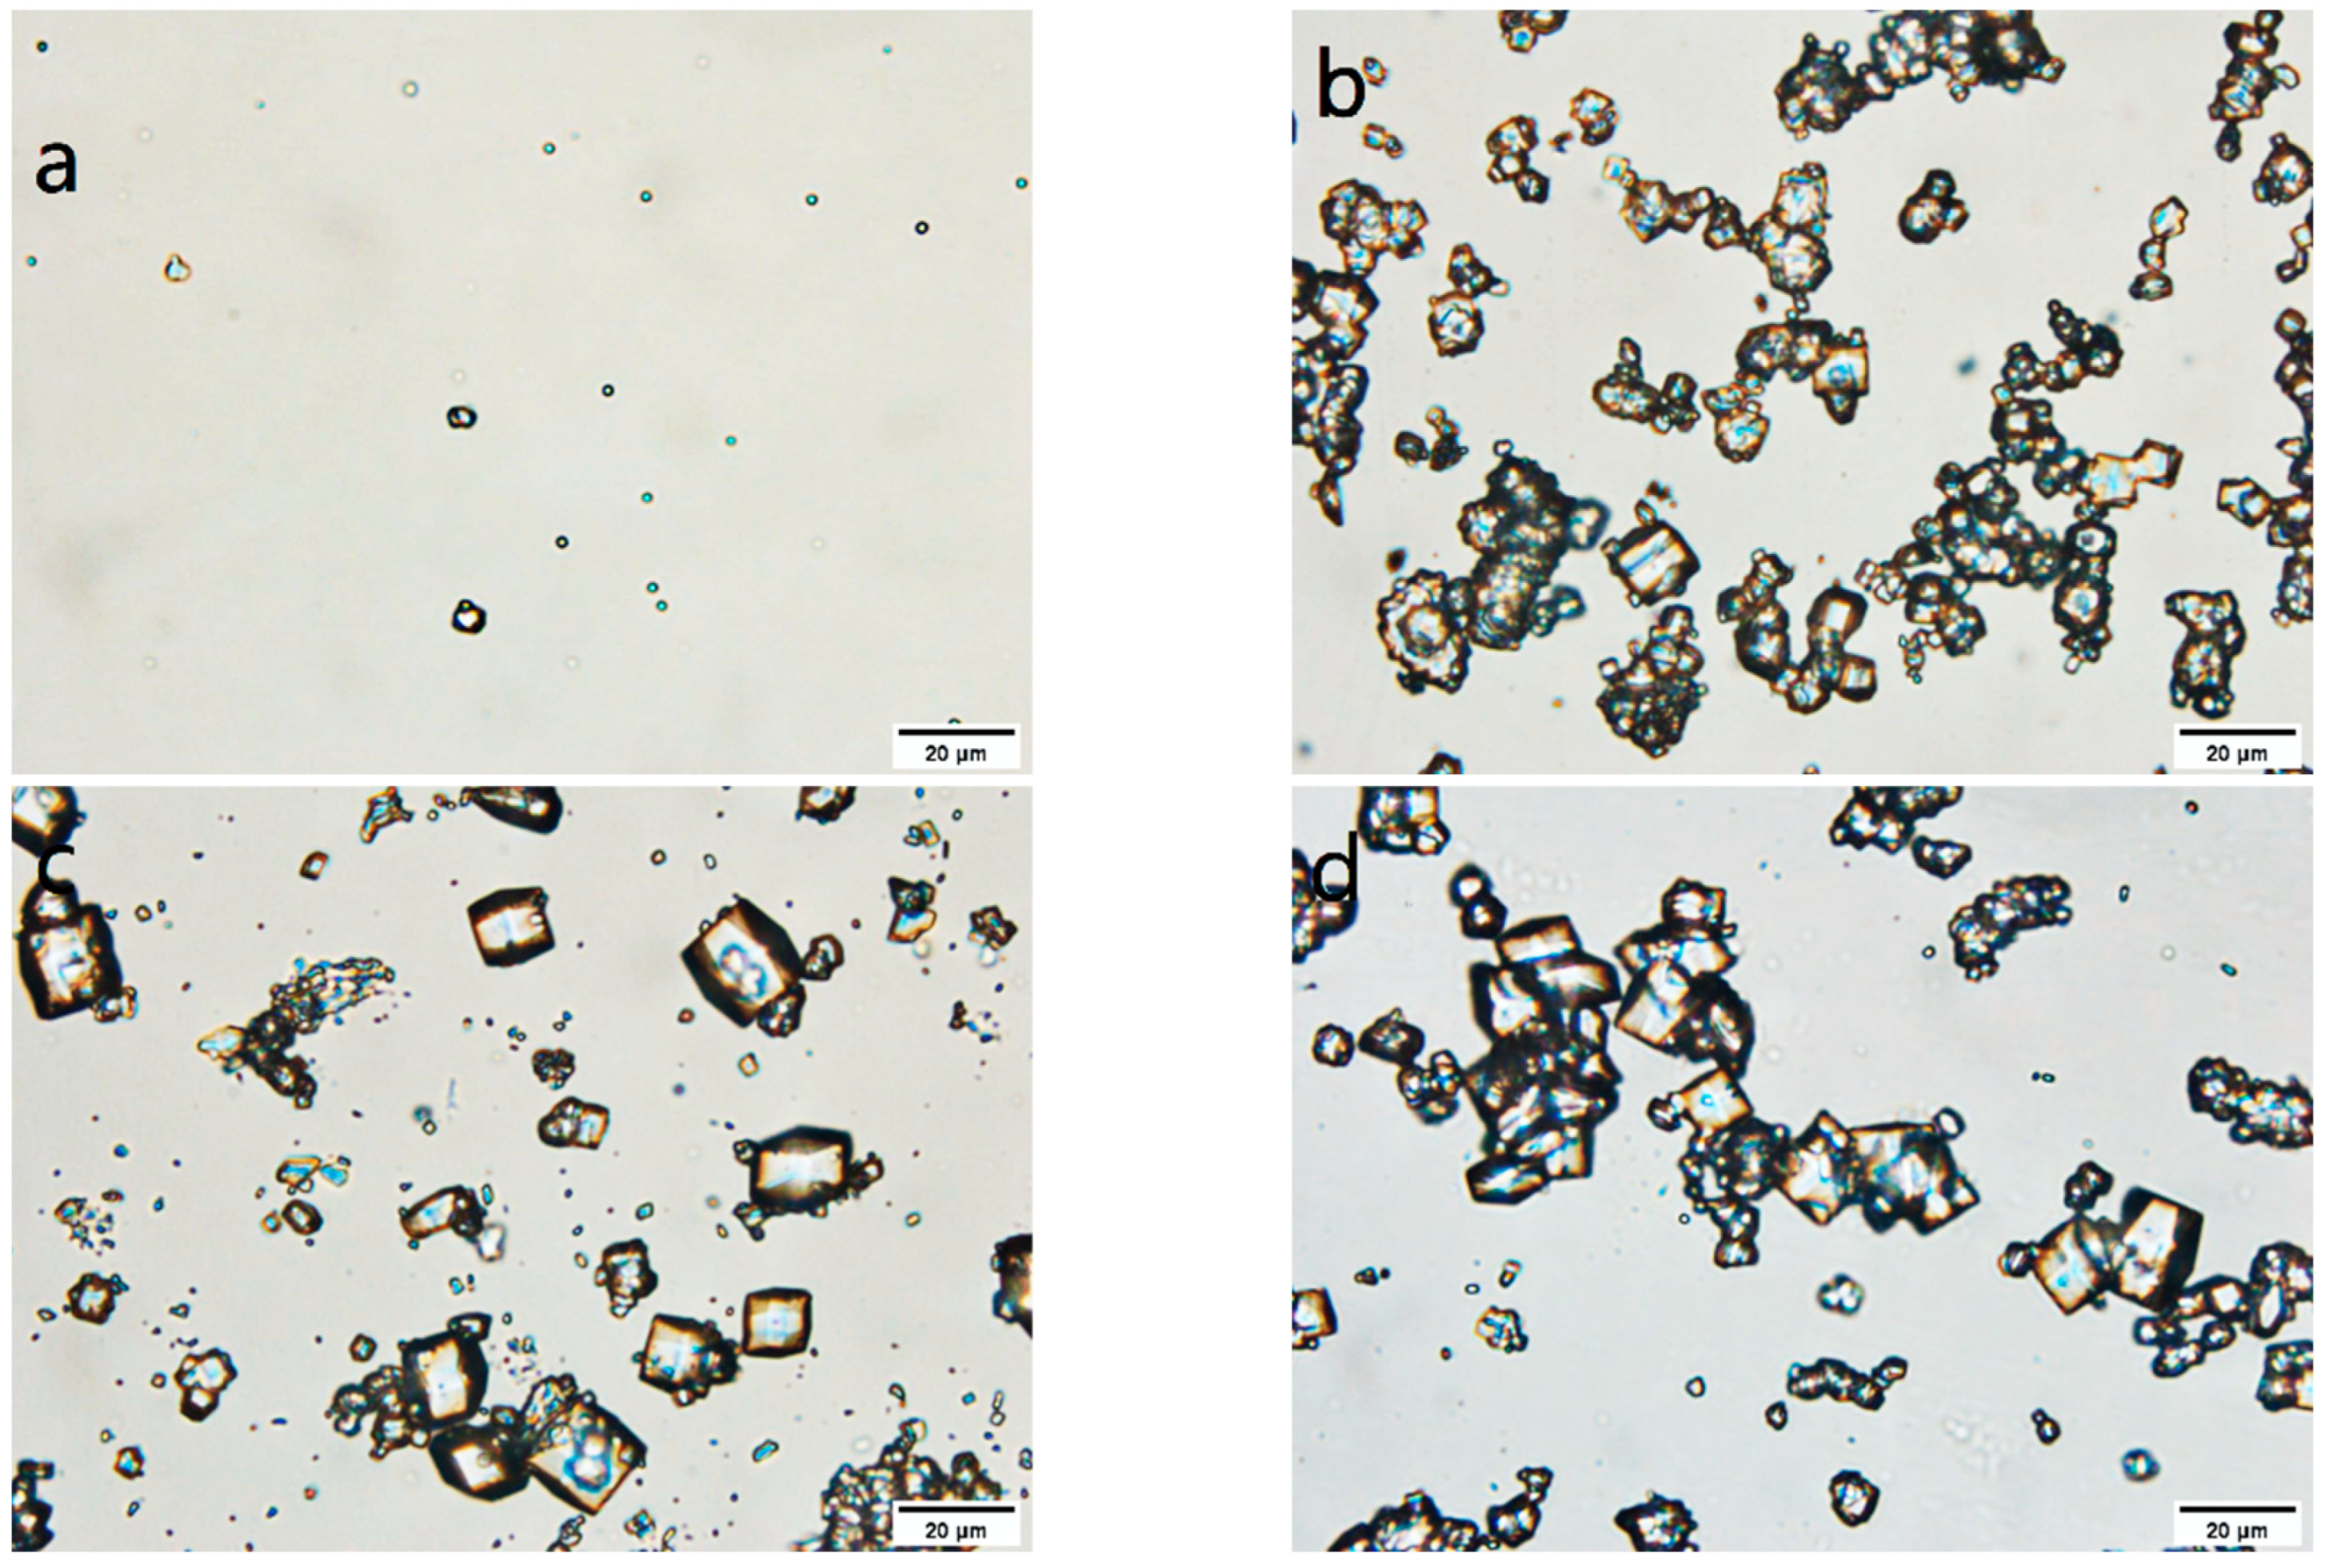
3.2. Screening of Intermittent Crystallization Conditions

The batch crystallization process at a concentration of 18.75 mg/mL of lysozyme and 5.84% (w/v) of NaCl is depicted in Figure 3. Lysozyme crystals were not observed using a biomicroscope (IX83, Olympus, Tokyo, Japan) until around 5.5–6 h after the initiation of crystallization. Furthermore, once formed, the crystals remained unchanged for a period of 24 h. The crystallization procedure was conducted using a sodium chloride (NaCl) concentration of 5.84% (w/v).
To expedite the process of crystallization and enhance the overall output, we conducted an additional sets of trials utilizing varying doses. Figure 4d illustrates the variation in concentration of the lysozyme solution. Upon reaching equilibrium, the concentration remained nearly constant. At this point, the supersaturation of lysozyme was depleted, indicating the cessation of crystallization. Additionally, we performed tests with lysozyme concentrations higher than 30 mg/mL and NaCl concentrations greater than or equivalent to 6%. Although the nucleation rate is excessively high under these circumstances, tubular crystallization is not encouraged. Figure S1 depicts microscopic pictures of magnetic lysozyme crystals obtained at various levels of supersaturation. The crystallization yield was determined by calculating the concentration at this stage, and the corresponding results are presented in Table 1. In order to optimize the crystallization process, we made a decision to prioritize a larger yield and a comparatively shorter residence time. Consequently, we established the concentration of lysozyme at 30 mg/mL and the NaCl content at 5.84% (w/v) as the standardized parameters for all subsequent experimental procedures.
The conducted crystallization studies involving batches supplemented with magnetic particles exhibited the presence of both tetragonal and rhombic crystal structures. The presence of magnetic particles facilitates the self-assembly process of lysozyme crystals, aligning with the theoretical framework described in the existing literature [24]. The particles that exhibit magnetic properties, known as magnetic particles, are characterized by their paramagnetic nature. These particles function as magnetic nuclei both within the interior and on the surface of lysozyme crystals. Consequently, they have a discernible impact on the anisotropy of the magnetic induction strength of these crystals. In certain instances, it was shown that both the grains and the growing lysozyme crystals exhibit a specific orientation, which subsequently gives rise to distinct growth rates along each axis. Consequently, this phenomenon contributes to the emergence of diverse morphologies. The inclusion of paramagnetic salts as nucleating agents yielded similar outcomes as reported in the existing literature [27]. In our experimental investigations, we observed a comparable occurrence wherein specific magnetic lysozyme crystals exhibited the disappearance of faces as (1 0 1) and (1 1 0). This phenomena can likely be attributed to the differential growth rate exhibited by these facets in comparison to the remaining facets.
Two treatment procedures were employed for the modified magnetic particles. The first way involved a sequence of water washing, drying, and subsequent ultrasonic dispersion. The second method consisted of water washing followed by a brief immediately ultrasonic treatment. Figure 5 presents microscopic pictures of the magnetic particles and lysozyme crystals acquired by both procedures in the absence of a lysozyme solution. The magnetic nanoparticles exhibited two distinct aggregation morphologies, namely chain and cluster formations. The aggregation effect was more pronounced in magnetic nanoparticles that underwent magnetic drying. The crystallization tests were carried out using an initial concentration of lysozyme at 30 mg/mL, NaCl at 5.84%, and the addition of magnetic particles at a concentration of 15%. The integration of the two systems was achieved by a sequential process. Initially, the magnetic nanoparticles that underwent modification were subjected to adsorption and subsequent washing using a magnet to remove any residual-free polyaspartic acid (PASP). Subsequently, a dissolved sodium chloride (NaCl) buffer solution was introduced into the crystallizer. Finally, the solution containing lysozyme was added to complete the process. Figure 5c displays the microscopic images of lysozyme crystals acquired during the implementation of method I, wherein magnetic nanoparticles were utilized to induce lysozyme crystallization for a duration of 60 min. Figure 5d illustrates the magnetic lysozyme crystals acquired by the second methodology. The data presented in the image demonstrate that the aggregation pattern observed in magnetic lysozyme crystals is similar to that observed in magnetic particles, chains, or clusters. The results suggest that the aggregation of magnetic particles may contribute to the aggregation of lysozyme crystals. The phenomena of lysozyme crystals’ aggregation can be greatly mitigated through the successful prevention of magnetic nanoparticles’ aggregation.
The produced lysozyme crystals had a black-gray coloration and were conveniently isolated from the solution using magnet-assisted adsorption. As shown in Figure 6a, a magnet was placed on the right side of the collection bottle, and the naked eye could see that the magnetic lysozyme crystals were adsorbed to the wall of the bottle; microscopic examination of the solution did not reveal any crystals. The magnetization curves of magnetic lysozyme crystals were acquired using a sample magnetometer (VSM, 7407, Lake Shore, OH, USA) while subjecting them to vibrations at room temperature, as depicted in Figure 6c. The magnetic flux density of Fe3O4 reached saturation at a value of 83.17 emu/g, resulting in a residual flux density of 19.17 emu/g. The magnetic flux density of PASP@Fe3O4 nanoparticles was found to be 72.18 emu/g, while magnetic lysozyme crystals exhibited a saturation value of 9.89 emu/g. Following the cessation of the external magnetic field, the residual magnetic flux densities were observed to be 17.36 emu/g and 2.78 emu/g, as depicted in Figure 6c. The magnetically attracted particles that were adsorbed by the magnet exhibited a tendency to aggregate and form clusters. As depicted in Figure 6b, a significant quantity of magnetic nanoparticles were enclosed and dispersed within the lysozyme crystals, both internally and externally. This may potentially contribute to the phenomenon of aggregation. Despite the removal of the external magnetic field, magnetic lysozyme exhibits enduring magnetic characteristics and the phenomena of magnetic aggregation continues to remain. This phenomenon could potentially elucidate the process of magnetic lysozyme crystal aggregation. The addition of magnetic particles resulted in an increase in crystallization yield, saturation magnetic flux density (Ms), and residual flux density (Mr), as shown in Table 2. Nevertheless, the increase in yield of crystallization was not statistically significant, suggesting that the incorporation of magnetic nanoparticles did not exert a substantial impact on the crystallization process.

3.3. Selection of Continuous Crystallizer

A total of nine distinct combinations of gas and liquid velocities were examined in order to investigate the formation of slug flow. Formula 7 was employed to compute the relative standard deviation (RSD) across various gas–liquid rates in order to assess the stability of slug flow. The empirical findings are presented in Table 3.
The primary factor contributing to slug flow instability in continuous crystallization studies with a peristaltic pump is the occurrence of pulsations and back-mixing during fluid transportation, which arise as a result of the distinctive properties of the pump. According to the data presented in Table 3, it can be observed that when the liquid-phase flow rate is held constant, changes in the gas-phase flow rate (namely in groups 1–5 or 6–8 and group 9) result in an amplification of the disparity between the liquid-phase and gas-phase flow rates. Consequently, this amplification contributes to heightened instability in the slug flow. This result is consistent with the research conducted by Su (21) and Wu (28). It is worth mentioning that the groups 3, 8, and 9 exhibit εL values near to 1 and have relatively modest relative standard deviations in their liquid-phase masses while the liquid-phase flow rate remains constant. This observation suggests that there is a relative stability in the slug flows created at these specific gas–liquid flow rates.
The experimental setup for selecting a continuous crystallizer is depicted in Figure 7. Figure 8 illustrates the microscopic images of magnetic lysozyme crystals acquired at the outlet of the test tube, employing identical flow rate (1.98 mL/min) and crystallization duration (60 min). The produced lysozyme crystals exhibited a tetragonal and rhombic morphology consistent with the crystal form observed in previous studies utilizing the batch crystallization technique.
The solution is introduced into the crystallizer by the upper inlet and is discharged through the bottom outlet of the tube, as depicted in Figure 7a,b. In order to acquire lysozyme crystals, the droplets located near the outlet of the collection tube were examined using a microscope. The solution exhibited predominantly horizontal flow with minimal vertical flow. The H-PFC crystallizer exhibited droplets with poor crystallization rates upon completion of production, suggesting the presence of two potential factors contributing to this occurrence. There are perhaps two causes for this phenomena. One of the reasons is that horizontal flow crystallizers lack the ability to effectively mix the solution within confined channels while operating at low flow rates. After the initiation of lysozyme nucleation, the crystals exhibit rapid deposition in the lower region of the tubular crystallizer during the growth stage. Another important aspect to take into account is the introduction of particles into the horizontal flow crystallizer, which then gather in the bottom portion of the pipeline due to the nucleation process associated with lysozyme. The act of visually observing black magnetic particles clinging to the inner surface of the crystallizer tube at its entrance was conducted without the aid of magnification. The magnetic particles had a limited role in the initiation of lysozyme crystallization. However, the H-SFC crystallizer provides evidence of the presence of magnetic lysozyme crystals, but with a greater tendency towards aggregation. Based on the aforementioned data, it can be deduced that the SFC crystallizer exhibits a higher degree of appropriateness for the crystallization procedure of magnetic lysozyme crystals.
The potential of employing a tubular crystallizer installation to overcome the constraints associated with PFC and SFC crystallizers in the production of magnetic lysozyme crystals was also a topic of our discussion. Two tests on crystallization, namely V-PFC and V-SFC, were carried out utilizing the crystallizer installation shown in Figure 7c,d, respectively. The solution was introduced into the crystallizer via the inlet located on the left side and afterwards discharged through the outlet on the right side. This process resulted in the formation of magnetic lysozyme crystals, as illustrated in Figure 8c,d. The observation of the crystallization process indicates a significant decrease in the adherence of magnetic particles to the inner surface of the tube upon entry into the SFC crystallizer. This reduction in adhesion is visually discernible without the aid of magnification, as the magnetic nanoparticles exhibit a black coloration. The crystals present in the droplets at the tube output exhibit significantly bigger dimensions and more desirable morphology compared to those obtained from the V-PFC crystallizer. This observation was made using a microscope, and no visible occurrence of aggregation was detected. The V-SFC crystallizer yielded crystals that exhibited well-defined tetragonal and rhombic shapes, such as those achieved during intermittent crystallization. These crystals had an average size of 16 μm.
The calculation of the particle size distribution of the magnetic lysozyme crystals was hindered by the limited quantity of crystals (n = 500) acquired from the H-PFC crystallizer. The details pertaining to this can be found in Figure 9a. The V-SFC crystallizer yields magnetic lysozyme crystals with the most narrow average crystal size distribution. On the other hand, the V-PFC crystallizer demonstrates the highest production of magnetic lysozyme crystals, albeit with the lowest overall yield. Figure 9b illustrates the yields obtained from the four continuous crystallizers. When subjected to identical residence times, the SFC crystallizer exhibited a greater yield in comparison to the PFC crystallizer. The V-SFC crystallizer demonstrated a superior yield compared to the H-SFC crystallizer, achieving 85%. Additionally, it outperformed the V-PFC crystallizer, which achieved a yield of 60%, as well as the batch crystallizer, which achieved a yield of 79%. After the completion of the crystallization process and before the drying step, magnetic nanoparticles that were unable to penetrate the lysozyme crystals were filtered and removed from the solution. The magnetic lysozyme crystals were further subjected to characterization using an X-ray powder diffractometer (D8 Discover, AXS, Germany), as shown in Figure 9c. The Fe3O4 standard card with JCPDS number 19-0629, specifically line 1, and the magnetic nanoparticles PASP@Fe3O4 (line 2) were utilized in the study. Upon conducting a comparison between curve 2 and curve 3, it was observed that the diffraction peak of Fe-O in the magnetic lysozyme crystal did not exhibit any shift.

4. Conclusions

Based on earlier research [23,24,25], the magnetic lysozyme crystallization process was applied with a tubular continuous crystallizer, which thoroughly examined and improved the intermittent crystallization process as well as resolved the primary issues with the lysozyme continuous crystallization process. A number of inferences were formed in light of these observations.
Upon the introduction of magnetic particles, two distinct crystal morphologies of lysozyme were observed, namely tetragonal and rhombic. Following the grafting process of PASP onto Fe3O4, any residual PASP present in the solution was eliminated using water washing. Subsequently, the magnetic nanoparticles were dispersed using ultrasonic techniques. The application of induced crystallization resulted in a notable decrease in the occurrence of crystal agglomeration. The conditions that yielded the best results were as follows: The mass of the magnetic particles accounted for 15% of the mass of lysozyme. The concentration of lysozyme was 30 mg/mL, while the concentration of NaCl was 5.84% (w/v). The crystallization residence time lasted for 60 min.
The yields obtained from the four continuous crystallizers were as follows: V-SFC exhibits a higher value compared to H-SFC, whereas V-PFC demonstrates a higher value than H-PFC. The V-PFC crystallizer demonstrated the production of crystals with an average size of 16 μm, which exhibited the highest magnitude compared to other crystallizers. Nevertheless, its output was limited to 60%. On the other hand, the V-SFC crystallizer had a yield of 85% and generated crystals with an average size of 13 μm. V-PFC and V-SFC are maybe employed in the crystallization process of small molecule chemicals and pharmaceuticals.
Nevertheless, certain issues persist that necessitate resolution. Specifically, the magnetic particles exhibit adhesive properties, leading to their adherence to the inner walls of the tube during the crystallization process. Therefore, it is imperative to identify a tube material, such as glass, that minimizes the attachment of ferrous tetroxide.

Supplementary Materials

The following supporting information can be downloaded at: https://www.mdpi.com/article/10.3390/pr11092644/s1.

Author Contributions

Conceptualization, S.Y. and M.S.; methodology, S.Y.; software, S.Y.; validation, S.Y., L.H. and M.S.; formal analysis, S.Y. and L.H.; investigation, S.Y.; resources, M.S.; data curation, S.Y.; writing—original draft preparation, S.Y.; writing—review and editing, M.S.; project administration, M.S. All authors have read and agreed to the published version of the manuscript.

Funding

This research is supported by the National Natural Science Foundation of China (Project No. 21878067).

Acknowledgments

The author would like to thank Hongyu Wang for their significant contributions to instrument testing.

Conflicts of Interest

The authors declare no conflict of interest.

References

  1. Puhl, S.; Meinel, L.; Germershaus, O. Recent advances in crystalline and amorphous particulate protein formulations for controlled delivery. Asian J. Pharm. Sci. 2016, 11, 469–477. [Google Scholar] [CrossRef]
  2. Zhu, M.M.; Mollet, M.; Hubert, R.S.; Kyung, Y.S.; Zhang, G.G. Industrial production of therapeutic proteins: Cell lines, cell culture, and purification. In Handbook of Industrial Chemistry and Biotechnology; Springer: Berlin/Heidelberg, Germany, 2017; pp. 1639–1669. [Google Scholar]
  3. Neugebauer, P.; Khinast, J.G. Continuous crystallization of proteins in a tubular plug-flow crystallizer. Cryst. Growth Des. 2015, 15, 1089–1095. [Google Scholar] [CrossRef]
  4. Dos Santos, R.; Carvalho, A.L.; Roque, A.C.A. Renaissance of protein crystallization and precipitation in biopharmaceuticals purification. Biotechnol. Adv. 2017, 35, 41–50. [Google Scholar] [CrossRef]
  5. Dafnomilis, A.; Diab, S.; Rodman, A.D.; Boudouvis, A.G.; Gerogiorgis, D.I. Multiobjective Dynamic Optimization of Ampicillin Batch Crystallization: Sensitivity Analysis of Attainable Performance vs Product Quality Constraints. Ind. Eng. Chem. Res. 2019, 58, 18756–18771. [Google Scholar] [CrossRef]
  6. Barros Groβ, M.; Kind, M. Comparative Study on Seeded and Unseeded Bulk Evaporative Batch Crystallization of Tetragonal Lysozyme. Cryst. Growth Des. 2017, 17, 3491–3501. [Google Scholar] [CrossRef]
  7. Hemalatha, K.; Nagveni, P.; Kumar, P.N.; Rani, K.Y. Multiobjective optimization and experimental validation for batch cooling crystallization of citric acid anhydrate. Comput. Chem. Eng. 2018, 112, 292–303. [Google Scholar] [CrossRef]
  8. Jiang, M.; Braiek, M.; Farre, C.; Bonhomme, A.; Chaix, C.; Chateaux, J.; Zhang, A.; Jaffrezic-Renault, N. Effect of perfluorinated-hexamethylene glycol functionalization of gold nanoparticles on the enhancement of the response of an enzymatic conductometric biosensor for urea detection. Curr. Bionanotechnol. 2015, 1, 110–115. [Google Scholar] [CrossRef]
  9. Hong, M.S.; Severson, K.A.; Jiang, M.; Lu, A.E.; Love, J.C.; Braatz, R.D. Challenges and opportunities in biopharmaceutical manufacturing control. Comput. Chem. Eng. 2018, 110, 106–114. [Google Scholar] [CrossRef]
  10. Pu, S.; Hadinoto, K. Improving the reproducibility of the size distribution of protein crystals produced in continuous slug flow crystallizer operated at short residence time. Chem. Eng. Sci. 2021, 230, 116181. [Google Scholar] [CrossRef]
  11. Pu, S.; Hadinoto, K. Continuous crystallization as a downstream processing step of pharmaceutical proteins: A review. Chem. Eng. Res. Des. 2020, 160, 89–104. [Google Scholar] [CrossRef]
  12. Thomas, K.M.; Kwon, S.; Lakerveld, R. Continuous Protein Crystallization in Mixed-Suspension Mixed-Product-Removal Crystallizers. Cryst. Growth Des. 2021, 21, 757–769. [Google Scholar] [CrossRef]
  13. Cole, K.P.; Groh, J.M.; Johnson, M.D.; Burcham, C.L.; Campbell, B.M.; Diseroad, W.D.; Heller, M.R.; Howell, J.R.; Kallman, N.J.; Koenig, T.M.; et al. Kilogram-scale prexasertib mono lactate monohydrate synthesis under continuous-flow CGMP conditions. Science 2017, 356, 1144–1150. [Google Scholar] [CrossRef] [PubMed]
  14. Li, J.; Lai TT, C.; Trout, B.L.; Myerson, A.S. Continuous crystallization of cyclosporine: Effect of operating conditions on yield and purity. Cryst. Growth Des. 2017, 17, 1000–1007. [Google Scholar] [CrossRef]
  15. Wong, S.Y.; Tatusko, A.P.; Trout, B.L.; Myerson, A.S. Development of continuous crystallization processes using a single-stage mixed-suspension, mixed-product removal crystallizer with recycle. Cryst. Growth Des. 2012, 12, 5701–5707. [Google Scholar] [CrossRef]
  16. Poechlauer, P.; Manley, J.; Broxterman, R.; Gregertsen, B.; Ridemark, M. Continuous processing in the manufacture of active pharmaceutical ingredients and finished dosage forms: An industry perspective. Org. Process Res. Dev. 2012, 16, 1586–1590. [Google Scholar] [CrossRef]
  17. Peña, R.; Nagy, Z.K. Process intensification through continuous spherical crystallization using a two-stage mixed suspension mixed product removal (MSMPR) system. Cryst. Growth Des. 2015, 15, 4225–4236. [Google Scholar] [CrossRef]
  18. Yang, X.; Acevedo, D.; Mohammad, A.; Pavurala, N.; Wu, H.; Brayton, A.L.; Shaw, R.A.; Goldman, M.J.; He, F.; Li, S.; et al. Risk considerations on developing a continuous crystallization system for carbamazepine. Org. Process Res. Dev. 2017, 21, 1021–1033. [Google Scholar] [CrossRef]
  19. Jiang, M.; Braatz, R.D. Designs of continuous-flow pharmaceutical crystallizers: Developments and practice. CrystEngComm 2019, 21, 3534–3551. [Google Scholar] [CrossRef]
  20. Pu, S.; Hadinoto, K. Comparative evaluations of bulk seeded protein crystallization in batch versus continuous slug flow crystallizers. Chem. Eng. Res. Des. 2021, 171, 139–149. [Google Scholar] [CrossRef]
  21. Thomas, K.M.; Nyande, B.W.; Lakerveld, R. Design and characterization of Kenics static mixer crystallizers. Chem. Eng. Res. Des. 2022, 179, 549–563. [Google Scholar] [CrossRef]
  22. Besenhard, M.O.; Neugebauer, P.; Scheibelhofer, O.; Khinast, J.G. Crystal engineering in continuous plug-flow crystallizers. Cryst. Growth Des. 2017, 17, 6432–6444. [Google Scholar] [CrossRef] [PubMed]
  23. Wang, Y.; Su, M.; Bai, Y. Mechanism of Glycine Crystal Adhesion and Clogging in a Continuous Tubular Crystallizer. Ind. Eng. Chem. Res. 2019, 59, 25–33. [Google Scholar] [CrossRef]
  24. Zhang, Q.; Su, M.; Yu, L.; Zhang, Y. Self-Assembly of Magnetic Lysozyme Crystals with a Medium of Polymers. Cryst. Growth Des. 2021, 21, 6727–6736. [Google Scholar] [CrossRef]
  25. Su, M.; Gao, Y. Air–Liquid Segmented Continuous Crystallization Process Optimization of the Flow Field, Growth Rate, and Size Distribution of Crystals. Ind. Eng. Chem. Res. 2018, 57, 3781–3791. [Google Scholar] [CrossRef]
  26. Prathibha, V.; Karthika, S.; Cyriac, J.; Sudarasanakumar, C.; Unnikrishnan, N.V. Synthesis of pure anatase TiO2 nanocrystals in SiO2 host and the determination of crystal planes by ImageJ. Mater. Lett. 2011, 65, 664–666. [Google Scholar] [CrossRef]
  27. Gavira, J.A.; García-Ruiz, J.M. Effects of a Magnetic Field on Lysozyme Crystal Nucleation and Growth in a Diffusive Environment. Cryst. Growth Des. 2009, 9, 2610–2615. [Google Scholar] [CrossRef]
Figure 1. The distribution of liquids and gases within tube. The gas is air, and the liquid is a Y tee-mixed solution of lysozyme and NaCl.
Processes 11 02644 g001
Figure 2. (a) The SEM pictures of Fe3O4 nanoparticles; (b) infrared spectra: 1—Fe3O4; 2—PASP; and 3—PASP @ Fe3O4.
Processes 11 02644 g002
Figure 3. The microscopic images of lysozyme crystals, 18.75 mg/mL lysozyme, 5.84% NaCl. (a) After one hour of the initiation of crystallization; (b) following a six-hour period of crystallization; and (c) following a twenty-four-hour period of crystallization.
Processes 11 02644 g003
Figure 4. The microscopic images of lysozyme crystals, 30 mg/mL lysozyme, 5.84% NaCl. (a) 20 min after crystallization begins; (b) 40 min of crystallization; (c) 60 min of crystallization; and (d) changes in the concentration of lysozyme solution at different degrees of supersaturation. Each experiment was repeated three times with similar results.
Processes 11 02644 g004
Figure 5. Microscopic images of magnetic particles and their induced Lysozyme crystals: (a) magnetic nanoparticles, ultrasonic after washing; (b) magnetic nanoparticles, ultrasonic after drying; (c) magnetic lysozyme crystal, magnetic nanoparticle treatment (a); and (d) magnetic lysozyme crystal and magnetic nanoparticle treatment (b). Each experiment was repeated three times with similar results.
Processes 11 02644 g005
Figure 6. (a) The magnet separates the solution from the lysozyme crystals; (b) SEM picture of magnetic Lysozyme crystal; and (c) magnetization curves of Fe3O4, PASP @ Fe3O4, and magnetic lysozyme crystals.
Processes 11 02644 g006
Figure 7. Continuous crystallization equipment diagram. (a) Horizontal-PFC(H-PFC); (b) horizontal-SFC(H-SFC); (c) vertical-PFC; and (d) vertical-SFC(V-SFC).
Processes 11 02644 g007
Figure 8. Microscopic images of magnetic lysozyme crystals. (a) Horizontal-PFC(H-PFC); (b) horizontal-SFC(H-SFC); (c) vertical-PFC(V-PFC); and (d) vertical-SFC(V-SFC).
Processes 11 02644 g008
Figure 9. (a) Crystal size distribution of magnetic lysozyme crystals; (b) effect of different crystallization methods on the yield of lysozyme crystals; and (c) X-ray diffraction pattern. Each experiment was repeated three times with similar results.
Processes 11 02644 g009
Table 1. Crystallization time of lysozyme crystals at different supersaturation.
NaCl (%)Lysozyme (mg/mL)ST/minYield (%)
5.8418.7510.3136057.13 ± 1.13
5.8425.0013.744074.20 ± 1.41
5.8430.0016.486079.86 ± 2.03
5.0030.0015.319058.62 ± 3.49
4.0030.009.8118035.61 ± 2.82
Table 2. Crystallization yield and saturation magnetic induction induced by different magnetic particle content; the residence time of crystallization is 60 min.
Ω (%)Yield (%)Ms (emu/g)Mr (emu/g)
1076.18 ± 3.177.79 ± 0.312.21 ± 0.10
1578.33 ± 4.709.89 ± 0.442.78 ± 0.13
2079.69 ± 2.9011.01 ± 0.493.09 ± 0.14
Table 3. Experimental data of slug flow stability.
No q v L mL/min q v G mL/min ε L RSD
11.790.911.969.64
21.791.281.408.05
31.791.641.093.17
41.792.000.896.23
51.792.370.753.83
63.221.821.775.05
73.222.551.264.19
83.223.280.983.30
91.070.911.172.43
Disclaimer/Publisher’s Note: The statements, opinions and data contained in all publications are solely those of the individual author(s) and contributor(s) and not of MDPI and/or the editor(s). MDPI and/or the editor(s) disclaim responsibility for any injury to people or property resulting from any ideas, methods, instructions or products referred to in the content.

