Article

Removal of Phosphorus from Domestic Sewage in Rural Areas Using Oyster Shell-Modified Agricultural Waste–Rice Husk Biochar

1
Zhejiang Provincial Key Laboratory of Water Science and Technology, Department of Environment, Yangtze Delta Region Institute of Tsinghua University, Jiaxing 314006, China
2
School of Environmental and Geographical Sciences, Shanghai Normal University, Shanghai 200234, China
3
School of Environment, Tsinghua University, Beijing 100084, China
*
Author to whom correspondence should be addressed.
Processes 2023, 11(9), 2577; https://doi.org/10.3390/pr11092577
Submission received: 7 August 2023 / Revised: 22 August 2023 / Accepted: 23 August 2023 / Published: 28 August 2023
(This article belongs to the Special Issue Advances in Recycling and Utilization of Agricultural Wastes)

Abstract

:
In order to promote the improvement of rural living environments, the treatment of rural domestic sewage has attracted much attention in China. Meanwhile, the rural regions’ sewage discharge standards are becoming increasingly stringent. However, the standard compliance rate of the total phosphorus (TP) is very low, and the TP has become the main limiting pollutant for the water pollutant discharge standards of rural domestic sewage treatment facilities. In this study, oyster shell waste was employed as a calcium source, and agricultural waste–rice husk was used as a carbon source to synthesize calcium-modified biochar adsorbent materials (Ca-BC) by a simple one-step pyrolysis method. The resultant Ca-BC adsorbent materials demonstrated efficient phosphate (P) adsorption from aqueous solutions over a wide pH range (3–11) and adsorption selectivity. Ca-BC’s adsorption capacity for P increased with the pyrolysis temperature, increasing from 700 °C to 900 °C, which was attributed to the higher specific surface area and calcium oxide content at higher pyrolysis temperatures. The Ca-BC sample, which was made from oyster shells and rice husks with a mass ratio of 2:1 and a pyrolysis temperature of 900 °C, had a maximum adsorption capacity of 196.2 mg/g. The Langmuir model and pseudo-second-order model were the best at describing the adsorption process, and the predominant sorption mechanism for P is the precipitation of calcium oxide or calcium hydroxide with phosphate to create hydroxyapatite. Ca-BC can effectively remove P from rural domestic sewage. The removal rate of the total phosphorus (TP) in rural domestic sewage is 93.9–99.4%. After the adsorption treatment, the discharge of the TP in the rural sewage met the second-grade (TP < 3 mg/L) or even the first-grade (TP < 2 mg/L) Discharge Standard of Water Pollutants for Centralized Rural Sewage Treatment Facilities (DB33/973-2021). This study provides an experimental basis for efficient P removal by Ca-BC adsorbent materials and suggests possible applications in rural domestic sewage.

1. Introduction

China is a big agricultural country. Due to population growth and the improvement of social and economic living standards, the increase in rural domestic sewage is becoming one of the main environmental problems in rural areas. In recent years, in order to reduce pollutant emissions and improve the rural living environment, rural domestic sewage treatment has received more and more attention from the Chinese government. Rural domestic sewage treatment is one of the important tasks in implementing the Rural Revitalization Strategy in China [1]. Meanwhile, the rural areas’ sewage discharge standards are becoming more and more stringent, and currently, thirty-one provinces and cities have issued rural sewage discharge standards in China.
The most conventional treatment methods for domestic sewage in rural regions consist of an operational sequence of aerobic/anoxic/aerobic processes. Anaerobic–Anoxic–Oxic (A2O) and Anaerobic–Oxic (AO) are the most typical schemes in China. However, some reports have observed that the efficient removal of chemical oxygen demand (COD), ammonia–nitrogen (NH3-N), and total phosphorus (TP) is hard to realize [2]. In the study of Yang et al., surrounding Erhai Lake in Yunnan Province, centralized rural sewage treatment facilities had good removal efficiency. However, some centralized sewage treatment facilities could not meet the water pollution discharge standards, especially since the average standard compliance rate of the TP was only 4.26%. The TP had become the main limiting pollutant for the discharge standards of rural domestic sewage treatment facilities. So, how to improve TP treatment efficiency for meeting discharge standards in rural regions is an important target of future research [3].
Different biological, chemical, and physical techniques have been created and widely applied in previous studies to manage and treat the phosphorus (P) present in wastewater [4,5]. Among those methods, the adsorption method is the most attractive since it is economically feasible and simple in real application; in addition, the nutrient-loaded adsorbents can be further utilized as soil conditioners and fertilizers [6]. Biochar is recognized as an eco-friendly and potentially low-cost adsorbent material that has excellent physicochemical properties and is considered a potential soil amendment [7,8]. Pure biochar is effective at adsorbing organic pollutants and cations, but the adsorption of P is limited [9,10,11,12]. In order to improve the adsorption performance of P, the biochar must be modified. Calcium (Ca), which is an environmentally friendly, cheap, and widely abundant metal, could effectively remove P from solutions [13,14,15]. Ca loaded on other carrier materials, such as biochar, can be an effective adsorbent for the recovery of P from wastewater [16]. Traditional Ca-modified biochar methods utilize chemical reagents such as calcium hydroxide (Ca(OH)2), calcium carbonate (CaCO3), or calcium chloride (CaCl2) as Ca sources [17,18]. Adsorbents’ cost of raw material is one of the important factors influencing their practical application. Recently, the development of adsorbent materials using waste biomass as the preparation of raw materials has received extensive attention [19]. China produces huge quantities of oyster shells each year, which are often treated as waste [20]. Oyster shells primarily contain CaCO3 (~96%). So, oyster shells are a kind of easily available, rich in calcium, and cheap biological waste [21]. Oyster shells have the potential to be a source of calcium for the creation of Ca-modified biochars, which have the ability to absorb P and then be used as a phosphate fertilizer [16]. Rice husks are the by-product of the rice milling process and makeup about 20 percent of the rice’s weight [22]. Statistics show that the world produces 60 billion tons of rice husks every year [23]. However, rice husks are often used in low-value-added applications or act as agricultural wastes. From an environmental and bioeconomic point of view, it is important to convert waste or low-value rice husks into added-value products through a sustainable processing approach. The carbonized rice husk forms a material with abundant surface functional groups and a stable structure, which has demonstrated that rice husk is a good substrate for producing biochar [24]. In addition, so far, the reports on the P treatment of rural domestic sewage by calcium-modified biochar are limited.
In this study, based on the above evidence and keeping pace with the need for recycling natural waste, oyster shell waste was used as the Ca source, and agricultural waste–rice husk as the carbon (C) source for synthesizing biochar adsorbent materials (Ca-BC) by a simple one-step co-pyrolysis method. To improve the sorption capacity of P, the mass ratio of the oyster shells and rice husks and the optimum pyrolysis temperature were determined. Some adsorption models were used to observe the adsorption performance of P by the Ca-BC. The mechanisms of P adsorption on the prepared Ca-BC were analyzed. The feasibility of Ca-BC as an adsorbent for TP removal was also assessed using rural domestic sewage.

2. Materials and Methods

2.1. Experimental Materials

The agricultural waste–rice husks were collected from a farm in Jiaxing, China, and were dried at 60 °C in an oven before use, ground with a grinding machine, and passed through 40 mesh sieves. Oyster shell waste was obtained from a mess hall of Jiaxing, dried at 60 °C in an oven after cleaning three times, and then, they were ground to pass through 40 mesh sieves before use. All chemical reagents (such as KH2PO4, HCl, NaOH, KCl, KNO3, K2SO4, and KHCO3) were of analytical grade and purchased from the Aladdin Industrial Corporation (Shanghai, China).

2.2. Preparation of Adsorbents

The mixture of oyster shell and rice husk powder at a weight ratio of 3:1, 2:1, 1:1, and 1:2 was transferred to a quartz boat, and then the mixture in the tube furnace was calcined for 2 h under nitrogen at 800 °C. The mixture of the oyster shell and rice husk powder at a weight ratio of 2:1 was transferred to a quartz boat and then into the tube furnace and calcined for 2 h under a nitrogen atmosphere at 700 °C and 900 °C, respectively. The heating rate was 5 °C/min.
According to the weight ratio of the oyster shells (Ca) and rice husks (BC), the samples were named Ca-BC (3:1)-T800, Ca-BC (2:1)-T800, Ca-BC (1:1)-T800, and Ca-BC (1:2)-T800. According to the calcination temperature, the samples were named Ca-BC (2:1)-T700 and Ca-BC (2:1)-T900, respectively. Pure rice husk-prepared biochar was named BC.

2.3. Adsorption Experiments

In this study, all adsorption experiments were carried out in batches. Typically, the Ca-BC material was placed in a 100 mL glass vial with a stopper containing 50 mL of P solutions. The vials were oscillated (180 rpm) in a shaker bath (HZQ-F100, Chengdu Yike Medical Equipment Co., LTD, Suzhou, China) at a pH of 7 and 25 °C. The adsorbent dose was 0.2 g/L. Then, the suspension was filtered through a 0.45 μm PES syringe filter, and the filtered solution was used to detect the phosphorus concentration. 0.1 mol/L of NaOH or HCl was used to adjust the initial pH values of the solutions. Since the main form of phosphate in the range of 2.13–7.20 is H2PO4 [25], KH2PO4 was used as a phosphorus source in the solutions. All experiments were performed in triplicate.
To evaluate the equilibrium adsorption parameters, adsorption isotherm experiments were conducted as follows: Ca-BC dose, 0.2 g/L; initial P concentrations of 5, 10, 25, 50, 100, 150, and 200 mg P/L; initial pH, 7.0; adsorption time, 24 h.
Adsorption kinetic tests were conducted as follows: Ca-BC dose, 0.2 g/L; initial P concentration, 100 mg/L; initial pH, 7.0; adsorption time of 5, 15, 30, 60, 120, 240, 360, 480, 720, 1440, and 2160 min.
The effects of different initial pH on P removal by Ca-BC were evaluated as follows: Ca-BC dose, 0.2 g/L; initial P concentration, 100 mg/L; initial pH of 3.0, 5.0, 7.0, 9.0, and 11.0; adsorption time, 24 h.
The effect tests of common competing substances (Cl, NO3, SO42−, and HCO3) on P removal by Ca-BC were evaluated as follows: Ca-BC dose, 0.2 g/L; initial P concentration, 100 mg/L; Cl, NO3, SO42−, and HCO3 concentrations, 0.01 mol/L, 0.02 mol/L, and 0.03 mol/L; adsorption time, 24 h.
Rural residential sewage from four centralized rural sewage treatment facilities in Jiaxing was utilized to assess the Ca-BC adsorbent’s suitability for actual P sewage. The Anaerobic–Anoxic–Oxic (A2O) procedures were used at the centralized rural sewage treatment facility 1 (design capacity, 20 t/d, designated F1) and the centralized rural sewage treatment facility 2 (the design capacity was 50 t/d, designated F2). The Anaerobic–Oxic (AO) procedures were used at the centralized rural sewage treatment facility 3 (design capacity, 20 t/d, designated F3) and the centralized rural sewage treatment facility 4 (design capacity, 50 t/d, designated F4). Every three days, a sample of rural home sewage was taken from the secondary sedimentation tank. The 100 mL glass vials with stoppers contained 50 mL of rural home sewage and 0.01 g of Ca-BC material, and the vials were oscillated (at 180 rpm) in a shaker bath for 6 h at 25 °C.
All experiments were repeated three times. We could calculate the equilibrium adsorption capacity (qe, mg/g) and the adsorption capacity at different times, t (qt, mg/g), as follows:
qe = (C0 − Ce) V/m
qt = (C0 − Ct) V/m
where C0 (mg/L) represents the initial P concentration, Ce (mg/L) represents the P concentration at the equilibrium, and Ct (mg/L) represents the P concentration at time t; V (L) is the volume of the solution, and m (g) is the adsorbent mass.

2.4. Characterization and Analytical Method

The phosphorus concentration of the solution was determined using ammonium molybdate spectral photometry by an ultraviolet spectrophotometer (SHIMADZU UV-2450, Shimadzu Co., Kyoto, Japan) according to the standard method [26]. The surface elements and morphologies of adsorbents before and after adsorption of P were studied using scanning electron microscopy with energy dispersive X-ray spectroscopy (SEM-EDS) (Regulus-810, Hitachi, Tokyo, Japan). The diffraction patterns of adsorbents before and after P adsorption were studied by X-ray diffractometer (XRD, Bruker D8 Advance X-ray diffractometer, Karlsruhe, Germany). An FTIR spectrometer (Thermo Scientific Nicolet IS50, Waltham, MA, USA) was used to study the characterization of the functional groups in the adsorbents before and after P adsorption. The adsorbent samples were mixed with potassium bromide power and compressed into pellets and then were characterized over the range from 4000 to 400 cm−1. A fully automated physisorption instrument (JW-BK200B, Beijing JWGB Sci. & Tech. Co., Ltd., Beijing, China) was used to detect the specific surface area, average pore size, and pore volume of adsorbents.

3. Results and Discussion

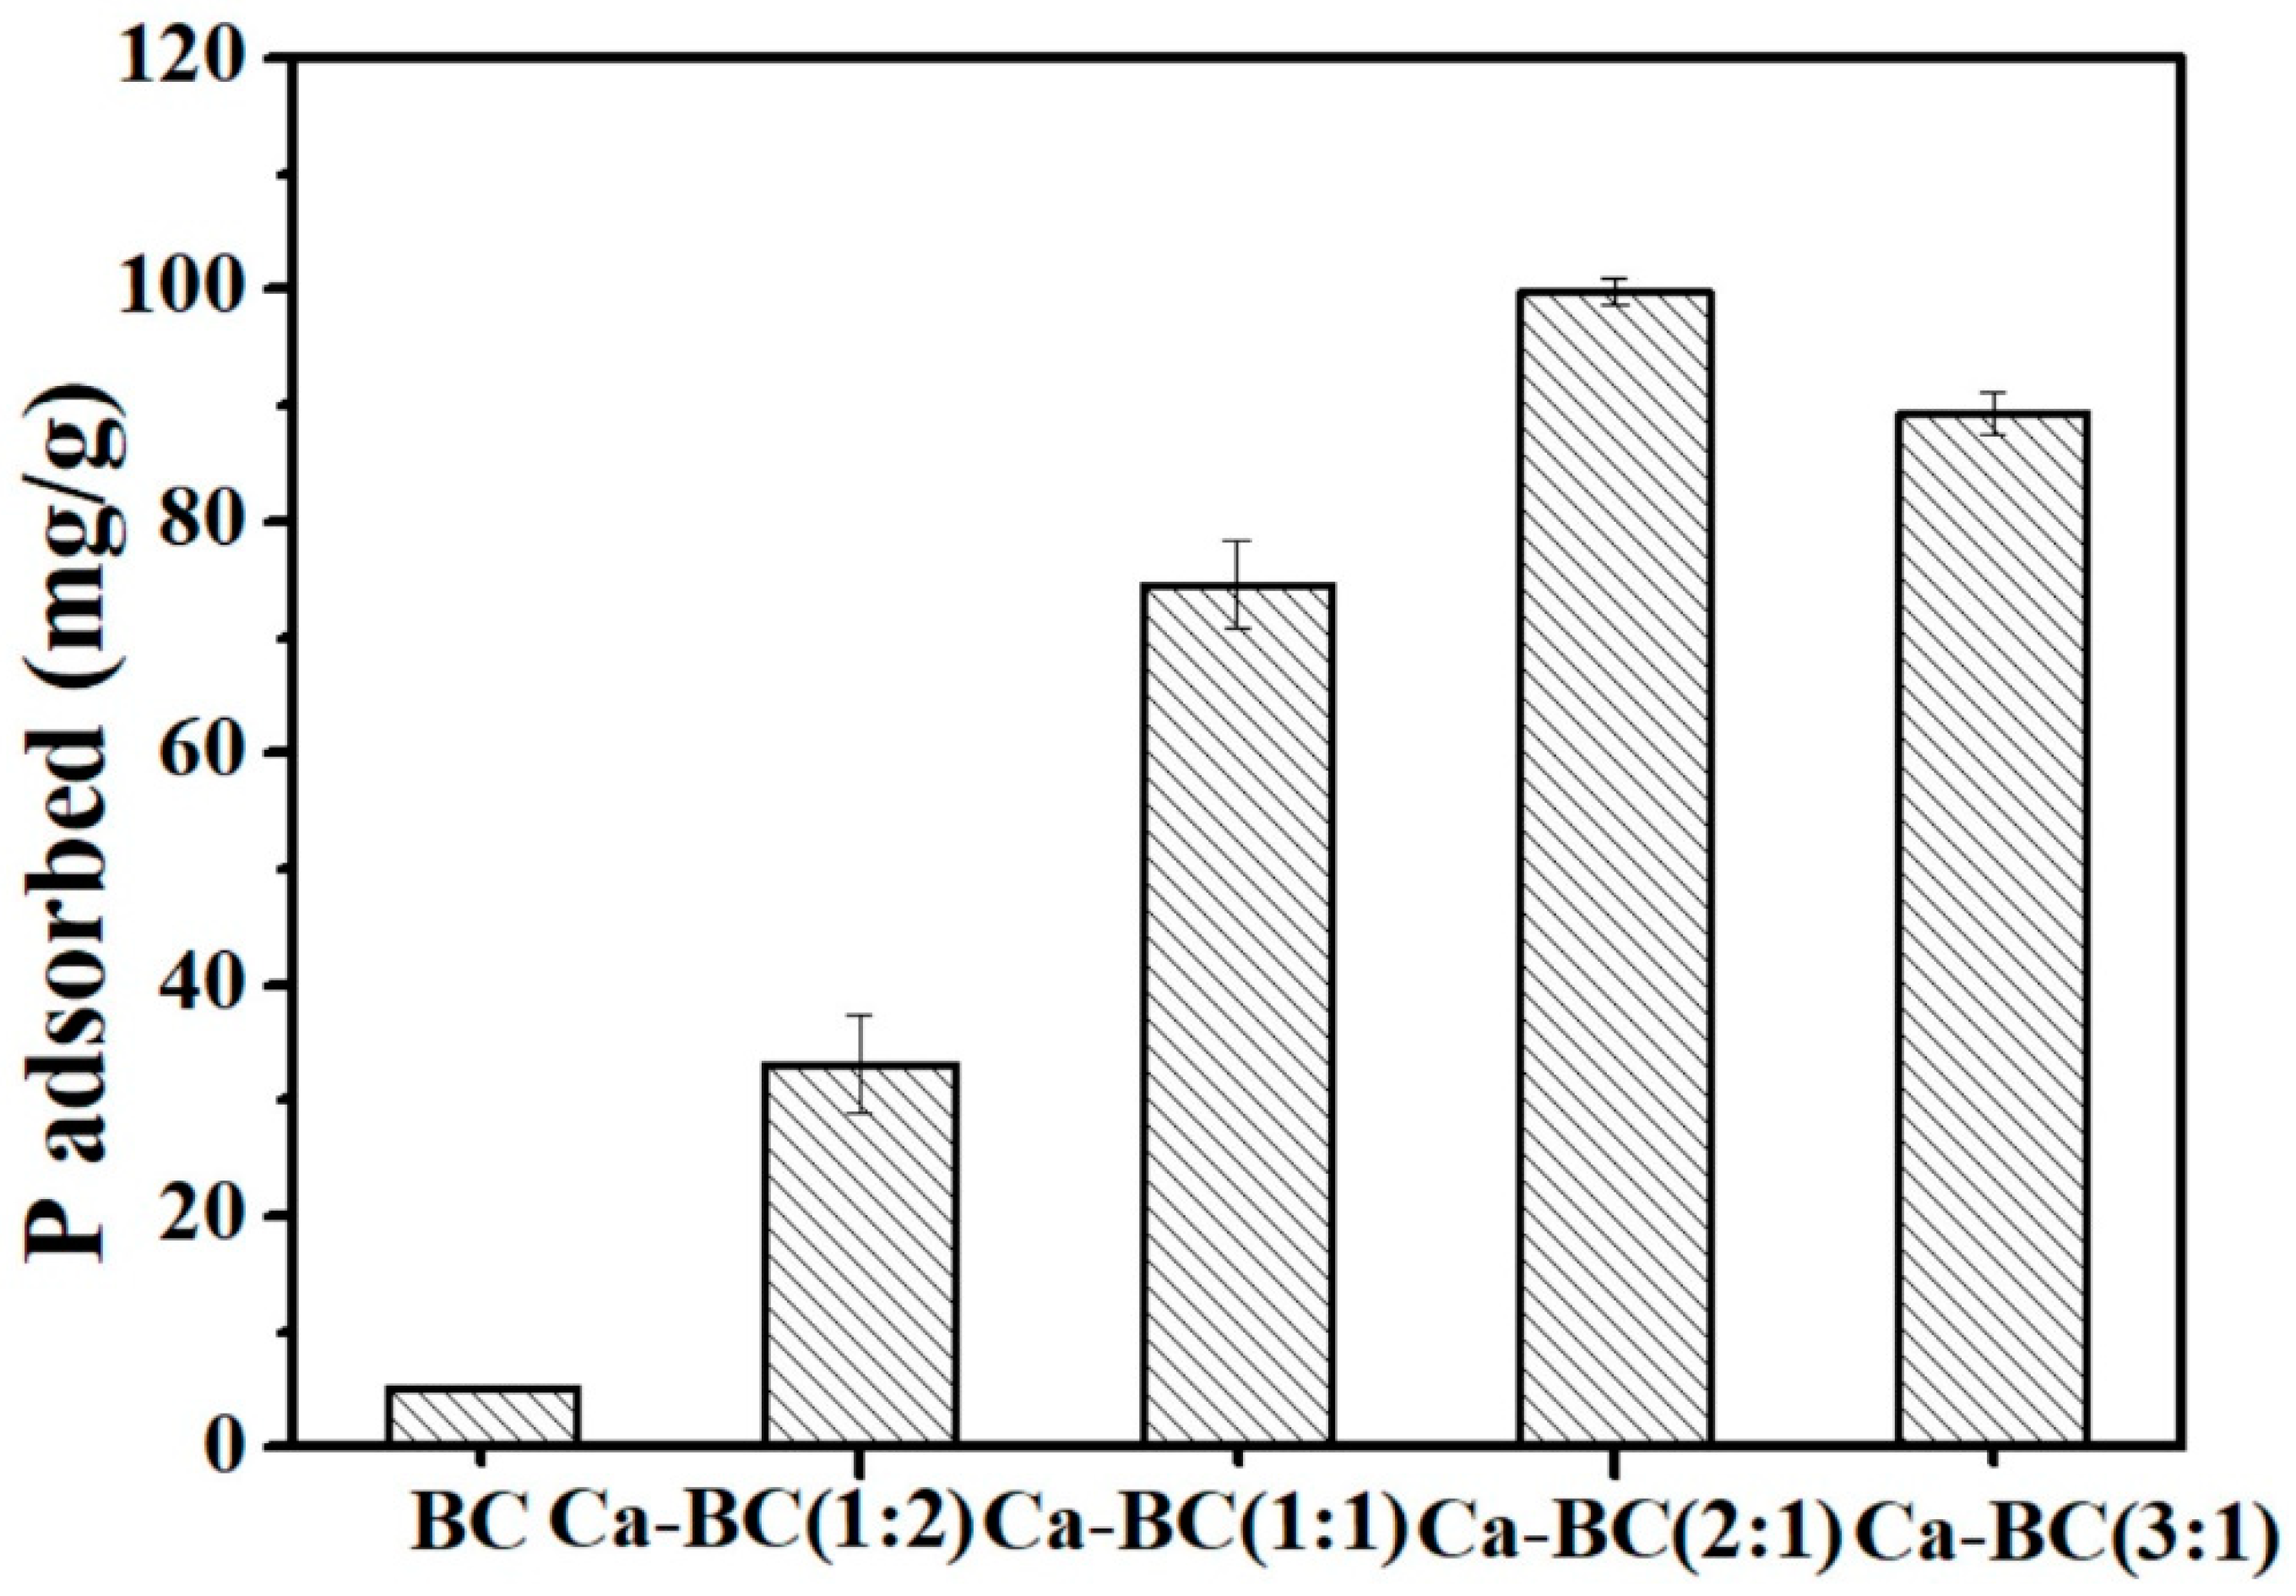
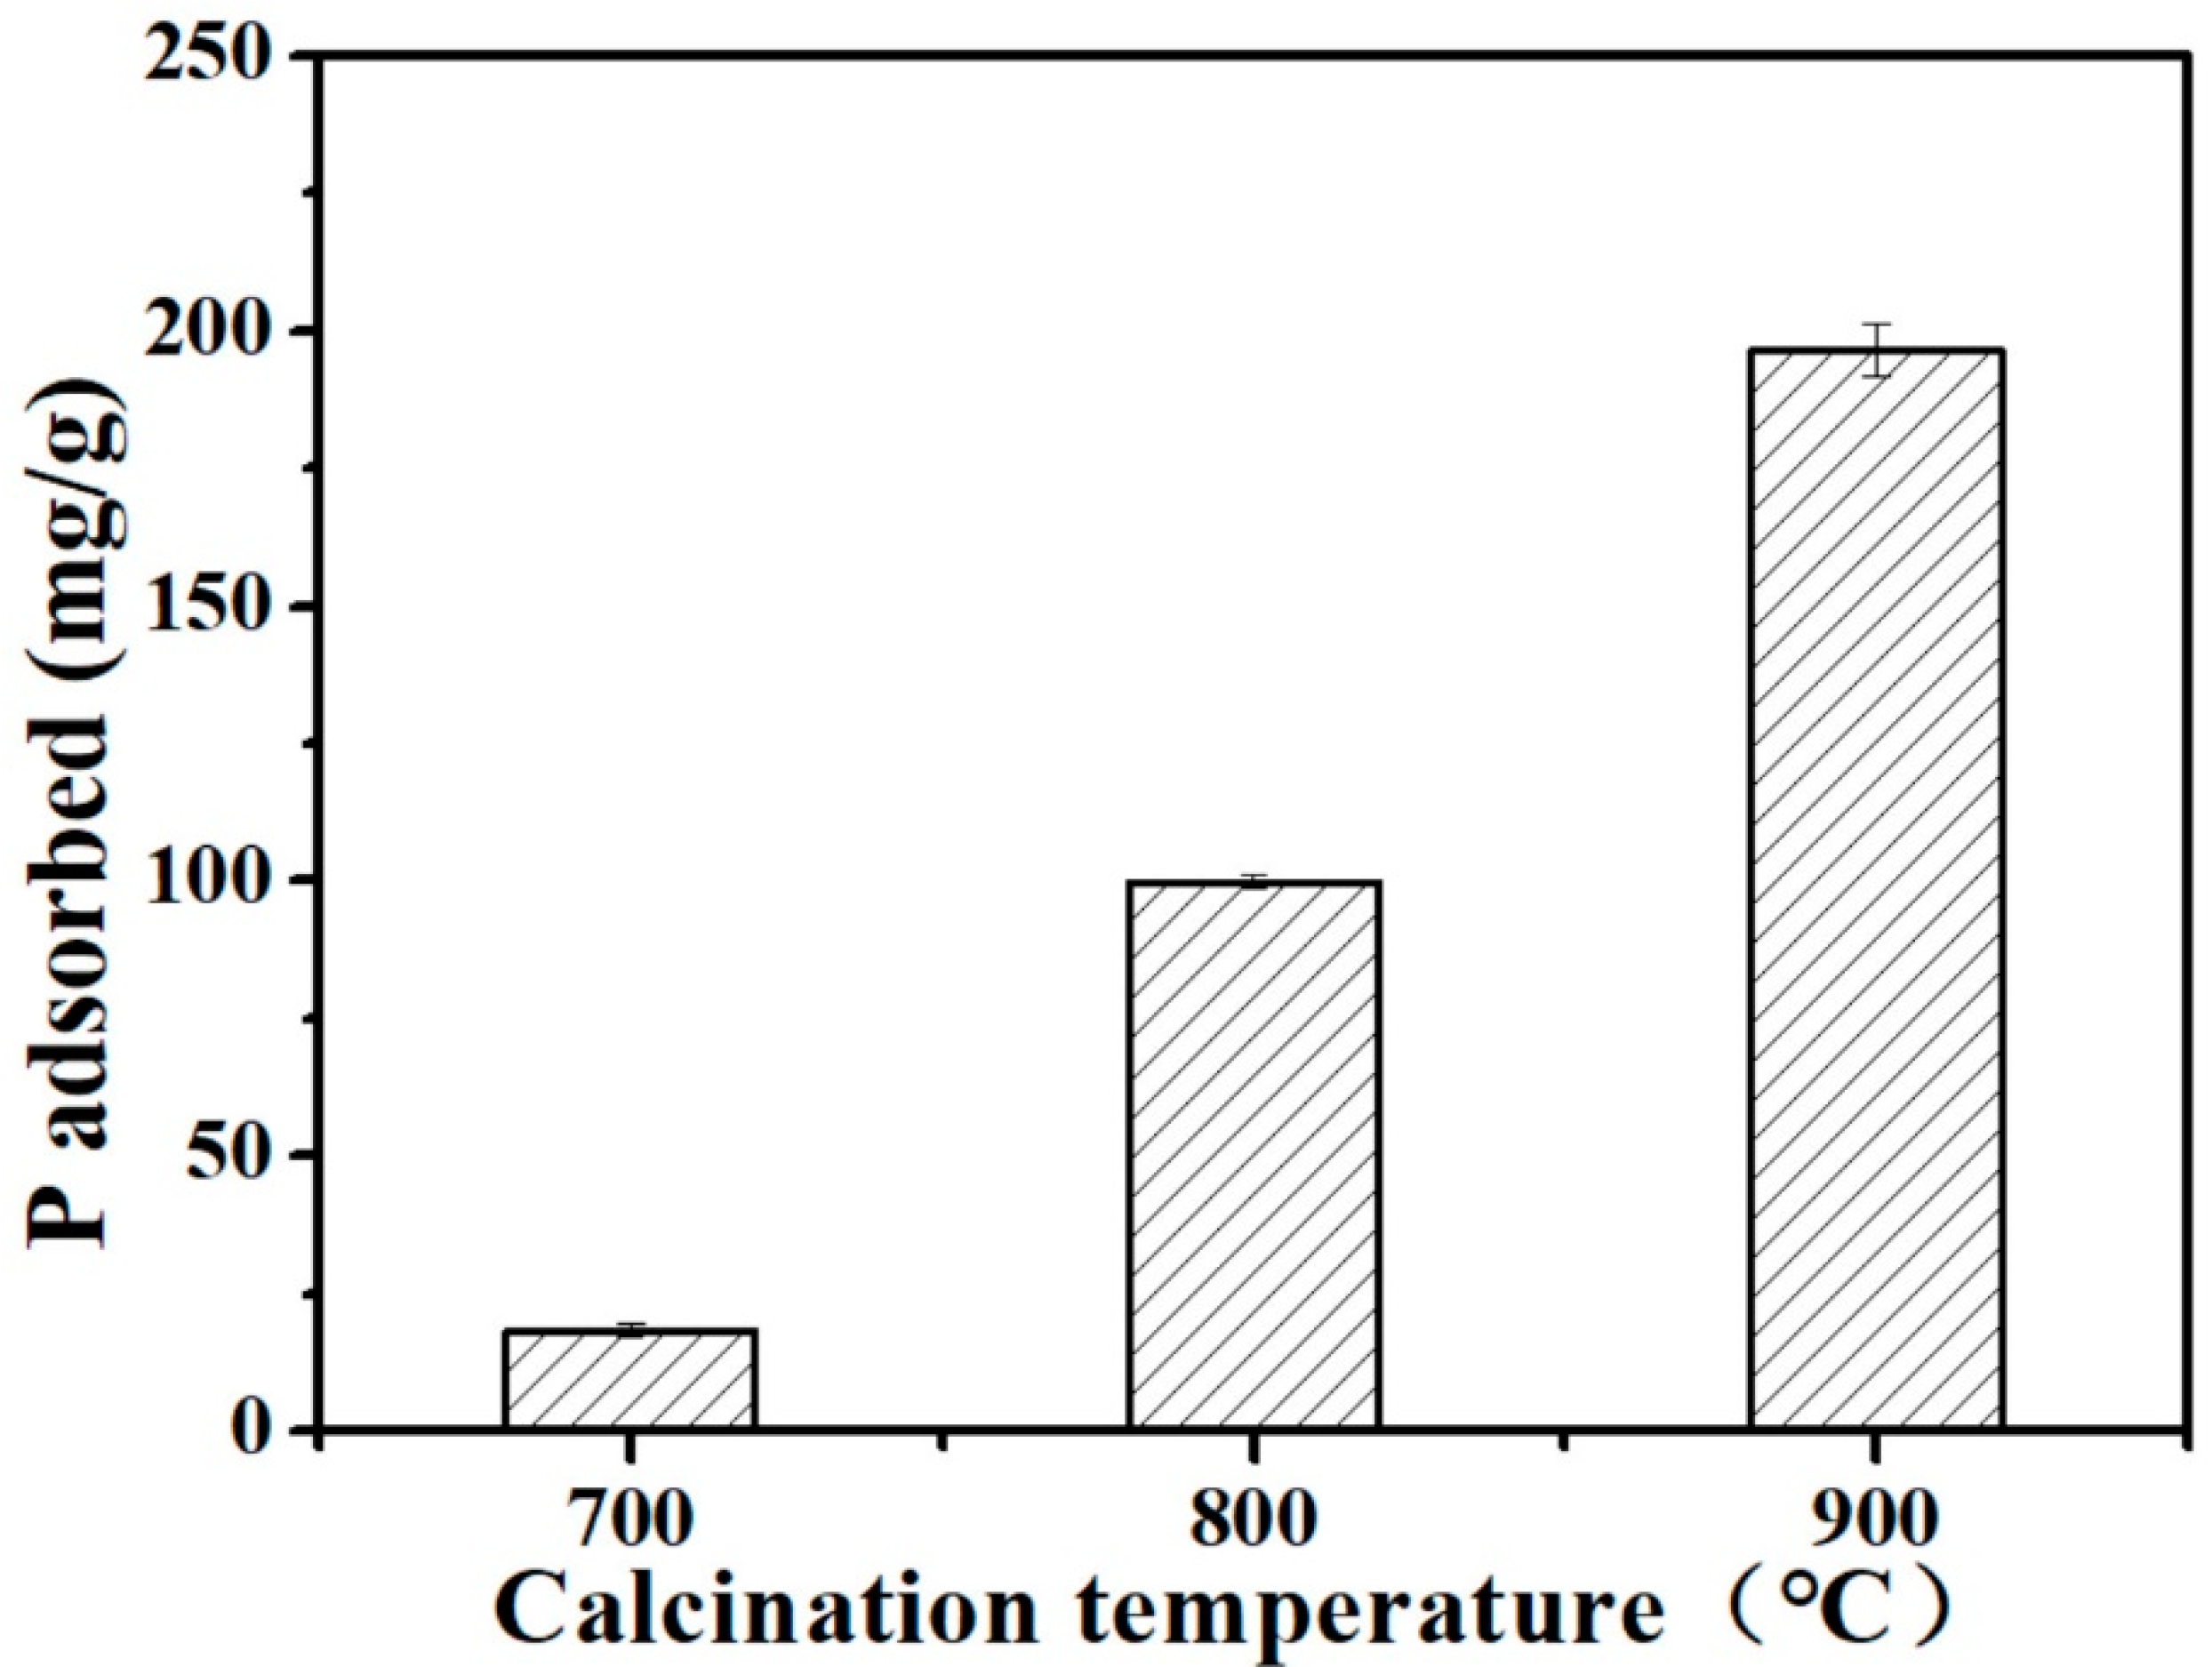
3.1. Sorption of Phosphate on Various Ca-BC Adsorbents

The effects of the oyster shell and rice husk’s weight ratios as adsorbents on the P adsorbed are presented in Figure 1. Clearly, the adsorption amounts increased from 33.2 mg/g at the shell and rice husk’s weight ratio of 1:2 to 99.8 mg/g and at the oyster shell and rice husk’s weight ratio of 2:1. In this study, the lowest P adsorption amount in the tested adsorbents was 5.2 mg/g, obtained from the BC. Clearly, the modified biochar by Ca favored P adsorption, and similar results have been reported in Chen’s research [10]. However, as the weight ratio of the oyster shells and rice husks increased to 3:1, the adsorption amount slightly decreased. Excessive calcium may reduce the adsorption site of the adsorbent. The weight ratio of the oyster shells and rice husks was 2:1 for the further experiments. Thus, decorating biochar with Ca is a promising approach to achieving the preferable adsorption of P.
The effects of pyrolysis temperature on the adsorption of P by Ca-BC (2:1) adsorbents are presented in Figure 2. The adsorption amounts significantly increased from 18.47 mg/g at a pyrolysis temperature of 700 °C to 196.2 mg/g at a pyrolysis temperature of 900 °C (Figure 2). Ca-BC’s adsorption capacity for P increased with an increase in the pyrolysis temperature. Since Ca-BC (2:1)-T900 had the highest adsorption capacity among the preparative Ca-BC adsorbents, it was selected for further study.
In Table 1, the basic physicochemical properties and major elements of the Ca-BC and BC adsorbents are shown. As the pyrolysis temperature increased, the pore volume and the specific surface area of the Ca-BC materials tended to increase. Ca-BC (2:1)-T900 had the maximum pore volume of 0.056 cm3/g and surface area of 46.19 m2/g among the Ca-BC materials.
The oyster shell decomposed into CaO and CO2 in a high-temperature pyrolysis process [16]. The formation of CO2 can broaden a material’s pore size as an activation substance. In addition, the adsorbent’s pore volume and specific surface area may increase when the oyster shell is added to the biochar. The pore volume and surface area of the Ca-BC (2:1)-T800 were higher than those of the BC-T800. The biochar’s adsorption performance largely depends on its porosity and specific surface area. The larger the adsorbent’s specific surface area and the higher the porosity, the more surface adsorption sites there will be, and the higher the adsorption performance will be [16,27].

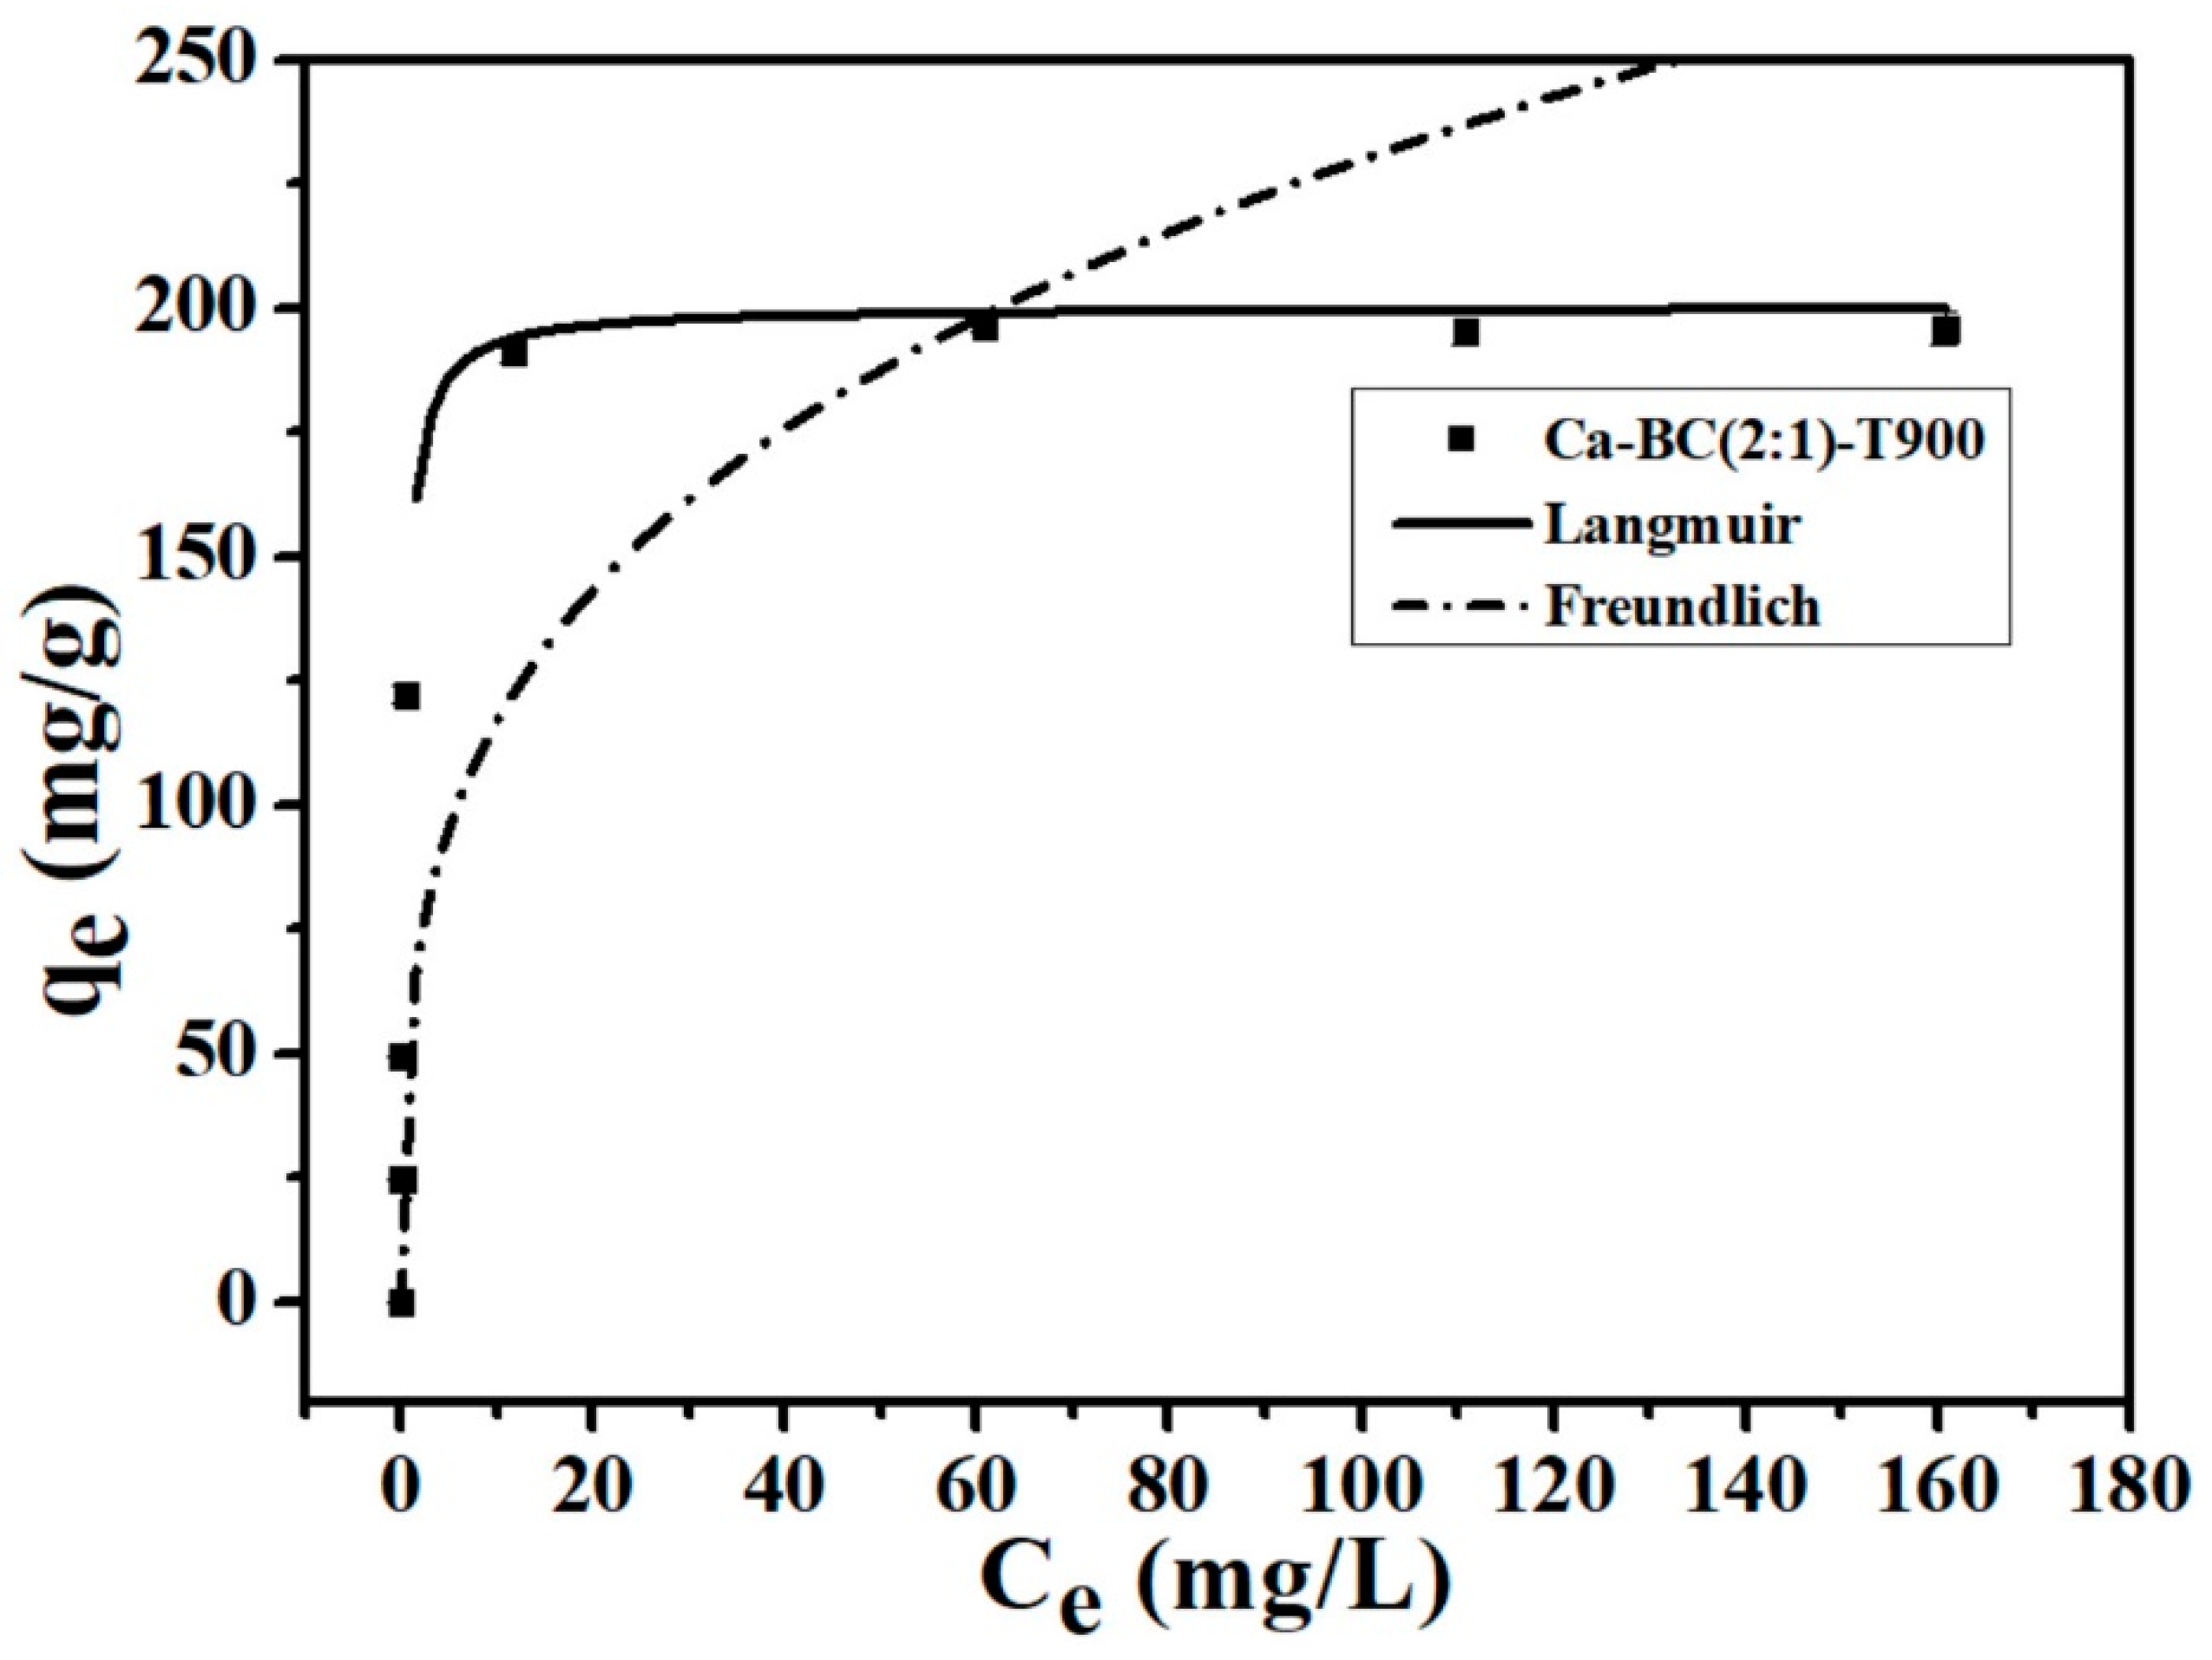
3.2. Adsorption Isotherms

In this study, the isothermal experiments were carried out with different initial P concentrations (5, 10, 25, 50, 100, 150, and 200 mg/L). Langmuir and Freundlich adsorption isotherm models were used in the study of Ca-BC (2:1)-T900′s adsorption isotherms for P in aqueous solutions (3) and (4):
Langmuir: qe = KLqmaxCe/(1 + KLCe)
Freundlich: qe = KFCe1/n
In the equations, qe (mg/g) is the equilibrium adsorption amount, KL (L/mg) is the Langmuir adsorption equilibrium constant, qmax (mg/g) represents the maximum adsorption capacity, Ce (mg/L) represents the P equilibrium concentration, KF (mg(1−1/n)L1/n/g) represents the Freundlich adsorption constant representing the adsorption capacity of the adsorbent, and n represents an indication of linearity.
The fitted adsorption isotherms of P onto the Ca-BC (2:1)-T900 adsorbent materials are shown in Figure 3. The fitting effect of the Langmuir model on the experimental data is better than that of the Freundlich model in this study (Figure 3). The corresponding fitting parameters for the Langmuir model are qmax = 200.4 mg/g, KL = 2.59 L/mg, and R2 = 0.983. The corresponding fitting parameters for the Freundlich model are KF = 59.5 mg(1−1/n)L1/n/g, 1/n = 0.29 L/mg, and R2 = 0.976. Furthermore, the regression coefficient, R2, of the Langmuir model is higher than that of the Freundlich model. It is further confirmed that the Langmuir isotherm model adequately describes the experimental data of P adsorption by Ca-BC (2:1)-T900, implying that the effective adsorption surface of Ca-BC (2:1)-T900 is homogeneous and a monolayer during the adsorption of P, similar to the P adsorption behavior reported in other researches on Ca-based adsorbents [16,18].
The qmax of Ca-BC (2:1)-T900 calculated by the Langmuir isotherm was 200.4 mg/g, which was consistent with the experimental maximum adsorption capacity of 196.2 mg/g and indicated that the Ca-BC adsorbents in the aqueous solution had excellent adsorption properties for removing P.

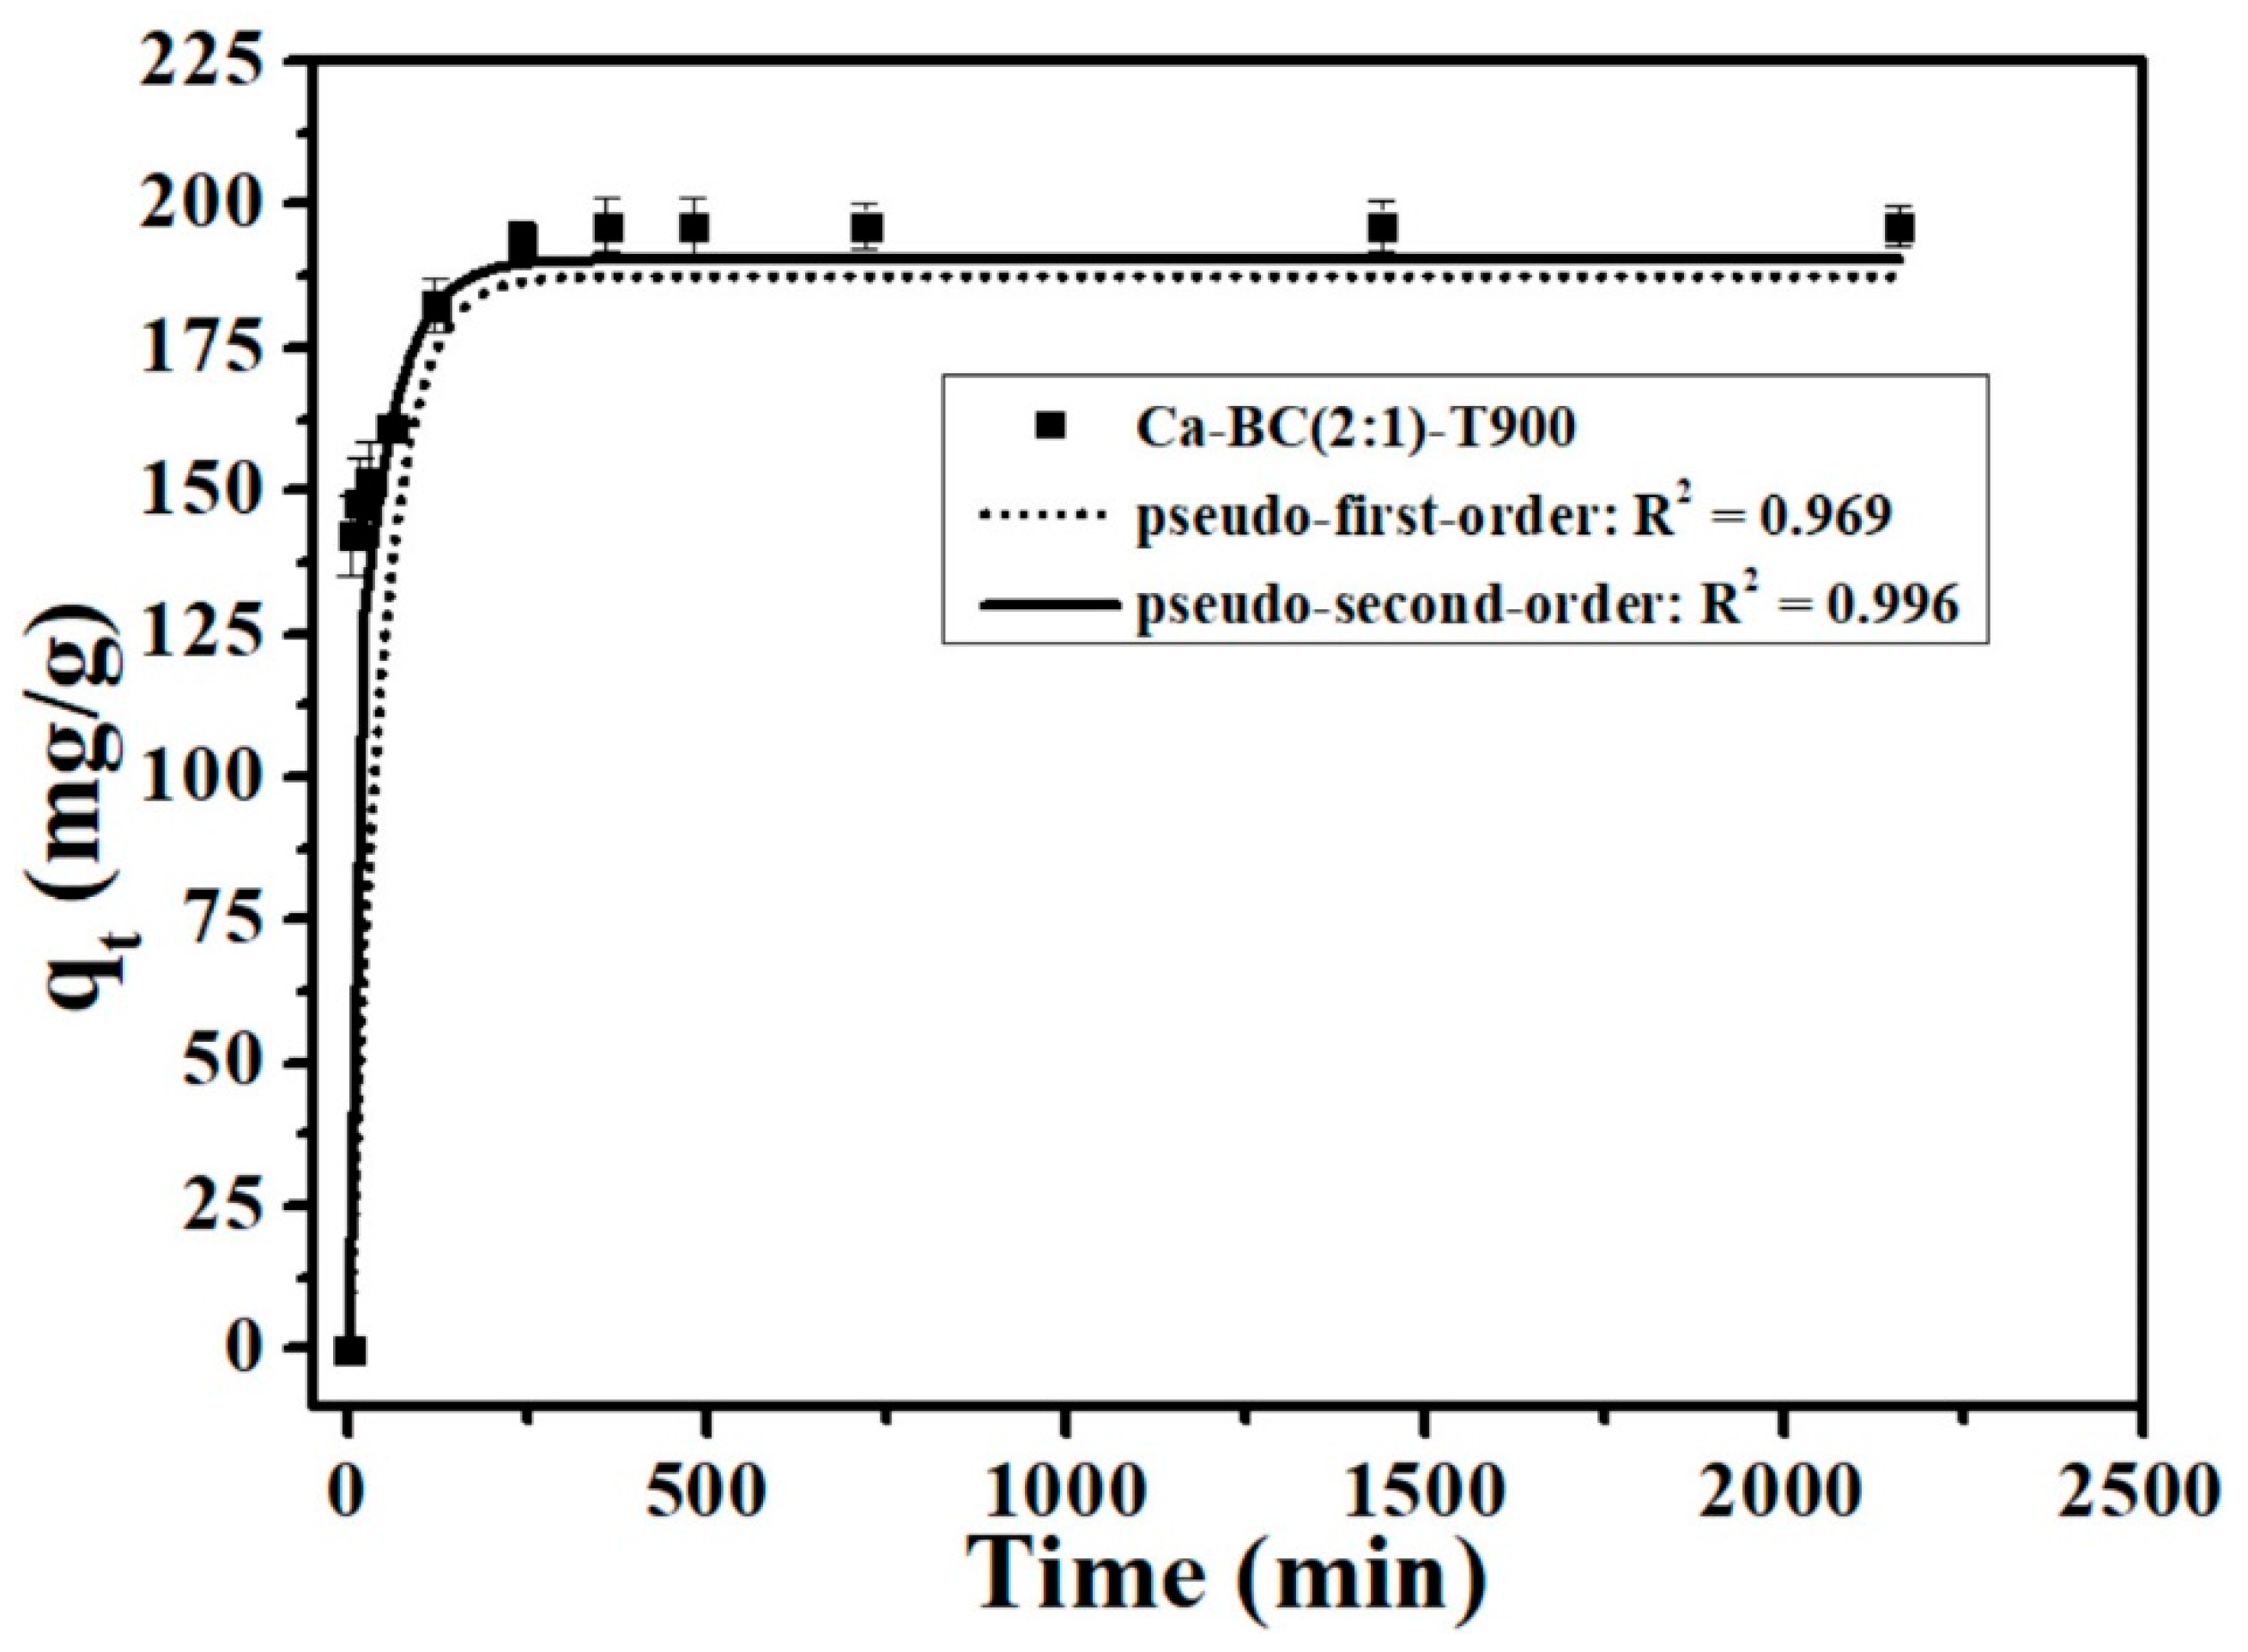
3.3. Adsorption Kinetics

Figure 4 illustrates the results of the kinetic behavior of phosphate on Ca-BC (2:1)-T900. Clearly, during the initial 2 h, the adsorption processes of Ca-BC (2:1)-T900 for P were rapid and then slowed down until reaching equilibrium within 6 h. The adsorption process involves the initial rapid diffusion of ions from the solution to the surface of the external adsorbent, followed by a slow adsorption process through the diffusion of ions into the pores on the inner surfaces of the adsorbent [28].
The pseudo-first-order model and pseudo-second-order model were used in the study of the Ca-BC (2:1)-T900 adsorbent materials’ adsorption kinetics for P in aqueous solutions (5) and (6):
Pseudo-first-order kinetic equation: qt = qe(1 − e−k1t)
Pseudo-second-order kinetic equation: t/qt = 1/k2qe2 + t/qe
In the equations, qt is the P adsorption amounts at t time, and qe is the P adsorption amounts at the equilibrium time; k1 is the first-order kinetics’ adsorption rate constant, and k2 is the second-order kinetics’ adsorption rate constant.
The results showed that the coefficient of determination simulated by the pseudo-second-order model (R2 = 0.996) is higher than the pseudo-first-order model (R2 = 0.969) (Figure 4), which suggested that the pseudo-second-order kinetic model can well describe the adsorption kinetic process of P onto Ca-BC (2:1)-T900, and monolayer chemisorption occurred on the adsorbent surface, which was consistent with the above isotherm results described by the Langmuir model. Based on the analysis of the pseudo-second-order theory and the chemisorption characteristics of Ca-BC (2:1)-T900, chemisorption was the main rate-limiting step of P adsorption by Ca-BC (2:1)-T900, similar to the P adsorption behavior reported by other researches of Ca-based adsorbents [16,29].

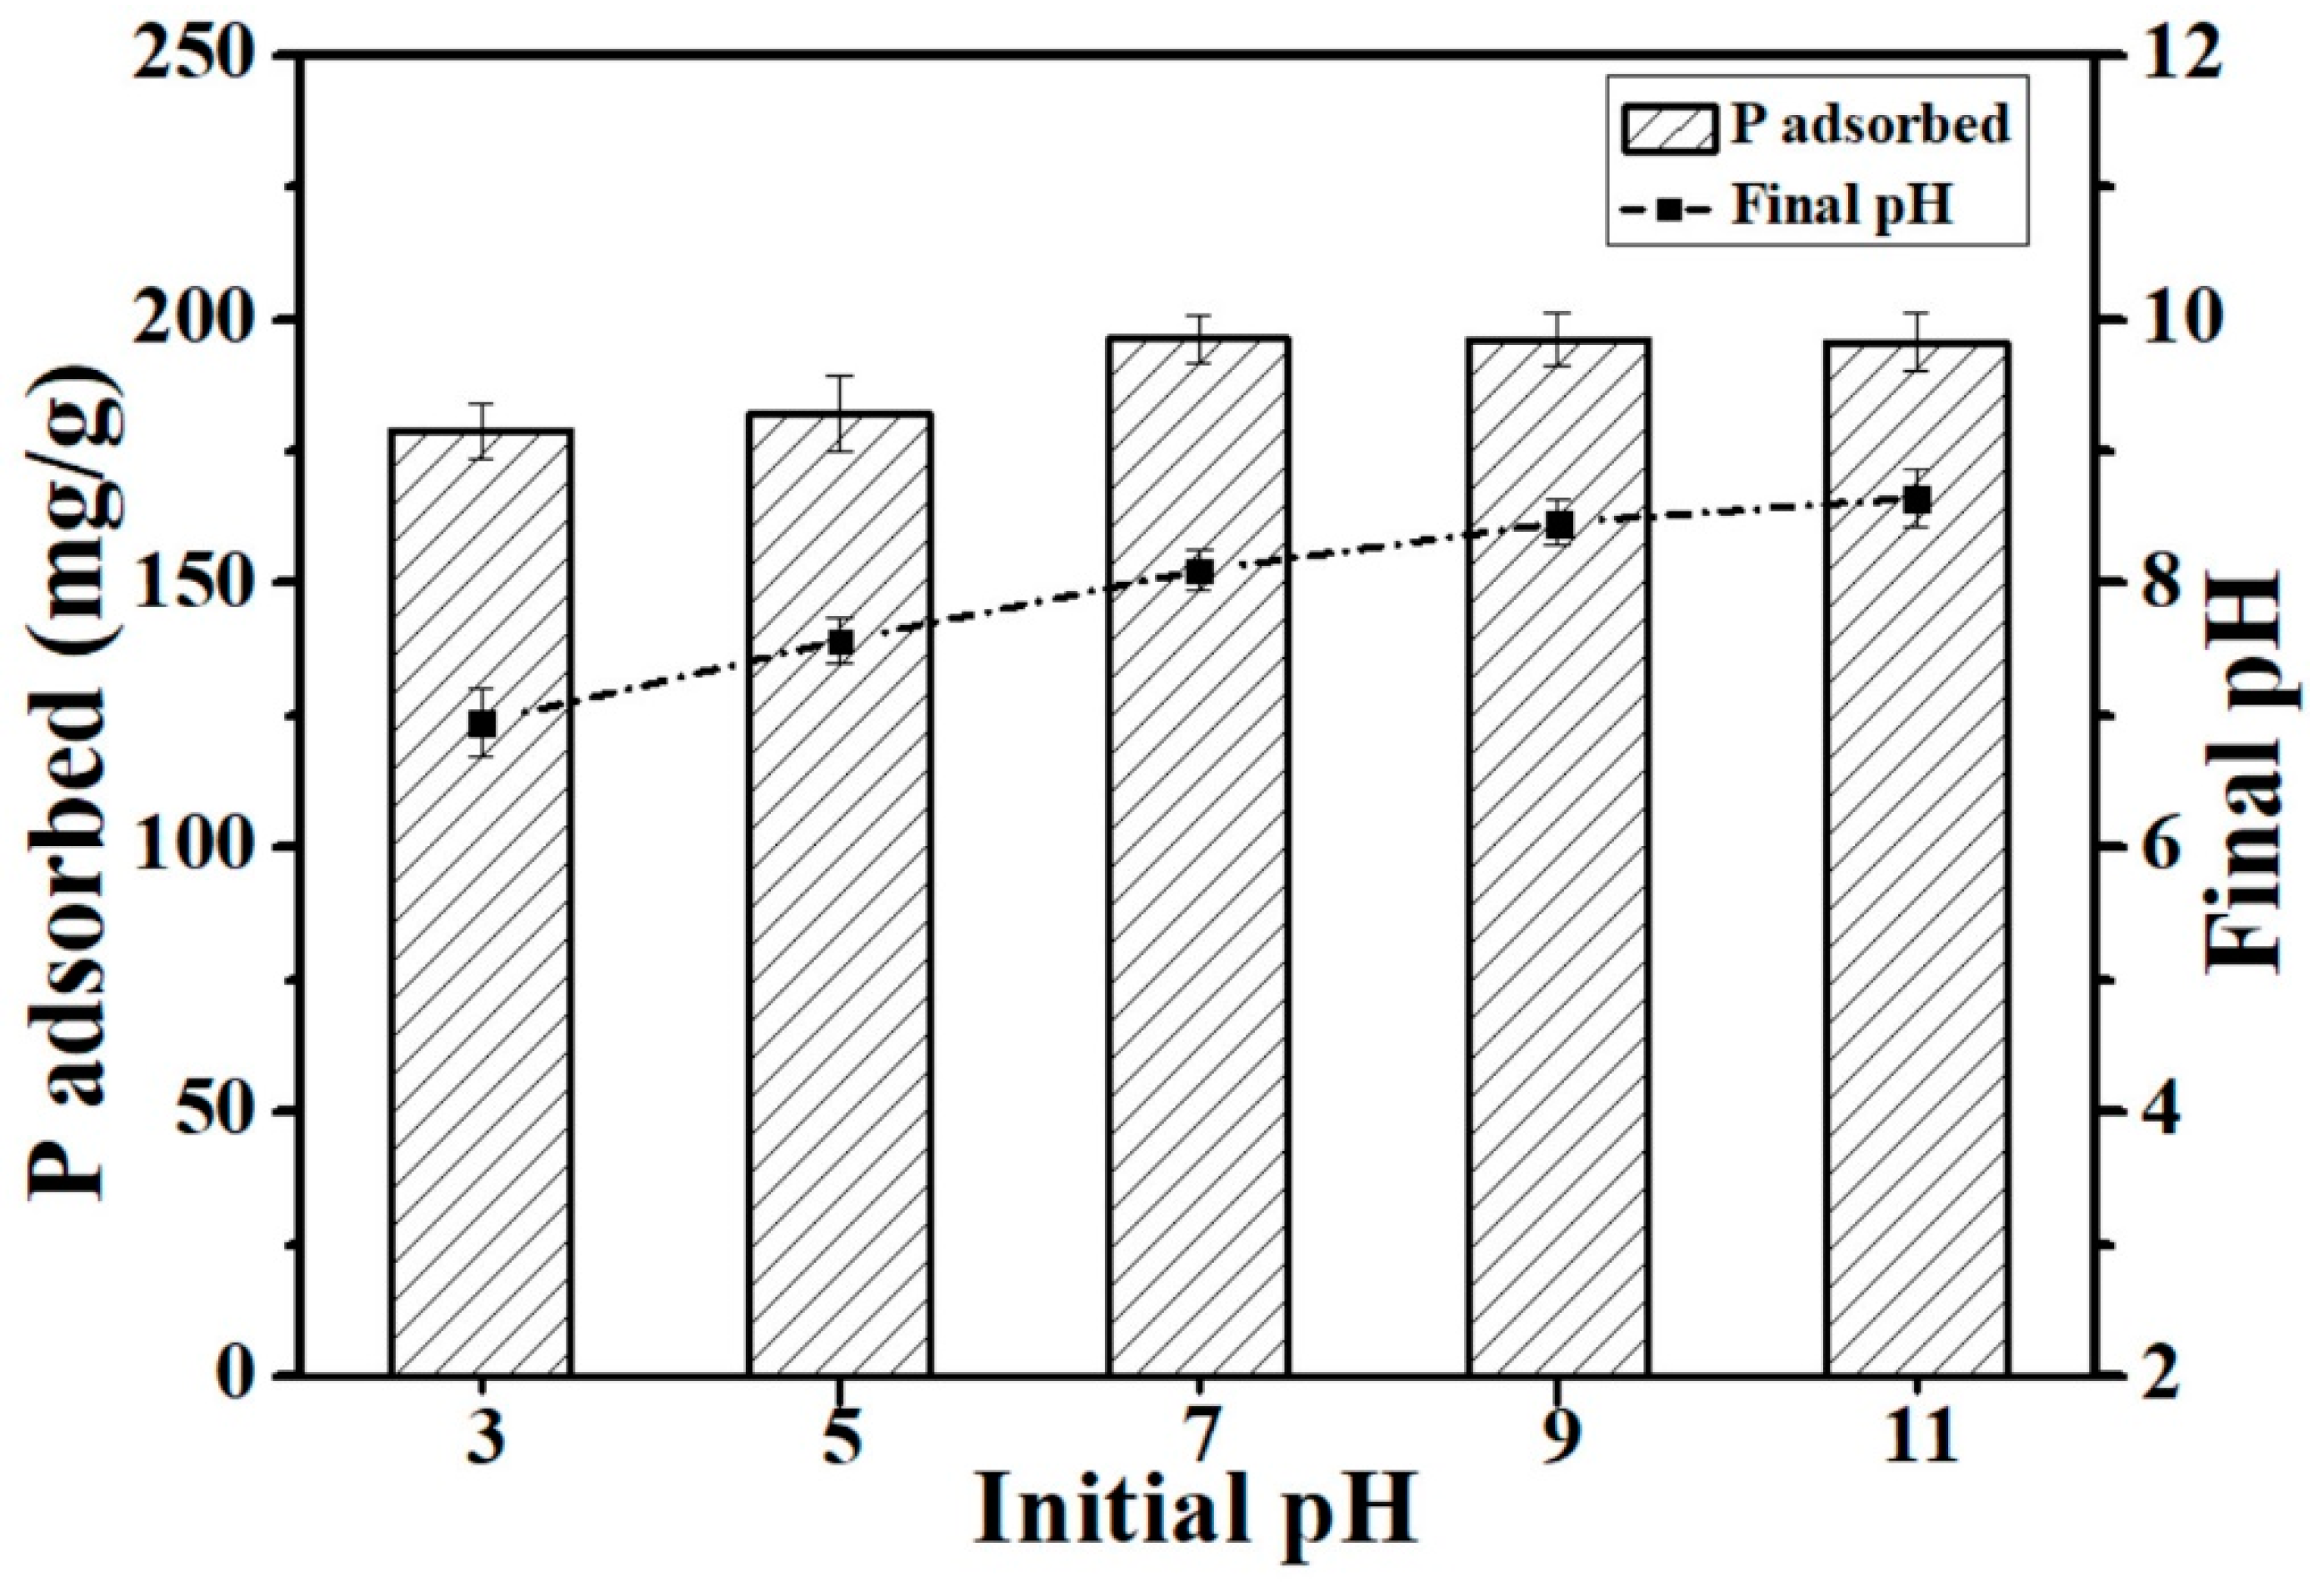
3.4. Influence of pH

The pH of the environment is an important factor in the adsorption process. The effect of the solution’s pH on the adsorption of P onto Ca-BC (2:1)-T900 was examined. The P adsorption amount on Ca-BC (2:1)-T900 significantly increased from 178.9 mg/g at pH = 3 to 196.2 mg/g at pH = 7 (Figure 5), and the P adsorption amount on the Ca-BC (2:1)-T900 did not significantly decrease to 196.1 mg/g at pH = 9 and 195.7 mg/g at pH = 11 (Figure 5), respectively. Thus, over a wide initial pH range of 3–11, the Ca-BC (2:1)-T900 showed a good adsorption effect on P.
The ionization balance of P can be influenced by solution pH; at different pH values, the phosphate forms are different, so the adsorption effect of the adsorbent for P may be affected. The phosphate species present in the aqueous solutions are H3PO4 (pH < 2.15), H2PO4 (2.15 < pH < 7.20), HPO42− (7.20 < pH < 12.33), and PO43− (pH > 12.33), depending on the pH [25]. Above the three phosphate forms, the PO43− is the easiest to be adsorbed onto the surface of the adsorbent, and the HPO42− comes second. This is due to the fact that the presence of H+ can hinder the complexion of P with Ca [18,19], indicating that the presence of H+ most likely pacifies the active binding sites for P [18,28]. In addition, calcium active components contribute to the adsorption of P onto the Ca-BC (2:1)-T900 by strong chemical interaction mechanisms, resulting in the high adsorption capacity of the Ca-BC (2:1)-T900 for P over a wide pH range (3–11).

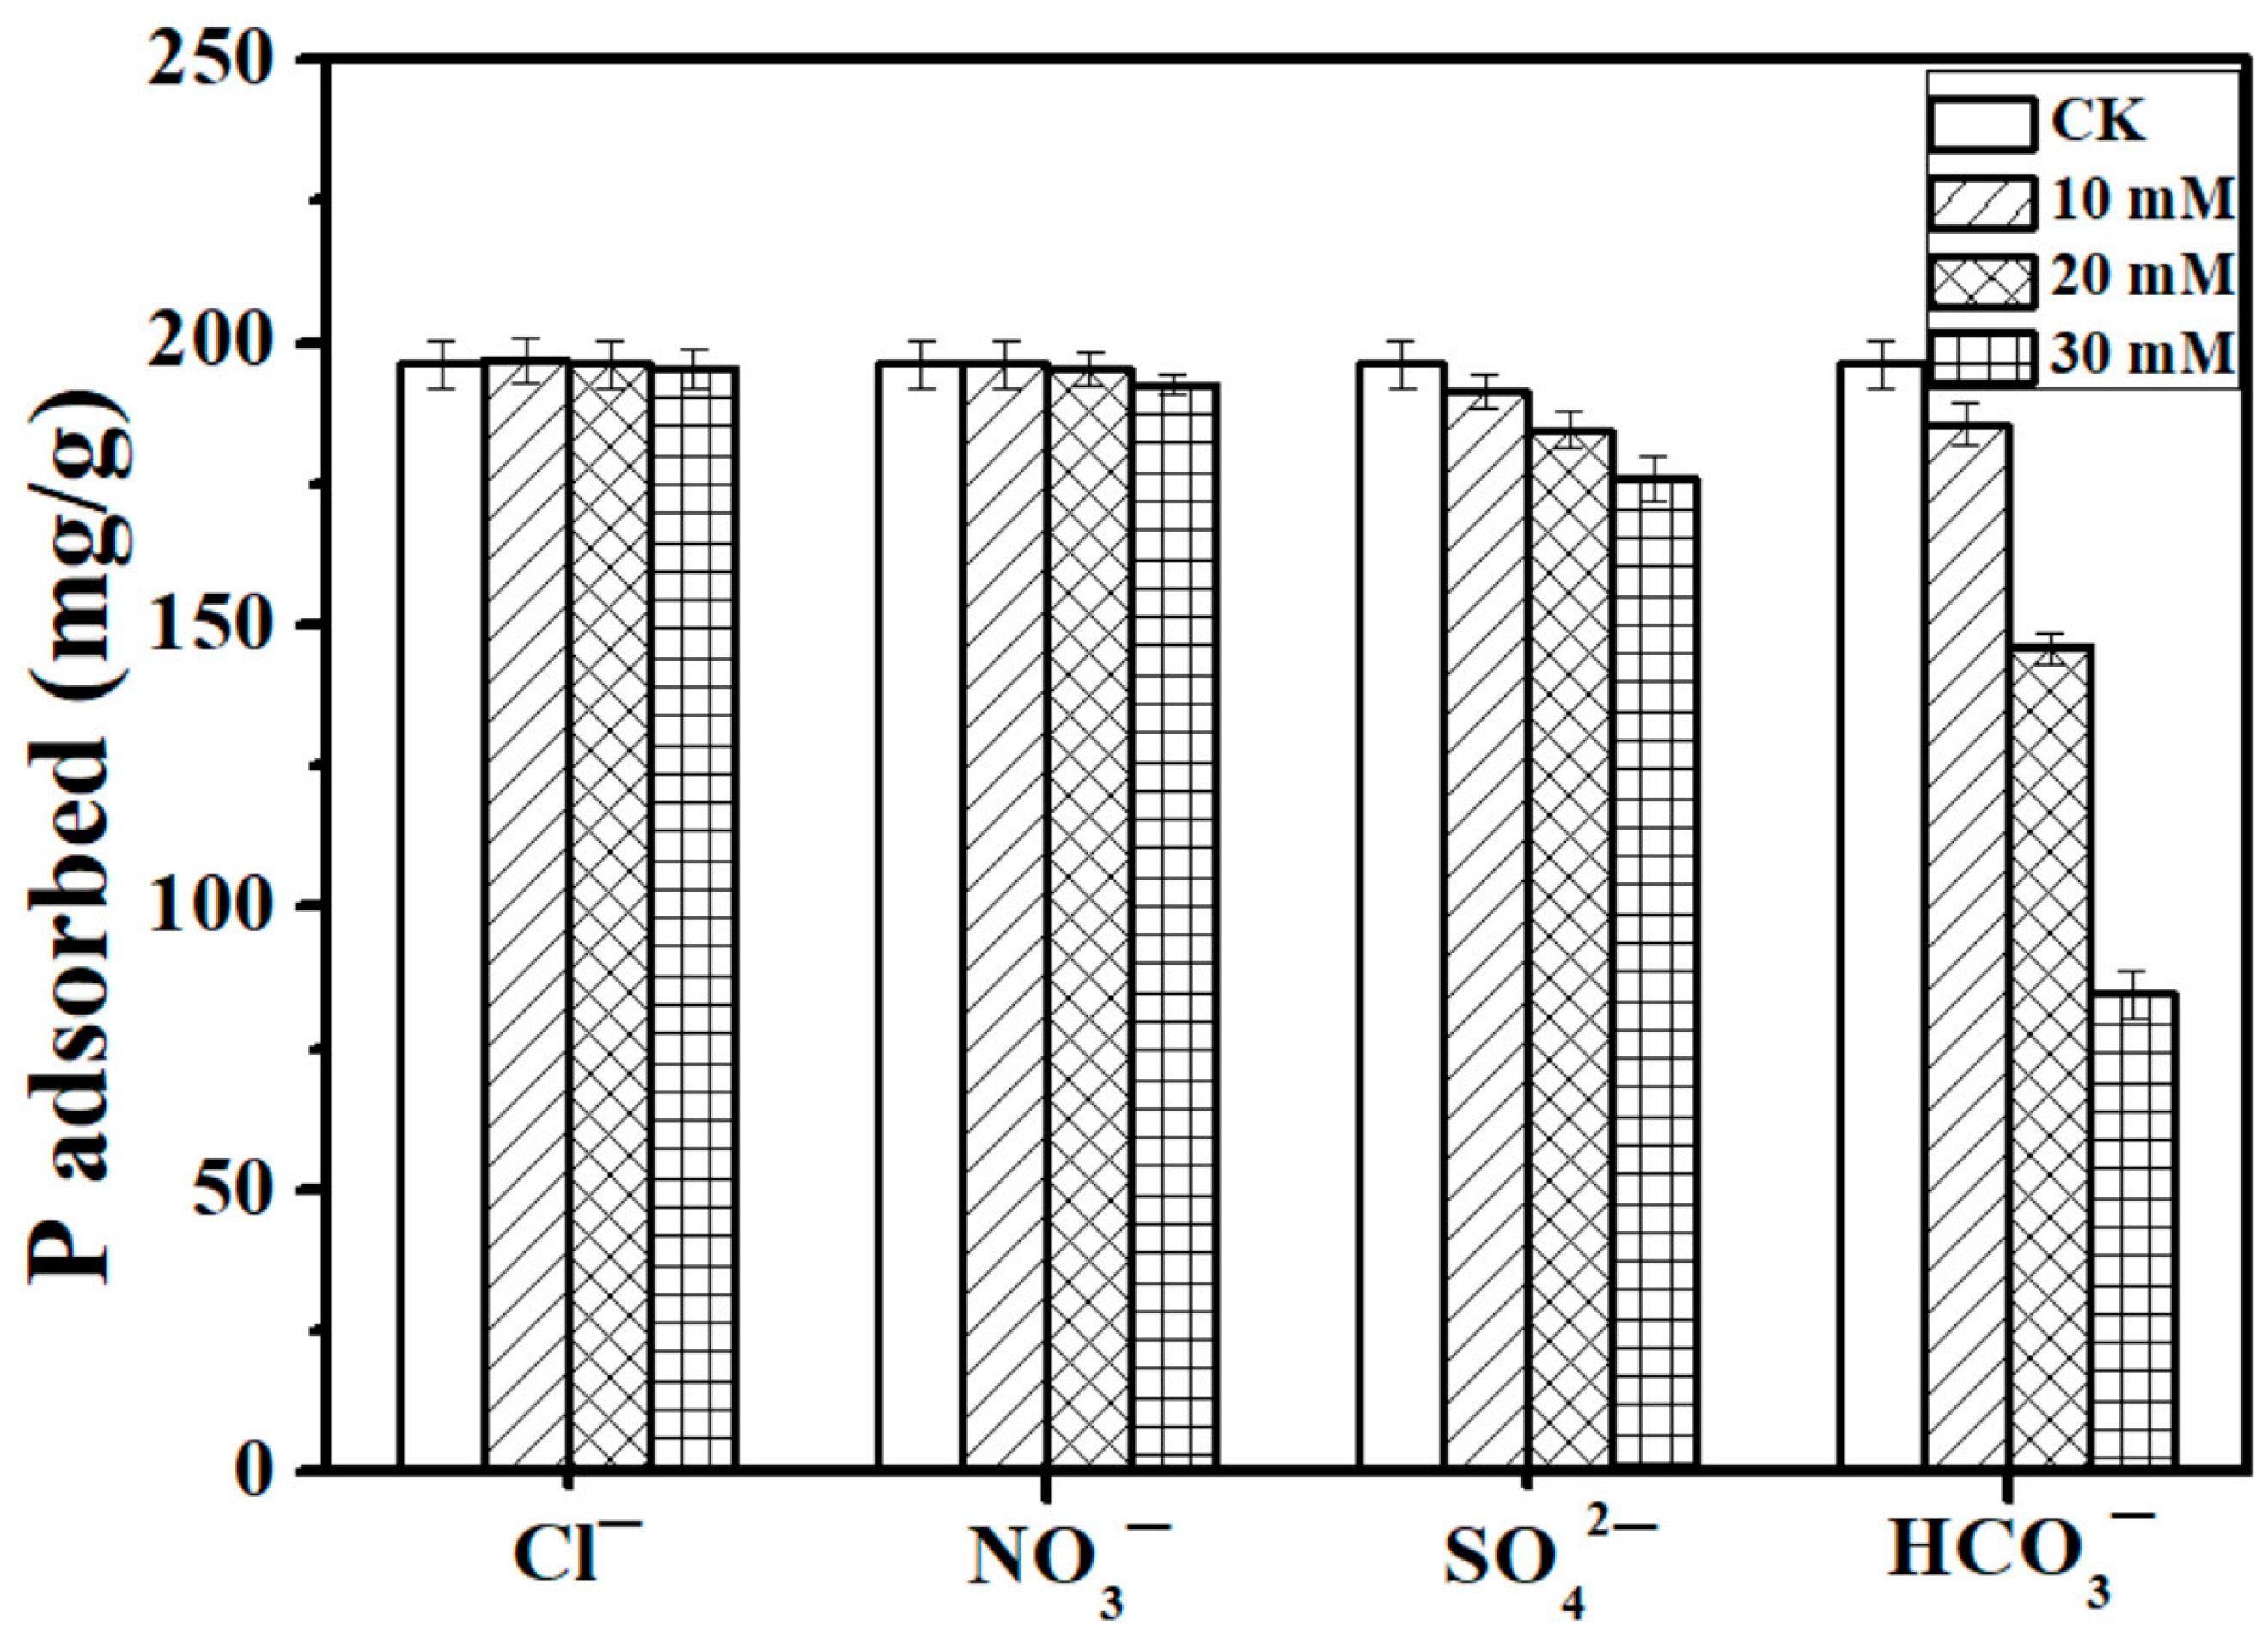
3.5. Effect of Coexisting Anions

In natural water and wastewater, some common anions may compete for adsorption sites with P [30]. In this study, the concentrations of different coexisting anions, Cl, NO3, SO42−, and HCO3 (10, 20, 30) mM, were much higher than the initial P concentration of 100 mg/L (3.23 mM) (Figure 6). The common anions have different levels of effect on the P adsorption capacity of the Ca-BC (2:1)-T900 adsorbent materials, following the order HCO3 > SO42− > NO3 > Cl. The results showed that the anions Cl, NO3, and SO42− had a limited effect on the adsorption process of P; even the ion concentrations were high, up to 30 mmol/L for Cl and NO3, and the adsorption capacity of P remained at 195.5 mg/g and 192.5 mg/g, respectively. As the concentration of SO42− was gradually increased from the blank control to 10 mM, 20 mM, and 30 mM, the adsorption capacity of Ca-BC (2:1)-T900 decreased from 196.2 to 191.3, 184.5, and 175.8 mg/g, respectively, and the removal rate of P decreased from 39.2% of the blank control to 38.2%, 36.9%, and 35.2%, respectively.
On the other hand, HCO3 had a significant negative effect on the adsorption of P onto the Ca-BC (2:1)-T900 adsorbent. With the concentration of HCO3 having gradually increased, the P adsorption amount of the Ca-BC (2:1)-T900 adsorbent had a significant downward trend. The HCO3 ionization in the solution can generate CO32−, and the adsorption sites in the Ca-BC (2:1)-T900 are reduced because the CO32− competes with P to bind Ca. Similar results have been reported in the study of other calcium-rich phosphate adsorbents [31].
However, in this study, concentrations of different coexisting anions, Cl, NO3, SO42−, and HCO3 (10, 20, 30) mM, are also much higher than the typical concentrations of these anions in wastewater [32]. Given the typical concentrations of anions in wastewater, the coexisting anions Cl, NO3, SO42−, and HCO3 (10, 50 and 100 mg/L) were selected in Liu’s study [32], and the coexisting anions Cl, NO3, SO42−, and HCO3 (1, 5, and 10 mM) were selected in Deng’s study [19] to test the effects of competing anions on P adsorption by the adsorbent. In this study, the minimum HCO3 coexisting ion concentration of 10 mM we selected was not lower than the highest typical HCO3 concentration from the above reports. When the HCO3 concentration increased from 0 to as high as 10 mM, the adsorption capacity of the Ca-BC (2:1) -T900 just decreased by 5.5% from 196.2 to 185.5 mg/g. So, the above results show that Ca-BC (2:1)-T900 has significant potential in practical P-containing wastewater applications, even in the presence of Cl, NO3, SO42−, and HCO3 common ions.

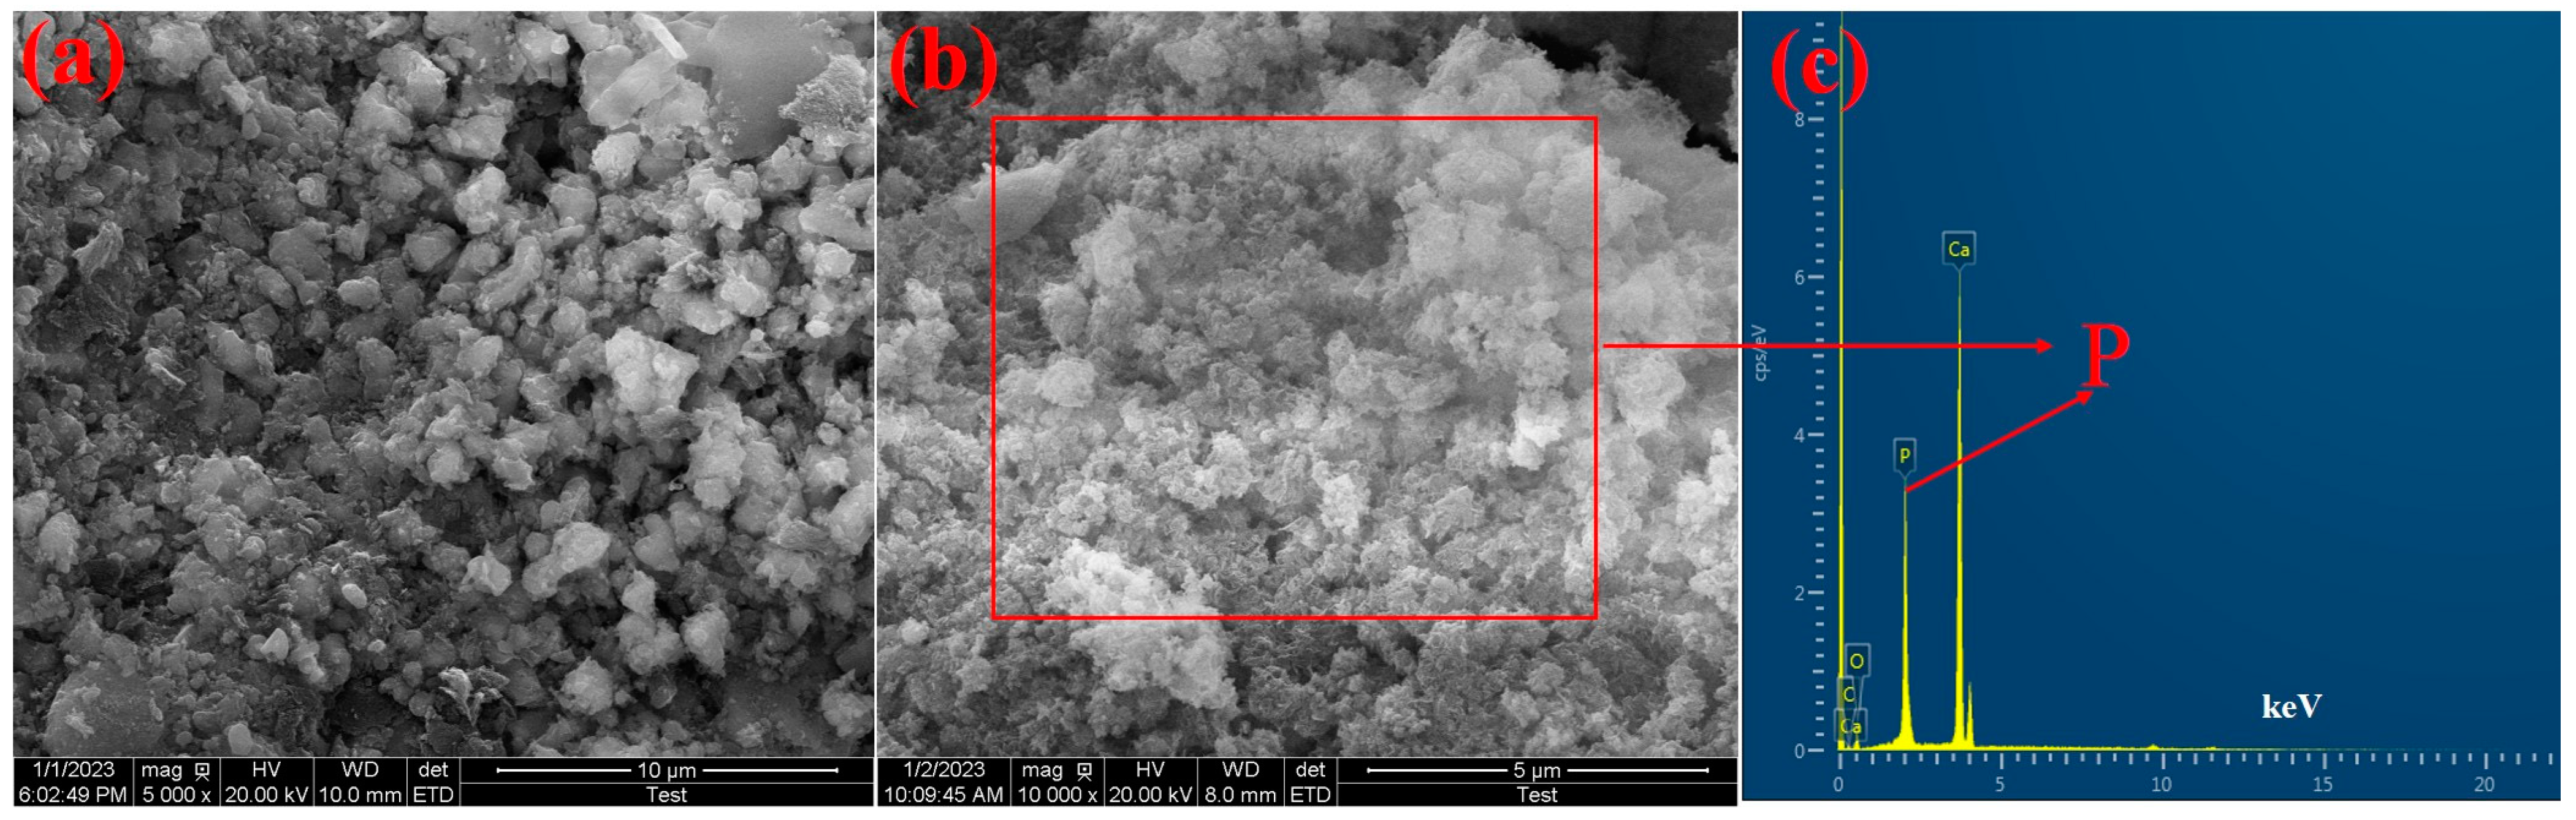
3.6. Adsorption Mechanisms

The adsorbent materials before and after P adsorption were analyzed by XRD, SEM, and FTIR, and the adsorption mechanisms of P onto the Ca-BC (2:1)-T900 adsorption materials were discussed. Before and after the adsorption of P, the characteristic peaks of the BC had no significant change according to the FTIR spectra analysis (Figure 7). This was attributed to the fact that the ingredients in the BC did not react chemically with the phosphates. The weak P adsorption property of the BC might be related to the physical adsorption. A small amount of P might be adsorbed into the pores of the BC. However, before and after the adsorption of P, the characteristic peaks of Ca-BC (2:1)-T900 had a significant change by the FTIR spectra analysis (Figure 7). Before adsorption, the peaks at 875 cm−1 and 3641 cm−1 (O-H) were attributed to Ca-O and Ca (OH)2 for Ca-BC (2:1)-T900, respectively [29]. After adsorption, the peak at 875 cm−1 (Ca-O) weakened, and the result showed that complexes (Ca-O-P) might be formed between P and Ca-O. The peak at 3641 cm−1 (O-H) vanished, and it showed that the -OH took part in the chemical adsorption process of P. Furthermore, the peak at 1024 cm−1 (P-O) was significantly enhanced, and it showed that P was adsorbed onto Ca-BC (2:1)-T900. Similar results were reported by other researchers [19,28].
The diffraction patterns of Ca-BC (2:1)-T900 before and after the adsorption of P showed a significant change in the XRD spectra analysis (Figure 8). Before adsorption, Ca-BC (2:1)-T900 had CaO’s characteristic peaks (PDF #37-1497, 2θ = 32.2°, 37.5°, 54.0°, 64.2°, 67.4°, 79.7°, and 88.6°) and Ca(OH)2′s characteristic peaks (PDF #04-0733, 2θ = 18.1°, 28.7°, 34.2°, 47.1°, and 50.9°). CaO and Ca(OH)2 are active sites in the Ca-BC (2:1)-T900 for P adsorption. The above results showed that Ca from the oyster shells was successfully introduced into the Ca-BC (2:1)-T900 materials and exists in the forms of CaO and Ca(OH)2. CaO was produced by the calcination of CaCO3 in the oyster shells. Ca(OH)2 was produced from a part of CaO hydrates with H2O in the environment. After adsorption, the diffraction peaks of CaO and Ca(OH)2 vanished, and Ca-BC (2:1)-T900 had Ca5(PO4)3OH’s characteristic peaks (PDF #09-0432, 2θ = 25.9°, 28.2°, 32.3°, 39.8°, 46.7°, 49.5°, and 53.2°). The Ca5(PO4)3OH is generated from the reaction of phosphate with CaO or Ca(OH)2.
Meanwhile, as seen from Figure 8, the mineral structure of Ca-BC was altered through pyrolysis. All of the Ca in the Ca-BC pyrolysis at 700 °C existed in the form of calcite (CaCO3); the Ca in the Ca-BC pyrolysis at 800 °C was composed of lime (CaO), portlandite (Ca(OH)2), and calcite, and Ca in Ca-BC pyrolysis at 900 °C was composed of lime (CaO) and portlandite (Ca(OH)2), not calcite. Because CaO and Ca(OH)2 are more likely to precipitate with P than CaCO3 [33], P adsorption was considered to increase in Ca-BC (2:1)-T900. Similar mineral structural changes occurred during the eggshell pyrolysis at 700–900 °C [33]. As shown in Table 1, with the increase in the pyrolysis temperature, the Ca content increased. So, the Ca-BC’s adsorption capacity for P increased with the pyrolysis temperature, increasing from 700 °C to 900 °C, which was mainly attributed to the higher calcium oxide content at higher pyrolysis temperatures.
The morphologies of the Ca-BC (2:1)-T900 adsorbent materials before and after the adsorption of P showed a significant change in the SEM images (Figure 9). Before the adsorption of P, the surface of the Ca-BC (2:1)-T900 is relatively clean, but many impurity particles appear on the surface of the Ca-BC (2:1)-T900. These particles are CaO and Ca(OH)2. After the adsorption of P, on the surface of the adsorbents appeared a lot of flocculent materials, and the pores of the Ca-BC (2:1)-T900 were blocked, indicating that CaO or Ca(OH)2 on the Ca-BC (2:1)-T900 introduced by the eggshells should have a chemical reaction with P. As seen in Figure 9c, after the adsorption of P, the phosphorus element is distributed on the Ca-BC (2:1)-T900. So, combined with Figure 8, it can be inferred that the newly formed compound on the Ca-BC (2:1)-T900 should be Ca5(PO4)3OH.
According to the above results, the mechanisms of Ca-BC (2:1)-T900 to adsorb P include physical adsorption, surface precipitation, and electrostatic attraction. The dominant sorption mechanism of Ca-BC (2:1)-T900 for P is that CaO or Ca(OH)2 reacts with phosphate to form Ca5(PO4)3OH precipitates, and the result is similar to other studies [17,19,28].

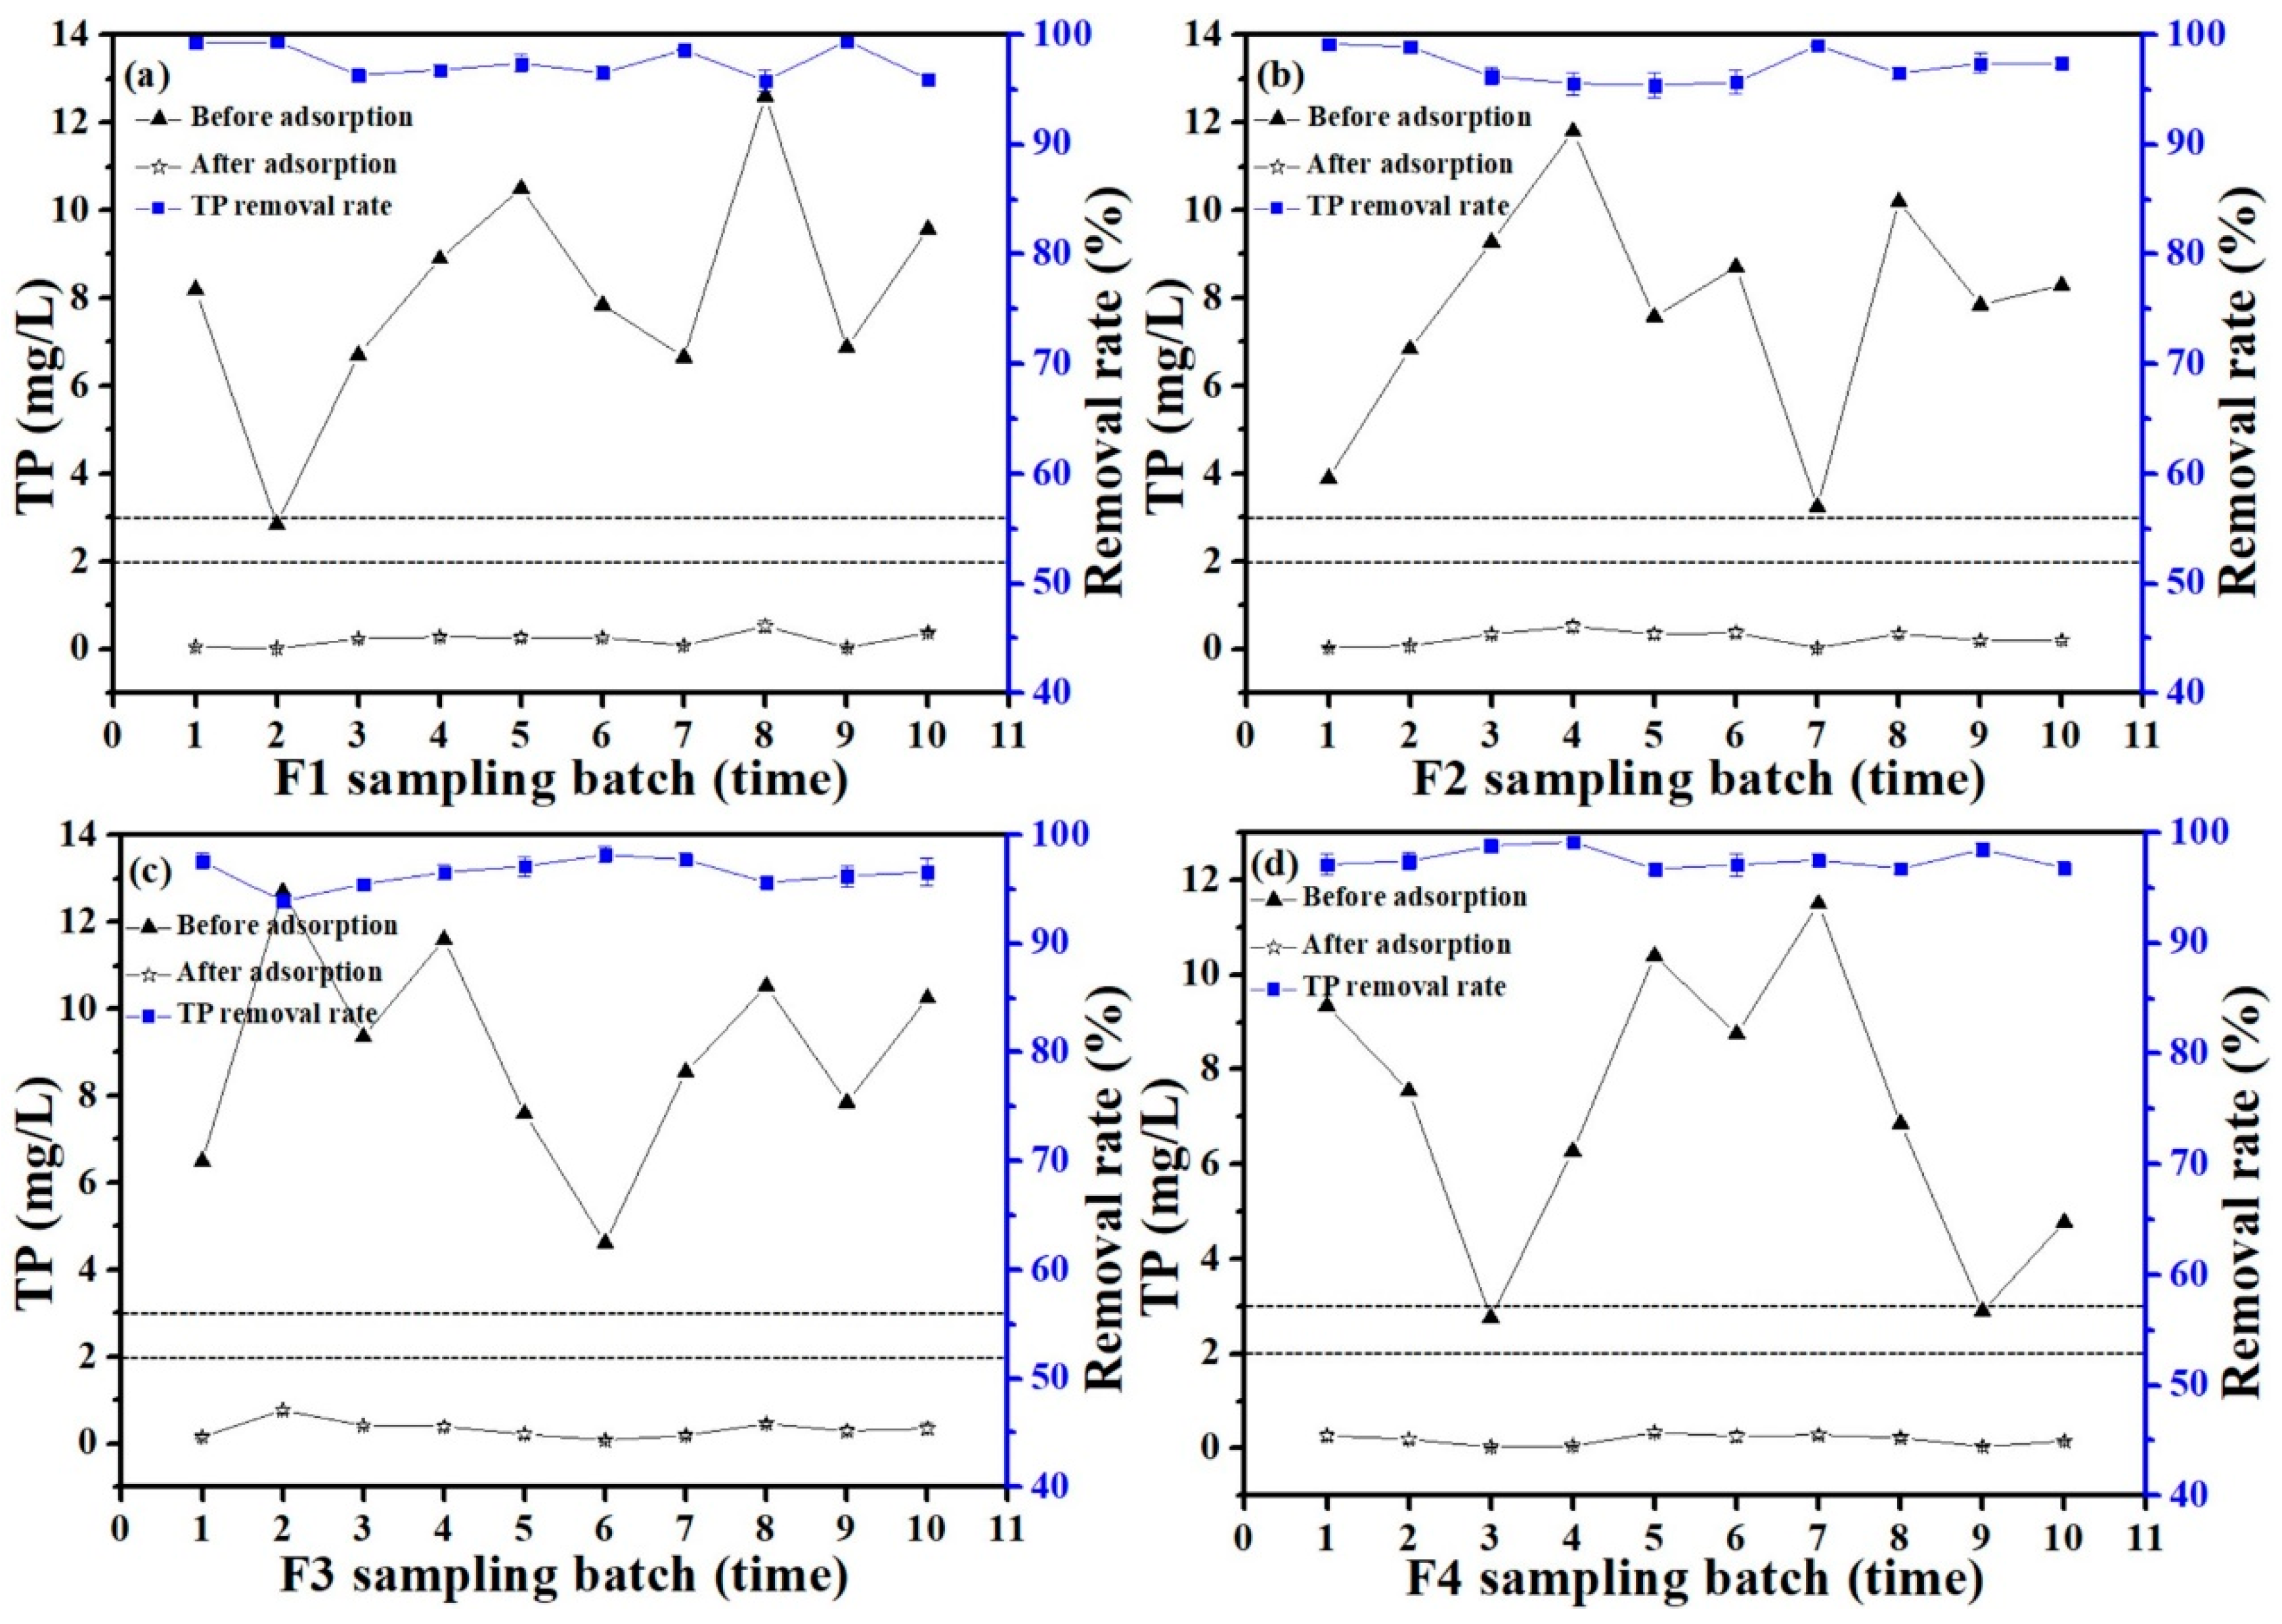
3.7. Removal of Phosphorus by Ca-BC (2:1)-T900 from Rural Sewage Tailwater

It can be observed from Figure 10 that the discharge of the TP in the rural domestic sewage from four centralized rural sewage treatment facilities in all the sampling batches, except for three times, exceeded the second-grade Discharge Standard of Water Pollutants for Centralized Rural Sewage Treatment Facilities (DB33/973-2021) (TP < 3 mg/L) in this study [34]. It can be seen from Table 2 that the discharge of the NH3-N, COD, and pH in the rural sewage of four centralized rural sewage treatment facilities in all the sampling batches met the secondary class of Discharge Standard of Water Pollutants for Centralized Rural Sewage Treatment Facilities (DB33/973-2021) (COD < 100 mg/L, NH3-N < 25 mg/L, and pH 6–9) [34]. Phosphorus becomes the main limiting factor for reaching the discharge standard.
Figure 10 presents the results of the P adsorption by adding 0.01 g of Ca-BC (2:1)-T900 of the adsorbent materials to 50 mL of actual rural sewage. The TP content in the rural domestic sewage of F1 was 2.85–12.6 mg/L (Figure 10a), the TP content was 0.18–0.53 mg/L after the adsorption, and the TP removal rate reached 95.8–99.4%. The TP content in the rural domestic sewage of F2 was 3.9–11.8 mg/L (Figure 10b), the TP content was 0.033–0.52 mg/L after the adsorption, and the TP removal rate reached 95.4–99.2%. The TP content in the rural domestic sewage of F3 was 4.62–12.7 mg/L (Figure 10c), the TP content was 0.083–0.77 mg/L after the adsorption, and the TP removal rate reached 93.9–98.2%. The TP content in the rural domestic sewage of F4 was 2.76–11.5 mg/L (Figure 10d), the TP content was 0.033–0.29 mg/L after the adsorption, and the TP removal rate reached 96.7–99.2%. After the adsorption treatment, the discharge of the TP in the rural sewage of all four centralized rural sewage treatment facilities meets the secondary Discharge Standard of Water Pollutants for Centralized Rural Sewage Treatment Facilities (DB33/973-2021) (TP < 3 mg/L), and even the primary Discharge Standard of Water Pollutants for Centralized Rural Sewage Treatment Facilities (DB33/973-2021) (TP < 2 mg/L) [34].
Many complex components may be present in the actual wastewater, which can interfere with P removal by the adsorbent. In this study, the Ca-BC (2:1)-T900 adsorbent materials also exhibited high P adsorption capacity under actual rural sewage. Therefore, the Ca-BC (2:1)-T900 adsorbent materials should have great potential in the treatment of large-scale rural domestic sewage containing P.
The main components of Ca-BC (2:1)-T900 biochar materials are O, C, Ca, and H; these elements are environmentally friendly, and the adsorbents have a mesoporous structure. After the adsorption of P, a good deal of Ca5(PO4)3(OH) is produced on the Ca-BC (2:1)-T900 adsorbent materials, which are rich in P and also have the physical properties of biochar. So, the P-adsorbed Ca-BC (2:1)-T900 adsorbent materials may be further used as soil regulators and fertilizers. This method can realize the reuse of Ca-BC and realize the virtuous cycle of P resources in the ecosystem [19,28,31].
The adsorbents’ cost of raw material is one of the important factors influencing their practical application. In this study, the Ca-BC adsorbent was prepared from oyster shell waste and rice husks, so the cost of the raw materials was low. However, apart from the cost of the raw materials, the energy cost of calcination is also one of the major costs in the preparation of biochar adsorbents. Therefore, the removal effect of P, the cost of the Ca-BC adsorbent, and the benefit of P recovery should be comprehensively evaluated in the future possible engineering application of rural domestic sewage treatment.

4. Conclusions

In this study, Ca-modified biochar (Ca-BC) adsorbent materials were prepared by a simple one-step pyrolysis method utilizing oyster shell waste and agricultural waste–rice husk as raw materials. The Ca-BC adsorbents were used to remove P from the aqueous solutions, and the results showed that the prepared Ca-BC adsorbent materials exhibited excellent performance of P adsorption from the aqueous solution in a wide range of solution pHs (pH 3–11) and adsorption selectivity. The maximum adsorption capacity of 196.2 mg/g was obtained by the Ca-BC sample, which was prepared from oyster shells and rice husks with a mass ratio of 2:1 and a pyrolysis temperature of 900 °C. The dominant sorption mechanism for phosphate is that CaO or Ca(OH)2 reacts with phosphate to generate a Ca5(PO4)3OH precipitate. Ca-BC can effectively remove P from rural domestic sewage. The removal rate of the TP in the rural domestic sewage is 93.9–99.4%. After the adsorption treatment, the discharge of the TP in rural sewage meets the second-grade Discharge Standard of Water Pollutants for Centralized Rural Sewage Treatment Facilities (DB33/973-2021) (TP < 3 mg/L), and even the first-grade Discharge Standard of Water Pollutants for Centralized Rural Sewage Treatment Facilities (DB33/973-2021) (TP < 2 mg/L). This study provides an experimental basis for efficient P removal by Ca-BC adsorbent materials and suggests possible applications in rural domestic sewage.

Author Contributions

C.X. conducted the analysis of the data, as well as the data modeling, and wrote the paper; R.L. and L.C. contributed to the writing of the paper. All authors have read and agreed to the published version of the manuscript.

Funding

This research was supported by the National Key Research and Development Program of China (No. 2020YFD1100103-2), the Leading Talent of the Science & Technology Nova Program of Zhejiang (2020R52039), and the Outstanding Innovative Team Supporting Plan of Jiaxing City.

Institutional Review Board Statement

Not applicable.

Informed Consent Statement

Not applicable.

Data Availability Statement

The data are contained within the article.

Conflicts of Interest

The authors declare no conflict of interest.

References

  1. Chen, P.Z.; Zhao, W.J.; Chen, D.K.; Huang, Z.P.; Zhang, C.X.; Zheng, X.Q. Research Progress on Integrated Treatment Technologies of Rural Domestic Sewage: A Review. Water 2022, 14, 2439. [Google Scholar] [CrossRef]
  2. Gonzalez-Tineo, P.A.; Durán-Hinojosa, U.; Delgadillo-Mirquez, L.R.; Meza-Escalante, E.R.; Gortáres-Moroyoqui, P.; Ulloa-Mercado, R.G.; Serrano-Palacios, D. Performance improvement of an integrated anaerobic-aerobic hybrid reactor for the treatment of swine wastewater. J. Water Process Eng. 2020, 34, 101164. [Google Scholar] [CrossRef]
  3. Yang, F.L.; Zhang, H.R.; Zhang, X.Z.; Zhang, Y.; Li, J.H.; Jin, F.M.; Zhou, B.X. Performance analysis and evaluation of the 146 rural decentralized wastewater treatment facilities surrounding the Erhai Lake. J. Clean Prod. 2021, 315, 128159. [Google Scholar] [CrossRef]
  4. Navarathna, C.M.; Pennisson, J.E.; Dewage, N.B.; Reid, C.; Dotse, C.; Jazi, M.E.; Rodrigo, P.M.; Zhang, X.; Farmer, E.; Watson, C.; et al. Adsorption of Phosphates onto Mg/Al-Oxide/Hydroxide/Sulfate-Impregnated Douglas Fir Biochar. Processes 2023, 11, 111. [Google Scholar] [CrossRef]
  5. Crisler, G.B.; Hernandez, C.G.; Orr, A.; Davis, R.; Schauwecker, T.; Johnson, J.C.; Sparks, D.; Brown, A.; Wilding, K.; Navarathna, C.; et al. Remediation of Aqueous Phosphate Agricultural Runoff Using Slag and Al/Mg Modified Biochar. Processes 2022, 10, 1561. [Google Scholar] [CrossRef]
  6. Yadav, D.; Kapur, M.; Kumar, P.; Mondal, M.K. Adsorptive removal of phosphate from aqueous solution using rice husk and fruit juice residue. Process Saf. Environ. 2015, 94, 402–409. [Google Scholar] [CrossRef]
  7. Luo, D.; Wang, L.Y.; Nan, H.Y.; Cao, Y.J.; Wang, H.; Kumar, T.V.; Wang, C.Q. Phosphorus adsorption by functionalized biochar: A review. Environ. Chem. Lett. 2023, 21, 497–524. [Google Scholar] [CrossRef]
  8. Arwenyo, B.; Navarathna, C.; Das, N.K.; Hitt, A.; Mlsna, T. Sorption of Phosphate on Douglas Fir Biochar Treated with Magnesium Chloride and Potassium Hydroxide for Soil Amendments. Processes 2023, 11, 331. [Google Scholar] [CrossRef]
  9. He, Q.H.; Luo, Y.; Feng, Y.Y.; Xie, K.; Zhang, K.Q.; Shen, S.Z.; Luo, Y.L.; Wang, F. Biochar produced from tobacco stalks, eggshells, and Mg for phosphate adsorption from a wide range of pH aqueous solutions. Mater. Res. Express. 2020, 7, 115603. [Google Scholar] [CrossRef]
  10. Chen, S.H.; Chu, W.H.; Wei, H.B.; Zhao, H.Y.; Xu, B.; Gao, N.Y.; Yin, D.Q. Characteristics and mechanisms of phosphorous adsorption by rape strawderived biochar functionalized with calcium from eggshell. Bioresour. Technol. 2020, 318, 124063. [Google Scholar]
  11. Li, R.H.; Wang, J.J.; Zhou, B.Y.; Awasthi, M.K.; Ali, A.; Zhang, Z.Q.; Lahori, A.H.; Mahar, A. Recovery of phosphate from aqueous solution by magnesium oxide decorated magnetic biochar and its potential as phosphate-based fertilizer substitute. Bioresour. Technol. 2016, 215, 209–214. [Google Scholar] [CrossRef]
  12. Zhao, L.; Cao, X.D.; Wang, Q.; Yang, F.; Xu, S. Mineral Constituents Profi le of Biochar Derived from Diversifi ed Waste Biomasses: Implications for Agricultural Applications. J. Environ. Qual. 2013, 42, 545–552. [Google Scholar] [CrossRef]
  13. Yang, J.; Zhang, M.L.; Wang, H.X.; Xue, J.B.; Lv, Q.; Pang, G.B. Efficient Recovery of Phosphate from Aqueous Solution Using Biochar Derived from Co-pyrolysis of Sewage Sludge with Eggshell. J. Environ. Chem. Eng. 2021, 9, 105354. [Google Scholar] [CrossRef]
  14. Zhang, M.; Song, G.; Gelardi, D.L.; Huang, L.B.; Khan, E.; Mašek, O.; Parikh, S.J.; Ok, Y.S. Evaluating biochar and its modifications for the removal of ammonium, nitrate, and phosphate in water. Water Res. 2020, 186, 116303. [Google Scholar] [CrossRef]
  15. Zhang, M.D.; Chen, Q.P.; Zhang, R.R.; Zhang, Y.T.; Wang, F.P.; He, M.Z.; Guo, X.M.; Yang, J.; Zhang, X.Y.; Mu, J.L. Pyrolysis of Ca/Fe-rich antibiotic fermentation residues into biochars for efficient phosphate removal/recovery from wastewater: Turning hazardous waste to phosphorous fertilizer. Sci. Total Environ. 2023, 869, 161732. [Google Scholar] [CrossRef] [PubMed]
  16. Xu, Y.; Liao, H.; Zhang, J.; Lu, H.L.; He, X.H.; Zhang, Y.; Wu, Z.B.; Wang, H.Y.; Lu, M.H. A Novel Ca-Modified Biochar for Efficient Recovery of Phosphorus from Aqueous Solution and Its Application as a Phosphorus Biofertilizer. Nanomaterials 2022, 12, 2755. [Google Scholar] [CrossRef]
  17. Kong, L.J.; Han, M.N.; Shih, K.; Su, M.H.; Diao, Z.H.; Long, J.Y.; Chen, D.Y.; Hou, L.; Peng, Y. Nano-rod Ca-decorated sludge derived carbon for removal of phosphorus. Environ. Pollut. 2018, 233, 698–705. [Google Scholar] [CrossRef]
  18. Wang, S.D.; Kong, L.J.; Long, J.Y.; Su, M.H.; Diao, Z.H.; Chang, X.Y.; Chen, D.Y.; Song, G.; Shih, K. Adsorption of phosphorus by calcium-flour biochar: Isotherm, kinetic and transformation studies. Chemosphere 2018, 195, 666–672. [Google Scholar] [CrossRef] [PubMed]
  19. Deng, W.D.; Zhang, D.Q.; Zheng, X.X.; Ye, X.Y.; Niu, X.J.; Lin, Z.; Fu, M.L.; Zhou, S.Q. Adsorption recovery of phosphate from waste streams by Ca/Mg biochar synthesis from marble waste, calcium-rich sepiolite and bagasse. J. Clean Prod. 2021, 288, 125638. [Google Scholar] [CrossRef]
  20. Martins, M.C.; Santos, E.B.H.; Marques, C.R. First study on oyster-shell-based phosphorous removal in saltwater—A proxy to effluent bioremediation of marine aquaculture. Sci. Total Environ. 2017, 574, 605–615. [Google Scholar] [CrossRef]
  21. Yoon, G.L.; Kim, B.T.; Kim, B.O.; Han, S. Chemical-mechanical characteristics of crushed oyster-shell. Waste Manag. 2003, 23, 825–834. [Google Scholar] [CrossRef]
  22. Yin, C.; Yan, H.; Cao, Y.C.; Gao, H.F. Enhanced bioremediation performance of diesel-contaminated soil by immobilized composite fungi on rice husk biochar. Environ. Res. 2023, 226, 115663. [Google Scholar] [CrossRef]
  23. Liu, M.; Guan, L.Q.; Wen, Y.J.; Su, L.Z.; Hu, Z.; Peng, Z.J.; Li, S.K.; Tang, Q.Y.; Zhou, Z.; Zhou, N. Rice husk biochar mediated red phosphorus for photocatalysis and photothermal removal of E. coli. Food Chem. 2023, 410, 135455. [Google Scholar] [CrossRef]
  24. Parhizkar, M.; Shabanpour, M.; Lucas-Borja, M.E.; Zema, D.A. Effects of rice husk biochar on rill detachment capacity in deforested hillslopes. Ecol. Eng. 2023, 191, 106964. [Google Scholar] [CrossRef]
  25. Xie, F.Z.; Wu, F.C.; Liu, G.J.; Mu, Y.S.; Feng, C.L.; Wang, H.H.; Giesy, J.P. Removal of phosphate from eutrophic lakes through adsorption by in situ formation of magnesium hydroxide from diatomite. Environ. Sci. Technol. 2014, 48, 582–590. [Google Scholar] [CrossRef]
  26. Pan, W.L.; Xie, H.M.; Zhou, Y.; Wu, Q.Y.; Zhou, J.Q.; Guo, X. Simultaneous adsorption removal of organic and inorganic phosphorus from discharged circulating cooling water on biochar derived from agricultural waste. J. Clean Prod. 2023, 383, 135496. [Google Scholar] [CrossRef]
  27. Bacelo, H.; Pintor, A.M.A.; Santos, S.C.R.; Boaventura, R.A.R.; Botelho, C.M.S. Performance and prospects of different adsorbents for phosphorus uptake and recovery from water. Chem. Eng. J. 2020, 381, 122566. [Google Scholar] [CrossRef]
  28. Liu, X.N.; Shen, F.; Qi, X.H. Adsorption recovery of phosphate from aqueous solution by CaO-biochar composites prepared from eggshell and rice straw. Sci. Total Environ. 2019, 666, 694–702. [Google Scholar] [CrossRef] [PubMed]
  29. Mitrogiannis, D.; Psychoyou, M.; Baziotis, I.; Inglezakis, V.J.; Koukouzas, N.; Tsoukalas, N.; Palles, D.; Kamitsos, E.; Oikonomou, G.; Markou, G. Removal of phosphate from aqueous solutions by adsorption onto Ca(OH)2 treated natural clinoptilolite. Chem. Eng. J. 2017, 320, 510–522. [Google Scholar] [CrossRef]
  30. Zhuo, S.N.; Dai, T.C.; Ren, H.Y.; Liu, B.F. Simultaneous adsorption of phosphate and tetracycline by calcium modified corn stover biochar: Performance and mechanism. Bioresour. Technol. 2022, 359, 127477. [Google Scholar] [CrossRef]
  31. Liu, X.N.; Shen, F.; Smith, R.L., Jr.; Qi, X.H. Black liquor-derived calcium-activated biochar for recovery of phosphate from aqueous solutions. Bioresour. Technol. 2019, 294, 122198. [Google Scholar] [CrossRef] [PubMed]
  32. Liu, M.W.; Wang, C.Z.; Guo, J.B.; Zhang, L.H. Removal of phosphate from wastewater by lanthanum modified bio-ceramisite. J. Environ. Chem. Eng. 2021, 9, 106123. [Google Scholar] [CrossRef]
  33. Lee, J.I.; Kim, J.M.; Yoo, S.C.; Jho, E.H.; Lee, C.G.; Park, S.J. Restoring phosphorus from water to soil: Using calcined eggshells for P adsorption and subsequent application of the adsorbent as a P fertilizer. Chemosphere 2022, 287, 132267. [Google Scholar] [CrossRef] [PubMed]
  34. DB33/973-2021; Discharge Standard of Water Pollutants for Centralized Rural Sewage Treatment Facilities. The People’s Government of Zhejiang Province: Hangzhou, China, 2021. (In Chinese)
Figure 1. The amount of P adsorbed on various Ca-BC adsorbents calcined at 800 °C (Dosage: 0.2 g/L; initial P concentration: 100 mg/L; temperature: 25 °C; adsorption time: 24 h; and pH = 7).
Processes 11 02577 g001
Figure 2. The amount of P adsorbed on Ca-BC (2:1) calcined at different temperatures (Dosage: 0.2 g/L; initial P concentration: 100 mg/L; temperature: 25 °C; adsorption time: 24 h; and pH = 7).
Processes 11 02577 g002
Figure 3. P adsorption isotherms onto Ca-BC (2:1)-T900 (Dosage: 0.2 g/L; temperature: 25 °C; adsorption time: 24 h; and pH = 7).
Processes 11 02577 g003
Figure 4. P adsorption kinetics onto Ca-BC (2:1)-T900 (Dosage: 0.2 g/L; temperature: 25 °C; initial P concentration: 100 mg/L; and pH = 7).
Processes 11 02577 g004
Figure 5. The effect of the initial pH on the P adsorption capacity of Ca-BC (2:1)-T900 (Dosage: 0.2 g/L; temperature: 25 °C; adsorption time: 24 h; and initial P concentration: 100 mg/L).
Processes 11 02577 g005
Figure 6. Effect of coexisting ions (Cl, NO3, SO42−, and HCO3) on P adsorption capacity of Ca-BC (2:1)-T900 (Dosage: 0.2 g/L; temperature: 25 °C; adsorption time: 24 h; and initial P concentration: 100 mg/L).
Processes 11 02577 g006
Figure 7. The FTIR spectra of BC and Ca-BC (2:1)-T900 before and after P adsorption.
Processes 11 02577 g007
Figure 8. X-ray diffraction pattern of Ca-BC adsorbent materials at different pyrolysis temperatures before and after phosphorus adsorption.
Processes 11 02577 g008
Figure 9. SEM photographs of Ca-BC (2:1)-T900 before (a) and after (b) adsorption; (c) EDS image of Ca-BC (2:1)-T900 after adsorption.
Processes 11 02577 g009
Figure 10. The removal rate of TP in rural domestic sewage by Ca-BC (2:1)-T900 (a) F1, (b) F2, (c) F3, and (d) F4 (Dosage: 0.2 g/L; temperature: 25 °C; and adsorption time: 6 h).
Processes 11 02577 g010
Table 1. Specific surface area, pore volume, average pore size, and major elements of Ca-BC and BC.
AdsorbentPhysical PropertiesMajor Element
Specific Surface Area (m2/g)Pore Volume (cm3/g)Average Pore Size (nm)C
(%)
O
(%)
Ca
(%)
Ca-BC (2:1)-T70021.260.0254.6726.9453.711.26
Ca-BC (2:1)-T80040.840.0393.7719.1548.8212.94
Ca-BC (2:1)-T90046.190.0564.826.0452.1729.57
BC-T8009.190.0193.1276.0418.950.19
Table 2. Pollutant concentration of rural residential sewage from four centralized rural sewage treatment facilities secondary sedimentation tank.
FacilityTP (mg/L)COD (mg/L)pHNH3-N (mg/L)
F12.85–12.645–826.8–7.311.2–23.5
F23.9–11.838–726.7–7.26.5–20.3
F34.62–12.742–866.9–7.48.9–21.6
F42.76–11.545–786.8–7.45.2–19.8
Disclaimer/Publisher’s Note: The statements, opinions and data contained in all publications are solely those of the individual author(s) and contributor(s) and not of MDPI and/or the editor(s). MDPI and/or the editor(s) disclaim responsibility for any injury to people or property resulting from any ideas, methods, instructions or products referred to in the content.

