3.1. Structural Design and Process Preparation of MEMS Sensors
Micro hotplates play an important role in MEMS sensors. Porphyrin-sensitive materials are coated on their signal electrodes, and after encapsulation, corresponding gas sensors can be obtained. The micro hot plate includes multiple components, such as heating electrodes, insulation layer, signal electrode plate, etc. The signal electrode plate can collect gas-sensitive signal changes, and the insulation layer has thermal conductivity. When a certain voltage is continuously applied to the micro hot plate, the heating electrode generates heat through the Joule heat effect of the metal. Through three heat transfer methods, namely, heat convection, heat conduction, and heat radiation, heat transfer is carried out between the layers of the micro hot plate, while heat loss is also generated, so that the whole micro hotplate is in a dynamic equilibrium state. On the one hand, at a certain operating temperature, the sensitive material on the upper layer of the micro hot plate will adsorb or desorb gas, and the resistance value of the micro hot plate will also change with the change of external gas concentration. In view of this characteristic, it can be used to detect gas concentration. In addition, due to the change of temperature, different parts of the micro hot plate undergo different expansions, resulting in thermal stress and deformation. The Fourier law formula for heat conduction is shown in Equation (1).
Equation (1) sets the thermal conductivity of the material to
, where
is expressed in W/m·K,
represents time, and
represents heat. The higher the
value, the better the thermal conductivity. It represents the thermal conductivity area as
, expressed in square meters, where
represents temperature and
represents length. In thermal convection, the relevant formula is shown in Equation (2).
In Equation (2), it sets the convective heat transfer coefficient to
, expressed in W/(m
2 °C), and sets the temperature of the solid surface to
; around a solid, it represents its fluid temperature as
. In the design of MEMS micro hot plate, it adopts a layered structure, which includes multiple layers, including silicon substrate and SiO
2 insulation layer. The structural schematic diagram is shown in
Figure 1.
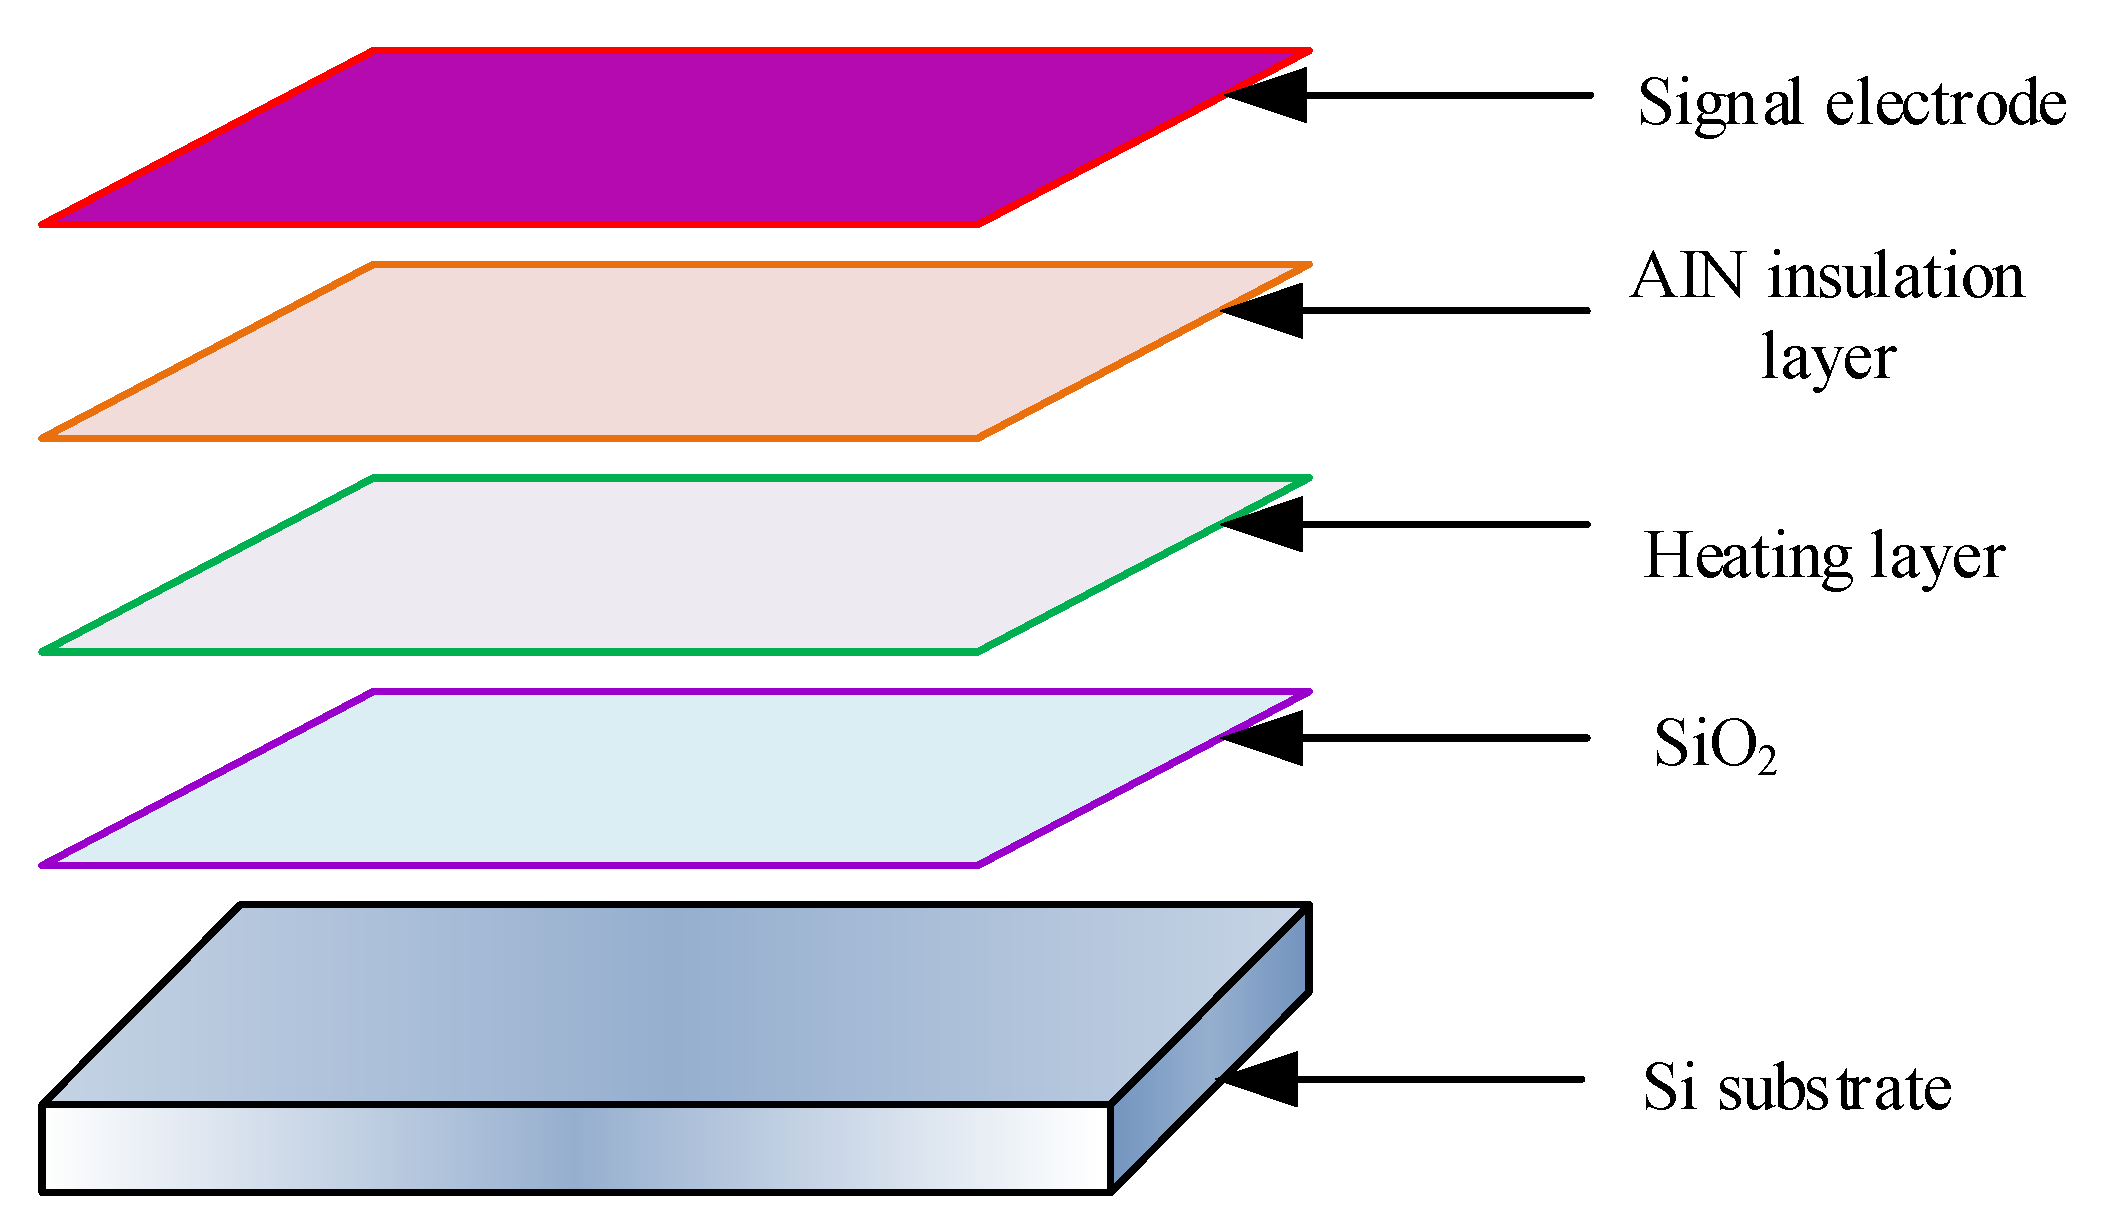
In
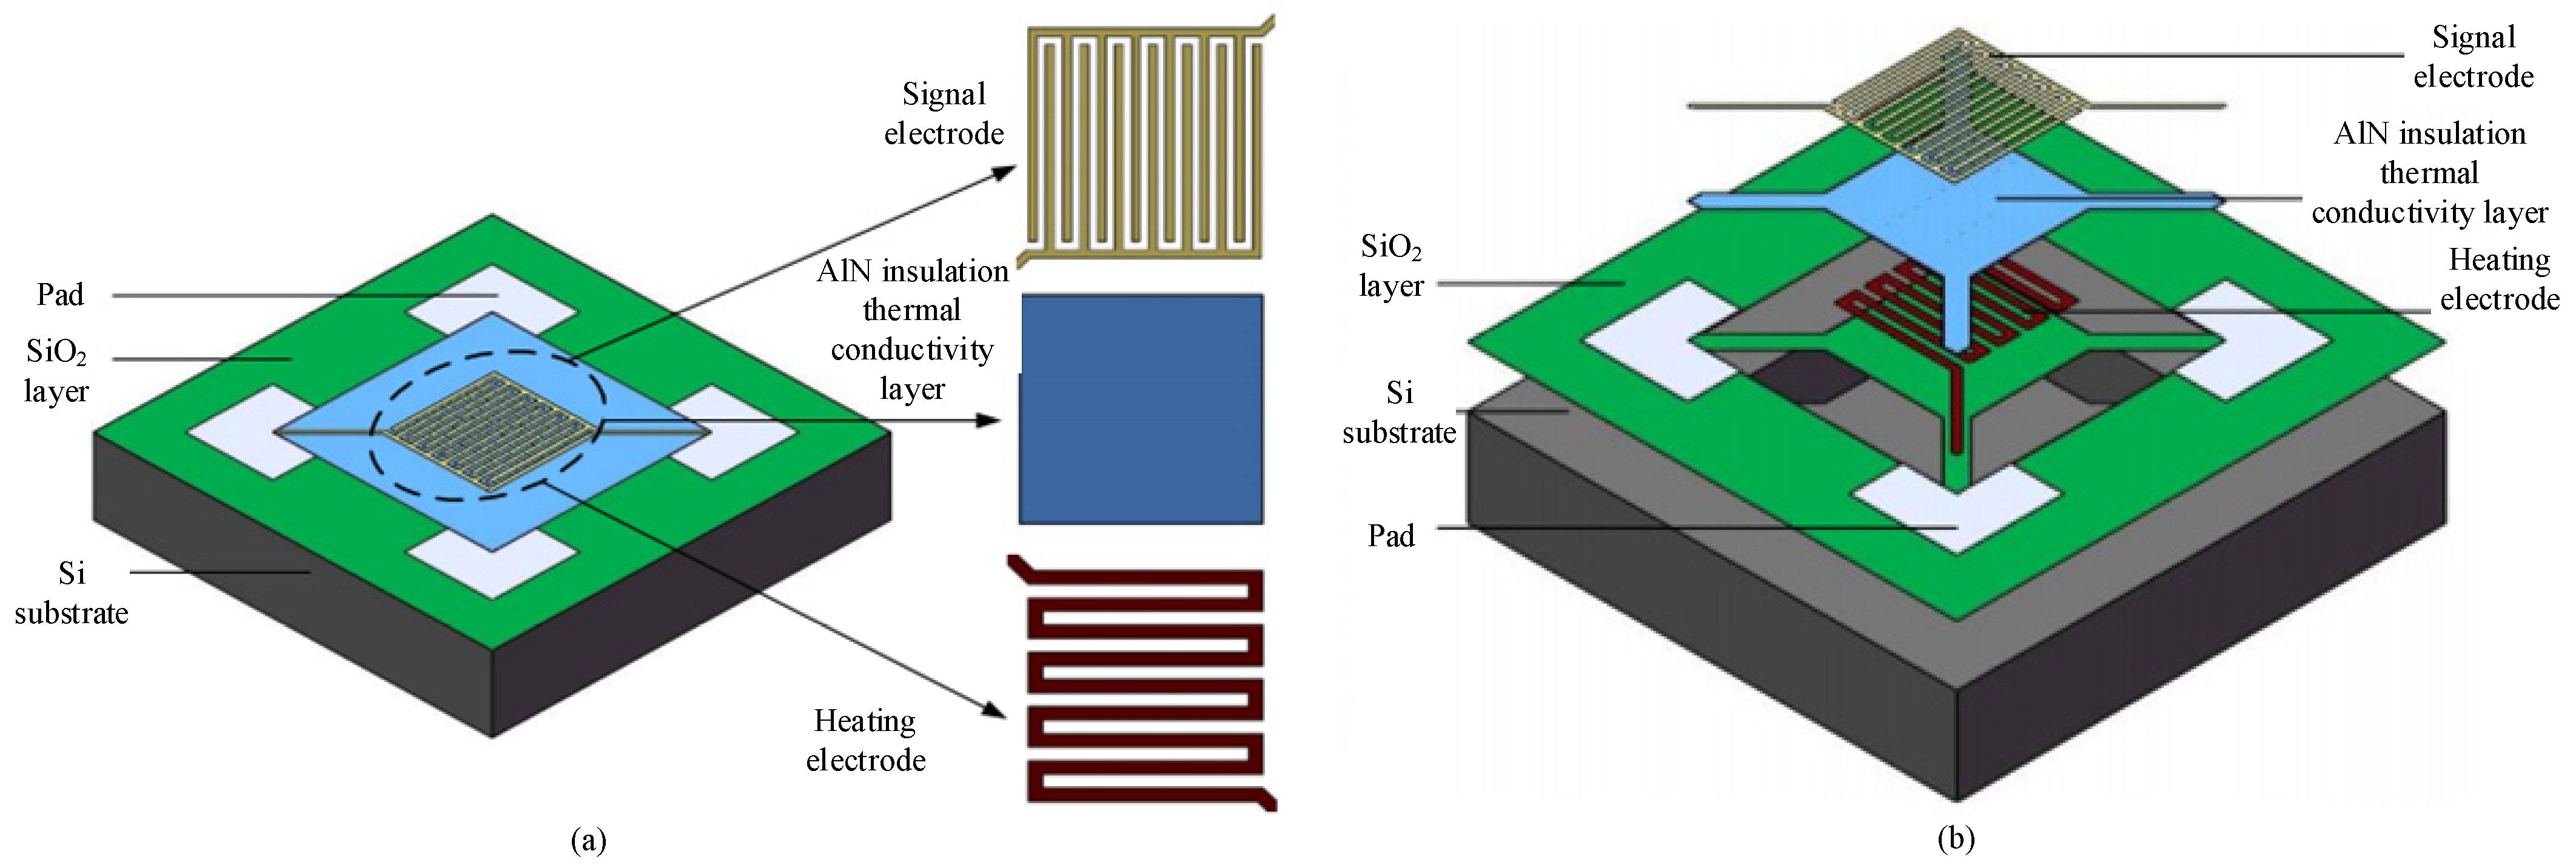
Figure 1, the framework of the MEMS micro hot plate is the substrate, which plays a supporting role in the structure. The substrate used is a monocrystalline silicon substrate. In different hierarchical structures, it designs heating electrodes and signal electrodes. By using a heating electrode, the gas sensor can obtain a suitable working temperature and check the resistance changes of sensitive materials through the signal electrode. To maintain the chemical and mechanical stability of the electrode at high temperatures, platinum is selected as the material for the heating electrode and signal electrode. The use of silica as an insulating layer has a lower thermal conductivity and can effectively reduce heat loss. The insulation thermal conductivity layer is a layer of AlN thin film, which has high thermal conductivity, good insulation, and strong adhesion. Under the action of AlN thin film, electrical insulation can be carried out, resulting in higher heat transfer efficiency between the two electrodes mentioned above. According to the actual size of 1:1, the three-dimensional geometric modeling of the micro hotplate is constructed. There are two types of structures; micro hot plate 1 is a diaphragm-type structure, and micro hot plate 2 is a suspended structure, as shown in
Figure 2.
In
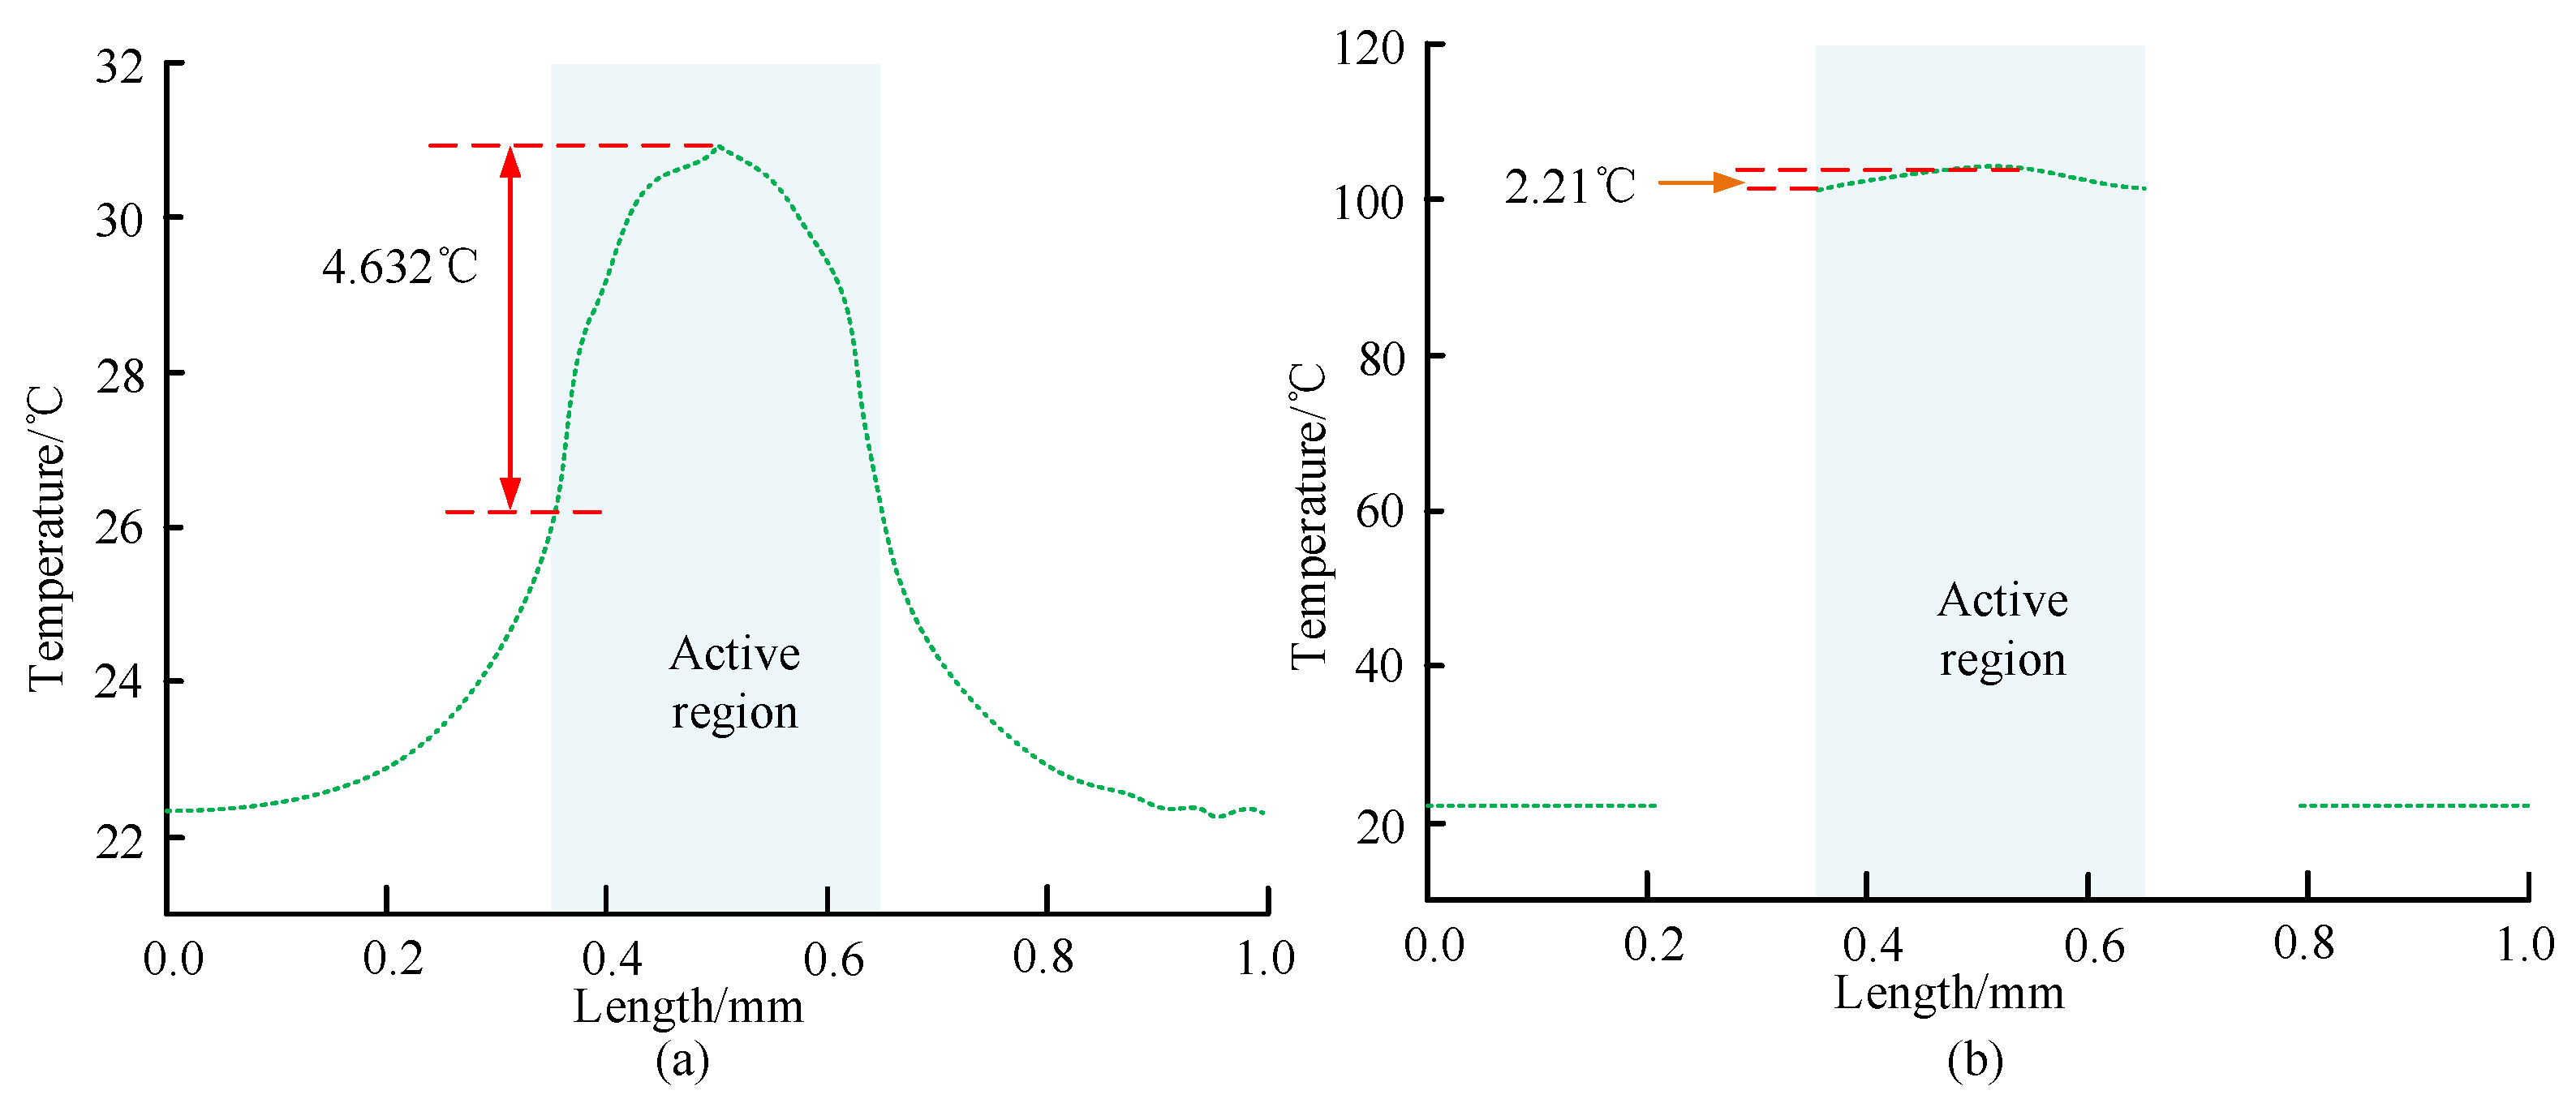
Figure 2a, within the active region, the heating electrode is connected to the signal electrode and there is contact, which makes the structure more stable. In
Figure 2b, the active area is processed by hollowing out the surrounding area, and the middle active area is supported by several cantilever beams, making the entire active area suspended; by thinning the back, the heat transfer channel is cut off to reduce heat loss. The shape and size of the electrodes in the two structures of the micro hot plate are the same, with the size of the micro hot plate being 1 mm × 1 mm × 0.3 mm, which is smaller than the volume of traditional sensors. The line width, spacing, and thickness of the signal electrode are 10 µm, 10 µm, 0.2 µm, respectively; AlN size is 300 µm × 300 µm, with a thickness of 0.2 µm. For heating electrodes, their line width, spacing, and thickness are, respectively, 15 µm, 15 µm, 0.2 µm. For the silicon dioxide, its size is 1 mm × 1 mm with a thickness of 0.5 µm. For silicon substrates, their size is 1 mm × 1 mm, with a thickness of 300 µm.
By using ANSYS10.0 finite element simulation software, it is possible to analyze the steady-state thermal and thermal stress of the micro hot plate. Using the form of grid division, the structure is processed to obtain numerical values for each small region, thus approximating the entire structure. Before conducting simulation analysis, make relevant assumptions. In the heat transfer of the micro hot plates, the influence of thermal radiation is ignored. It takes the thermal conductivity of each material in the micro hot plate as a constant. The external conditions do not affect the heating of the electrode resistance, and the heat generation rate is constant; in the micro hot plate, the materials with different structures are tightly connected without gaps. During the thermal convection process between the micro hot plate and the air, the thermal convection coefficient is 25 W/(m2 °C) and the ambient temperature is 22 °C.
During simulation, it models the micro hot plate, sets material parameters, divides the mesh, applies boundary conditions and loads, and performs relevant calculations. The relevant material parameters are shown in
Table 1.
In
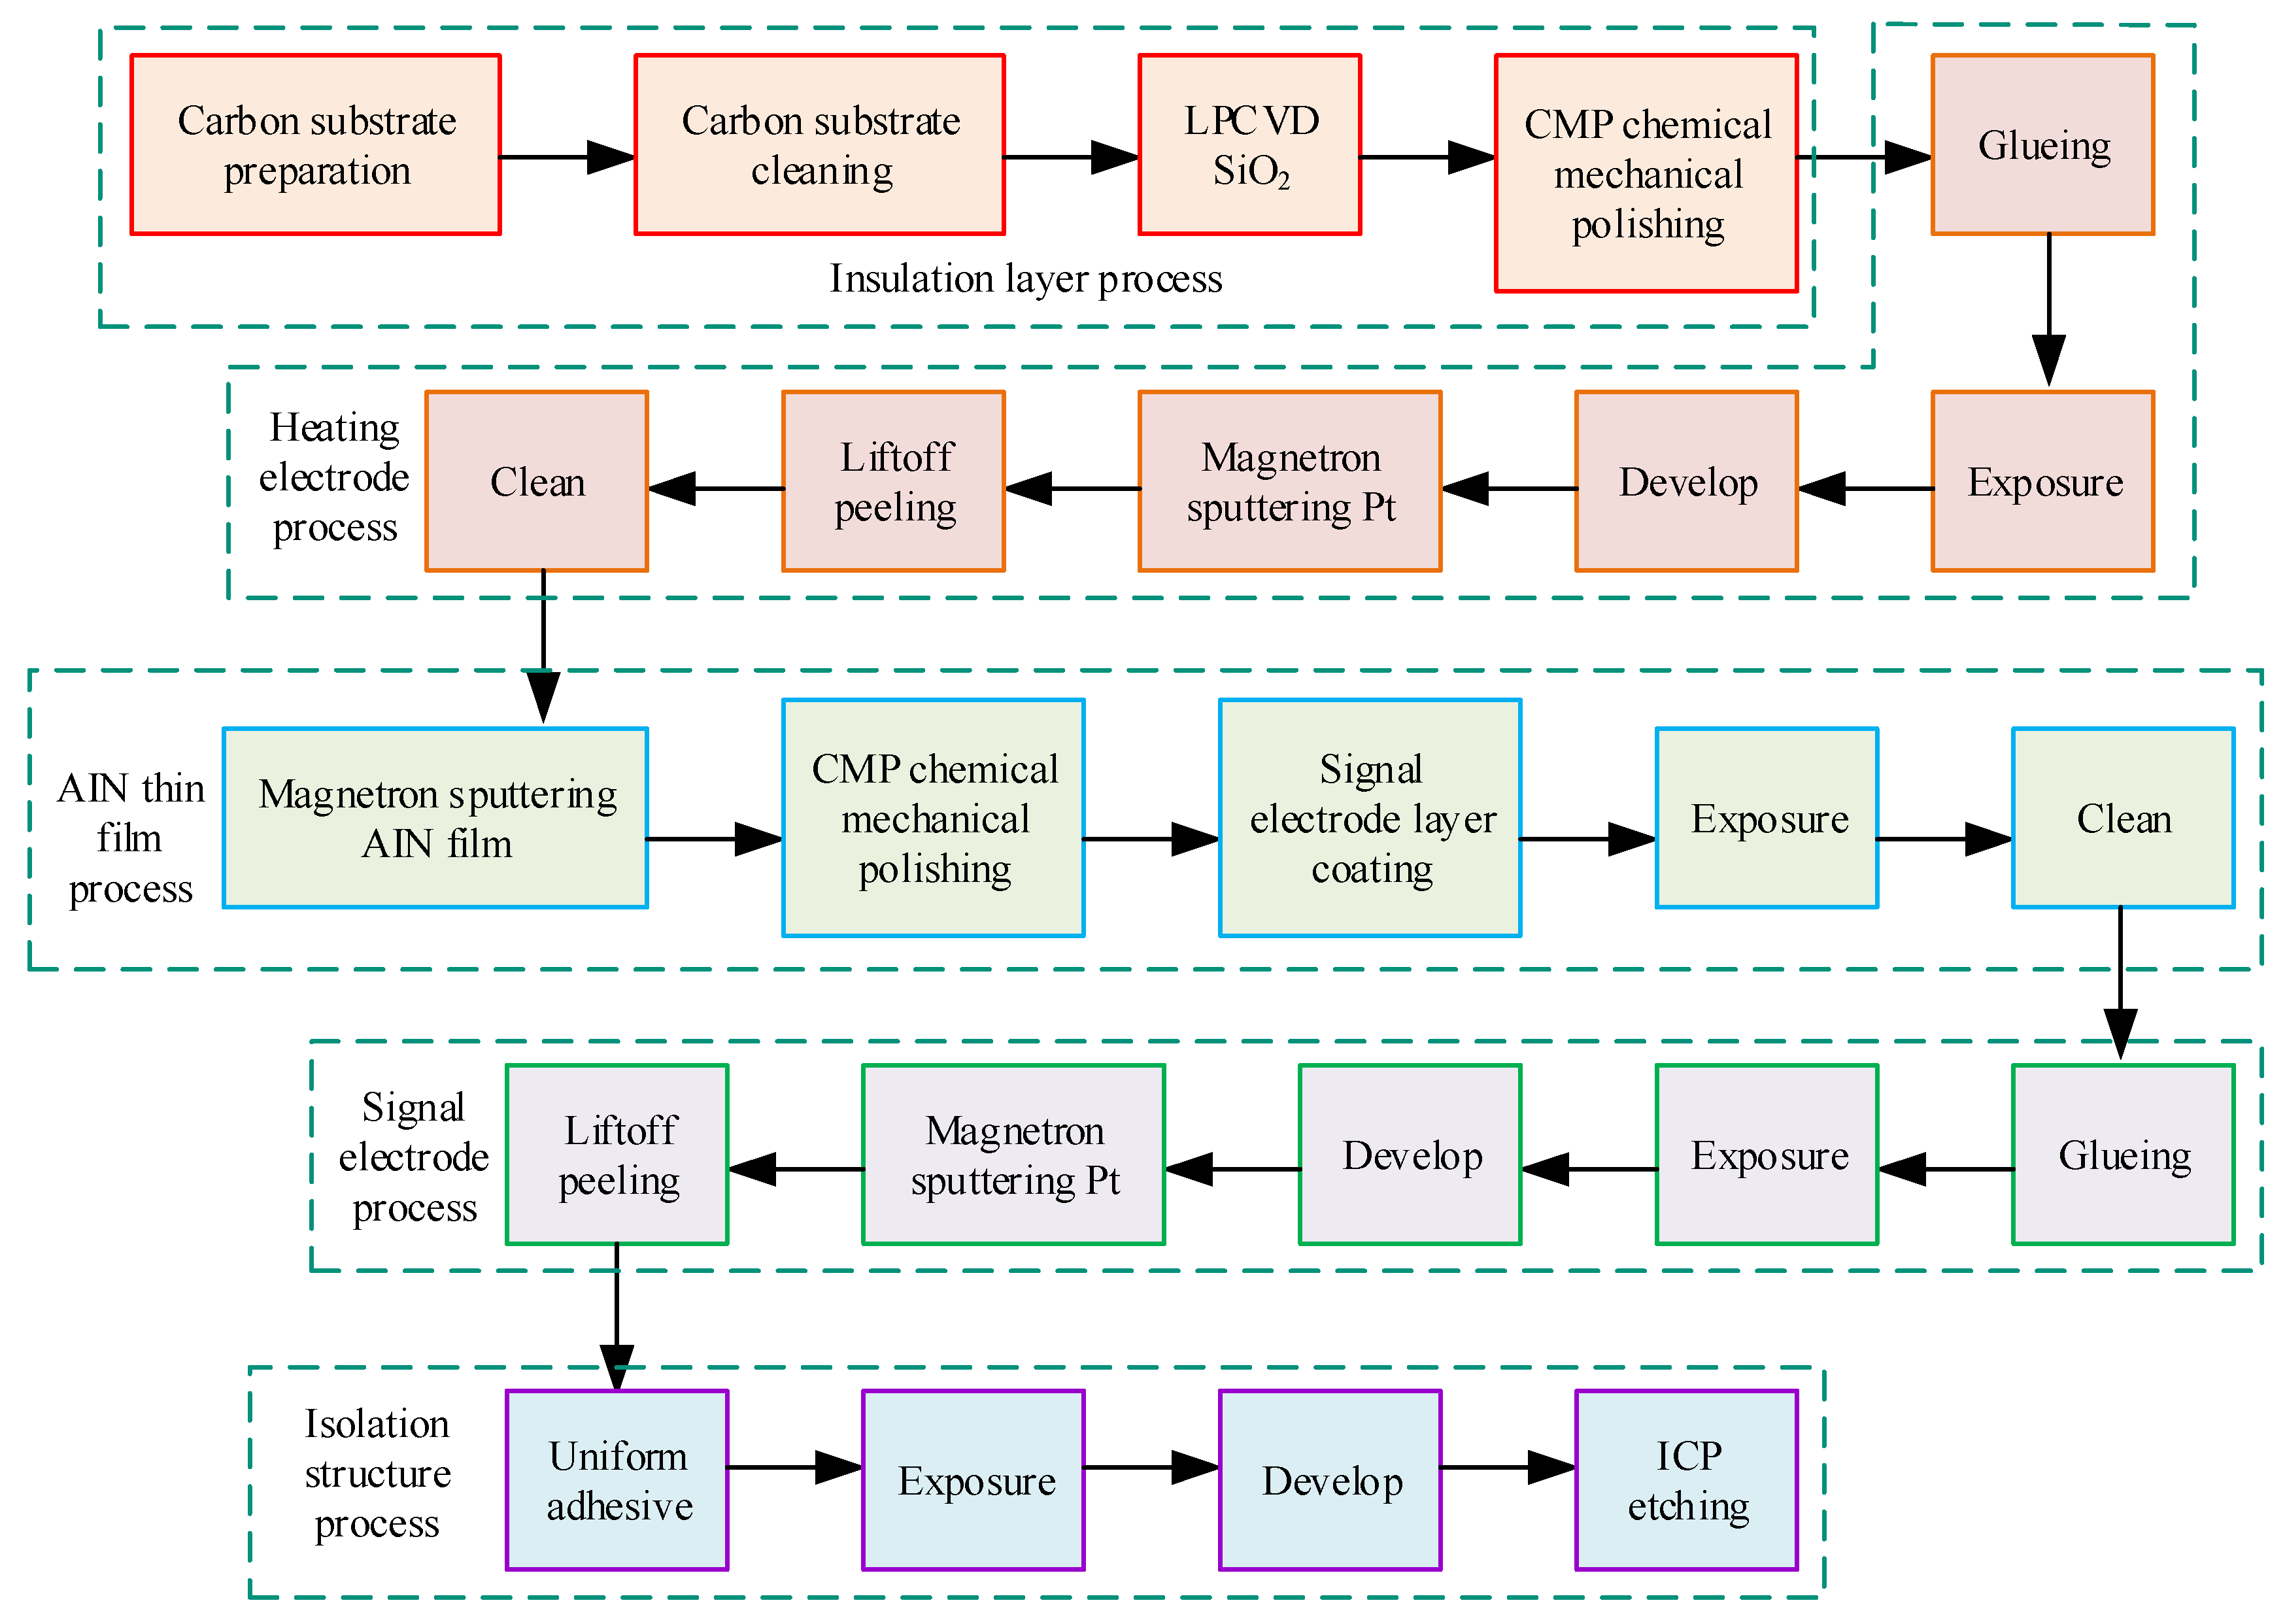
Table 1, the corresponding coefficient of thermal expansion varies with the materials of different parts. After the conducting simulation analysis, the appropriate micro hot plate is selected. On this basis, the manufacturing process of MEMS micro hot plate is studied, and the relevant process is shown in
Figure 3.
In
Figure 3, LPCVD stands for low-pressure chemical vapor deposition, CMP represents chemical mechanical polishing, and ICP represents inductively coupled plasma. In fabrication, it first chooses double-sided polished silicon wafers with a thickness of 300 µm. The crystal surface is <100>, which is cleaned sequentially with acetone, anhydrous ethanol, and deionized water in an ultrasonic cleaning machine at a frequency of 40 kHz, each time for 15 min, and then dried. It prepares an SiO
2 insulation layer, double-sided preparation of 500 nm SiO
2 through LPCVD, and CMP treatment to make the surface of the obtained SiO
2 film flat. In the production of heating electrodes, the Pt heating electrode is first produced by the lift-off stripping process. At a speed of 3000–5000 rpm, the homogenizer applies AZ5214 photoresist above the SiO
2 layer on the silicon substrate, with a thickness of about 2 µm. The silicon wafer is placed in a vacuum-drying oven and dried at 95 °C. Subsequently, customs clearance, development, sputtering of Pt film, and lift-off stripping were performed to obtain the prepared heating electrode. AlN thin films with a thickness of 500 nm were deposited on the silicon substrate by magnetron sputtering. CMP treatment, coating, exposure, development, and other steps are carried out to obtain the final AlN thin films. The signal electrode pattern is selected and a mask is fabricated. By repeating steps such as uniform glue and exposure, the Pt film is deposited on the front of the silicon wafer with a thickness of 200 nm. Under the action of lift-off stripping technology, the signal electrode pattern is obtained and subjected to wet degumming and cleaning treatment. It is used to prepare an isolation structure and thin the back of the silicon substrate. Through steps such as homogenization and ICP etching, a silicon structure with reduced back thickness is obtained. It performs etching treatment on the upper isolation structure, follows the mask pattern, and undergoes gluing, exposure, and development, in a top-down order. By using the ICP etching method, the SiO
2/Si structure on the top layer of the chip is etched, followed by wet degumming, cleaning, drying, and laser scribing to obtain an independent unit of MEMS micro hot plate with a size of 1 mm × 1 mm × 0.3 mm.
3.2. Preparation and Characterization of Porphyrin Sensitive Materials
To improve the gas-sensing characteristics of gas sensors, porphyrin-sensitive materials were prepared by doping carbon nanotube materials to improve their initial resistance values [
19,
20]. During this period, various instruments were applied, such as digital constant-temperature multihead magnetic stirrers, tabletop high-speed centrifuges, differential thermal gravimetric analyzers, etc. The reagents used are shown in
Table 2.
In
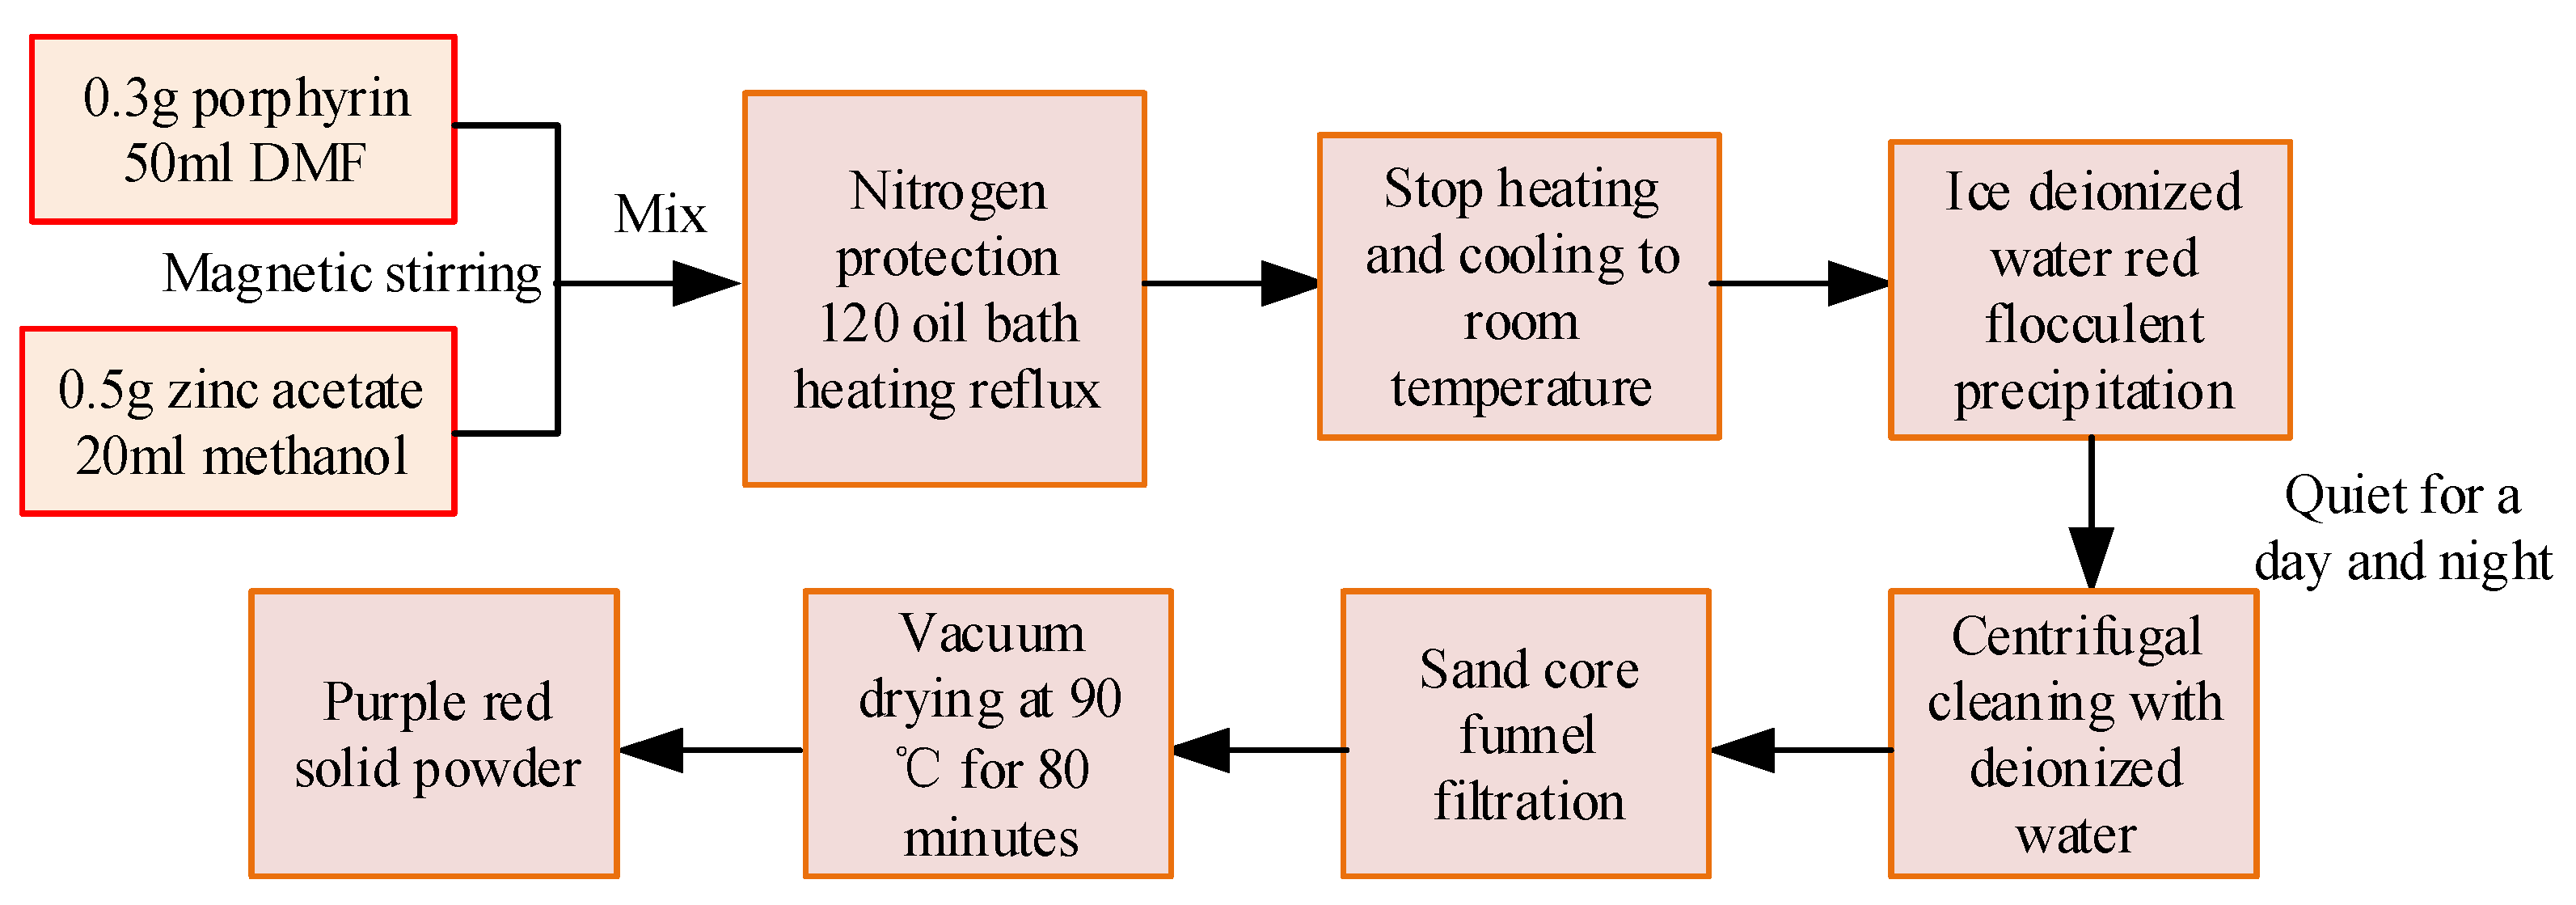
Table 2, different drugs have different specifications, and these reagents can be used to prepare porphyrin and porphyrin-zinc sensitive materials. Firstly, tetraphenylporphyrin was synthesized using the Adler method. First, a 250 mL three-necked bottle is selected and salicylic acid and benzaldehyde are added to it with a mass ratio of 1:2. Then, 150 mL of xylene is added to the bottle for dissolution and magnetic stirring. After starting the reflux reaction in the condensation tube, the mixture of pyrrole and xylene should be added dropwise within 10 min. The pale yellow solution in the bottle will turn purple-black. After the reflux time of 180 min, the solution is no longer heated and is allowed to cool. When the temperature of the solution is about 25 °C, add 20 mL of anhydrous ethanol and allow to stand for 24 h. It is cleaned with anhydrous ethanol and filtered with a sand-core funnel. After filtration, it is dried for 6 h in a vacuum drying oven at a temperature of 90 °C to obtain a deep purple powder. The process used for the synthesis of tetraphenylporphyrin zinc is shown in
Figure 4.
In
Figure 4, the tetraphenylporphyrin powder was weighed using an electronic balance at a dose of 0.3 g. It is then poured into 50 mL of DMF for dissolution, and magnetic stirring is performed with a magnetic stirrer for 30 min to promote complete dissolution. Zinc acetate is weighed at 0.5 g and dissolved in 20 mL of methanol solution. It is thoroughly stirred under the action of a magnetic stirrer for 30 min. Tetraphenylporphyrin solution and zinc acetate solution are poured into a 250 mL three-necked bottle, the reflux condenser tube is connected, and N
2 is introduced to provide protection. Subsequently, it is heated using an oil bath heating method at 120 °C. Under the action of a magnetic stirrer, it is stirred thoroughly for 90 min and heating is stopped, resulting in a purple-red product. It is then cooled to about 25 °C. By adding 150 mL of deionized ice water, the solution precipitates red flocculent precipitates. After standing for a day and night, the precipitates separate from the upper liquid and the upper liquid is removed; under the action of deionized water and ethanol, centrifugal cleaning and precipitation were carried out at a speed of 4000 r/min for 10 min, repeated three times, to remove the residue of DMF and zinc acetate. It is subjected to suction filtration using a sand core funnel to obtain tetraphenylporphyrin zinc solid powder, which is then subjected to vacuum drying treatment for 80 min.
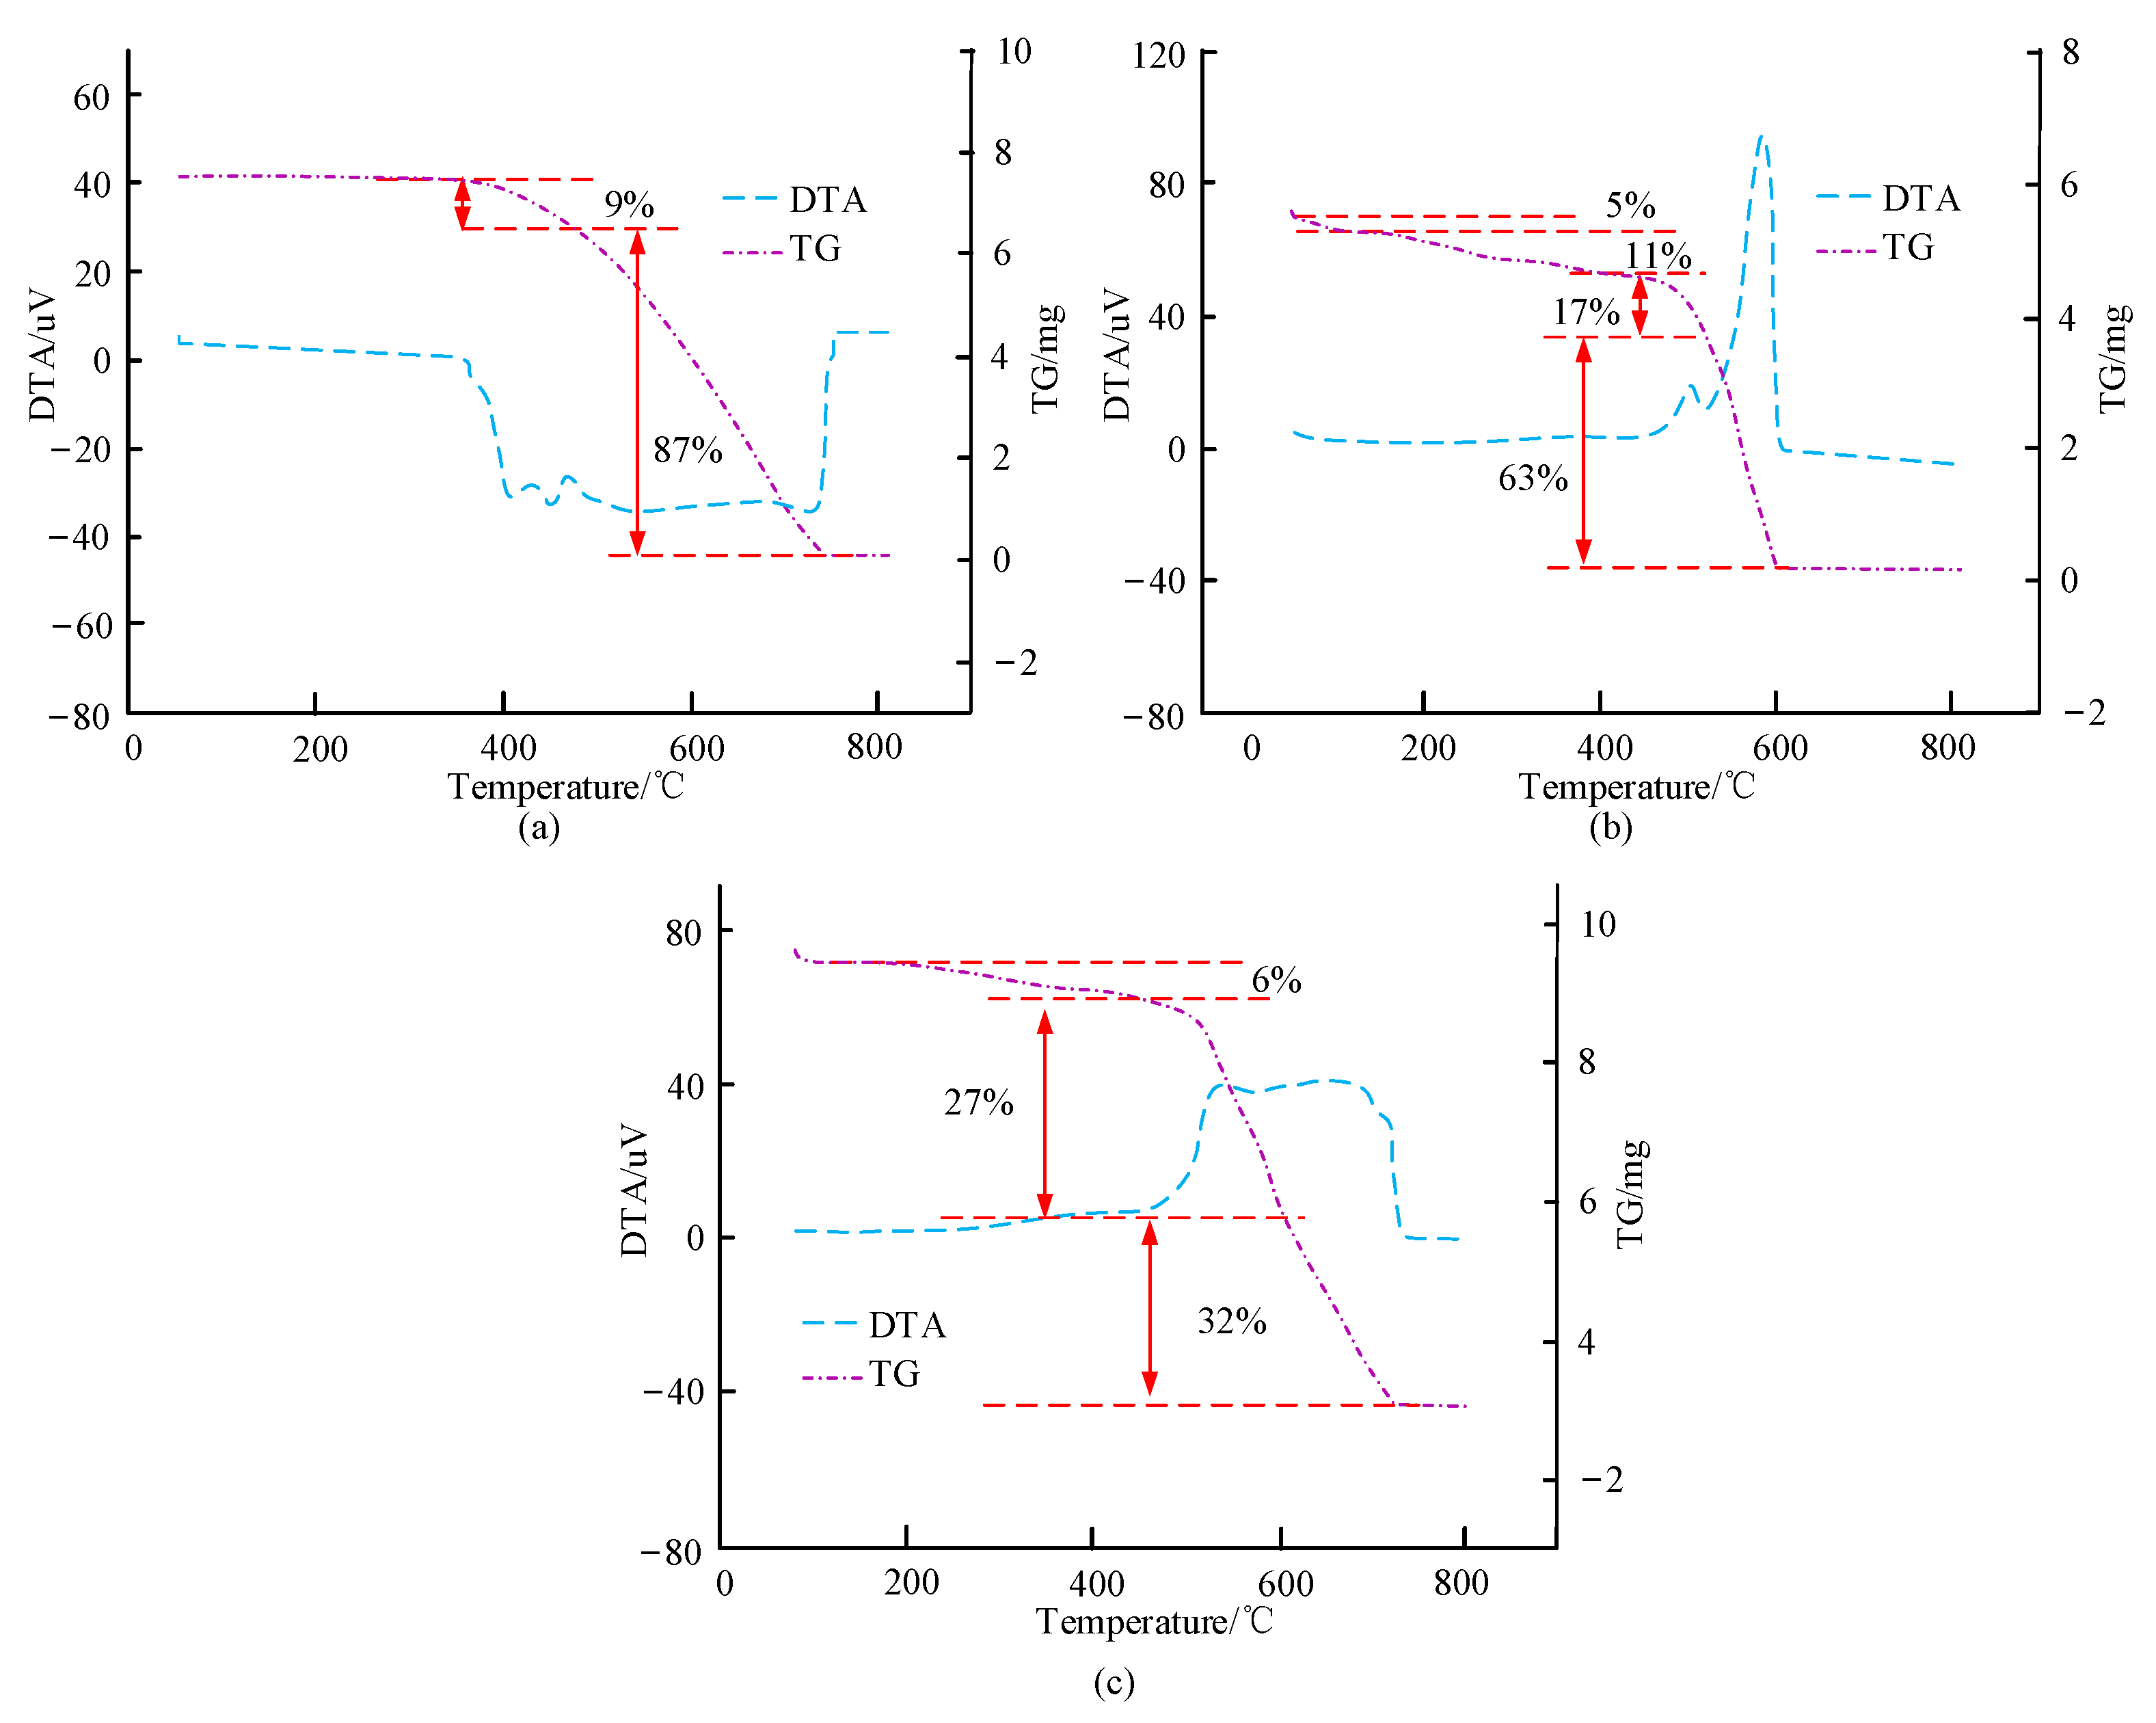
Due to the high resistance and poor conductivity of the obtained porphyrin zinc material, its application in electrical sensors will be affected. In addition, carbon nanotubes have good conductivity and optical properties and good stability, and can improve the performance of the material. Therefore, it is applied to the porphyrin zinc sensitive material to obtain a porphyrin zinc/carbon nanotube composite material, to reduce the initial resistance value of the porphyrin zinc sensitive material. During the doping process, the powder of carbon nanotubes and porphyrin zinc was selected by different mass ratios, and put into an agate mortar for mixing. Terpineol was added to bond the mixed powder, and it was thoroughly ground for 3 h. Then, it is coated on the interdigital electrode and subjected to vacuum drying at a temperature of 120 °C for 2 h to obtain the relevant gas sensor. The resistance values of these sensors are measured to obtain their initial resistance values in clean air. On this basis, combined with the gas-sensitivity testing of relevant sensors, the sensitivity of carbon nanotubes doped with different ratios to 50 ppm aniline was analyzed, and the optimal doping ratio of 7% was obtained from the obtained results. Carbon nanotubes were used as dopants and doped in porphyrin zinc materials. The thermal stability of porphyrin materials is analyzed and differential thermal gravimetric tests are performed using a ZCT-B differential thermal gravimetric analyzer [
21].
3.3. Sensor Gas-Sensing Testing Platform Based on Electrical Gas-Sensing Performance and Image Gas-Sensing Performance
The MEMS sensor chip and porphyrin-sensitive materials obtained from the above preparation are used to fabricate MEMS gas sensor units. The gas-sensing performance of MEMS gas sensors is tested from two aspects: electrical gas-sensing performance and image gas-sensing performance. First, a sensing platform is constructed and a sensor unit is fabricated. Then, carbon nanotubes are doped with porphyrin zinc. The optimal doping ratio is selected to be 7%; they are mixed in an agate mortar, 1% trace H
2PtCl
6 and terpineol are added, they are mechanically ground for 3 h, the ground materials are coated on the signal electrode of the MEMS micro hotplate under an electron microscope, they are dried in a dark place for 24 h, and they are dried in a vacuum drying oven at 120 °C for 2 h to prepare MEMS gas sensors. By utilizing the catalytic effect of H
2PtCl
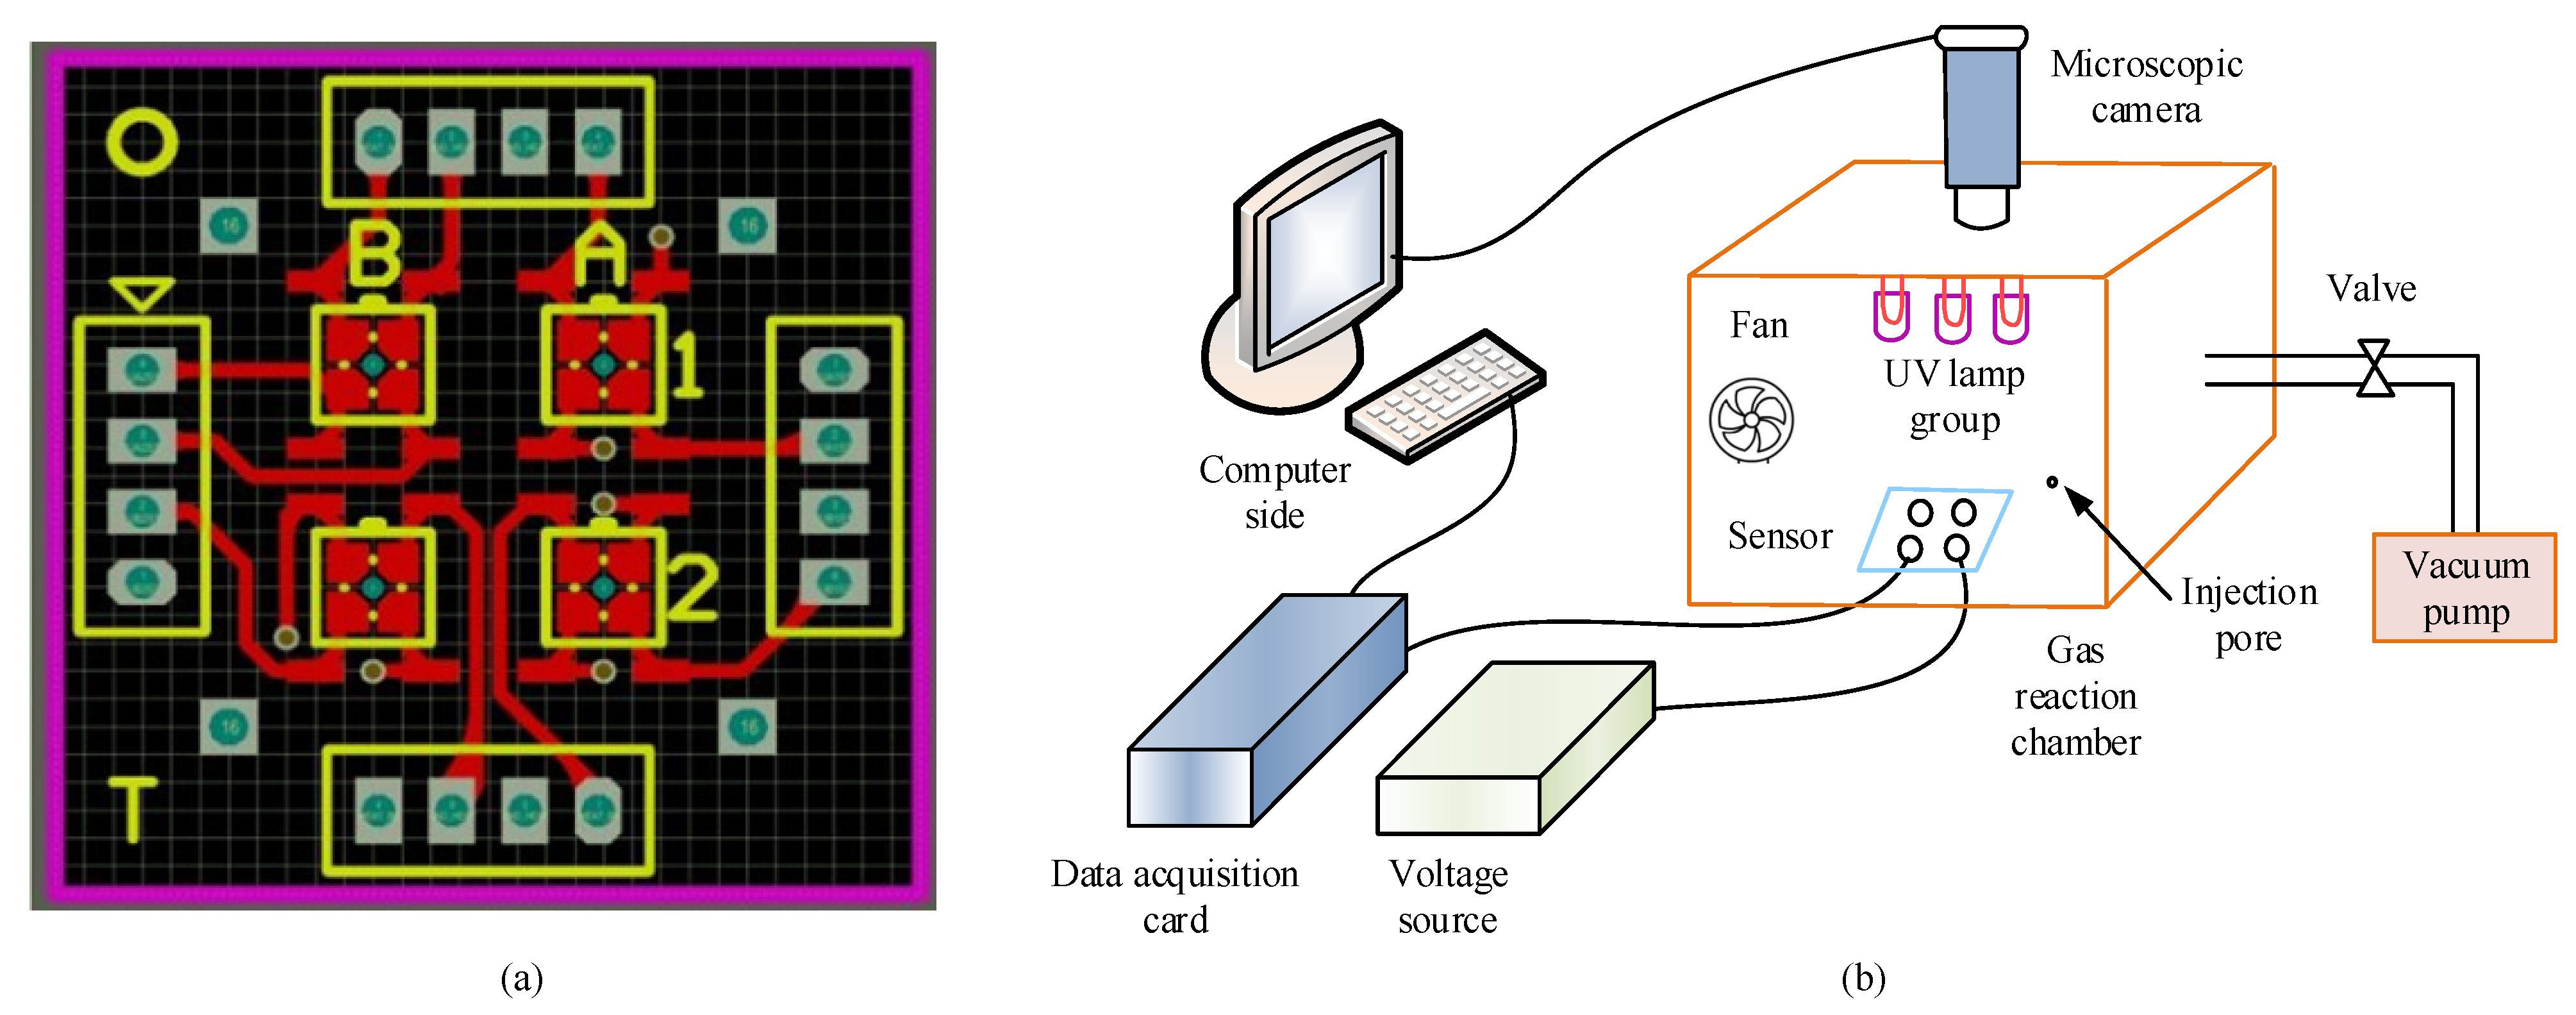
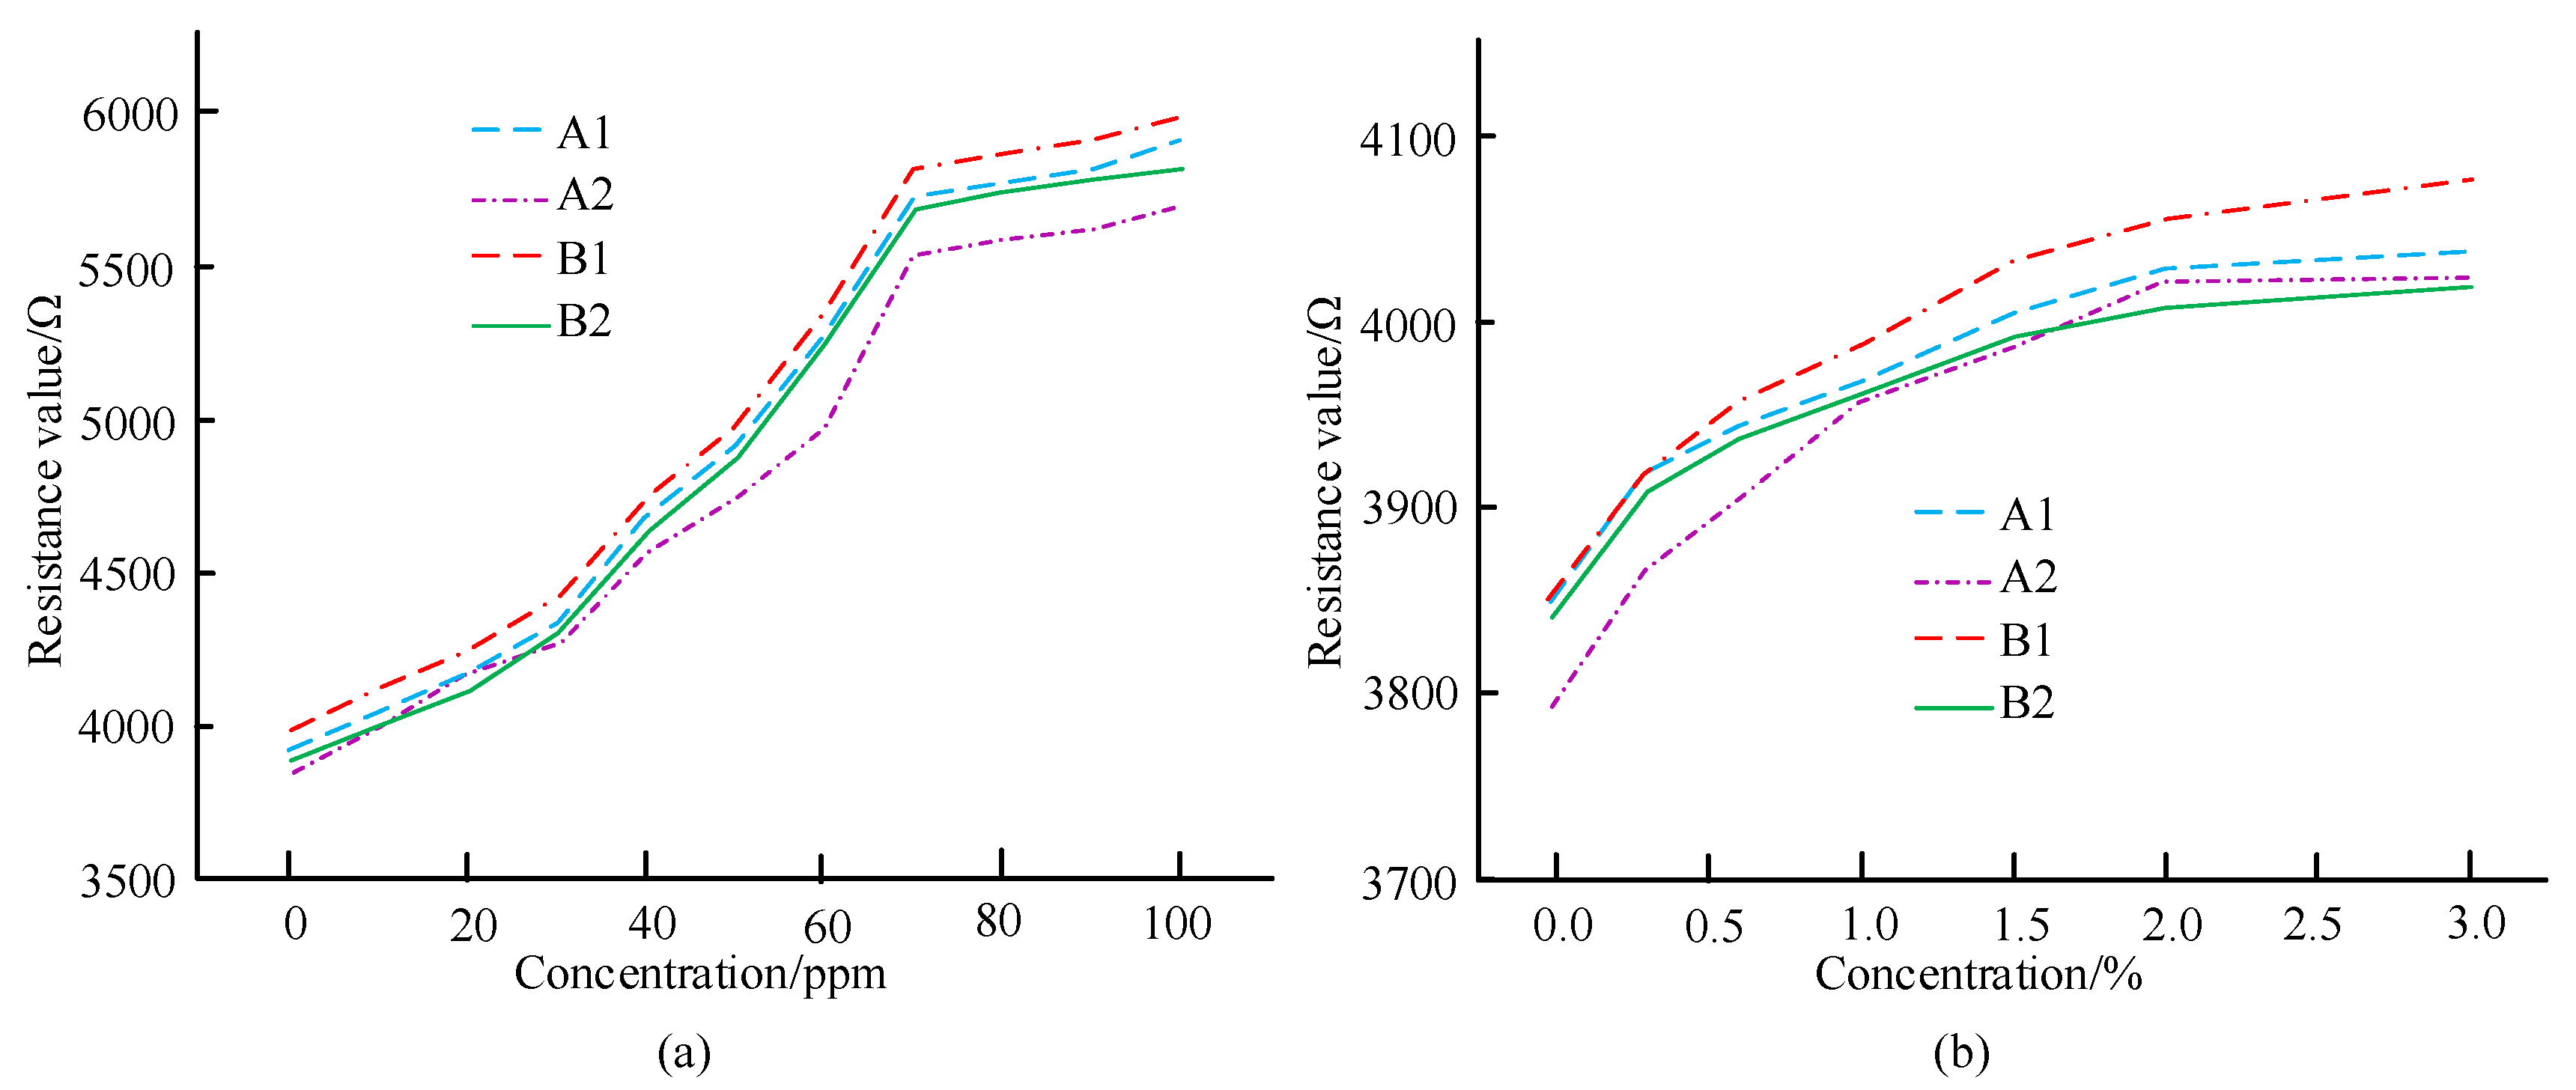
6, the adsorption and desorption processes of gas and composite gas-sensing materials are accelerated, resulting in higher gas-sensing performance of the materials. Among them, the sensitive materials used in the research institute have good conductivity, high thermal stability, and good uniformity. Through Altium Designer 17.1 software, the four array PCB sensor adapter board is drawn, and MEMS sensor chips are integrated on it. The chips coated with sensitive materials are fixed at four positions on the circuit adapter board, namely, A1, A2, B1, and B2, to obtain the corresponding four-array gas sensors. These sensors can simultaneously collect data, resulting in higher integration of gas sensors. In the construction of the detection platform, a gas reaction box is selected, which mainly consists of three parts: a base, a movable body, and a top cover. There is a circular hole in the middle of the top cover, where a microscope lens is placed to collect image signals. It utilizes the grooves on the four walls of the base to place the moving body, and by adjusting the moving body, the height of the detection device is changed. The four-array PCB sensor adapter board and the entire testing platform are shown in
Figure 5.
In
Figure 5a, based on the letters and numbers marked, it can be seen that A1, A2, B1, and B2 are located. In
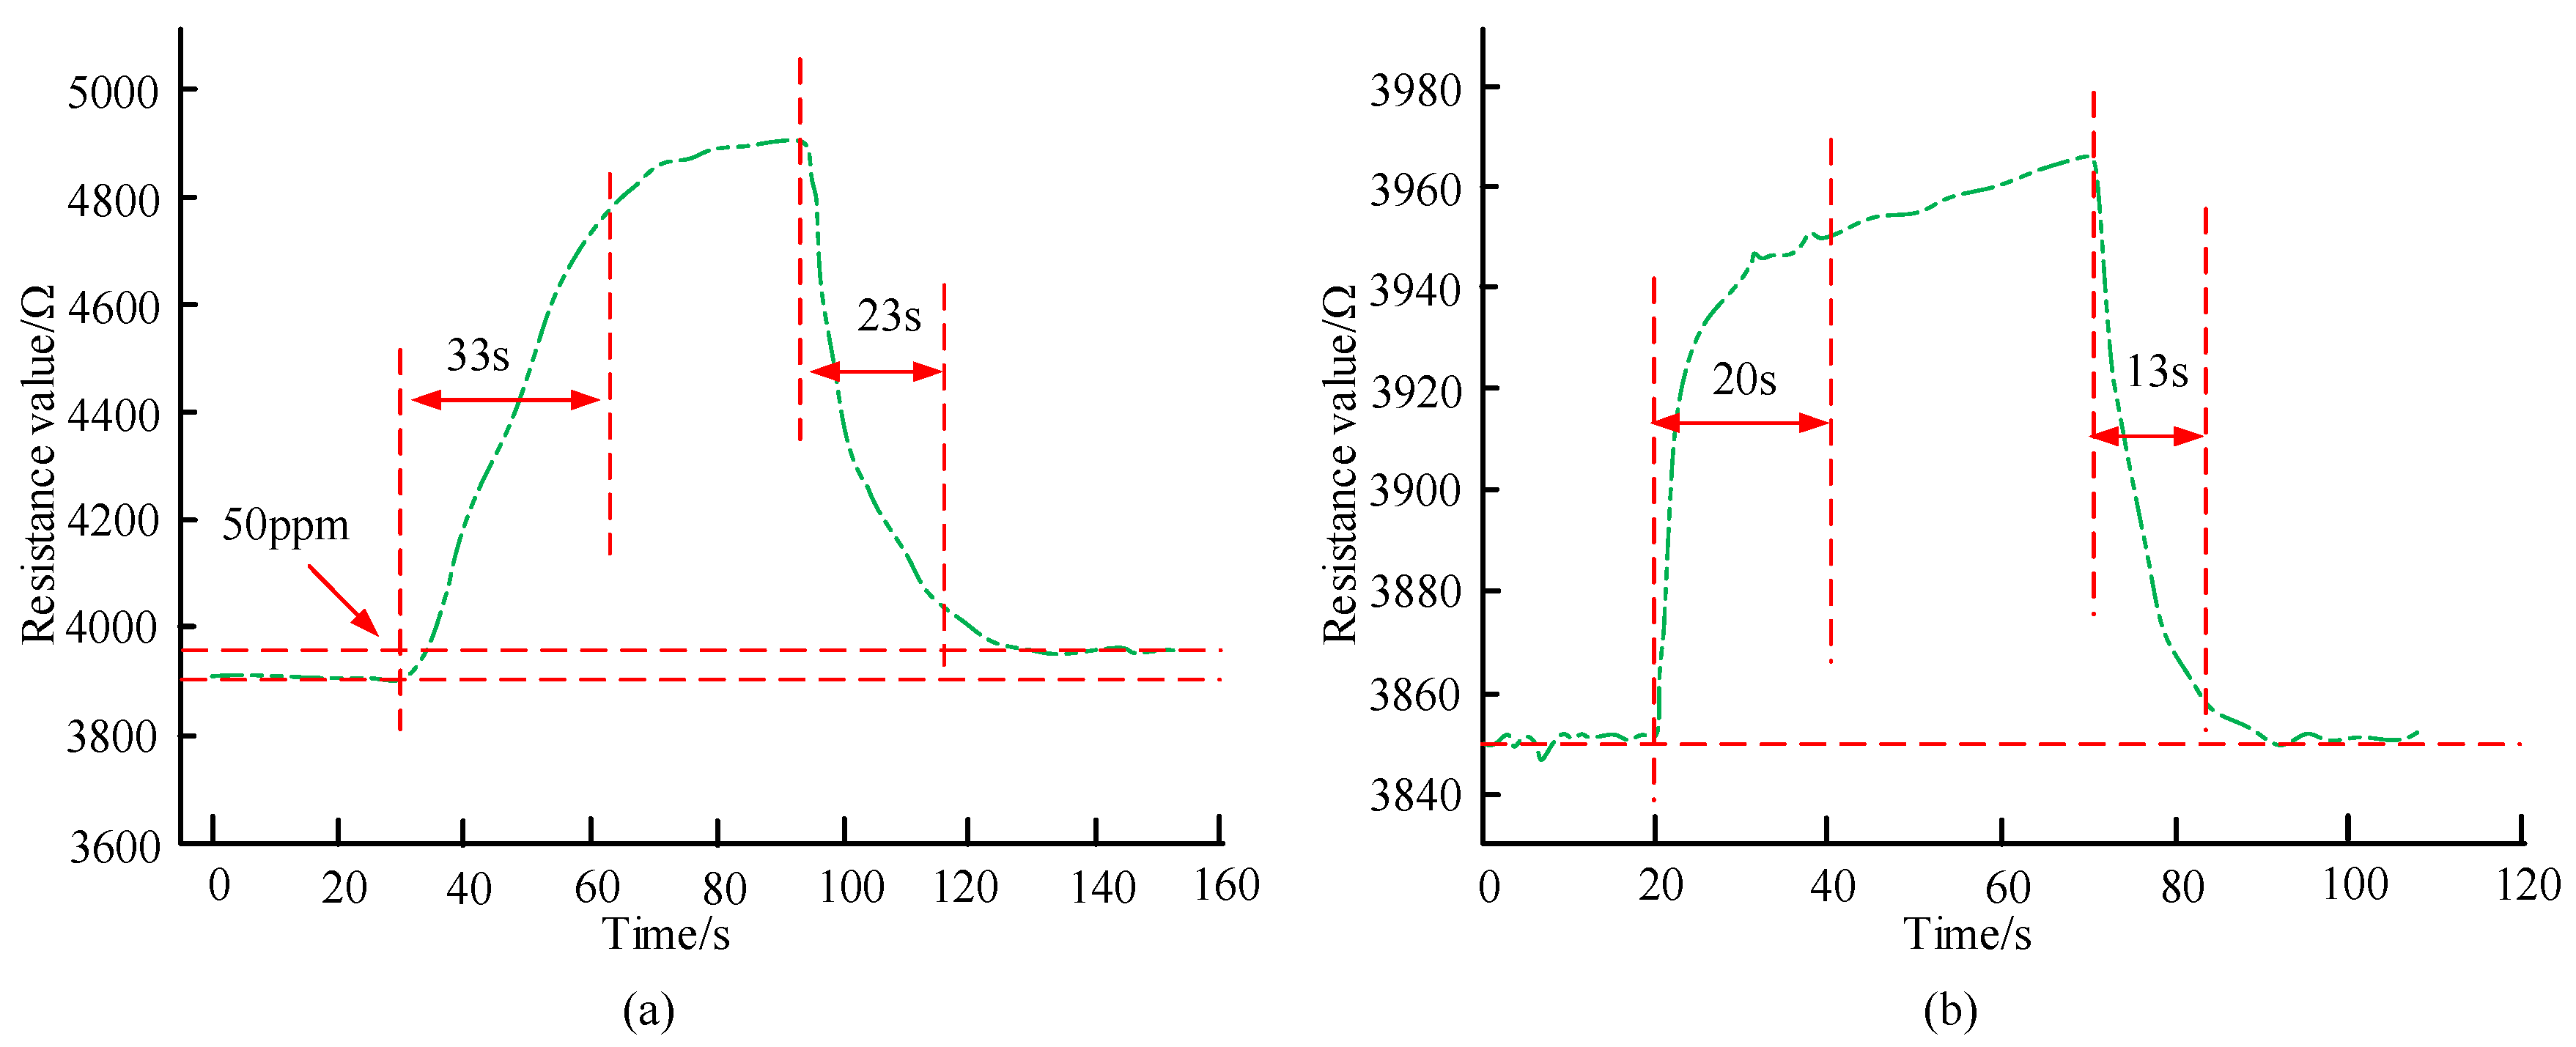
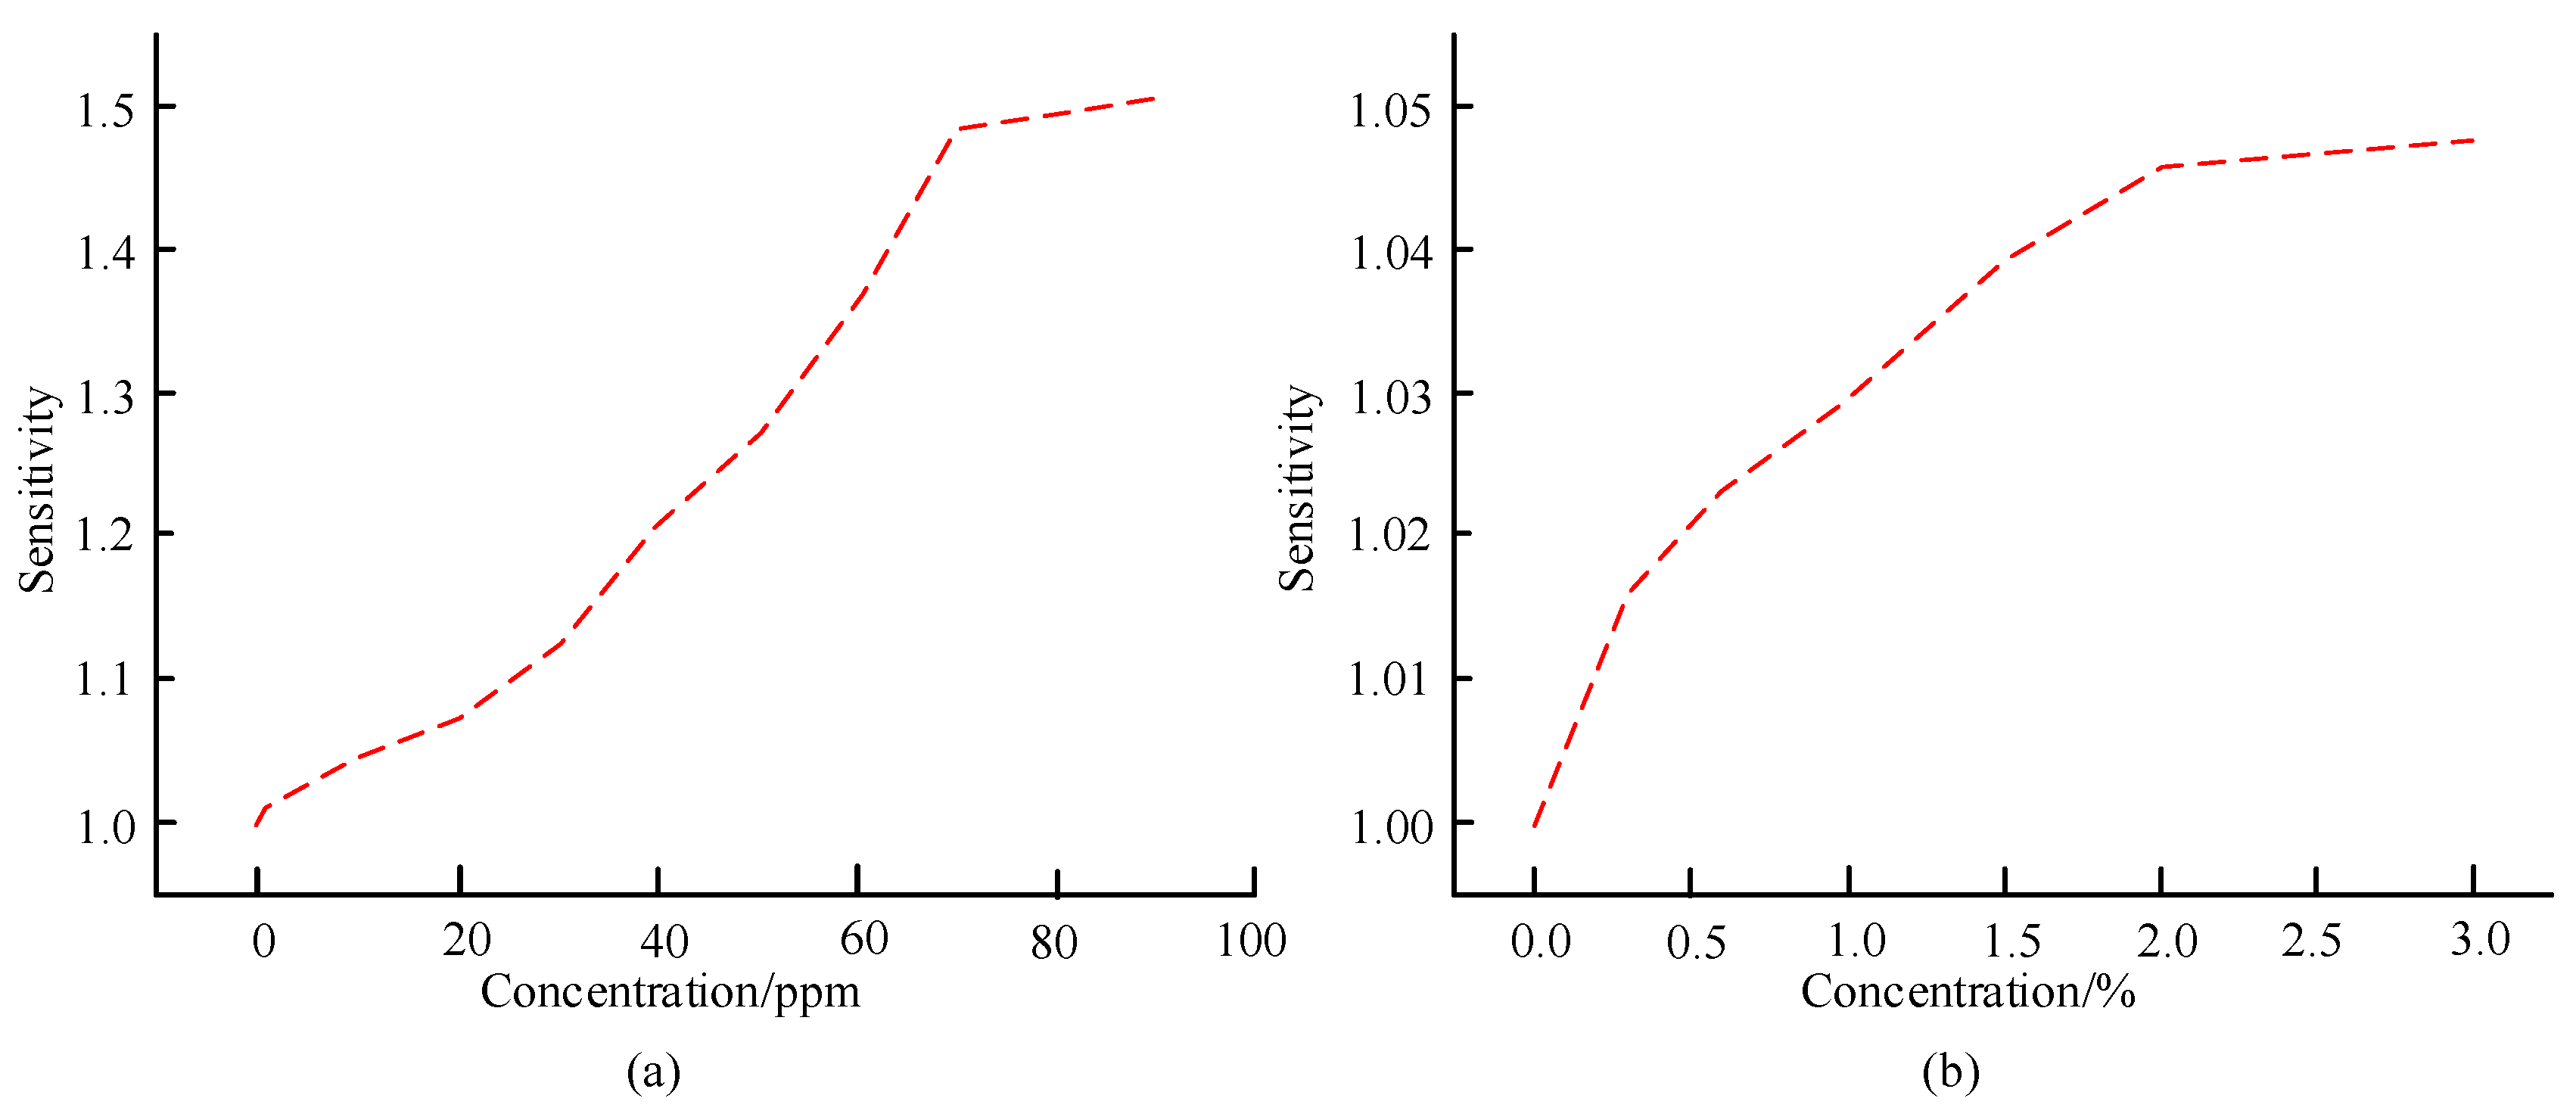
Figure 5b, electrical and image signals can be collected through this test platform. The electrical signal acquisition section includes multiple parts, such as sensor arrays, voltage sources, etc. Through a data acquisition card, the resistance value of the sensor unit can be collected in real time. The image signal acquisition section includes sensor arrays, micro cameras, and other parts. The excitation light source required by the sensor comes from the ultraviolet excitation lamp. After the testing platform is connected, the gas reaction chamber is sealed and processed. The vacuum pump in the ventilation system is used to timely remove the tested gas and prevent the accumulation of toxic gases. The testing conditions are the same, and the prepared MEMS gas sensor is tested. First, its electrical gas sensitivity performance is tested, including response recovery characteristics, gas sensitivity, repeatability, etc. The gas sensitivity calculation formula is shown in Equation (3).
In Equation (3), for the gas sensor, set its resistance value in the measured VOC gas to
, and represent its resistance value in air as
. For porphyrin-based sensors, porphyrins have a π electron system. When porphyrin materials come into contact with VOCs gas, there will be a significant interaction force between the molecules corresponding to the two substances, leading to physical adsorption, which can be realized in the form of Equation (4).
In Equation (4),
represents oxygen molecules in the air, and
represents oxygen molecules adsorbed on the surface of porphyrin-like materials.
will combine with the surface electron
of the porphyrin to obtain
as shown in Equation (5).
In Equation (5),
represents the adsorbed oxygen molecules after obtaining
. On this basis, combine
again to obtain the relevant expression as shown in Equation (6).
In Equation (6),
represents the adsorbed
after obtaining
. It is combined with
again to obtain the relevant expression as shown in Equation (7).
In Equation (7),
represents the adsorbed
after obtaining
. When in contact with gases such as ethanol, ethanol will react with the adsorbed oxygen on the surface of porphyrin materials. The former will be adsorbed and oxidized, causing oxygen atoms to release electrons, which will appear in the conduction band on the surface of semiconductor porphyrin materials. The relevant expressions are shown in Equations (8) and (9).
In metalloporphyrins, both the central metal and π electron system can affect their gas-sensing performance; The higher the number of central metal electrons is, the higher the corresponding electron donating capacity is. The change of electron cloud density will lead to the change of porphyrin adsorption. Analyzing the sensor performance from the perspective of image gas-sensing performance, VOC gases include toluene, formaldehyde, ethanol, and aniline. After the porphyrin material comes into contact with VOC gas, its color will change. In view of this characteristic, the sensor gas sensitivity test is performed. Before testing, it turns on the ultraviolet lamp set with a wavelength of 365 nm, which emits fluorescence from the gas sensing array for a duration of 5 min; When the sensor is in a stable state, the pre reaction image of the porphyrin sensor can be obtained by taking photos with a micro camera. After the fan is turned on, it injects a certain concentration of the gas to be measured into the reaction chamber, contacts the sensor array, and fully reacts. After lasting for 10 min, it takes photos to obtain the image of the sensor’s response. It opens the vacuum pump valve to exhaust the gas inside the box, and the gas test is completed. If another experiment is to be conducted, these steps can be repeated. In units A1, A2, B1, and B2, relevant sensitive materials are coated, respectively. The materials of the first two units are porphyrin and porphyrin-zinc, while the materials of the last two units are porphyrin zinc/carbon nanotube composites and porphyrin-zinc/carbon nanotube composites with chloroplatinic acid added. It detects toluene, formaldehyde, aniline, and ethanol separately through these units.
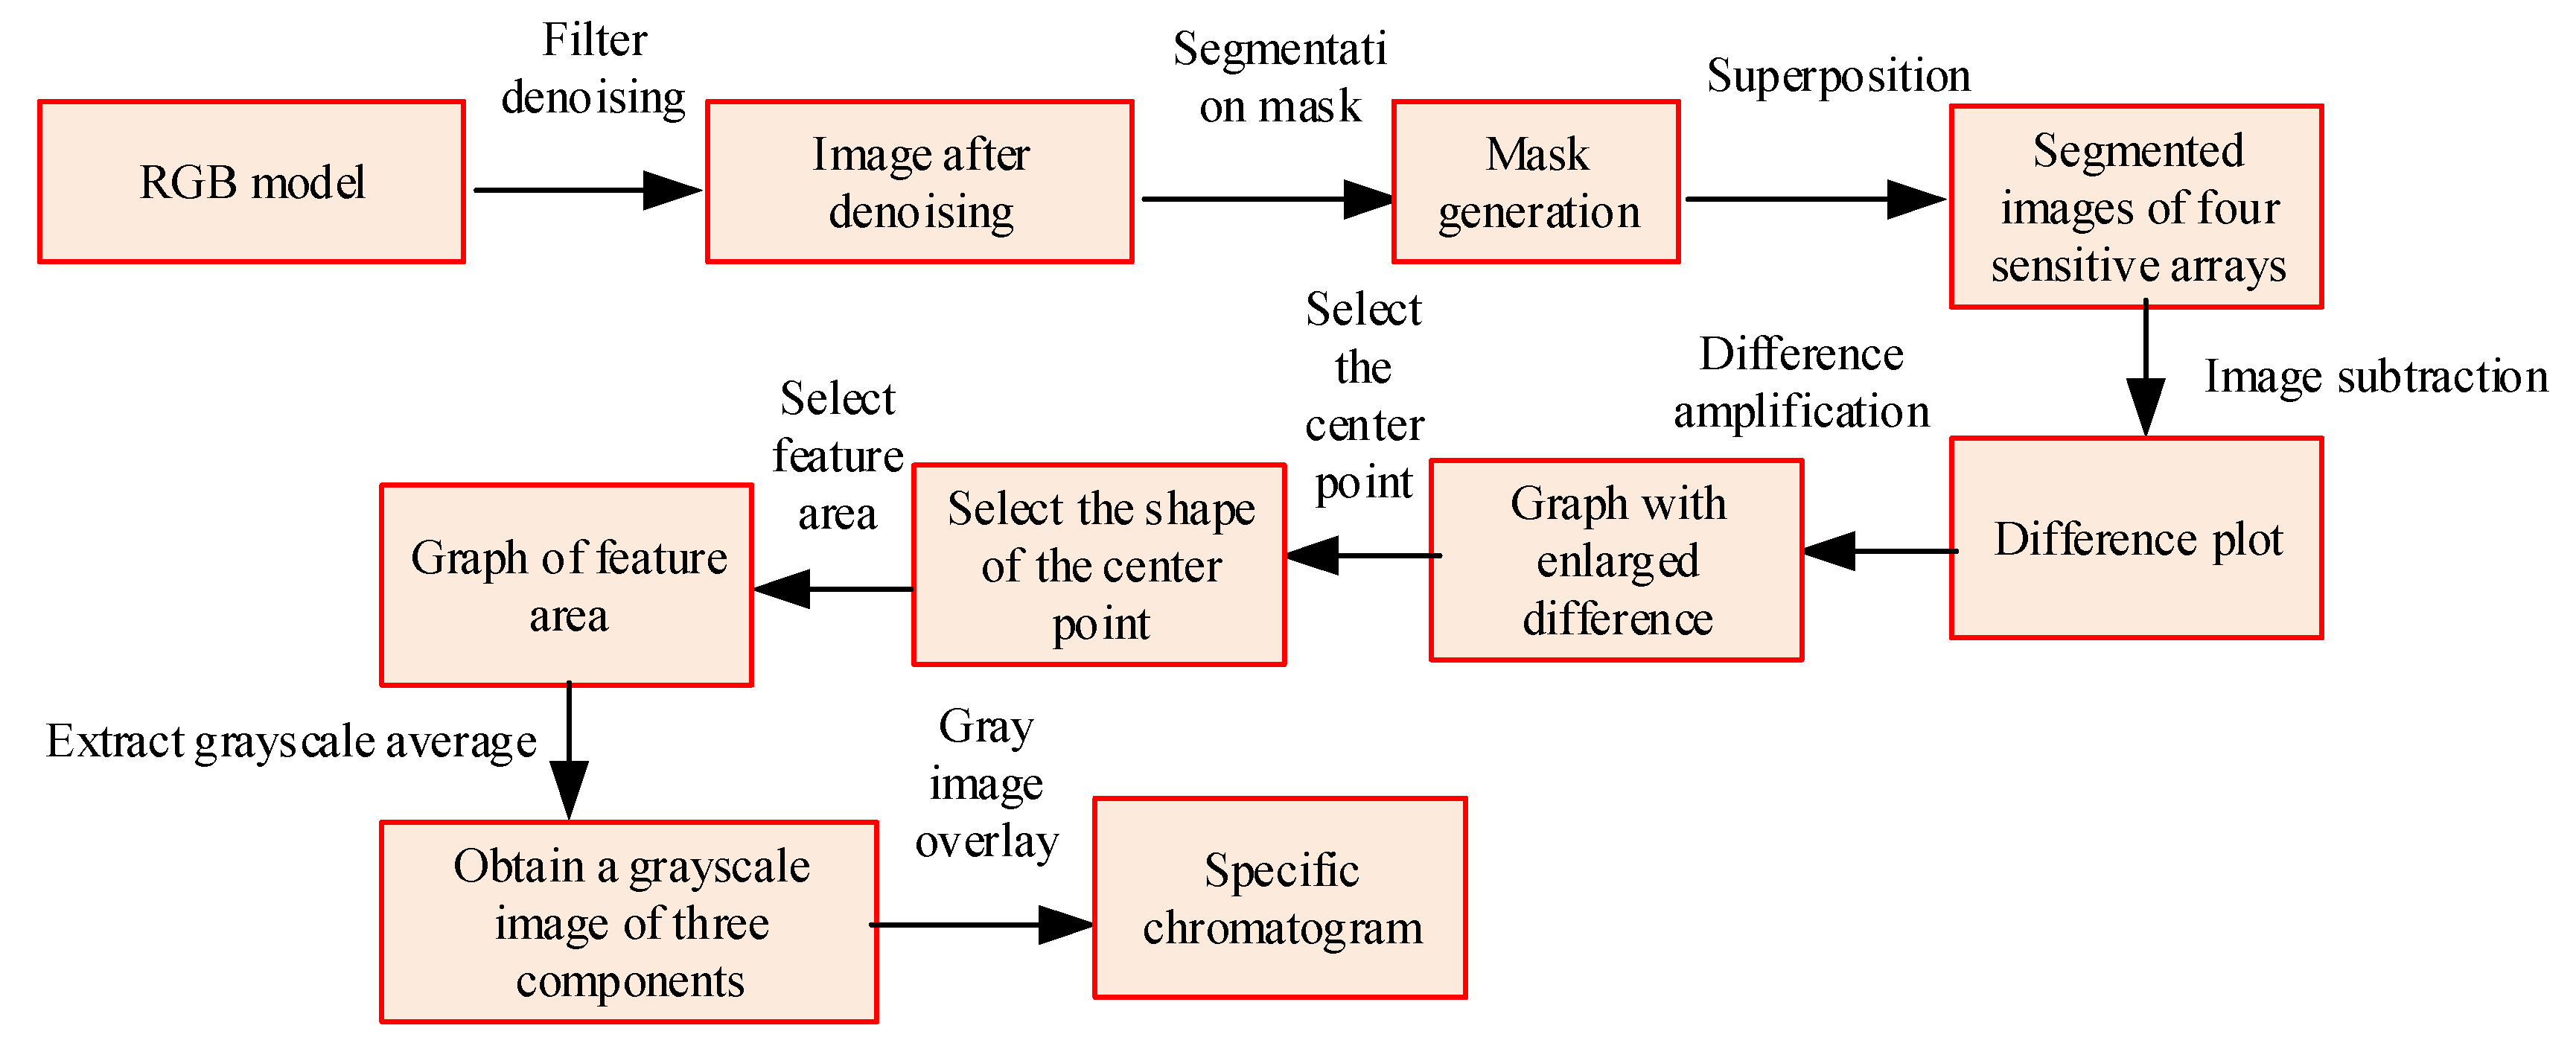
Before and after ventilation, the color of the sensitive materials of the relevant sensors will change. Image processing technology is used for relevant processing analysis, and the relevant process is shown in
Figure 6.
In
Figure 6, due to the large amount of information present in each image, only key information is extracted. The pixel values of sensitive materials in the red green blue (RGB) channel and the coordinates of different pixel positions are extracted. It represents the pixel values of the color image by a 2 × 2 four-array image, selecting a position at the center of the sensor unit. The color model is an RGB color model, which is denoised by the Gaussian filter denoising algorithm in Matalab. After the processing is completed, the image is binarized using the maximum variance between classes method. In the principle of this method, it assumes that the background of image
is relatively dark, the foreground and background style thresholds are
, and the image size is
. In
, if the number of pixels with a grayscale value less than
is
, the calculation formula for the proportion
of foreground pixels in the image is shown in Equation (10).
The formula for calculating the proportion
of background pixels to the image is shown in Equation (11).
In Equation (11),
represents the number of pixels in
with grayscale values greater than
. The relationship between
and
is shown in Equation (12).
, it sets the total average grayscale of the image to
, and the calculation formula is shown in Equation (13).
In Equation (13),
represents the average grayscale of the image. The inter class variance is set to
, and its expression is shown in Equation (14).
It replaces Equation (13) into Equation (14) to obtain equation (15).
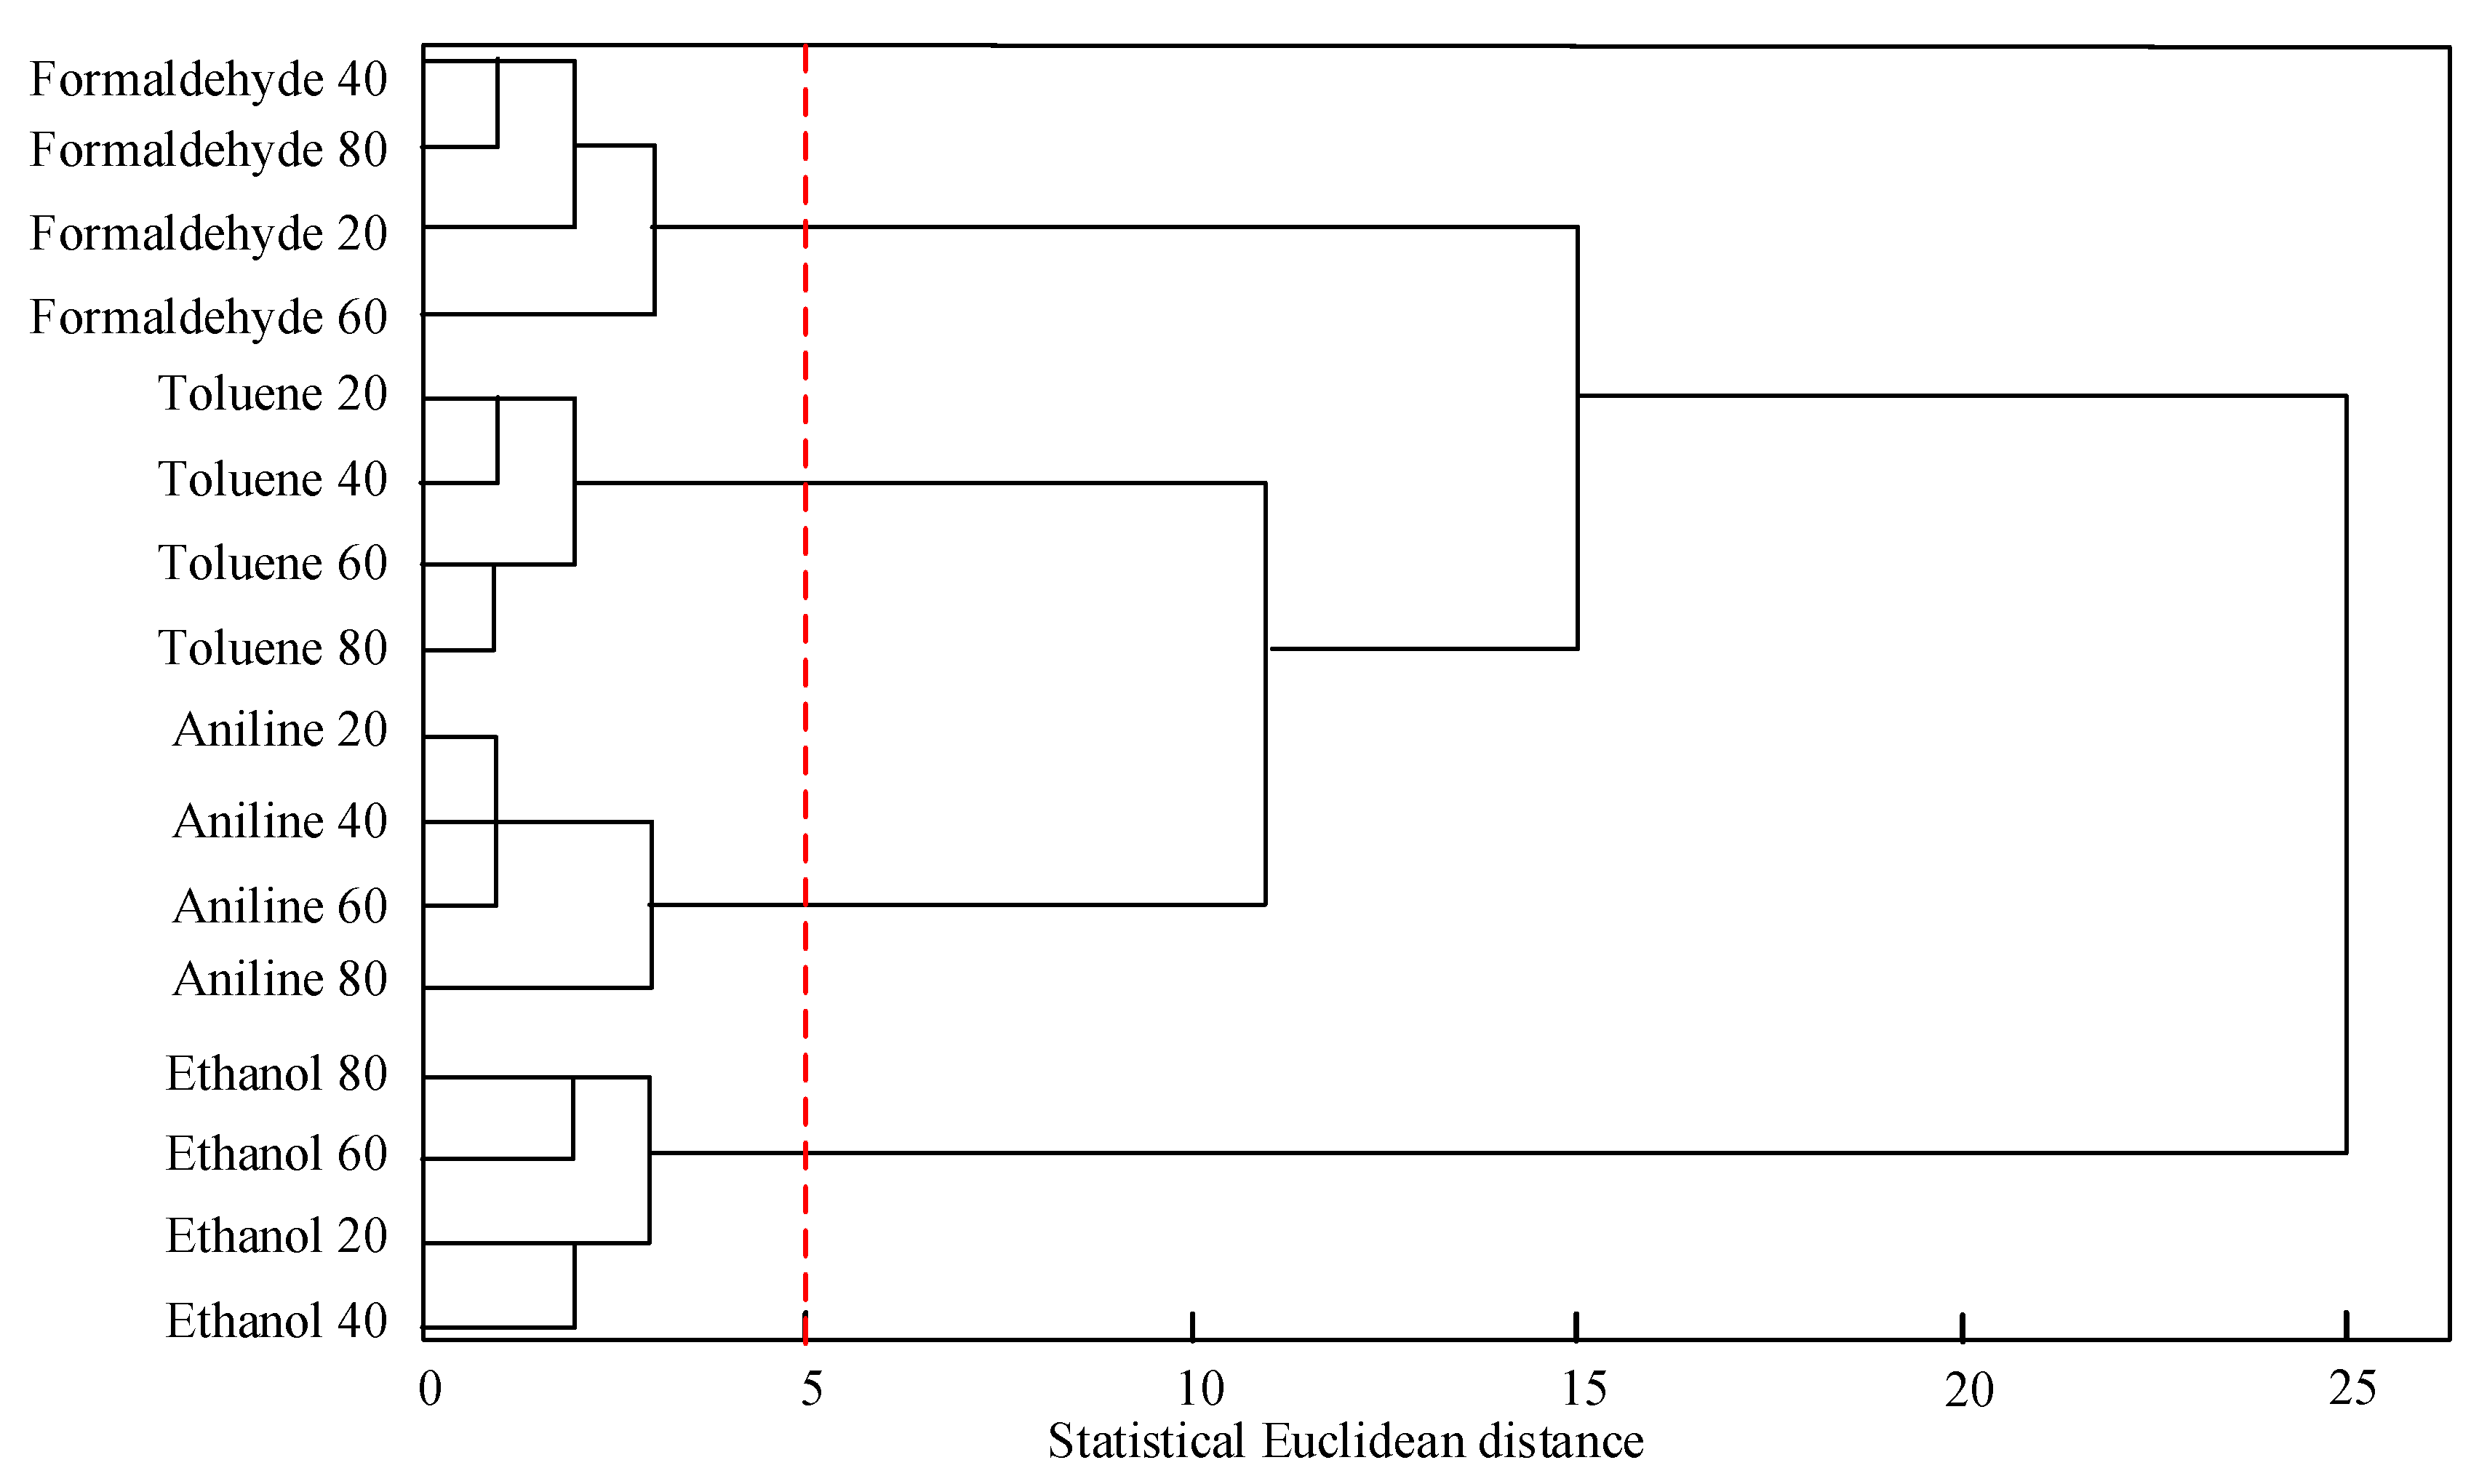
It solves to in view of the traversal method, obtains the binarization threshold of the image, generates a mask in view of this threshold, and overlays it with the filtered image. It extracts the sensitive material area of the sensor unit from the background and obtains the corresponding segmented image. It subtracts the images before and after the segmentation reaction to obtain the corresponding difference. Under the action of linear transformation, by amplifying the difference, it can be seen that the shape of the relevant sensitive material area is approximately circular. By using the first-order distance, the original center of gravity is calculated as the corresponding sensitive material center, and the center point graph is selected to obtain a 14 × 14 pixel square. The center of the circle is the center of gravity, and the square is used as the feature area. It extracts the average grayscale value and obtain the grayscale image of R, G, and B components. Among them, B represents the blue channel, while B1 and B2 represent the fixed position of the sensor chip on the circuit adapter board. Superposition the grayscale value images of the three components obtained to obtain the difference feature map of the sensitive material before and after the reaction with the gas to be tested. According to this processing method, it analyzes the changes in different components of VOC gas. In view of the feature vectors obtained from different VOC gases, a hierarchical clustering analysis is performed using the minimum variance clustering algorithm, and the similarity of the feature vectors is measured using the Euclidean distance.


