Article

Finite Element Modelling and Experimental Validation of the Graphite Cutting Process

School of Mechanical and Automotive Engineering, Guangxi University of Science and Technology, Liuzhou 545006, China
*
Author to whom correspondence should be addressed.
Processes 2023, 11(9), 2546; https://doi.org/10.3390/pr11092546
Submission received: 26 July 2023 / Revised: 17 August 2023 / Accepted: 22 August 2023 / Published: 25 August 2023

Abstract

:
Graphite is extensively used in the engineering field due to its unique properties, and the study of its cutting mechanism has become particularly important. However, the brittle fracture mechanism of graphite makes it rather easy for cracks with a unique pattern of initiation and growth to develop when processing. Herein, the ABAQUS was selected to establish a finite element model (FEM) of the graphite cutting process. The internal crystal structure of graphite was modelled by a Voronoi structure, and a cohesion unit was globally embedded into the solid unit to simulate crack initiation and growth. In addition, the complete process of chip formation and removal was demonstrated. The analysis of the simulation results showed that the graphite material underwent three periodic cycles of material removal during the cutting process, i.e., large, tiny, and small removal stages. Meanwhile, the simulation results indicated that when ac was large enough, the crack gradually grew inside the graphite and then turned to the upper surface of the graphite. However, when ac was tiny enough, the cracks hardly expanded towards the inside of the graphite but grew upwards for a short period. Then, orthogonal cutting experiments of graphite were conducted, and the FEM was verified based on the experimental chip morphology, machined surface morphology, and current geometric model of the graphite cutting process. The simulation and experimental results were consistent. The hereby-presented FEM was a complement to simulations of the processing of brittle materials.

1. Introduction

Graphite is a polycrystalline brittle material [1] presenting metallic and non-metallic properties [2], among which the metallic properties include electrical and thermal conductivity, while the non-metallic properties involve corrosion resistance, lubricity, and thermal shock resistance [3,4]. These properties jointly contribute to graphite being widely used in the aerospace [5], electronics [6], and nuclear industries [7] as solid lubricants [8], refractory materials [9], electrodes for dye-sensitized solar cells [10], nuclear engineering heat sinks [5], and seals for nuclear engineering applications [11]. However, to constantly maximize the benefits of graphite in various fields, further mechanical processing of graphite should still be carried out, but it should be noted that graphite is a material that cannot be easily machined due to its laminar crystal structure [12].
The material removal mechanism of graphite has been extensively studied by scholars. For instance, Berto et al. [13] experimentally evaluated the brittle fracture of graphite under pure compression loading. Huo et al. [14] found that micro-milling of graphite electrodes resulted in material removal by brittle fracture or partial plastic fracture as well as left concavities and micro-cracks on the machined surface. Tang et al. [15] deduced the crack growth characteristics of nuclear graphite by three-point bending tests, and the law of crack initiation and growth was identified by the relationship between crack opening displacement and crack length. Subsequently, Tang et al. [16] studied the pattern of graphite crack initiation and growth using electronic speckle pattern interferometry. Bajpai et al. [17] discussed the brittle fracture characteristics of the material based on the chip morphology produced by pyrolytic carbon during orthogonal micro-grooving. Wang et al. [18] carried out an atomic-level cutting study on graphite, on the basis of which the removal mechanism of the material at the atomic level was revealed using molecular dynamics. Meanwhile, the effect of cutting parameters on the surface quality of graphite has also been investigated. For instance, Schroeter et al. [12] investigated the tool condition and surface quality of graphite in down- and up-milling, and found that up-milling prolonged tool life, but down-milling provided better surface quality; Mijušković et al. [19] summarized the effect of different machining parameters on surface roughness through micro-milling experiments on graphite; Zhou et al. [20] revealed the morphology of graphite chips at different cutting thicknesses using orthogonal cutting experiments, where the chip size and concavity size increased significantly with increasing cutting thickness, and confirmed that tiny chips similar to metal chips were produced when the cutting thickness was small enough.
Meanwhile, many models of the cutting process of brittle materials have been reported in the literature. For instance, Zheng et al. [21] proposed a prediction model of the critical grinding depth for the study of the ductile–brittle transition mechanism of crystal silicon and found that the material was removed by plastic ploughing and brittle fracture. Zhang et al. [22], based on the Preston equation, established a material removal model for BK7 glass by considering the influence of the contact state between abrasive particles and workpiece on the surface quality to study the material removal characteristics of brittle materials in ultrasonic vibration-assisted polishing. Ma et al. [23] established a theoretical model of the characteristic temperature of fluorophlogopite ceramics based on the law of conservation of energy and the principle of fracture mechanics, and studied the continuous fracture mechanism of the materials. Meng et al. [24] analysed the chip morphology and cutting mechanism during the machining of compacted graphite iron by finite element modelling. However, finite element modelling capable of simulating the entire cutting and machining process of graphite materials was not reported. Chen et al. [25] modelled the growth of cracks in graphite using the extended finite element method. Yu et al. [26] discussed the crack growth behaviour of graphite in numerical simulation methods. Bajpai et al. [27] developed an FEM for orthogonal machining of pyrolytic carbon, which could simulate the removal of brittle materials and predict cutting forces for different process parameters. Wan et al. [28] proposed a geometric model of the graphite/polymer composite cutting process, which demonstrated crack initiation and growth in the material and clarified the mechanism of material removal and the formation of the machined surface.
Overall, all these existing studies focused on the material removal mechanism of graphite, optimization of cutting parameters, and removal of brittle materials, with research on the cutting mechanism simulation of graphite rarely reported. Moreover, most of the studies on the cutting mechanism of graphite were conducted experimentally, and it was experimentally difficult to determine the cutting mechanism of graphite due to the unpredictability of workpiece geometry and boundary conditions in specific experiments. To this end, an FEM simulating the complete cutting process of graphite should be necessarily provided. Finite element simulation could accurately analyse the fracture characteristics of the material and was thus considered especially suitable for simulating the fracture process of the micro-scale size of the workpiece, and finite element analysis could be used to solve the problems of crack initiation and growth in the material. In addition, studies on the finite element simulation of the processing of brittle material have been rarely reported as well, bringing considerable difficulty. In this case, a finite element modelling analysis of the processing of graphite was hereby conducted using the finite element simulation method, the FEM was verified by comparison with experiments, and the system was improved for the simulation of cutting processes in brittle materials.

2. Finite Element Modelling

In this paper, the cutting processes of graphite were simulated using the finite element analysis software ABAQUS 2021/Explicit, which is widely used to solve short-term, transient dynamic problems such as high-speed cutting, impacts, and explosions [24,29,30]. As shown in Figure 1, the cutting thickness is ac, and the material fails and forms chips during the cutting process. The cutting speed v of the tool moves in the -X-direction.

2.1. Material Parameters of the Model

To facilitate the validation of the FEM of the graphite cutting process by experiments, some of the material parameters used in the modelling process were obtained through suppliers, and some tensile strengths were necessarily calculated after performing tensile experiments.
Figure 2a shows the columnar graphite samples used for the tensile experiments, which are 130 mm long cylinders with diameters of 40 mm at both ends, 25 mm in length and 20 mm in diameter at the narrowest part. The materials used for the experiments were customized. Figure 2b shows the device used for the tensile experiments. The graphite sample was clamped to the universal test machine through a fixture made in this laboratory. Table 1 shows the specific performance parameters related to the graphite material used for the tensile experiments.

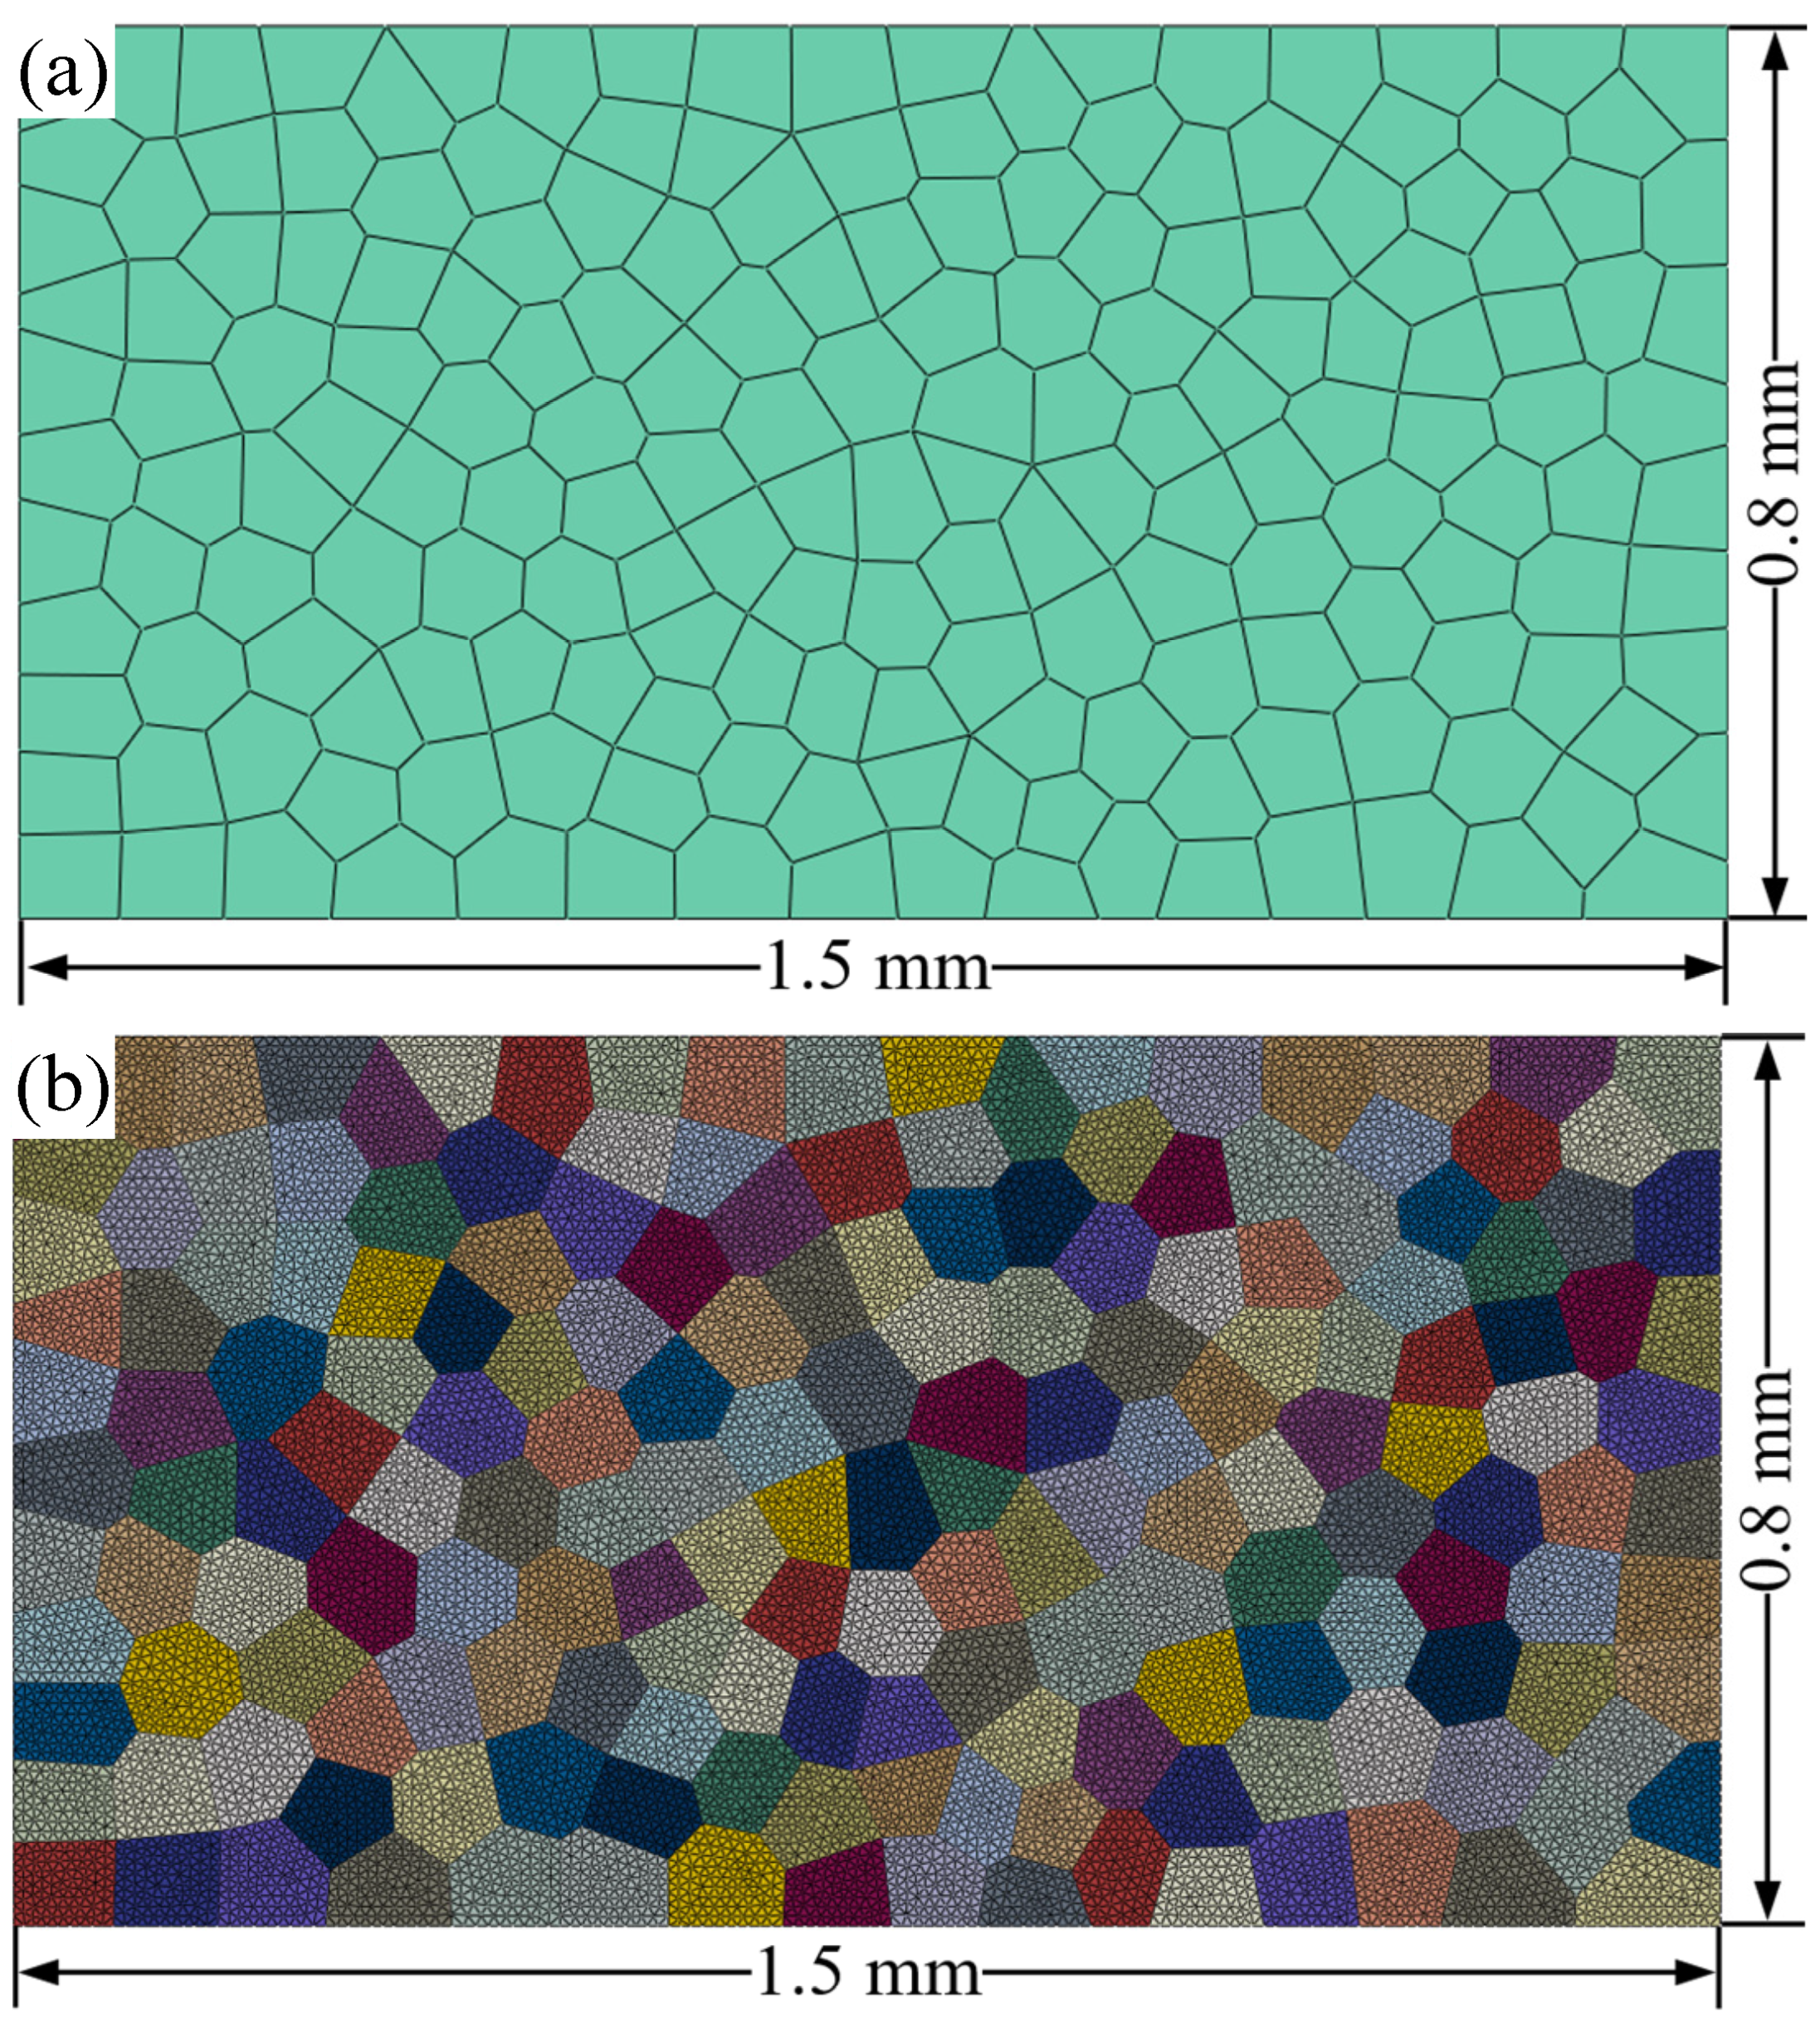
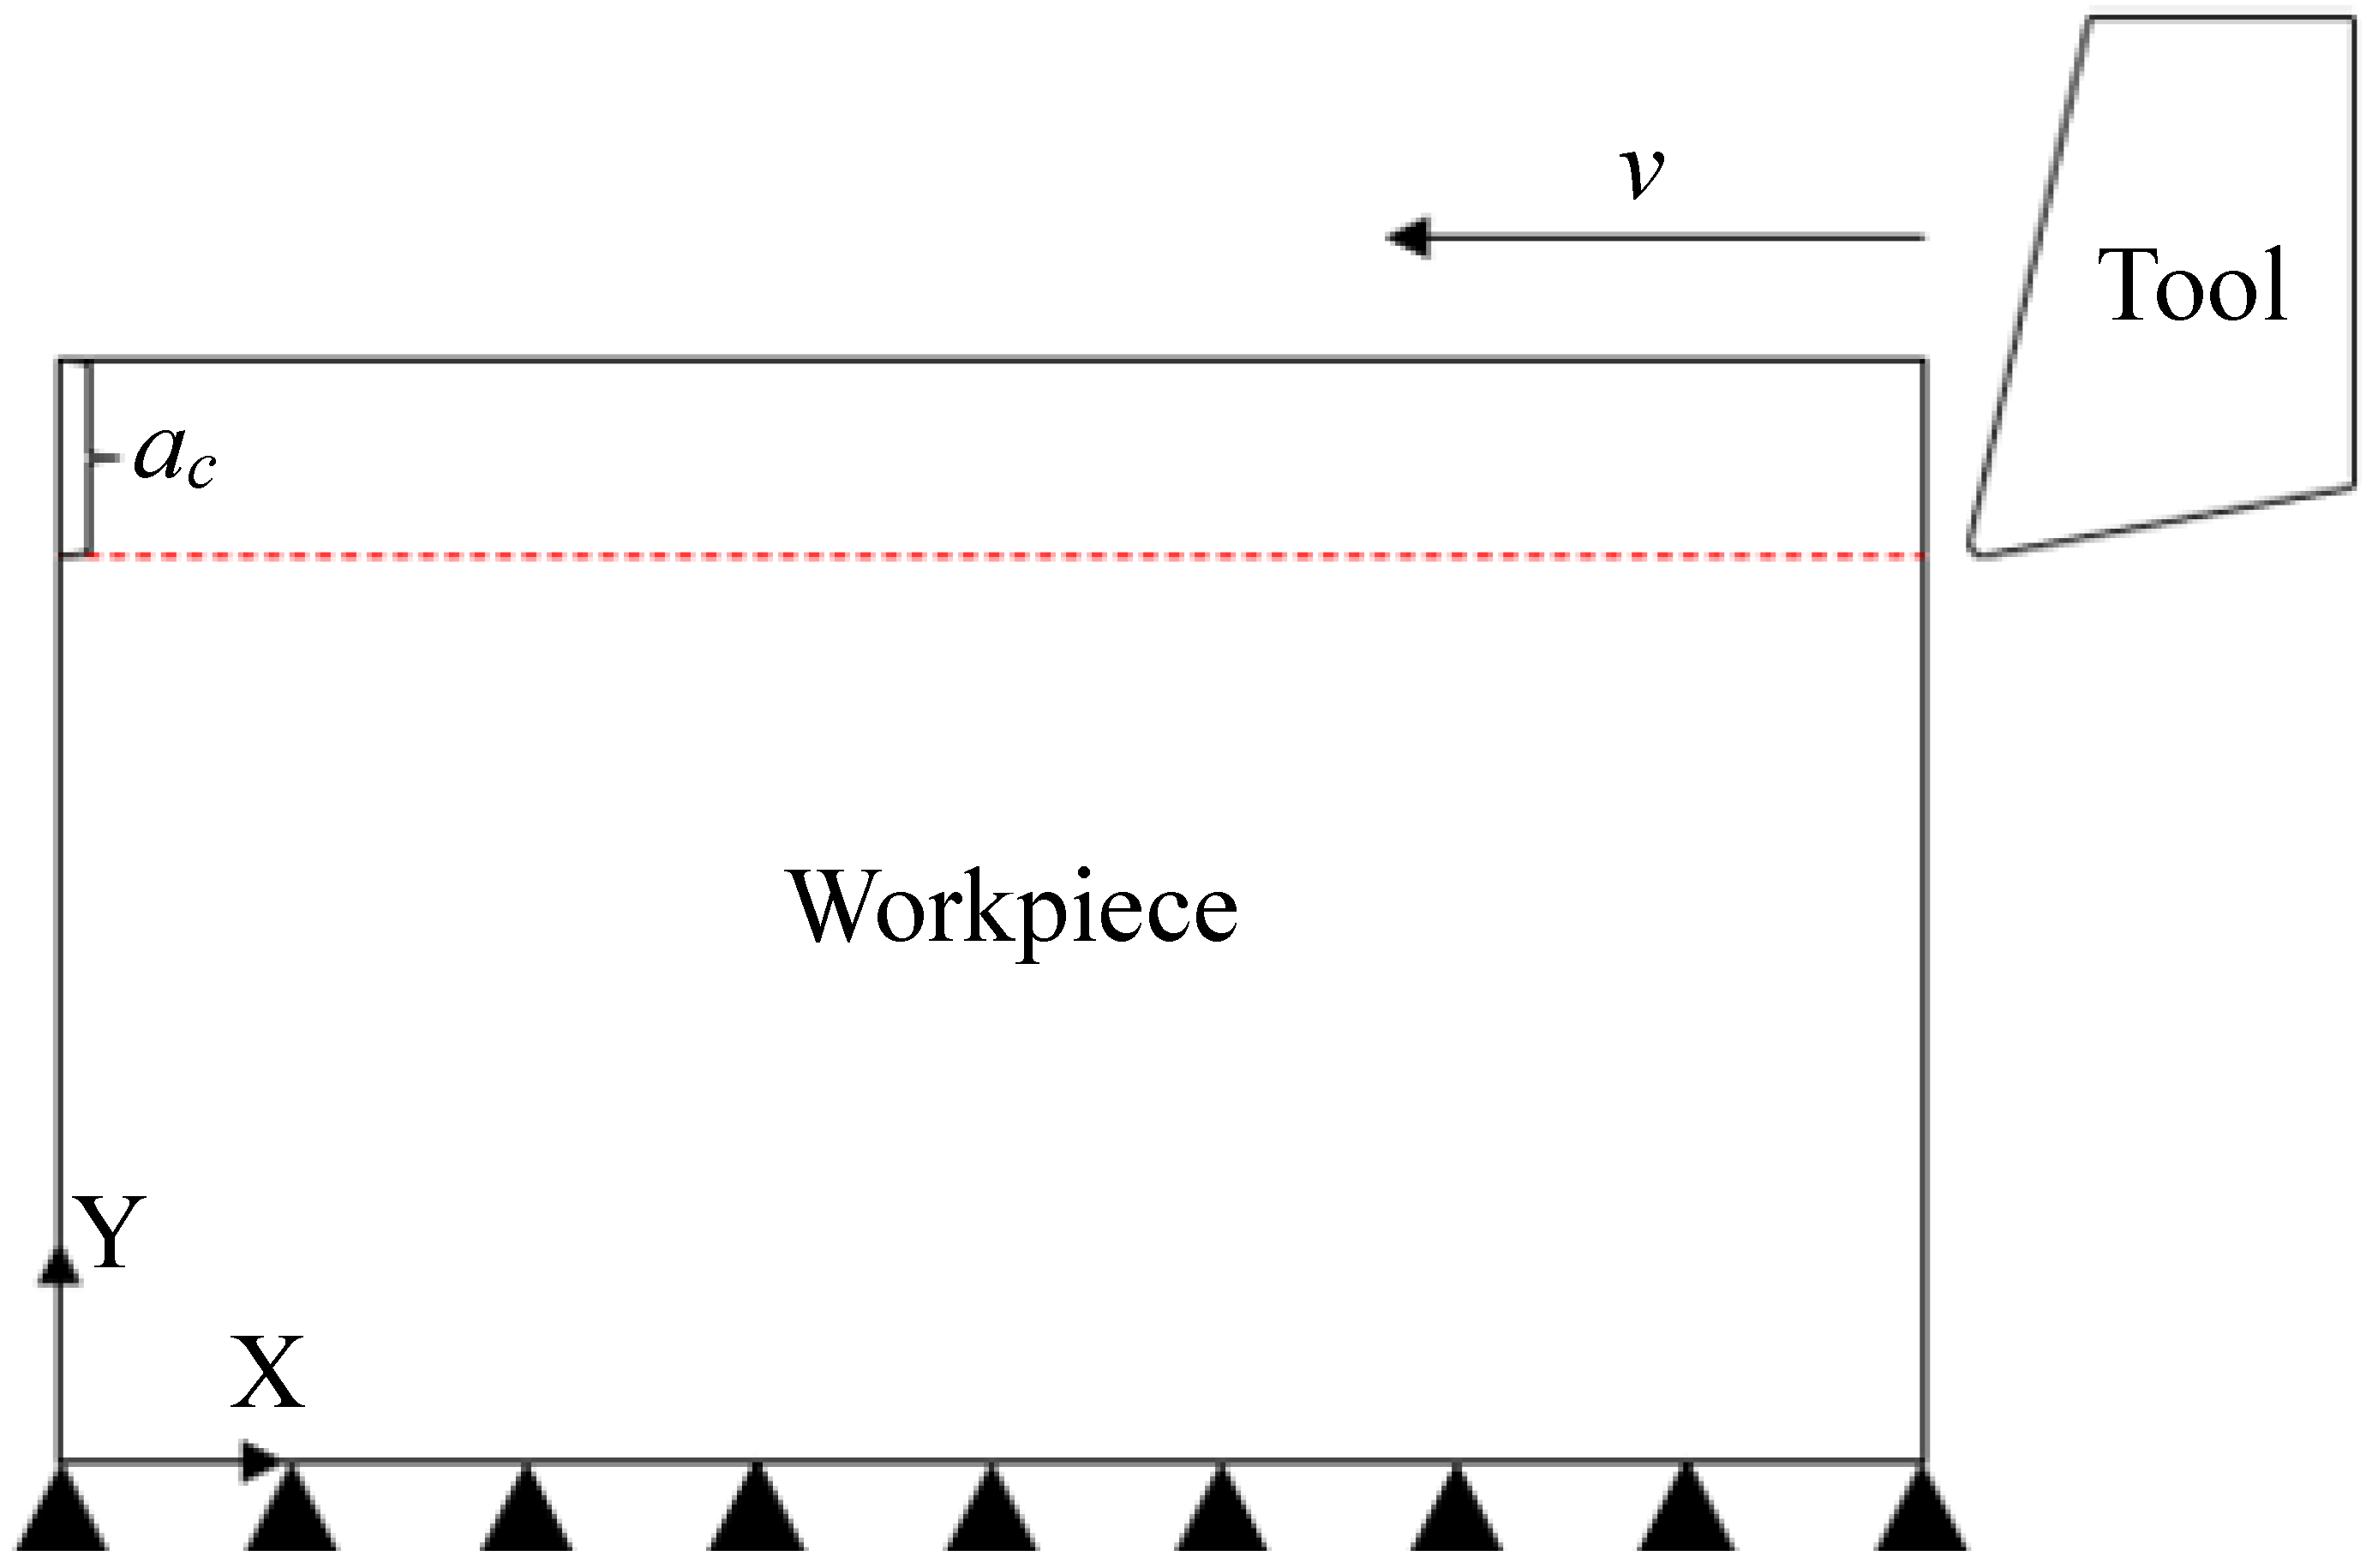
2.2. Geometric Modelling and Meshing of Graphite Materials and Tools

In the process of finite element modelling, an appropriate intrinsic model should be selected, and an internal structure suitable for this material should be constructed to obtain accurate simulation results. In this study, the material structure of graphite was characterized using a Voronoi diagram structure, which is also known as a Thiessen or Dirichlet tessellation [31], pioneered by the Russian mathematician Georgy Fedoseevich Voronoi [32]. In the Voronoi structure, the individual basic graphical elements used to delineate the space are known as sites. As shown in Figure 3, P1, P2, and P3 are any three sites in the plane, and these three sites can be connected to obtain a triangle. Then, the vertical bisector of the three sides of this triangle can be connected to obtain the three areas V1, V2, and V3 corresponding to these three sites. Thus, each site Pi in P corresponds to a region Vi such that any point within Vi is closer to Pi than to the other sites.
Voronoi structures are widely used for the stochastic modelling of polycrystalline materials [33]. In the field of grain-level material modelling, Voronoi structures are often coupled with the finite element method to simulate polycrystalline structures, mainly for modelling the fragmentation of ceramic structures under dynamic loading [34], grain boundary slip and segregation in metals [35], as well as modelling the damage behaviour of brittle rocks [36]. Therefore, a Voronoi structure should be applicable for the modelling of graphite as a polycrystalline brittle material. Figure 4a shows the internal structure of the material used in this paper.
The geometric model of 2D graphite in this study was 1.5 mm × 0.8 mm, and the number of generated Tyson polygons was 18 × 10 based on experience gained from several simulations, the deformation angle, and computational efficiency. The model structure was complex, and the quadrilateral mesh was difficult to apply. The triangular mesh was not subject to this limitation, and it could better approximate the geometric features in the region where deformation was most severe; thus, the triangular mesh was hereby used to simulate the growth of curved cracks with good accuracy. However, it should be noted that it was necessary for the workpiece mesh to be as fine as possible to ensure the reliability of the subsequent calculations. The size of the mesh for the workpiece was 0.01 mm, and the number of meshes was 27,281. Figure 4b shows the graphite model after meshing. Different sets were created in ABAQUS and distinguished by different colours for ease of observation.
As shown in Figure 5, upon the completion of the geometric modelling work, the graphite model was assembled with the model tool through the ABAQUS assembly function, and ac was adjusted by changing the position of the model tool. The rake angle γ of the tool model was 10°, and the rounded edge radius r was 20 μm. In addition, several tool models with different parameters were established for the subsequent study of the relevant cutting parameters, and the tool was set to a rigid body, with γ values of 0°, 5°, 10°, 15°, and 20°, and r values of 10 μm, 20 μm, 30 μm, 40 μm, and 50 μm.

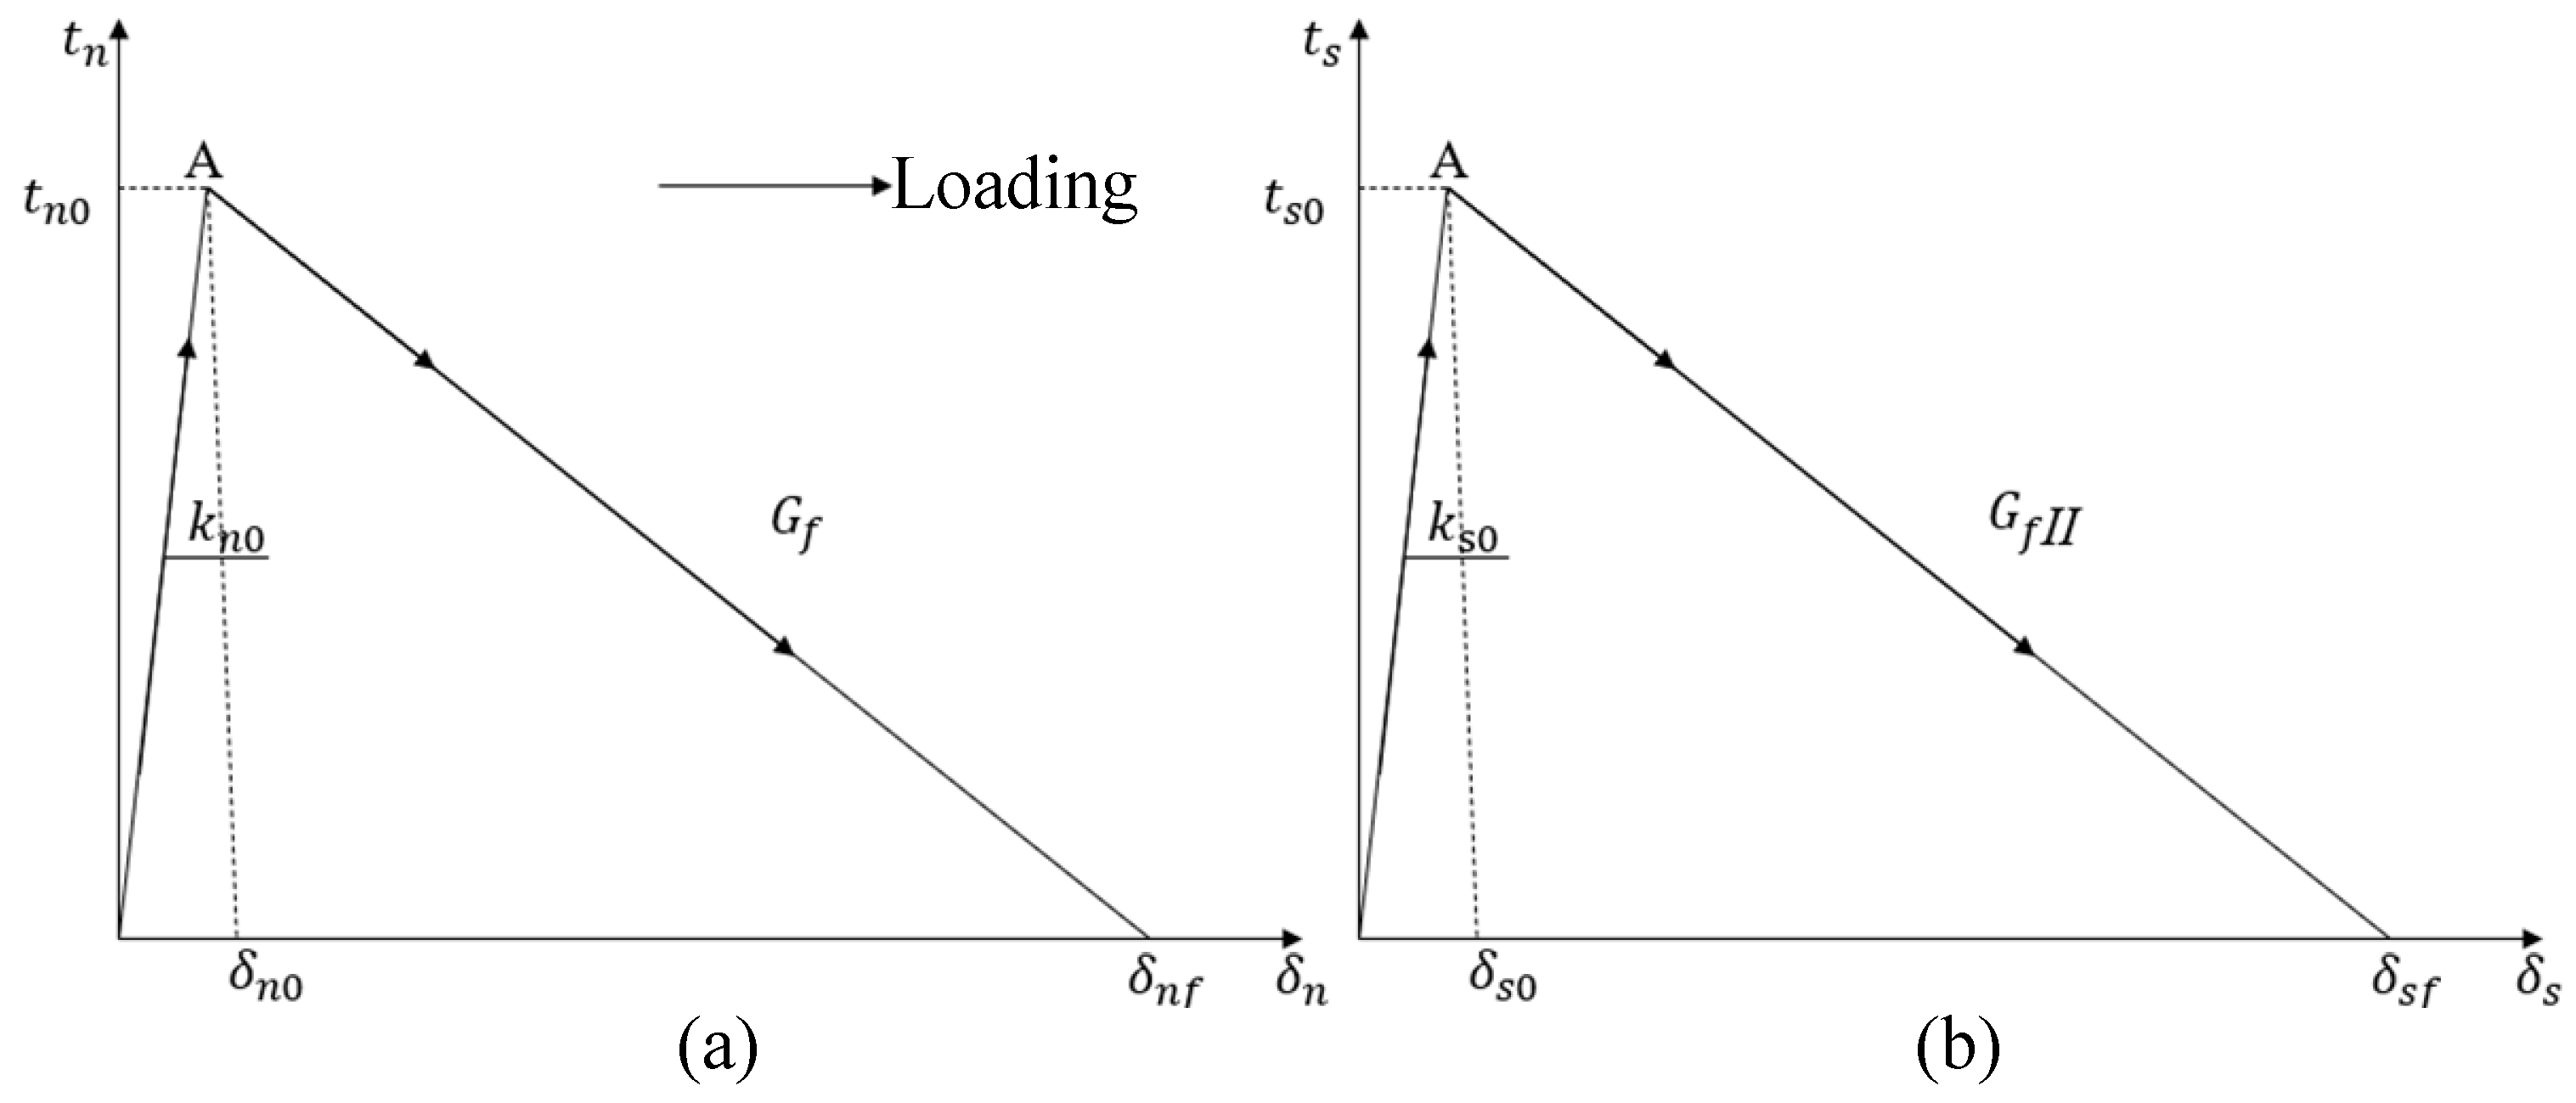
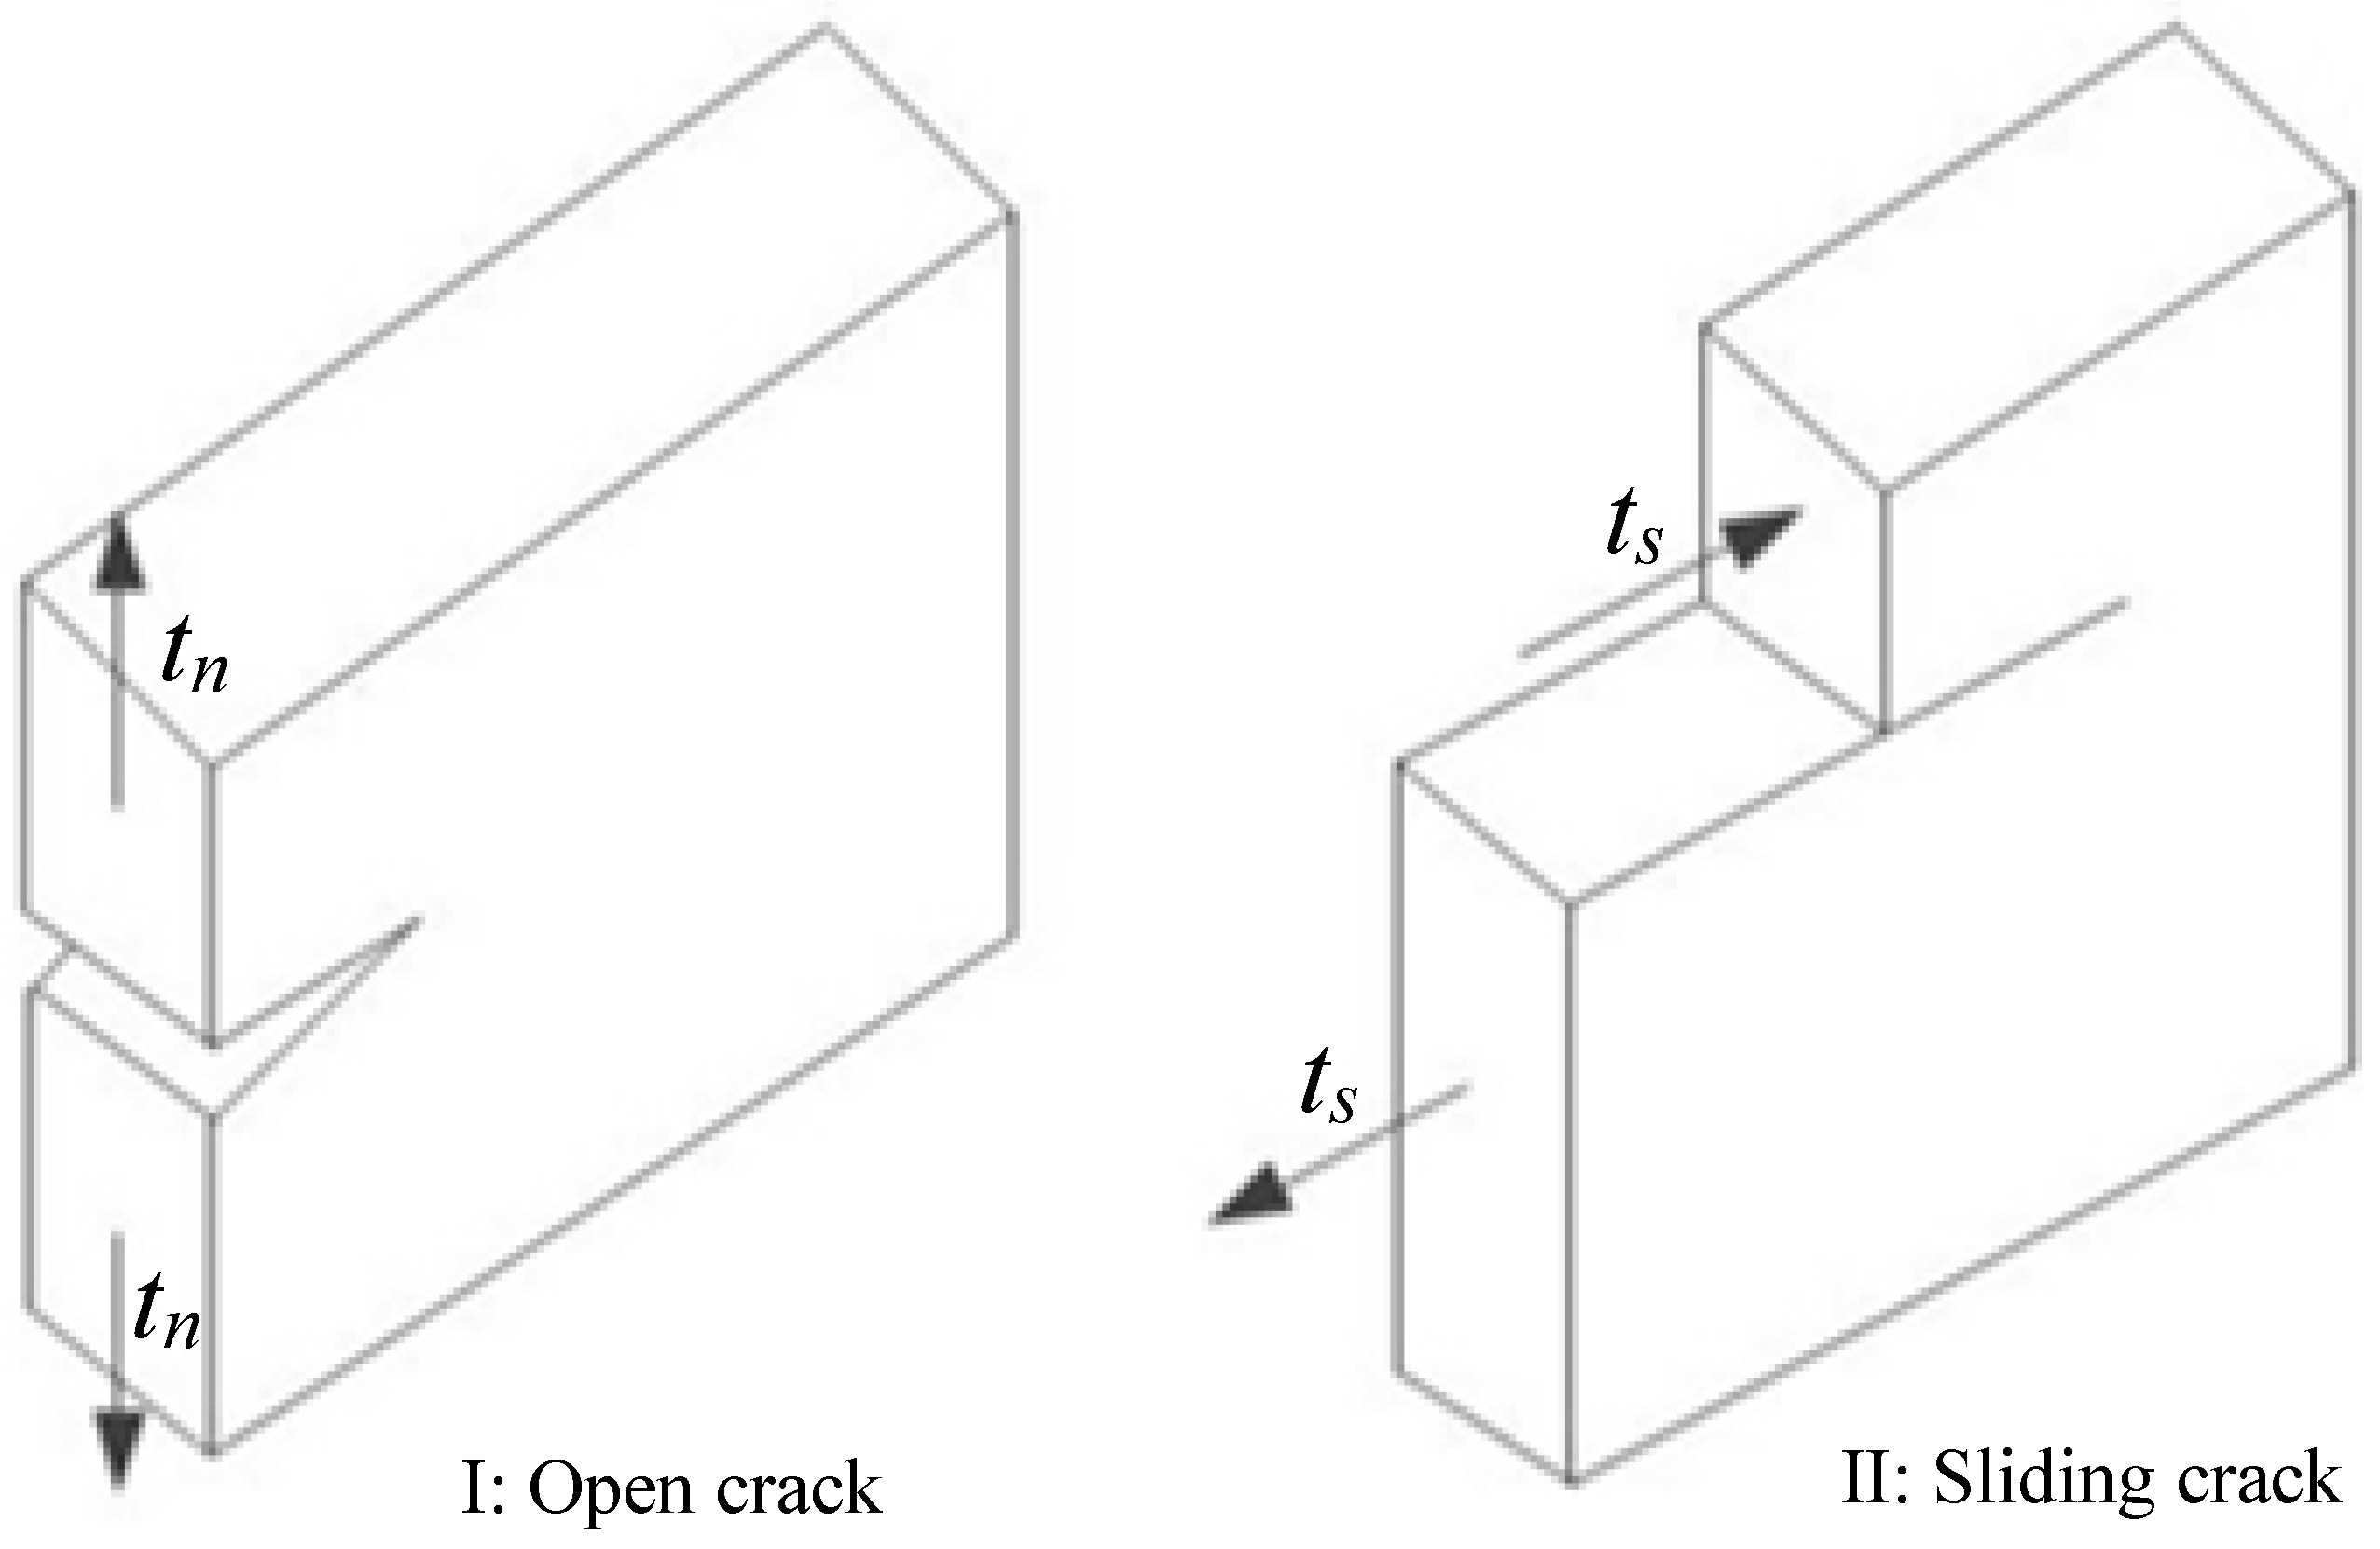
2.3. Establishment of the Constitutive Model of the Material

A constitutive model refers to a mathematical expression used to characterize the stress–strain relationship or mechanical properties of a material. At present, there are many established constitutive models, which can be repeatedly found in the literature in simulation studies of various metals, geotechnical materials, ceramics, and many other materials. The constitutive model used in this paper is the cohesive zone model first proposed by Dugdale and Barenblatt [37], which can simulate the delamination fracture and energy dissipation in the fracture process zone (FPZ) of materials and is one of the tools commonly used for simulating brittle fracture behaviour.
As shown in Figure 6, in the case of a two-dimensional problem of fracture mechanics, there are two types of cracks, i.e., type Ⅰ and type Ⅱ, representing open and sliding cracks, respectively. Herein, the material bonding and surface friction in the FPZ were assumed to generate the normal traction tn and tangential traction ts on the surface of these cracks. The tn–δn and ts–δs typical linear softening curves are shown in Figure 7, where δn represents the crack opening displacement; δs represents the crack sliding displacement; and δnf and δsf are the critical relative displacements when the traction force decreases, representing the damage that has occurred. As the damage D grows gradually from “0” (point A) to “1” (representing damage occurrence), the traction force also decreases monotonically as the corresponding relative displacement of the crack surface increases. This very process is commonly referred to as tensile or strain softening. The areas of the entire triangles in Figure 7a,b represent the type Ⅰ fracture energy Gf and type Ⅱ fracture energy GfⅡ, respectively. In this study, Gf and GfⅡ were material properties that must be obtained, and the relevant data could be obtained from the tensile and shear experiments and calculations for the material. The initial tensile stiffness kno before reaching the tensile strength tno should be high enough, but not too high. Otherwise, numerical error would be reported during the calculation, and both were required for the simulation. Similarly, a reasonable value of the initial shear stiffness kso was required before reaching the shear strength tso, and the values of kno and kso could generally be determined using a trial-and-error method during the simulation.
Based on the cohesive crack model, the intrinsic behaviour of a COH2D4 (two-dimensional four-node) cohesive cell with zero thickness in the two-dimensional plane of ABAQUS can be described by a softening law similar to that shown in Figure 7, where, due to irreversible progressive damage, the stiffness values of the material ks and kn decrease with increasing δs and δn during unloading. A scalar index D represents the damage, i.e., the damage caused by all physical mechanisms of cracking. The total effective relative displacement δm as a function of δs and δn is given by the following equation [38]:
δ m = < δ n > 2 + δ s 2
< δ n > = { δ n , δ n > 0 ( tension ) 0 , δ n < 0 ( compression )
According to the linear softening trend in Figure 7, the evolution of the damage can be expressed as [38]:
D = δ mf ( δ m , max δ mo ) δ m , max ( δ mf δ mo )
where δm,max denotes the maximum effective relative displacement obtained during loading; δmo is the effective relative displacement corresponding to δno and δso in Figure 7; and δmf is the effective relative displacement corresponding to δnf and δsf. Equation (3) shows that after the damage starts, D evolves monotonically from “0” to “1” with further loading.
Meanwhile, the material stiffnesses kn and ks can be calculated by Equation (4) as well as Equation (5) [38]:
k n = ( 1 D ) k n o
k s = ( 1 D ) k s o
The traction force is influenced by the damage D, which is calculated by Equation (6) as well as Equation (7) [38]:
t n = { ( 1 D ) t n ¯ , t n ¯ > 0 t n ¯ , t n ¯ < 0
t s = ( 1 D ) t s ¯
where t n ¯ and t s ¯ represent the stress components of the predicted elastic traction separation behaviour in the absence of damage. In addition to the damage evolution relationship given in Equation (3), a damage initiation relationship for the onset of stiffness degradation is needed. To this end, “Maxs Damage” in ABAQUS was hereby chosen as the damage initiation criterion, which demonstrates a maximum nominal stress ratio of “1” as the onset of damage and can be expressed as [27]:
m a x { < t n > t n o , t s t s o } = 1
After establishing the material constitutive model and related parameters, measures should be necessarily taken to globally insert the cohesive cells into the mesh shown in Figure 4b, so as to simulate the cracking behaviour of the material. In this study, the relevant values used in the cohesion model simulations were kn = 8000 MPa, ks = 6000 MPa, tn = 9.6 MPa, and ts = 6.9 MPa. In addition, considering the computational accuracy and time cost of the simulation, the thickness of the cohesive unit was set to 0.002 mm in the modelling process.

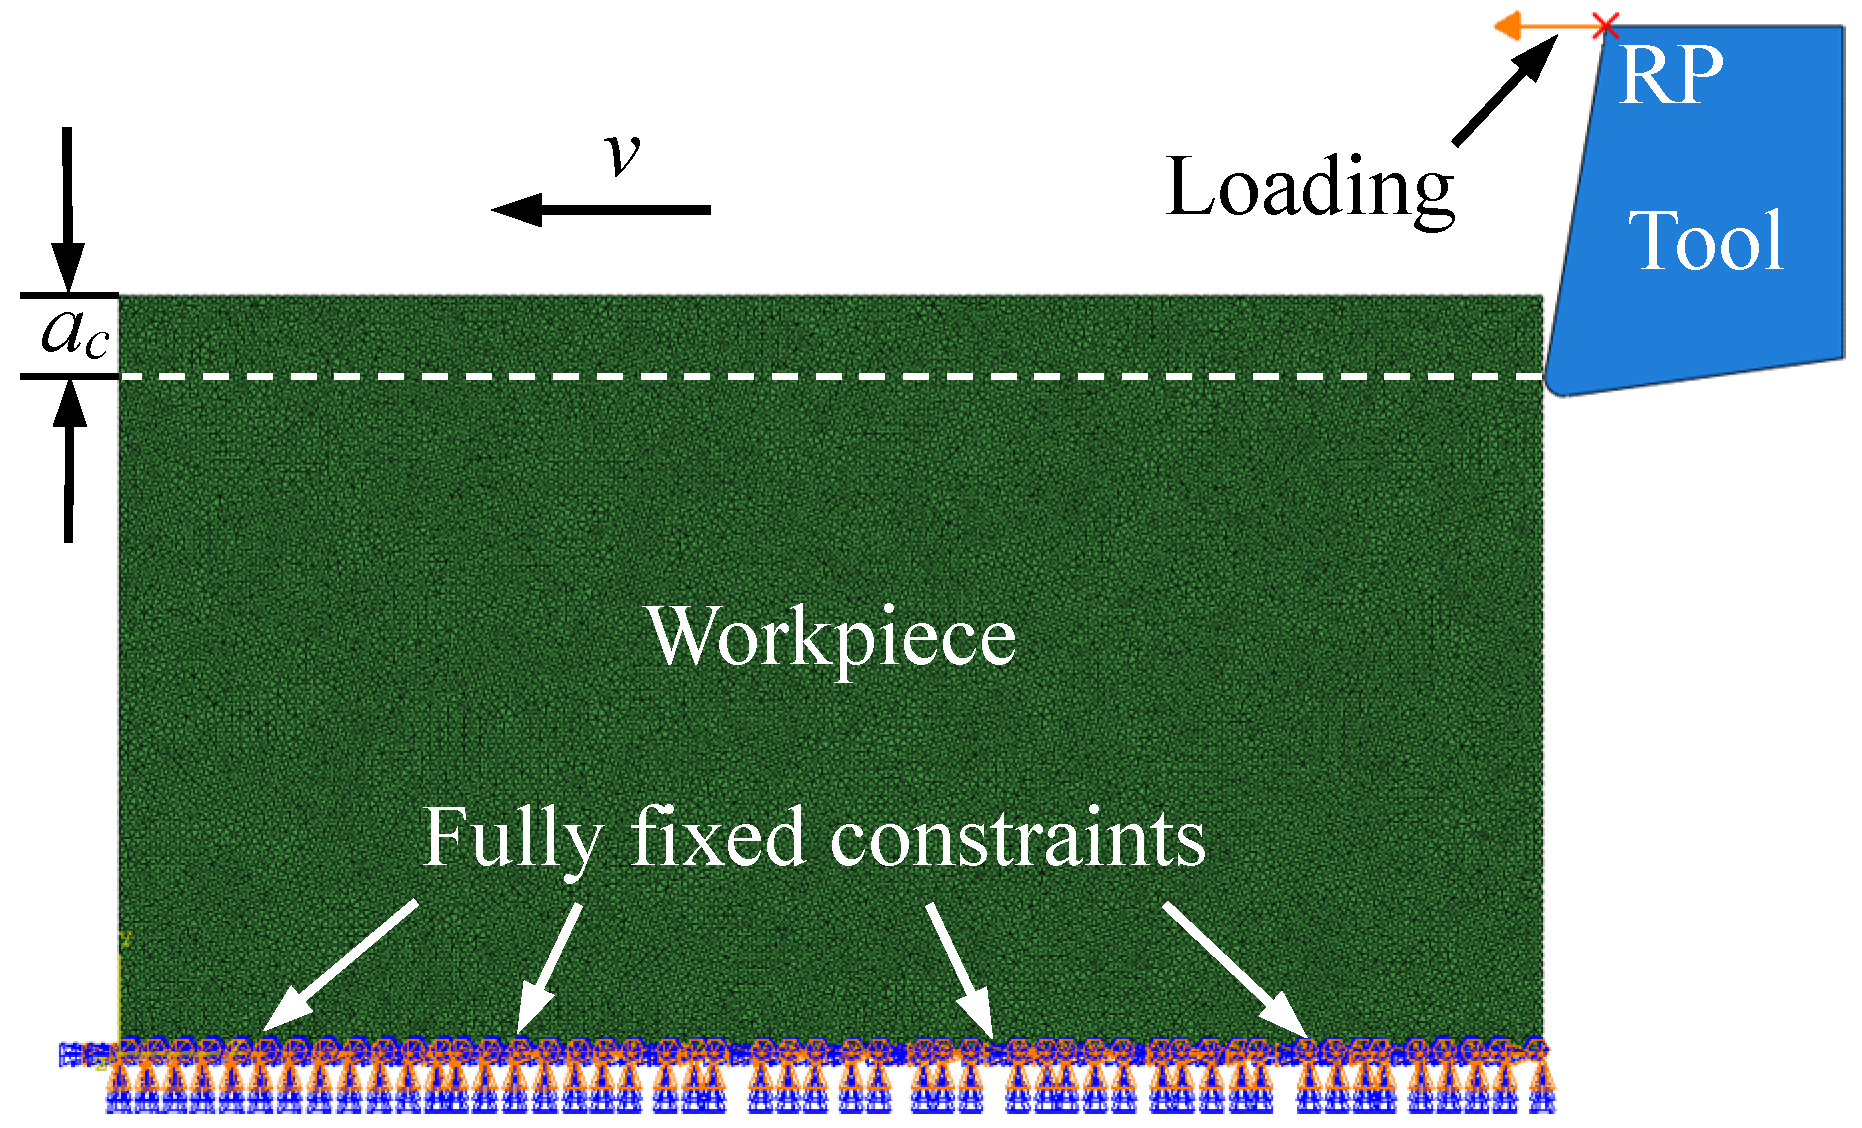
2.4. Interactions and Boundary Conditions

Herein, interactions of contact and friction behaviour between the tool and graphite, including the contact between the tool surface, chips, and machined surface, were observed during the cutting process. It was important to correctly model the contact and friction between the tool and the workpiece. In this study, a “general contact” method was used to achieve the “self-contact” of the chip on the workpiece being cut to prevent the chip from affecting the tool and subsequent cutting action. In addition, “surface-to-surface contact” in the explicit analysis was used between the tool and the workpiece, and given that the surface of the tool in contact with the workpiece changes continuously during cutting progresses, the cutting edge of the tool should be in contact with the entire workpiece. In the contact properties, the tangential behaviour of the tool and the normal behaviour were established. The “penalty algorithm” was used for the tangential behaviour, the friction coefficient was set to 0.5 according to actual experience and relevant literature, and the behaviour of the normal pressure overload was set to “hard contact”.
The boundary conditions of the model are shown in Figure 8. The bottom of the workpiece was set as a completely fixed constraint. Because the deformation of the tool was small during the cutting process, the tool was set as a rigid body, and an arbitrary point (RP) on the tool was chosen as a reference point to facilitate the application of load and the acquisition of parameters such as the cutting force in post-processing. Finally, the values of v used in the FEM were 3 m/min, 6 m/min, and 12 m/min, and the values of ac were 0.1 mm, 0.2 mm, and 0.3 mm, respectively.
In addition, during the actual cutting process, the cutting results could be affected by factors such as the internal inhomogeneity of the material and the random vibration of the machine tool, but considering their small effect on the machining quality, these factors were not included in this study.

3. Analysis and Validation of the FEM

The FEM was used to solve the calculations, and the material removal method was analysed in accordance with the results of the simulations. Then, a series of graphite orthogonal cutting experiments were conducted to compare the experimental and simulation results. Based on the chip morphology obtained from the experiments, the machined surface morphology, and the geometric model of the cutting process available in the literature, the FEM was finally verified.

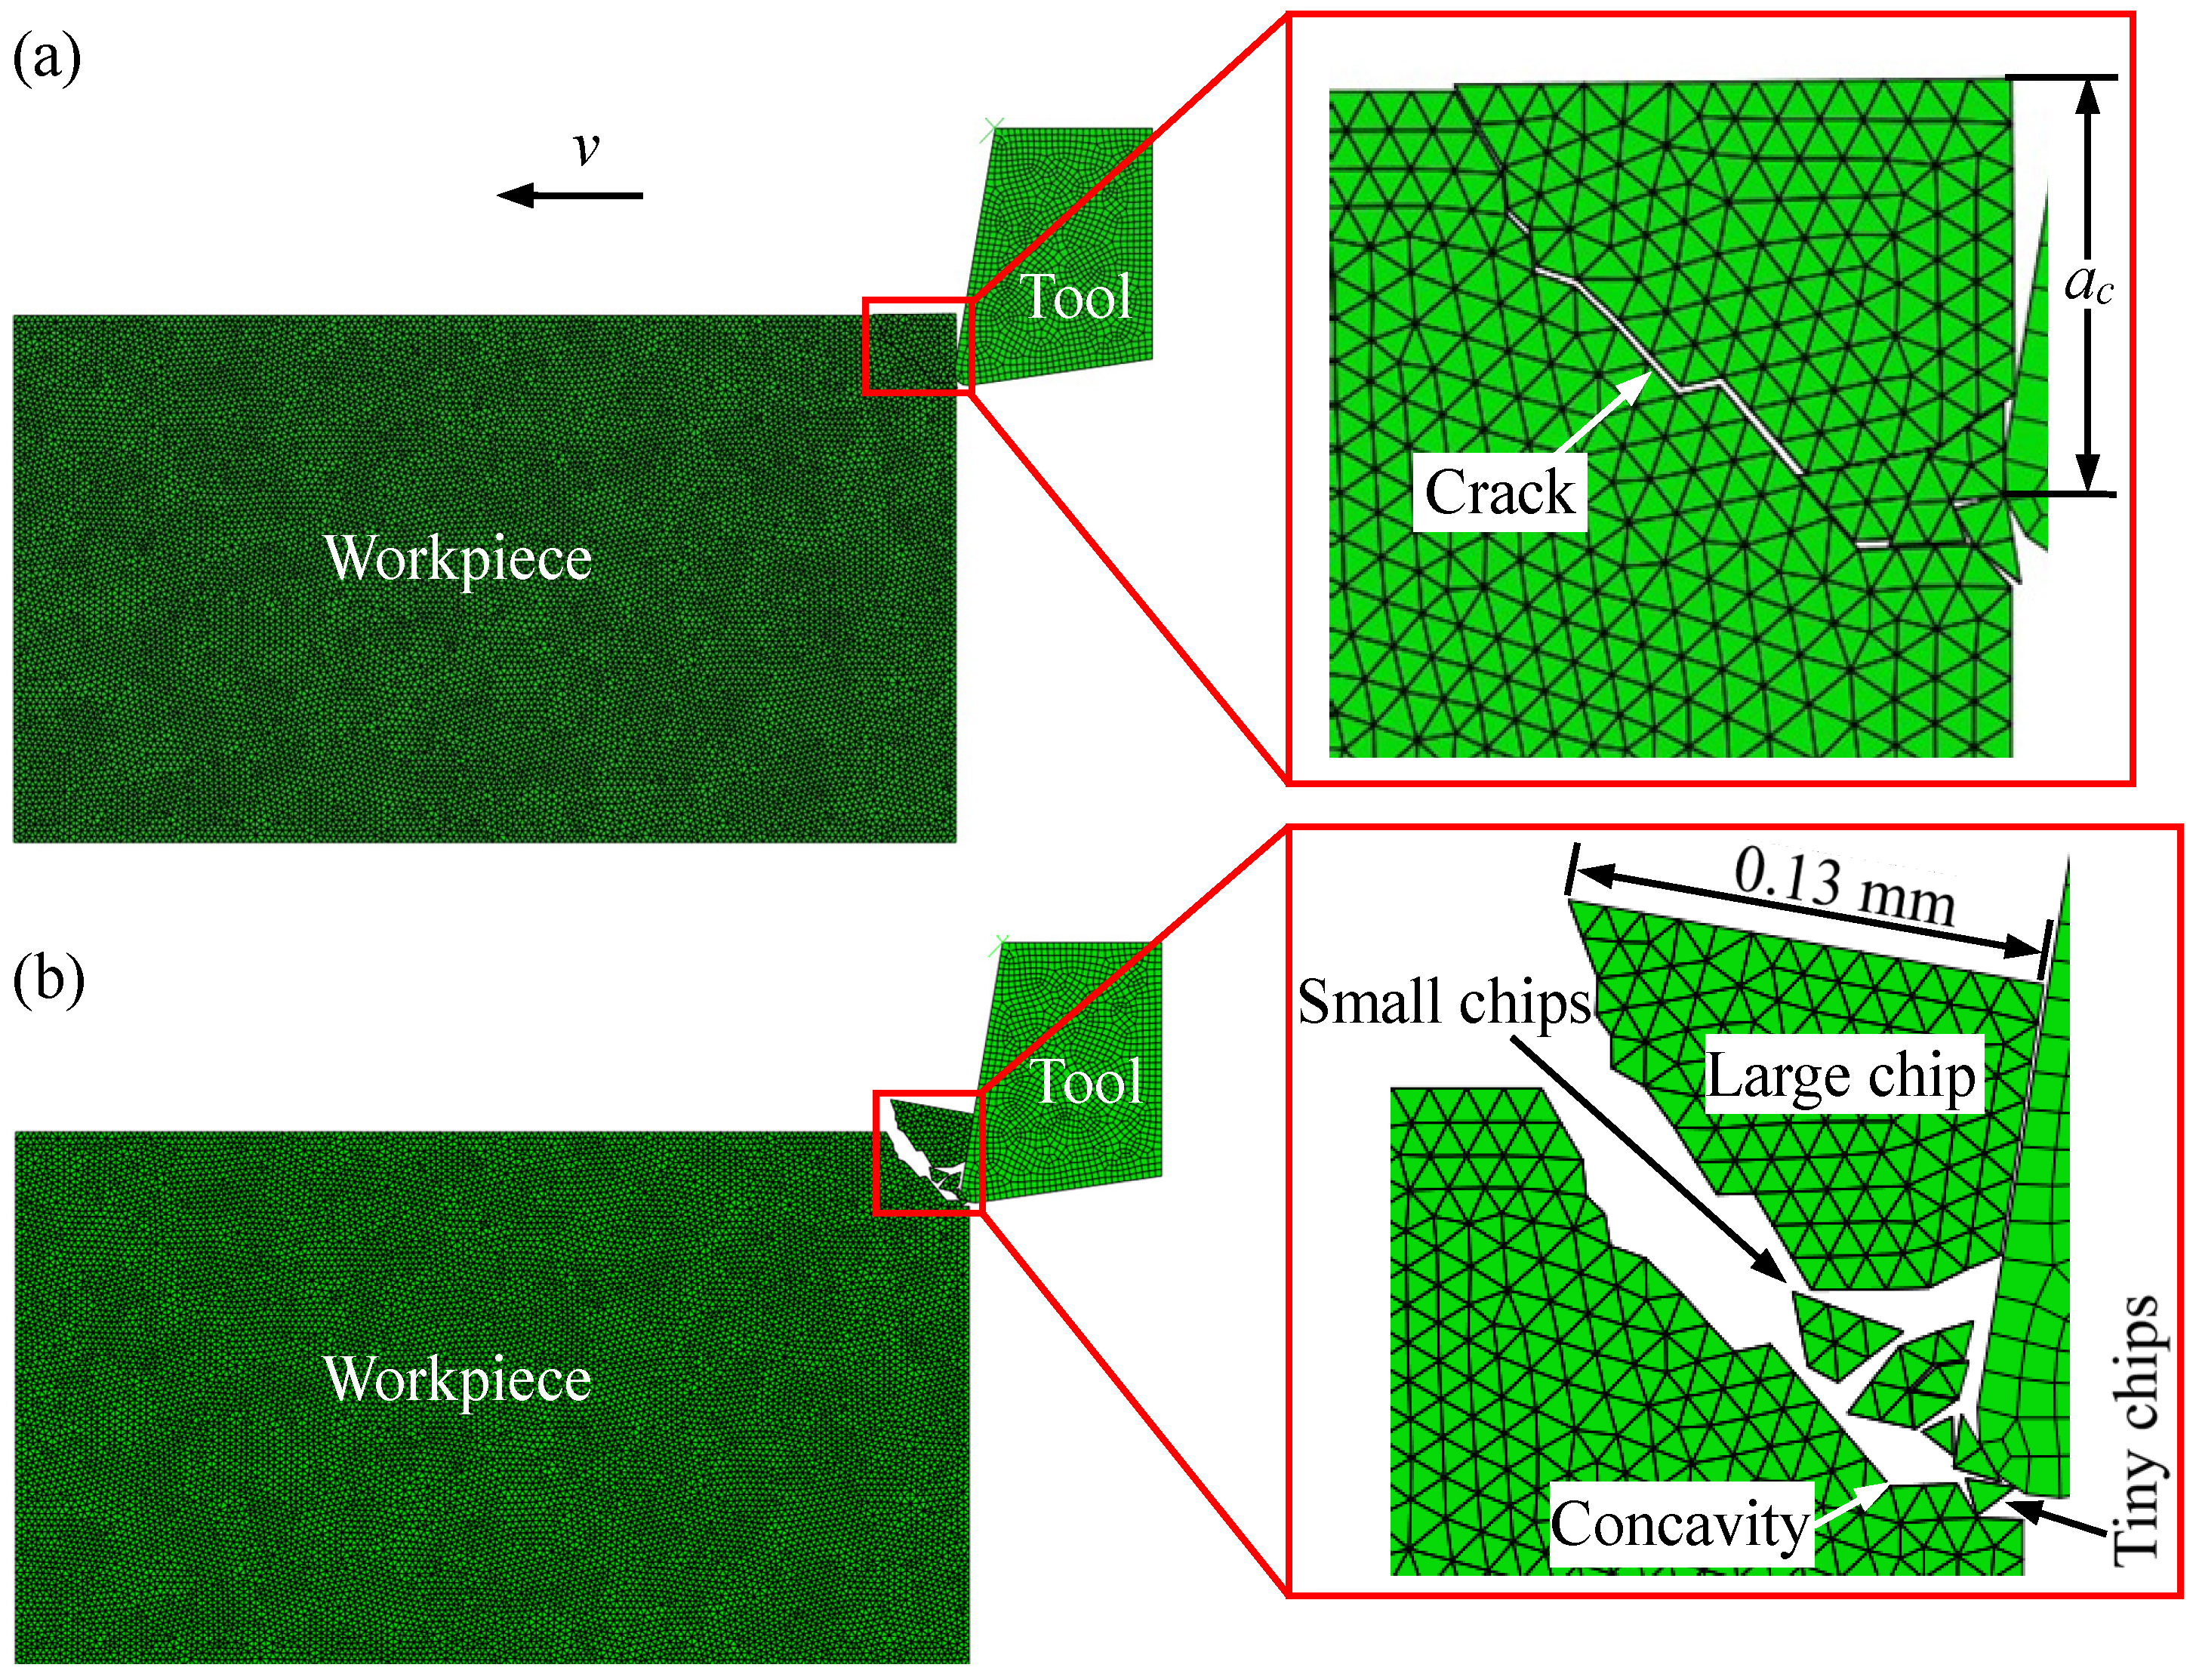
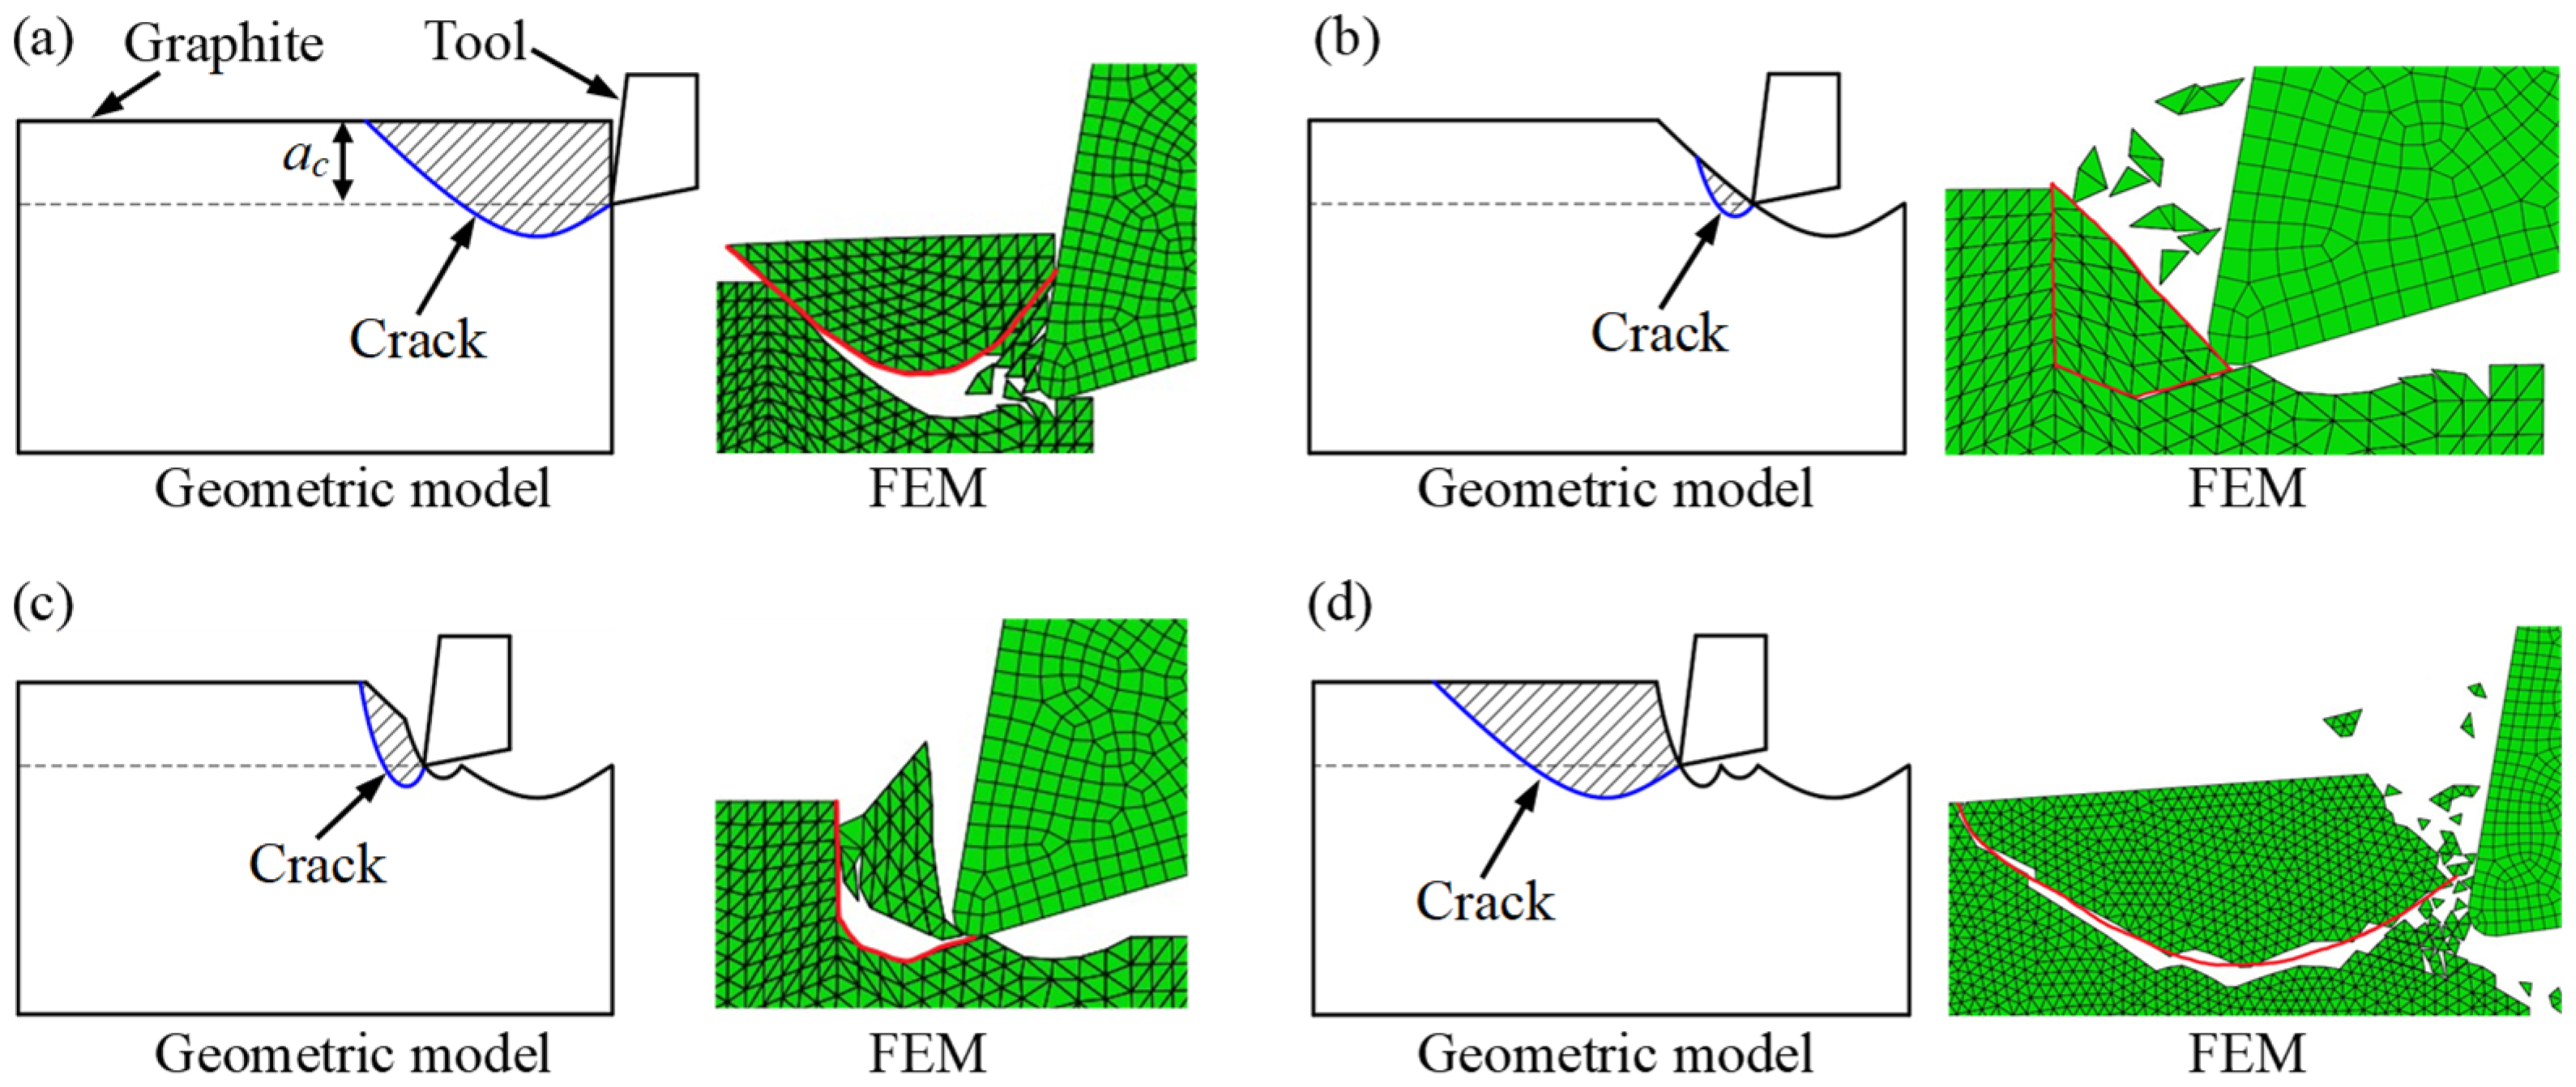
3.1. Analysis of FEM Results

The simulation results were viewed and analysed using the post-processing function of ABAQUS. Figure 9 shows the cutting process in the case of an ac of 0.1 mm, v of 3 m/min, γ of 10°, and r of 20 μm. As shown in Figure 9a, in the process of cutting graphite, the tool gradually reached the surface of the workpiece and then continued to move, thereby gradually increasing the load on the material. When the load was greater than the fracture strength of the graphite material, a crack was initiated at the apex of the cutting edge. As seen from Figure 9a, due to the small ac, the crack did not basically grow towards the interior of the material but turned to the material surface after initiating. Then, the tool continued to cut into the workpiece, as shown in Figure 9b. This was the stage when large blocks were removed from the material, and because the removal of the material formed a concavity on the processed surface, a large chip size of approximately 0.13 mm and small chips and tiny chips of less than 0.05 mm were produced. However, the ac was shallow, so the concavity was small and shallow as well.
However, when ac increased, the situation changed. In Figure 10a, due to the increase in ac, when the tool contacted the workpiece, the crack grew horizontally towards the inside of the material and gradually turned towards the surface of the material after growing for some distance in the original direction. As shown in Figure 10b, as the tool continued to move, the crack eventually expanded to the material surface after removing the material around the crack, thus producing a large chip approximately 0.5 mm in size, a small chip, and tiny chips less than 0.05 mm in size, and forming a larger concavity on the surface. In addition, compared with Figure 9, the size of the chip and concavity increased significantly with increasing ac.
As shown in Figure 11a, the cutting action of the tool left a concavity on the surface of the material, so the tool did not come into contact with the main material at this stage when the tool continued to move in the f direction, and an “empty cut” was formed in the concavity area. When the tool movement continued, the tool cut into the material again. As shown in Figure 11b, the initial thickness at this stage was small. The cracks that were initiated afterwards could hardly grow towards the inside of the workpiece, and those grew only in the cutting direction for a small distance before the material was removed. Therefore, only tiny chips were produced at this stage. As the tool continued to move, ac increased correspondingly, as shown in Figure 11c. The crack initiation could grow to the inside of the workpiece, the crack gradually grew to the upper surface of the workpiece, the material surrounded by the crack was cut off, small chips were produced, and a small concavity was then formed on the surface of the material.
As shown in Figure 12, as the cutting action continued, ac slowly reached the original set value, the material removal was again carried out in the large block removal stage, and a large chip of approximately 0.32 mm in size and some tiny chips formed. The material removal stage entered the next cycle. This was exactly the complete process of crack initiation, crack expansion, and material removal during the graphite cutting process obtained by the FEM.
In addition, the simulation results showed that the machined surface morphology of the model changed with changes in the ac of the tool in the FEM. As shown in Figure 13, when ac increased from 0.15 mm to 0.2 mm, larger and more numerous concavities appeared on the machined surface of the model. In addition, the machined surface roughness was bound to rise with increasing ac.

3.2. Validation of FEM Results

In the previous section, the results of the analytical FEM revealed the process of crack initiation and expansion during graphite cutting until material removal. To verify the reliability of the model, orthogonal cutting experiments were then performed on graphite, and the established FEM was verified based on the morphology of the chips formed in the experiments, the machined surface morphology, and the geometric model of the graphite cutting process [28].

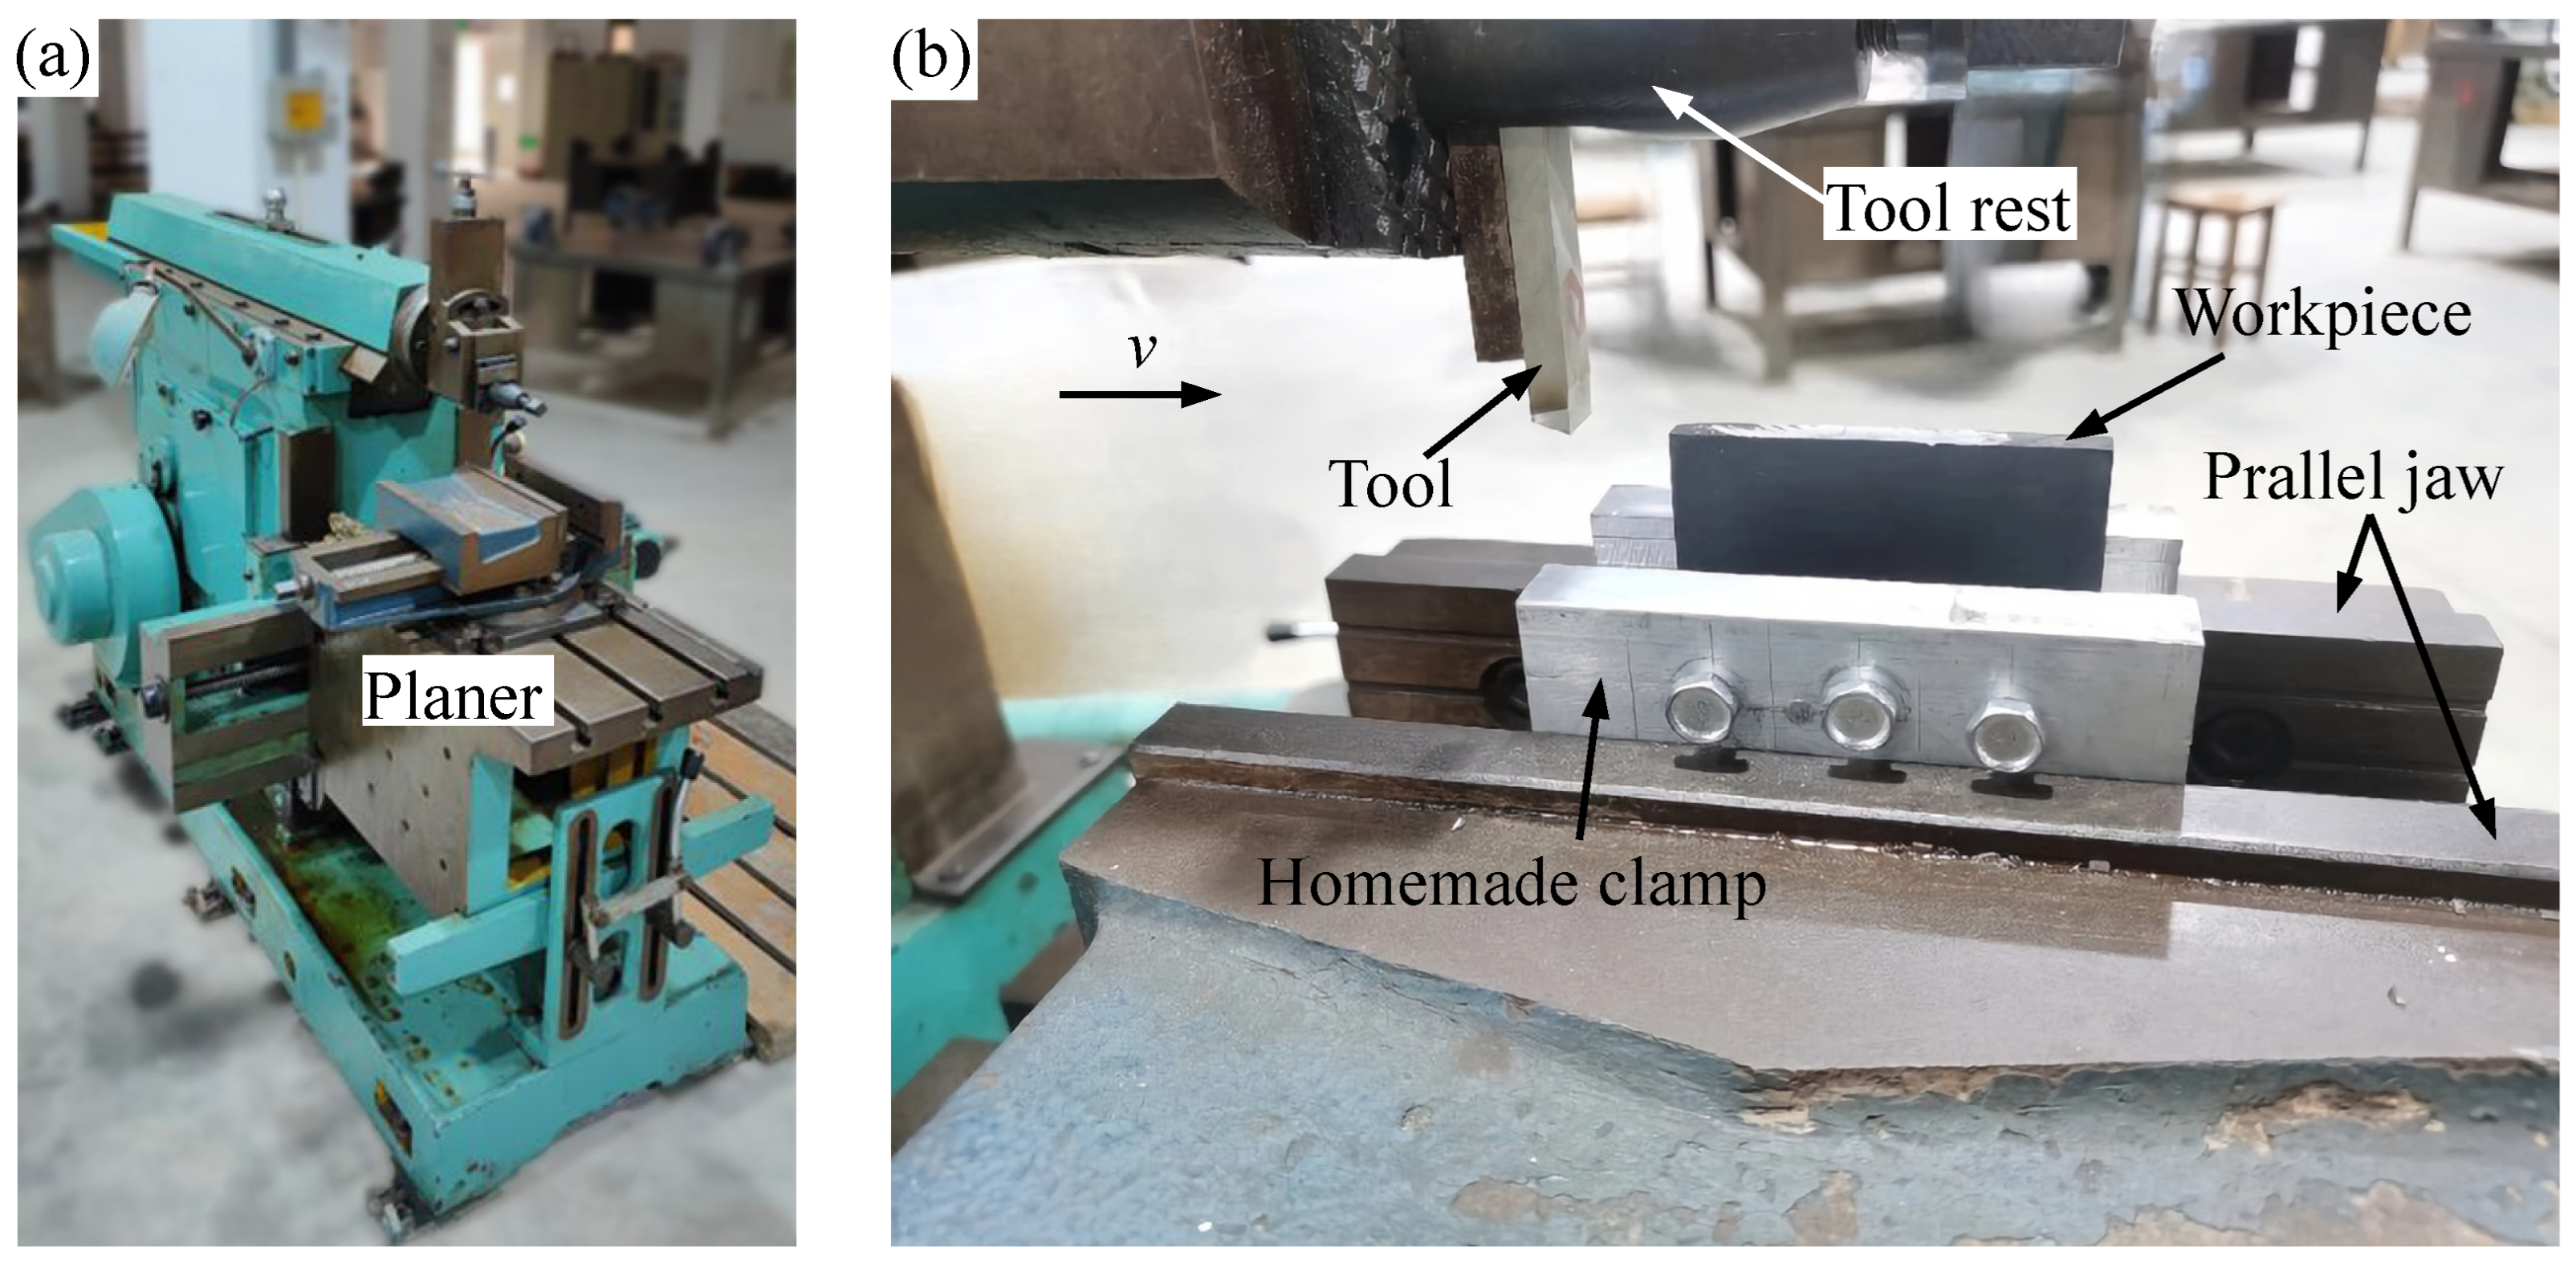
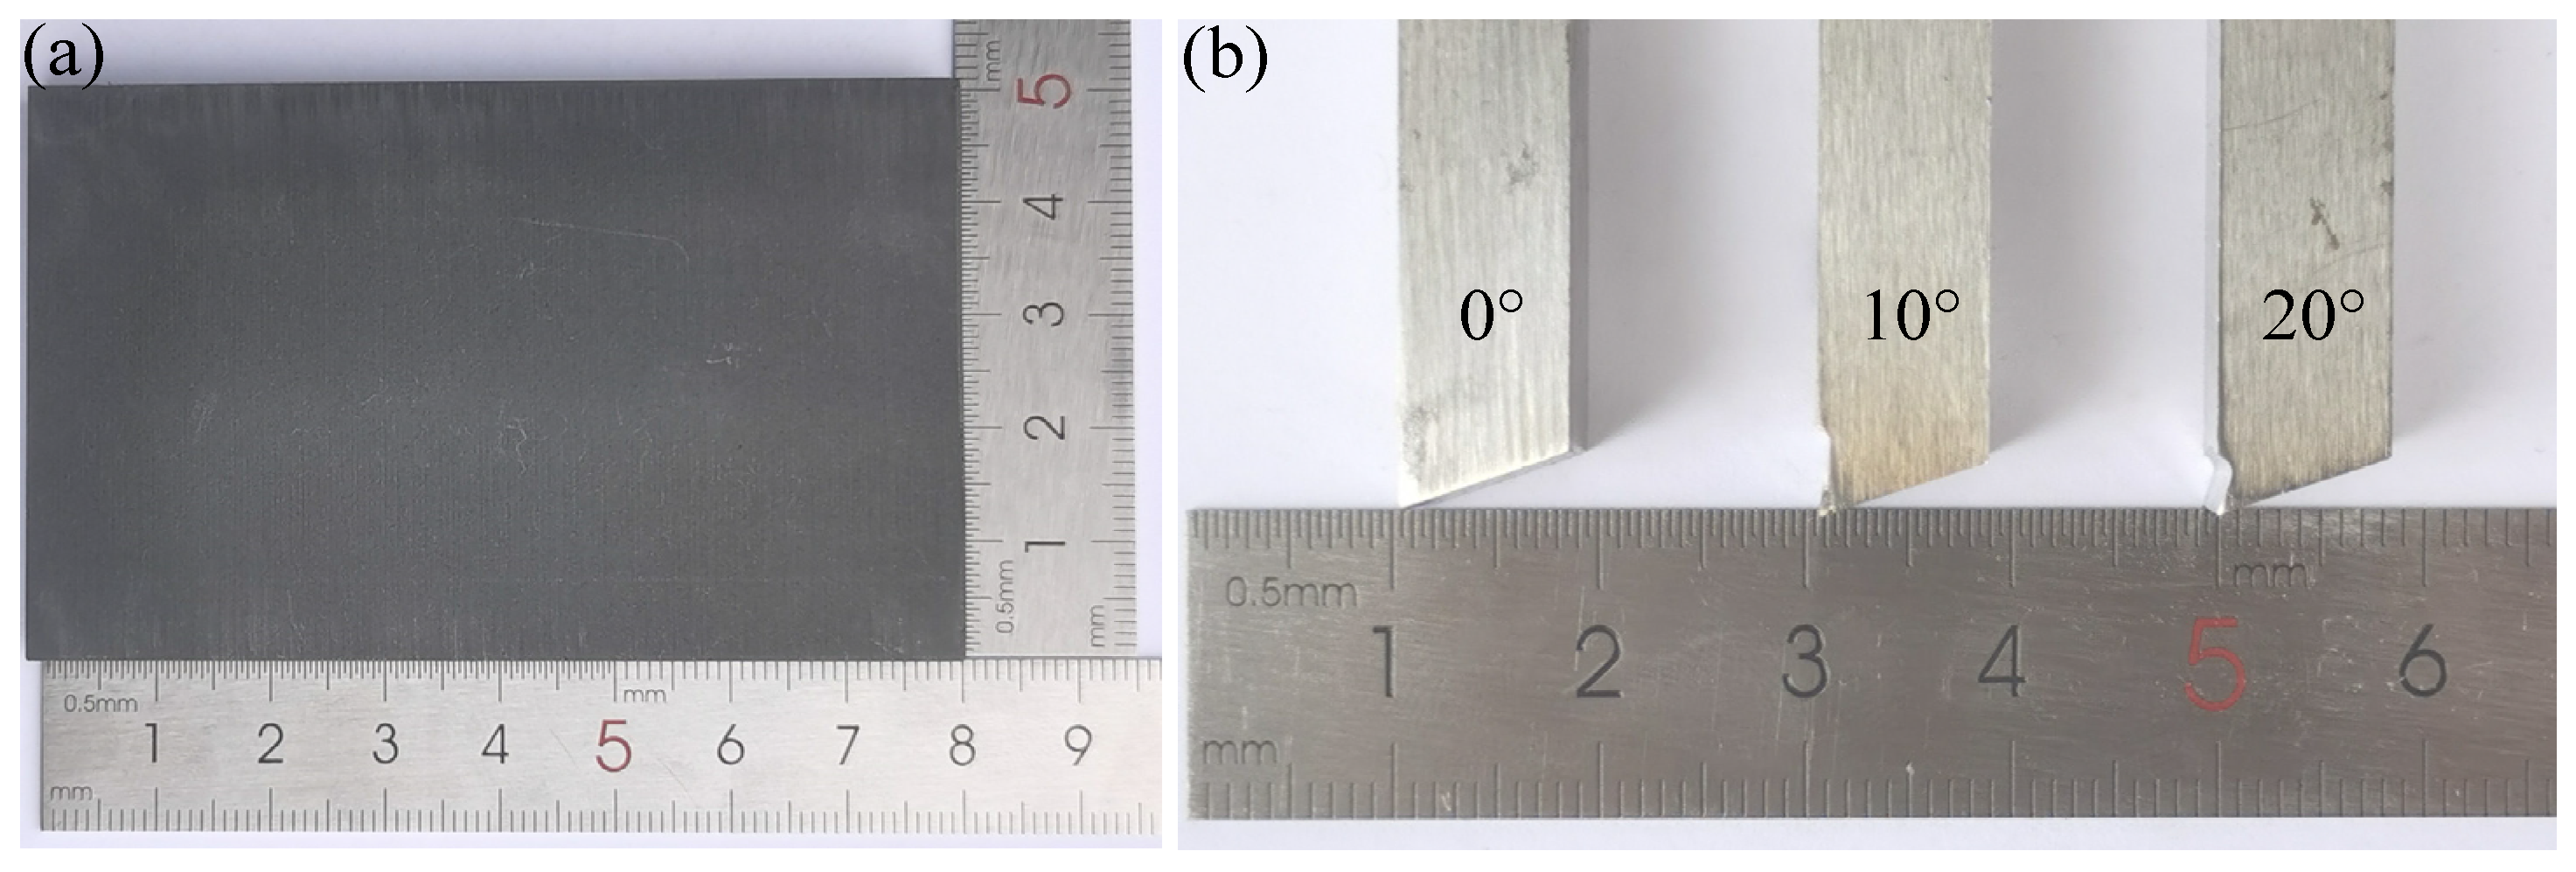
3.2.1. Experimental Work

The model was verified using orthogonal cutting experiments with graphite, as shown in Figure 14a, and the orthogonal cutting experiments were carried out on a B6066 planer. The experimental setup for orthogonal cutting is shown in Figure 14b. As shown in the figure, the graphite material was clamped onto the machine tool by an aluminium alloy fixture made in this laboratory, and the cutting atmosphere was dry.
Figure 15a shows the block graphite sample used in the cutting experiment. The mechanical properties of the material are shown in Table 1. The size of the sample used in the cutting experiment was 80 mm × 50 mm × 7 mm. Figure 15b presents the tool used in the experiment. The tool material was high-speed steel, and the values of γ were 0°, 10°, and 20°. To make the cutting parameters as consistent as possible with the results of the FEM and to include the actual conditions of the machine, ac was set to 0.15 mm, 0.3 mm, and 0.45 mm, and v was set to 3 m/min, 6 m/min, and 9 m/min. In addition, the graphite chips produced during orthogonal cutting were collected by a chip collector made in this laboratory, and their morphology was observed. Upon the completion of the cutting experiments, the morphologies of the machined surfaces of the graphite samples were also observed.

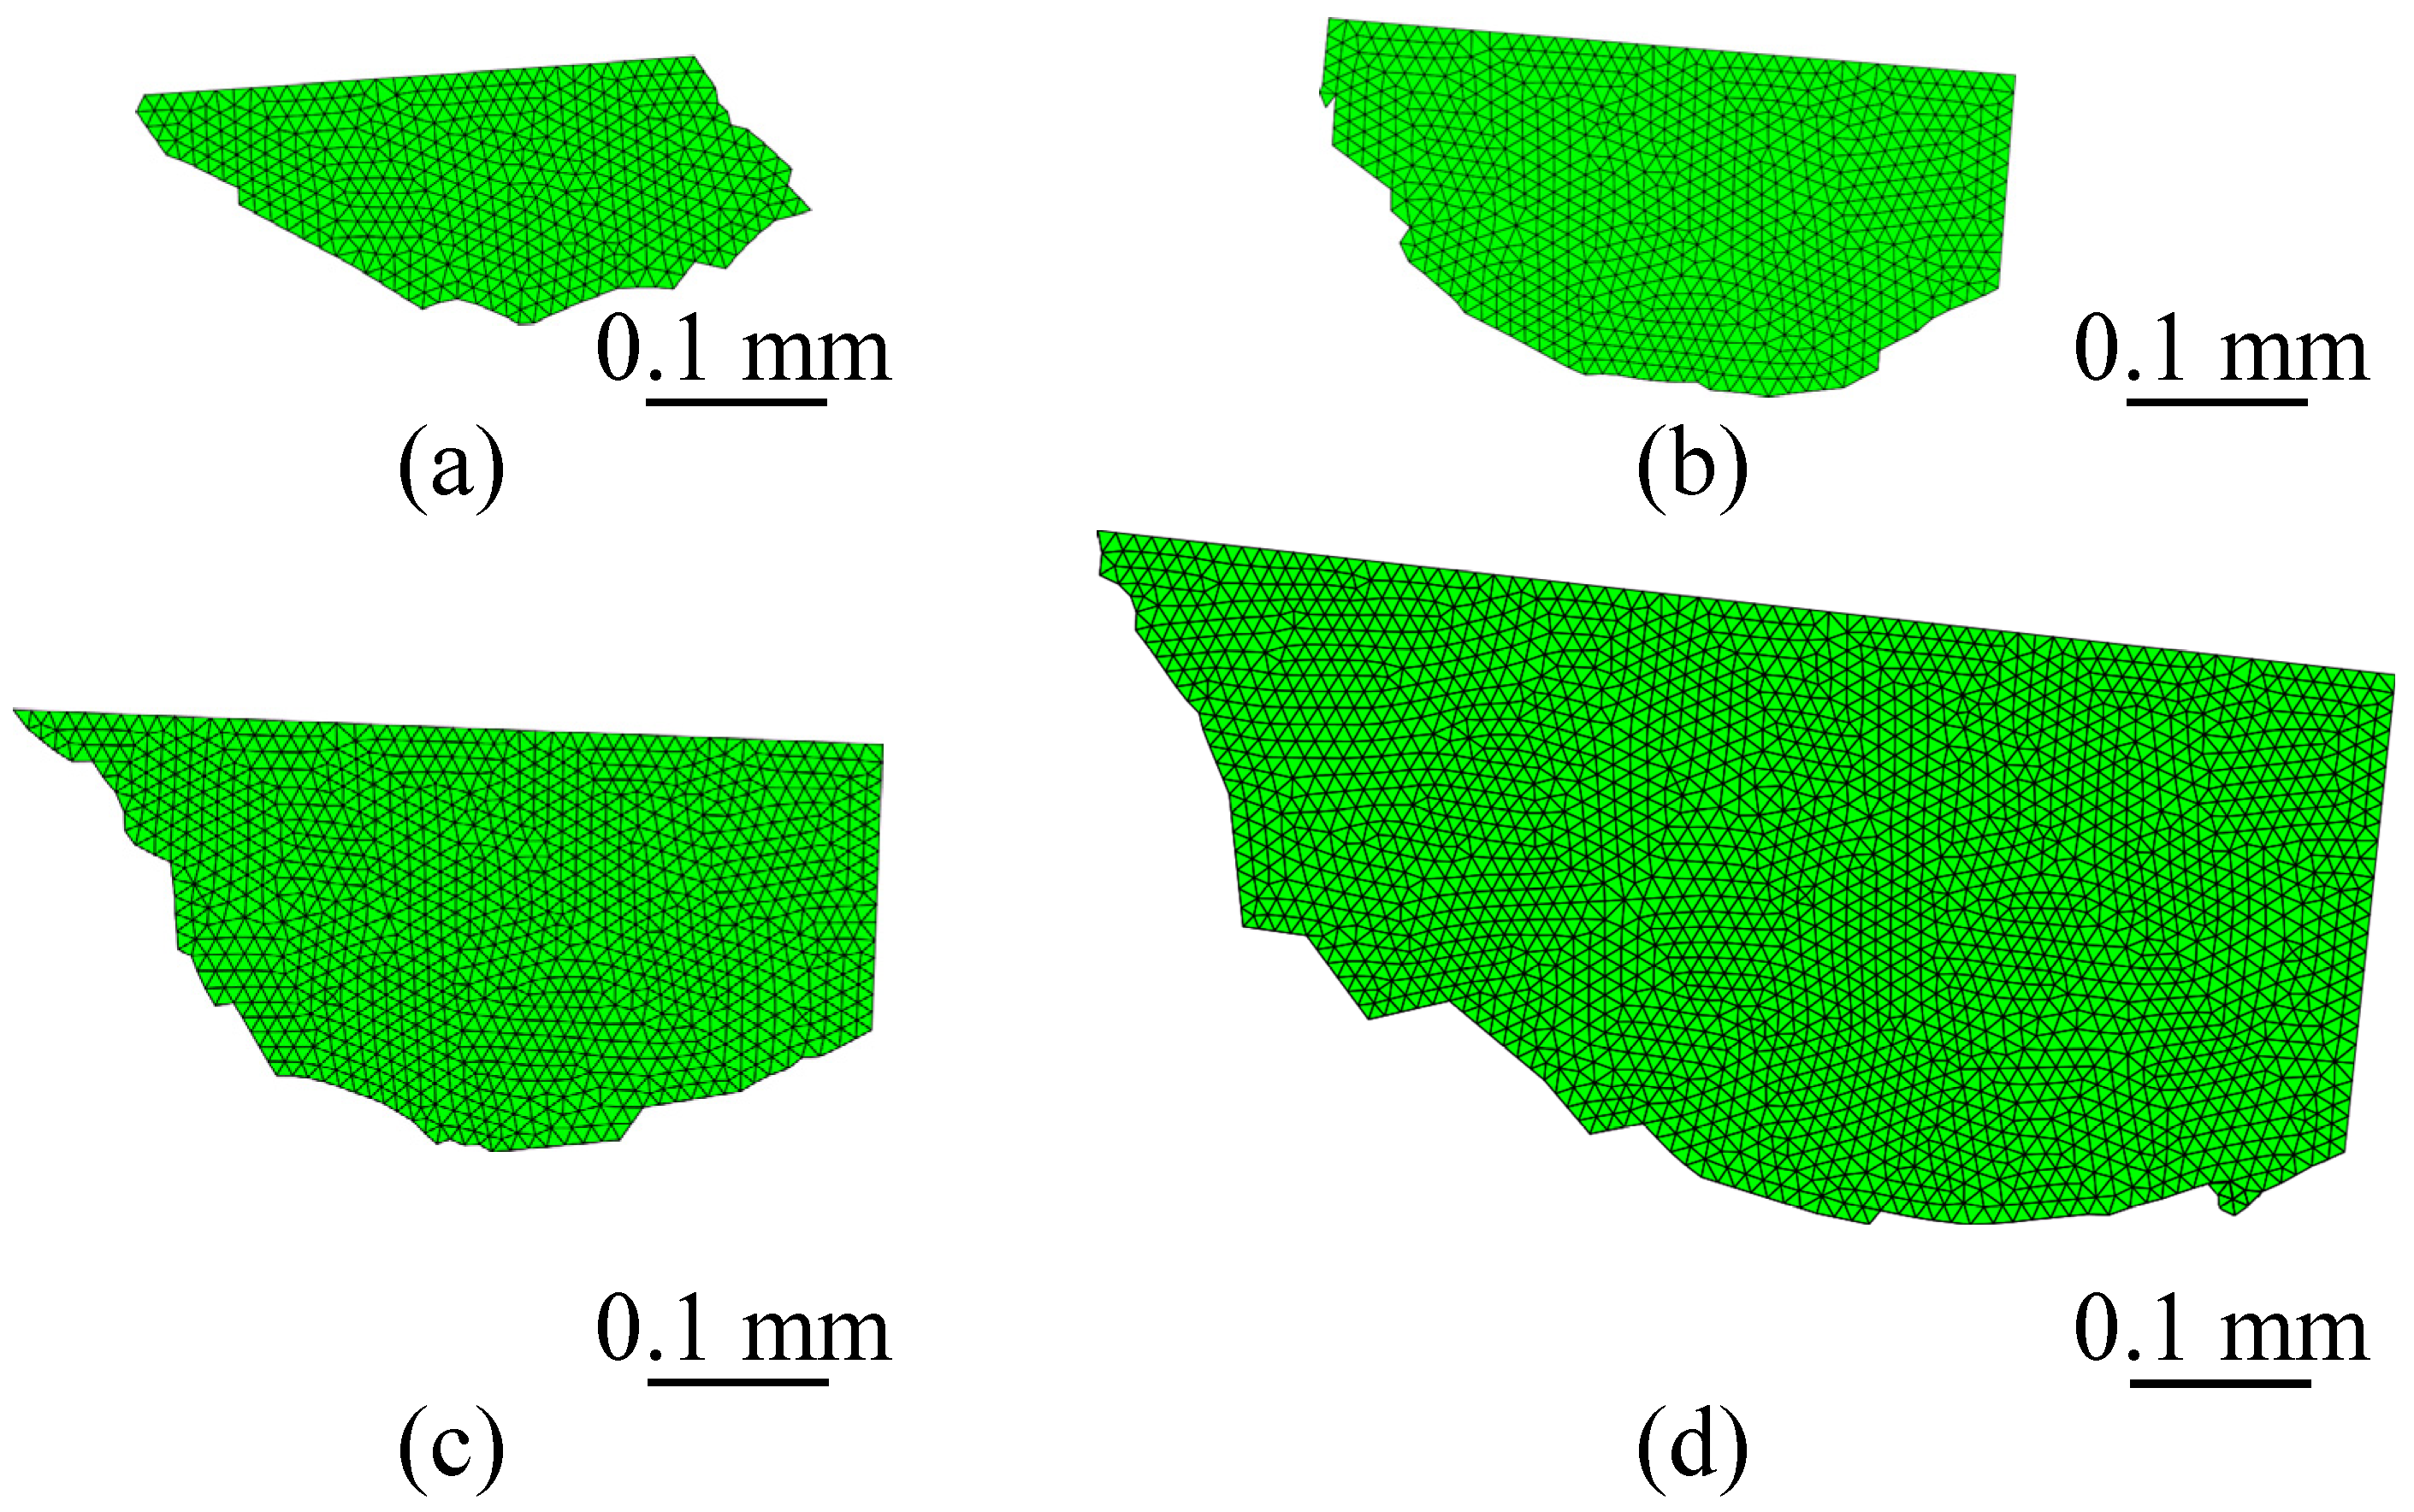
3.2.2. Validation of Chip Morphology

Figure 16a,b respectively show the chip morphologies from graphite orthogonal cutting experiments when ac was 0.15 mm and 0.45 mm. As shown in Figure 16, due to the initiation and growth of cracks, some of the chips were fragments, and many large, small, and tiny chips were included. Figure 16 also shows that as ac increased, the large chip after cutting also increased in size, which was consistent with the formulation of Zhou [20]. In addition, it could be inferred based on the observation and analysis of the chip morphology that the material was removed in large, tiny, and small blocks during the cutting process.
Figure 17a–d show the chip morphologies from the FEM simulation results when ac was 0.1 mm, 0.15 mm, 0.2 mm, and 0.3 mm. Compared with the chip morphologies obtained from the experiments, they were found to be very similar. In Figure 17, the chip morphology in the FEM simulation was also composed of large, small, and tiny pieces, and the chip size increased with increasing ac. To this point, the chip morphology effectively verified the FEM of the graphite cutting process.

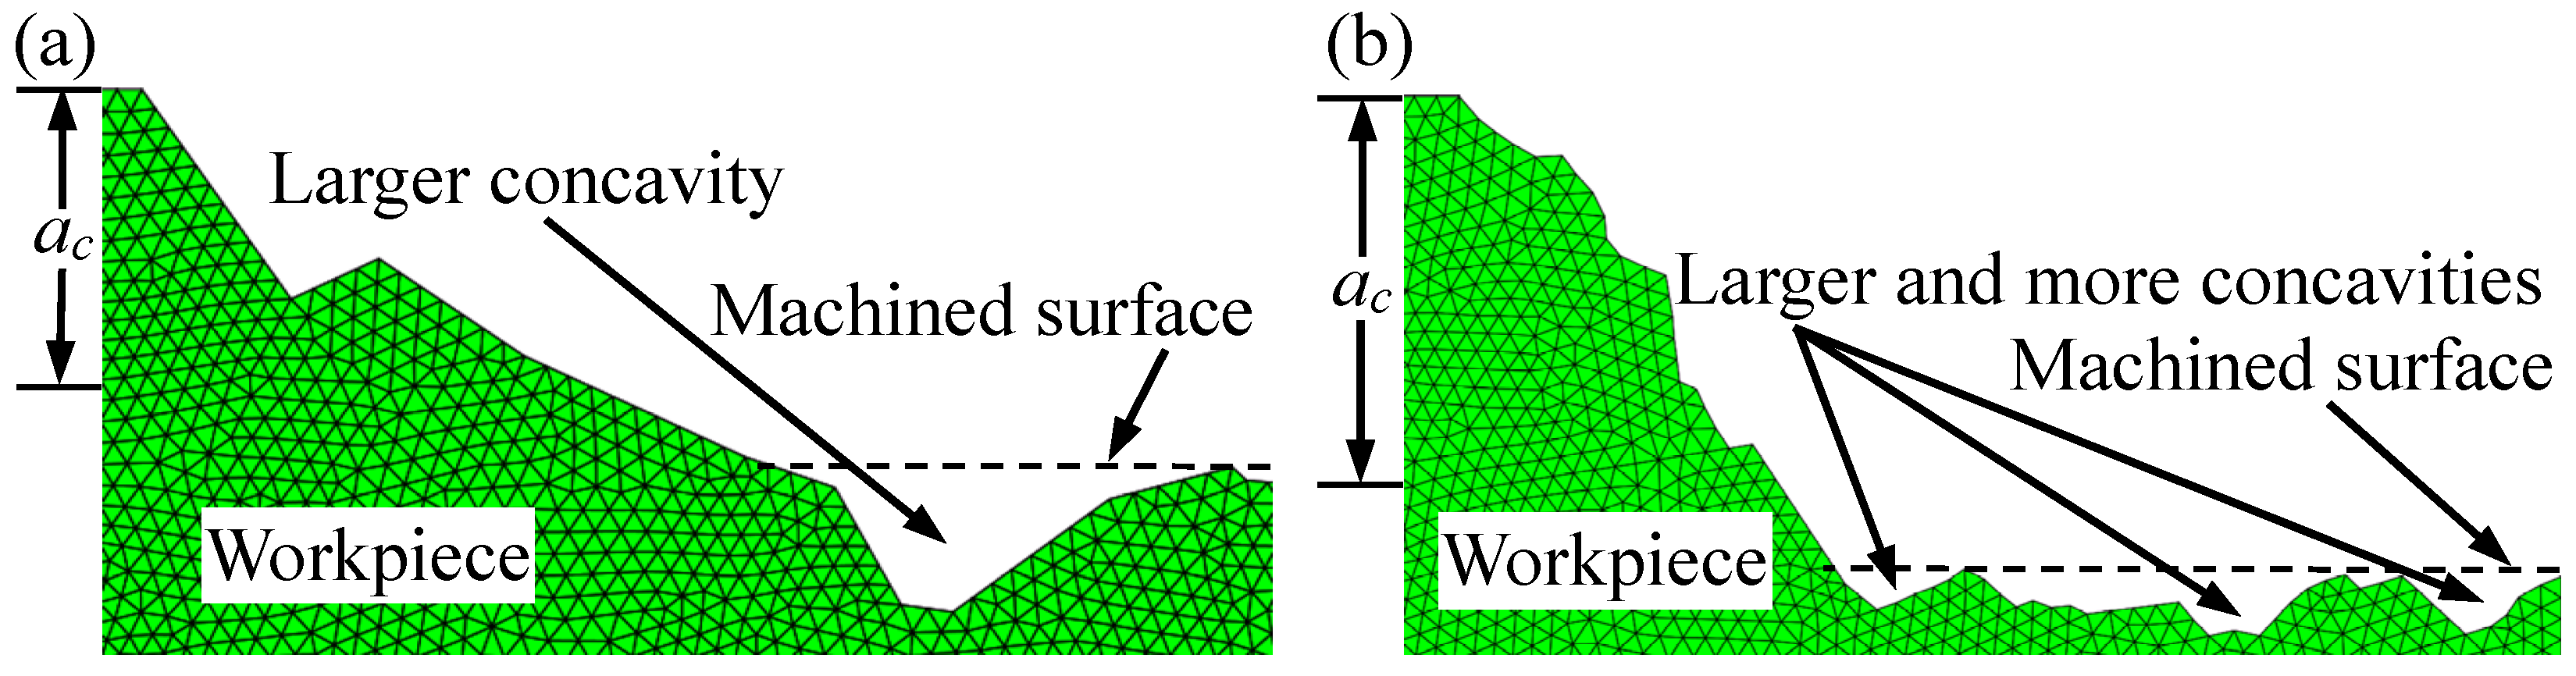
3.2.3. Validation of Machined Surface Morphology

Herein, the machined surface morphology was evaluated mainly by the concavities on the machined surface. Figure 18 shows the machined surface morphology obtained by orthogonal cutting experiments with graphite when ac was 0.15 mm, 0.3 mm, and 0.45 mm. In Figure 18a, when ac was 0.15 mm, only a few small concavities were observed on the surface of the graphite, which were caused by the small value of ac, and the cracks hardly grew inside the graphite after initiating. As shown in Figure 18b,c, as ac increased, the machined surface of the graphite consisted mainly of large concavities, followed by tiny or small concavities.
In addition, Figure 18 shows that the increase in ac during graphite cutting resulted in larger and more numerous concavities on the material surface, which was also consistent with the relationship of the machined surface roughness increasing with increasing ac, as analysed by the FEM in Section 3.1. Therefore, the composition of the machined surface profile of graphite was consistent with the FEM of graphite material cutting and machining analysed in Section 3.1. Thus far, the FEM was also strongly verified by the machined surface profile.

3.2.4. Comparison of the Model of the Graphite Cutting Process

Wan et al. [28] analysed the effective stress field during the orthogonal cutting process of graphite using the finite element method, summarized the initiation and expansion of cracks during the graphite cutting process by combining them with edge-printing experiments, and applied it to propose a geometric model of the graphite cutting process. The hereby-proposed FEM was significantly different from the modelling method proposed by Wan [28], and at the same time, this finite element modelling method was also the innovation of this paper. The results of the geometric model [28] were specified and compared with the results of the FEM as follows. As shown in Figure 19, the cutting process of graphite could be roughly divided into three stages, i.e., the large, tiny, and small block of material removal stages.
Figure 19a shows the large block removal stage of graphite with tool movement. When the tool contacted the graphite, the crack was initiated at the apex of the tool, gradually grew inside the graphite, and then turned to the upper surface of the graphite. A large block of graphite was peeled from the surface with the growth of the crack, and a concavity was formed on the graphite surface. After that, the tool remained in an “empty cut” above the concavity for a period of time.
In Figure 19b, after the “empty cut” was completed, the apex of the tool cut into the graphite again, when the actual ac was so tiny that the cracks hardly expanded towards the inside of the graphite but grew upwards for a short period before the removal of the graphite. As a result, only a tiny block graphite was removed at this stage, the machined surface might be free of concavity or have a very tiny concavity, and the machined surface was of good quality. This explained the tiny block removal stage of graphite.
From Figure 19c, the actual ac gradually increased from the bottom to the top, ac was slightly larger than that in the previous stage, and the crack growth was slightly larger than that in the previous stage, so small blocks of graphite were removed. This very stage was exactly the small block removal stage of graphite. Additionally, the concavities formed on the machined surface were larger and deeper than those in the previous stage.
Finally, as ac increased until it approached the initial ac, the whole cutting process was repeated. as shown in Figure 19d.
In summary, the comparison between the geometric model of the graphite cutting process summarized by Wan [28] and the FEM results in Section 3.1 revealed basically the same crack initiation and growth up to material removal in both models. Thus, the model of the geometric graphite cutting process proposed by Wan [28] strongly verified the FEM in this study.

4. Conclusions

In this paper, an FEM of the graphite cutting process was developed using the ABAQUS/Explicit software. Considering graphite as a typical polycrystalline brittle material, the cohesion model was thus hereby chosen as the constitutive model to characterize the mechanical properties of graphite. The present study was expected to help clarify the fundamental processes of material removal from polycrystalline brittle materials, and the following conclusions could be drawn from this study:
1. The Voronoi structure was used to characterize the polycrystalline structure of graphite materials in a model. Global insertion of cohesive cells into a model of solid cells accurately simulated the initiation and growth of cracks in graphite during the cutting process. When ac was large enough, the crack was initiated at the apex of the tool, gradually grew inside the graphite, and then turned to the upper surface of the graphite. However, when ac was tiny enough, the cracks hardly expanded towards the inside of the graphite but grew upwards for a short period.
2. The FEM provided a complete understanding of the process of material removal during graphite cutting, including the large block removal, tiny block removal, and small block removal stages, and there was a periodic cycle. Furthermore, it was found that during the large block removal stage of the material, there would exist an “empty cut”. In addition, the use of a larger ac value led to the formation of larger concavities on the machined surface.
3. The FEM was validated from three aspects, i.e., chip morphology, machined surface morphology, and the model of the graphite cutting process, and the results confirmed the accuracy of the model. This FEM could also be extended to model brittle crystalline materials.

Author Contributions

Formal analysis, methodology, project administration, and writing—review and editing were performed by D.Y.; conceptualization, investigation, software, and writing—original draft preparation were performed by F.W.; project administration and resources were performed by W.W.; software and writing—review and editing were performed by Y.Z.; writing—review and editing and project administration were performed by L.Z.; and all authors commented on previous versions of the manuscript. All authors have read and agreed to the published version of the manuscript.

Funding

This work was supported by the National Natural Science Foundation of China (No. 52165055).

Data Availability Statement

All data used to support the findings of this study are included within the article.

Acknowledgments

This work was supported by the School of Mechanical and Automotive Engineering, Guangxi University of Science and Technology.

Conflicts of Interest

The authors declare no conflict of interest.

References

  1. Liu, Y.-H.; Ma, Z.-K.; He, Y.; Wang, Y.; Zhang, X.-W.; Song, H.-H.; Li, C.-X. A review of fibrous graphite materials: Graphite whiskers, columnar carbons with a cone-shaped top, and needle- and rods-like polyhedral crystals. New Carbon Mater. 2023, 38, 18–35. [Google Scholar] [CrossRef]
  2. Wang, H.; Feng, Q.; Tang, X.; Liu, K. Preparation of high-purity graphite from a fine microcrystalline graphite concentrate: Effect of alkali roasting pre-treatment and acid leaching process. Sep. Sci. Technol. 2016, 51, 2465–2472. [Google Scholar] [CrossRef]
  3. Aliyeva, S.; Alosmanov, R.; Buniyatzadeh, I.; Azizov, A.; Maharramov, A. Recent developments in edge-selective functionalization of surface of graphite and derivatives—A review. Soft. Mater. 2019, 17, 448–466. [Google Scholar] [CrossRef]
  4. Kausar, A.; Anwar, S. Graphite Filler-Based Nanocomposites with Thermoplastic Polymers: A Review. Polym. Plast. Technol. Eng. 2017, 57, 565–580. [Google Scholar] [CrossRef]
  5. Zhao, L.; Tang, J.; Zhou, M.; Shen, K. A review of the coefficient of thermal expansion and thermal conductivity of graphite. New Carbon Mater. 2022, 37, 544–555. [Google Scholar] [CrossRef]
  6. Wang, W.; Yang, D.; Wang, R.; Wei, F.; Liu, M. The Optimization of Machining Parameters on Cutting Force during Orthogonal Cutting of Graphite/Polymer Composites. Processes 2022, 10, 2096. [Google Scholar] [CrossRef]
  7. Sergeeva, L.V. Study of the SSS of graphite lining elements of nuclear reactors with account for the anisotropy of graphite. Russ. Eng. Res. 2007, 27, 413–416. [Google Scholar] [CrossRef]
  8. Venu Gopal, A.; Venkateswara Rao, P. Performance Improvement of Grinding of SiC Using Graphite as a Solid Lubricant. Mater. Manuf. Process. 2004, 19, 177–186. [Google Scholar] [CrossRef]
  9. Wang, Q.; Li, Y.; Sang, S.; Jin, S. Effect of the reactivity and porous structure of expanded graphite (EG) on microstructure and properties of Al2O3–C refractories. J. Alloys Compd. 2015, 645, 388–397. [Google Scholar] [CrossRef]
  10. Jeon, I.-Y.; Ju, M.J.; Xu, J.; Choi, H.-J.; Seo, J.-M.; Kim, M.-J.; Choi, I.T.; Kim, H.M.; Kim, J.C.; Lee, J.-J.; et al. Edge-Fluorinated Graphene Nanoplatelets as High Performance Electrodes for Dye-Sensitized Solar Cells and Lithium Ion Batteries. Adv. Funct. Mater. 2015, 25, 1170–1179. [Google Scholar] [CrossRef]
  11. Hong, J.; Ahn, S.-H.; Jeong, H.-Y.; Joung, C.-Y. Development of graphite sealing technique for an irradiation test rig of nuclear fuels. Int. J. Precis. Eng. Manuf. 2013, 14, 797–803. [Google Scholar] [CrossRef]
  12. Schroeter, R.B.; Kratochvil, R.; Gomes, J.d.O. High-speed finishing milling of industrial graphite electrodes. J. Mater. Process. Technol. 2006, 179, 128–132. [Google Scholar] [CrossRef]
  13. Berto, F.; Lazzarin, P.; Ayatollahi, M.R. Brittle fracture of sharp and blunt V-notches in isostatic graphite under pure compression loading. Carbon 2013, 63, 101–116. [Google Scholar] [CrossRef]
  14. Huo, D.; Lin, C.; Dalgarno, K. An experimental investigation on micro machining of fine-grained graphite. Int. J. Adv. Manuf. Technol. 2014, 72, 943–953. [Google Scholar] [CrossRef]
  15. Tang, Y.; Chen, H. Characterization on crack propagation of nuclear graphite under three-point bending. Nucl. Mater. Energy 2019, 20, 100687. [Google Scholar] [CrossRef]
  16. Tang, Y.X.; Su, R.K.L.; Chen, H.N. Energy dissipation during fracturing process of nuclear graphite based on cohesive crack model. Eng. Fract. Mech. 2021, 242, 107426. [Google Scholar] [CrossRef]
  17. Bajpai, V.; Singh, R.K. Orthogonal Micro-Grooving of Anisotropic Pyrolytic Carbon. Mater. Manuf. Process. 2011, 26, 1481–1493. [Google Scholar] [CrossRef]
  18. Wang, J.; Fang, F.; Li, L. Cutting of Graphite at Atomic and Close-to-Atomic Scale Using Flexible Enhanced Molecular Dynamics. Nanomanuf. Metrol. 2022, 5, 240–249. [Google Scholar] [CrossRef]
  19. Mijušković, G.; Cica, D. Investigation, modeling, and optimization of surface roughness in micro-milling of graphite electrodes. Int. J. Adv. Manuf. Technol. 2021, 117, 579–590. [Google Scholar] [CrossRef]
  20. Zhou, L.; Wang, C.Y.; Qin, Z. Investigation of Chip Formation Characteristics in Orthogonal Cutting of Graphite. Mater. Manuf. Process. 2009, 24, 1365–1372. [Google Scholar] [CrossRef]
  21. Zheng, Z.; Huang, K.; Lin, C.; Zhang, J.; Wang, K.; Sun, P.; Xu, J. An analytical force and energy model for ductile-brittle transition in ultra-precision grinding of brittle materials. Int. J. Mech. Sci. 2022, 220, 107107. [Google Scholar] [CrossRef]
  22. Zhang, C.; Liang, Y.; Zhang, T.; Chen, X.; Zhao, J.; Yu, T. Study on machining BK7 optical glass by ultrasonic vibration-assisted polishing considering the micro-contact state of the abrasive particles with the workpiece. J. Manuf. Process. 2021, 72, 469–482. [Google Scholar] [CrossRef]
  23. Ma, L.; He, P.; Deng, H.; Liu, T.; Tan, Y.; Zhou, Y. Theoretical model of characteristic temperature and continuous fracture mechanism of brittle material in the process of turning fluorophlogopite ceramics. Ceram Int. 2019, 45, 12521–12527. [Google Scholar] [CrossRef]
  24. Meng, F.; Zhang, Z.; Feng, J.; Gu, Q.; Wu, B.; Wang, J. A study investigating the cutting mechanism of compacted graphite iron based on a novel microstructure of finite element model. J. Manuf. Process. 2022, 81, 250–260. [Google Scholar] [CrossRef]
  25. Chen, H.H.N.; Su, R.K.L.; Fok, S.L.; Zhang, H.G. Fracture behavior of nuclear graphite under three-point bending tests. Eng. Fract. Mech. 2017, 186, 143–157. [Google Scholar] [CrossRef]
  26. Yu, Z.; Zhang, J.; Shen, J.; Chen, H. Simulation of crack propagation behavior of nuclear graphite by using XFEM, VCCT and CZM methods. Nucl. Mater. Energy 2021, 29, 101063. [Google Scholar] [CrossRef]
  27. Bajpai, V.; Singh, R.K. Finite element modeling of orthogonal micromachining of anisotropic pyrolytic carbon via damaged plasticity. Precis. Eng. 2014, 38, 300–310. [Google Scholar] [CrossRef]
  28. Wan, Z.; Yang, D.; Lu, L.; Wu, J.; Tang, Y. Mechanism of material removal during orthogonal cutting of graphite/polymer composites. Int. J. Adv. Manuf. Technol. 2015, 82, 1815–1821. [Google Scholar] [CrossRef]
  29. Gao, M.; Zhang, K.; Zhou, Q.; Zhou, H.; Liu, B.; Zheng, G. Numerical investigations on the effect of ultra-high cutting speed on the cutting heat and rock-breaking performance of a single cutter. J. Pet. Sci. Eng. 2020, 190, 107120. [Google Scholar] [CrossRef]
  30. Keskin, İ.; Yadgar Ahmed, M.; Ramadhan Taher, N.; Gör, M.; Zrar Abdulsamad, B. An evaluation on effects of surface explosion on underground tunnel; availability of ABAQUS Finite element method. Tunn. Undergr. Space Technol. 2022, 120, 104306. [Google Scholar] [CrossRef]
  31. Mitic, V.V.; Paunovic, V.; Jankovic, S.; Pavlovic, V.; Antolovic, I.; Rancic, D. Electronic ceramic structure within the Voronoi cells model and microstructure fractals contacts surfaces new frontier applications. Sci. Sinter. 2013, 45, 223–232. [Google Scholar] [CrossRef]
  32. Dong, P. Generating and updating multiplicatively weighted Voronoi diagrams for point, line and polygon features in GIS. Comput. Geosci. 2008, 34, 411–421. [Google Scholar] [CrossRef]
  33. Huang, X.; Ding, W.; Zhu, Y.; Yang, C. Crack propagation simulation of polycrystalline cubic boron nitride abrasive materials based on cohesive element method. Comput. Mater. Sci. 2017, 138, 302–314. [Google Scholar] [CrossRef]
  34. Wang, D.; Zhao, J.; Zhou, Y.; Chen, X.; Li, A.; Gong, Z. Extended finite element modeling of crack propagation in ceramic tool materials by considering the microstructural features. Comput. Mater. Sci. 2013, 77, 236–244. [Google Scholar] [CrossRef]
  35. Habibi, M.; Darabi, R.; Sa, J.C.d.; Reis, A. An innovation in finite element simulation via crystal plasticity assessment of grain morphology effect on sheet metal formability. Proc. Inst. Mech. Eng. Part L J. Mater. Des. Appl. 2021, 235, 1937–1951. [Google Scholar] [CrossRef]
  36. Wang, Z.; Yang, S.; Li, L.; Tang, Y.; Xu, G. A 3D Voronoi clump based model for simulating failure behavior of brittle rock. Eng. Fract. Mech. 2021, 248, 107720. [Google Scholar] [CrossRef]
  37. Esmaili, A.; Taheri-Behrooz, F. Effect of cohesive zone length on the delamination growth of the composite laminates under cyclic loading. Eng. Fract. Mech. 2020, 237, 107246. [Google Scholar] [CrossRef]
  38. Yang, Z.J.; Su, X.T.; Chen, J.F.; Liu, G.H. Monte Carlo simulation of complex cohesive fracture in random heterogeneous quasi-brittle materials. Int. J. Solids Struct. 2009, 46, 3222–3234. [Google Scholar] [CrossRef]
Figure 1. Schematic diagram of the orthogonal cutting model.
Processes 11 02546 g001
Figure 2. Tensile experiments: (a) graphite standard sample; (b) experimental device.
Processes 11 02546 g002
Figure 3. Schematic diagram of the Voronoi area.
Processes 11 02546 g003
Figure 4. FEM of the workpiece: (a) internal structure of the material; (b) mesh of the workpiece.
Processes 11 02546 g004
Figure 5. Assembly diagram of the graphite cutting model (Tool: γ = 10°, r = 20 μm).
Processes 11 02546 g005
Figure 6. Two types of cracks in a two-dimensional problem of fracture mechanics.
Processes 11 02546 g006
Figure 7. Linear softening laws for the cohesive elements: (a) tnδn curve in the normal direction; (b) tsδs curve in the tangential direction.
Processes 11 02546 g007
Figure 8. The geometric boundary conditions of the workpiece.
Processes 11 02546 g008
Figure 9. Cutting process at ac = 0.1 mm, v = 3 m/min, γ = 10°, r = 20 μm: (a) tool contact with workpiece; (b) large block removal stage.
Processes 11 02546 g009
Figure 10. Cutting process at ac = 0.2 mm, v = 3 m/min, γ = 10°, r = 20 μm: (a) tool contact with workpiece; (b) large block removal stage.
Processes 11 02546 g010
Figure 11. Cutting process at ac = 0.1 mm, v = 3 m/min, γ = 10°, r = 20 μm: (a) empty cut; (b) tiny block removal stage of the material; (c) small block removal stage of the material.
Processes 11 02546 g011
Figure 12. Next removal stage in the cutting process at ac = 0.1 mm, v = 3 m/min, γ = 10°, r = 20 μm.
Processes 11 02546 g012
Figure 13. Machined surface morphologies of different ac values: v = 3 m/min, γ = 10°, r = 20 μm, (a) ac = 0.15 mm; (b) ac = 0.2 mm.
Processes 11 02546 g013
Figure 14. Graphite cutting experimental device: (a) B6066 planer; (b) clamping method.
Processes 11 02546 g014
Figure 15. Graphite sample (a) and tool (b) used for experiments.
Processes 11 02546 g015
Figure 16. Chip morphologies for different ac values from experiments: v = 3 m/min, γ = 10°, (a) ac = 0.15 mm; (b) ac = 0.45 mm.
Processes 11 02546 g016
Figure 17. Chip morphologies of different values of ac from the FEM: v = 3 m/min, γ = 10°, r = 20 μm, (a) ac = 0.1 mm; (b) ac = 0.15 mm; (c) ac = 0.2 mm; (d) ac = 0.3 mm.
Processes 11 02546 g017
Figure 18. Machined surface morphology at v = 3 m/min, γ = 10°, (a) ac = 0.15 mm; (b) ac = 0.3 mm; (c) ac = 0.45 mm.
Processes 11 02546 g018
Figure 19. Comparison of geometric model of the graphite cutting process [28] with the FEM: (a) large block removal stage; (b) tiny block removal stage; (c) small block removal stage; (d) next cutting cycle.
Processes 11 02546 g019
Table 1. Mechanical properties of graphite.
DensityTensile StrengthCompression StrengthModulus of ElasticityPorosity
1.9 g/cm315.9 Mpa107.2 Mpa20.4 Gpa0.5%
Disclaimer/Publisher’s Note: The statements, opinions and data contained in all publications are solely those of the individual author(s) and contributor(s) and not of MDPI and/or the editor(s). MDPI and/or the editor(s) disclaim responsibility for any injury to people or property resulting from any ideas, methods, instructions or products referred to in the content.

