Abstract
Rapid-cycle pressure swing adsorption (PSA) with small adsorbents particles is intended to improve mass transfer rate and productivity. However, the mass transfer mechanisms are changed with reduction of particle size during rapid-cycle adsorption process. A heat and mass transfer model of rapid-cycle PSA air separation process employing small LiLSX zeolite particles is developed and experimentally validated to numerically analyze the effects of mass transfer resistances on the characteristics of cyclic adsorption process. Multicomponent Langmuir model and linear driving force model are employed for characterizing the adsorption equilibrium and kinetic. The results of numerical analysis demonstrate that the dominant mass transfer resistance of small adsorbents particles is a combination of film resistance, axial dispersion effect and macropore diffusion resistance. The oxygen purity, recovery and productivity of the product are overestimated by ~2–4% when the effect of axial dispersion on mass transfer is ignored. As particle size decreases, the front of nitrogen-adsorbed concentration and gas temperature become sharp, which effectively improves the performance. However, the adverse effect of axial dispersion on the mass transfer becomes significant at very small particles conditions. It is nearly identical shapes of nitrogen concentration and gas temperature profiles after adsorption and desorption steps. The profiles are pushed forward near the production end with an increase in bed porosities. The optimal oxygen recovery and productivity are achieved with a particle diameter of 0.45 mm and bed porosity of 0.39 during the PSA process.
1. Introduction
One common application of pressure swing adsorption (PSA) air separation technology is as a oxygen concentrator, which directly produces ~93% O2 from compressed air [1,2]. The oxygen concentrator plays a significant role in medical treatments and oxygen conditioning of indoor environments, due to its advantages of high purity, cost-effective investment and high operational flexibility [3,4,5]. The development of miniature oxygen concentrators for use in individual patient oxygen therapy soon followed the introduction of industrial PSA oxygen production from air [2]. The small-scale concentrator traditionally includes two adsorption beds packing with 5A or LiX zeolite pellets of 0.3~1 mm diameter. Nitrogen from air is adsorbed in one bed during adsorption step, and nitrogen adsorbed from adsorbents is desorbed in another bed during the desorption step of the PSA process.
Rapid cycle (total cycle time ≤ 10 s) PSA (RCPSA) employing adsorbents with small LiLSX zeolite particles (~0.5 mm in diameter) is particularly suitable for a small-scale oxygen concentrator, since rapid cycle permits the bed to be operated more frequently and therefore enhances the productivity [6,7,8,9,10]. Qadir et al. [10] experimentally and numerically analyzed the dynamic breakthrough profiles and separation performance of two-bed RCPSA-based oxygen concentrator, and high productivity of 370 L·(h·kg)−1 with oxygen recovery of 40% is achieved though the enhanced process with adsorption pressure of 350 kPa.
Although the diameter reduction of zeolite particle is intended to decrease the resistance of macropore diffusion and improve the adsorption rate, the mass transfer process becomes complicated with the reduction of particle size [11,12,13,14]. The dominant resistance of mass transfer for the RCPSA process is no longer macropore diffusional resistance, but the effect of axial dispersion and film resistance becomes significant to limit the mass transfer rate [11,12,13]. Zhong et al. [11] numerically studied the influence of particle diameter and axial dispersion effect on process performance. Rao and Farooq [15] came to a similar result on the effect of axial dispersion on the PSA process using very small adsorbent particles (5A with diameter of 63–75 µm). Zhu et al. [7] analyzed the influence of mass transfer models on the PSA air separation performance. There is a satisfactory agreement between the model and experimental results of product recovery and productivity when the film resistance, macropore diffusional resistance and axial dispersion effect are determined as the dominant resistance for small LiLSX particles.
Effective design of oxygen concentrator requires preferable understanding of the mass and heat transfer characteristics which take place in the adsorption bed. The mass, heat transfer and oxygen production performance of the PSA process with variations of adsorbents and operating conditions has been extensively investigated in the literature. Zhang et al. [4] experimentally studied the individual effects and process improvement strategy on the oxygen production performance of a four-step PSA process at wide product flowrate conditions. It was suggested that the negative effects of excess oxygen adsorption at lower oxygen flow rates and of N2 breakthrough at higher oxygen flow rates on the process performance may be weakened or eliminated by adjusting the purge flow rate, feed flowrate and adsorption pressure. Zheng et al. [16] developed a two-dimensional PSA model of two-bed air separation process using LiX zeolites to investigate the mass and heat transfer characteristic occurring inside the adsorption bed. The simulation results clearly showed the maldistribution of velocity and concentration induced by the nonuniform packing of adsorbents. Ogawa et al. [17] numerically examined the O2 concentration and gas-zeolite temperatures in two zeolite columns of four-step PSA based oxygen concentrator. The spatial distributions of velocity, concentration and temperature in each of the four steps of the PSA process were obtained.
However, most of the above studies use the simple assumption of mass transfer rate solely controlled with macropore diffusion for small LiLSX particles, which induces significant inaccuracies when numerically predicting the separation performance [7]. The assumption of macropore diffusion is recognized as the dominant mass transfer resistance and traditionally provides a reasonable performance estimation for adsorption involving large zeolite particles [13,16,18,19,20,21,22]. Rumbo Morales et al. [19,20] conducted a parametric study of PSA using a lumped mass transfer model (comprising film resistance, macropore diffusion and micro-pore diffusion) for small particles and the simulation result provided a reasonable prediction of performance. Obviously, other sources of mass transfer zone spreading external to the particle, like the effect of axial dispersion, film resistance and pressure drop, become significant for beds packed with small adsorbent particles. Moran et al. [13,18] investigated the effect of axial dispersion and pressure drop on the mass transfer characteristic and oxygen production performance of PSA process with small zeolite particles. The result experimentally demonstrated that the effect of pressure drop was minimal, but the effect of axial dispersion on the mass transfer rate was remarkable and accounted for ~ 48% of the overall resistance. Therefore, it is necessary to check the effects of various resistances on the kinetics and performance of the adsorption process for small adsorbent particles. This work presents a mass and heat transfer simulation of the adsorption bed during the RCPSA air separation process, employing a commercial zeolite sample with particle diameter of ~0.5 mm to conduct an accurate analysis of the effects of various resistances on the kinetics of the adsorption process. We determine the individual effect of various resistances on mass and transfer characteristic of beds with small adsorbent particles and how to recognize the effect of axial dispersion in PSA simulations. Based on the different controlling model of mass transfer rate, the governing equations of cyclic adsorption process is numerically solved to investigate the gas concentration, temperature and process performance under various mass transfer resistance conditions. Meanwhile, the contributions of film resistance and axial dispersion effect for mass transfer become significant with variation in particle dimeter and bed porosity. The influences of particle size and bed porosity on the distributions of gas concentration and temperature and oxygen production performance are comparatively investigated though conducting numerical simulation. The result will provide a basis for O2 separation from compressed air using PSA technology.
2. Mathematical Models
2.1. Governing Equations
The assumptions of the model employed to simulate the mass, heat transfer and performance of the RCPSA oxygen production process are as follows: (1) air is regarded as ideal gas; (2) the feed composition is approximated as a gas mixture of N2 and O2 with ratio of 79:21 [16,17,23]; (3) radial gradients of concentration and temperature are negligible; (4) it is necessary to have a uniform particle diameter for adsorbents and adsorption bed porosity; (5) multicomponent Langmuir isotherm could be described as the adsorption equilibrium [24]; (6) linear driving force (LDF) model is employed to characterize the rate of mass transfer between gas and solid phase [25]; (7) the pressure drop is controlled by Ergun’s equation [26]; (8) the heat conduction of the bed wall and heat transfer resistance of the wall external convection are negligible.
According to the above assumptions, the equations for the PSA process can be written as follows:
Mass balance for gas component: [27]
where the variable i represents the component of air (i = 1 for O2, i = 2 for N2) for simplifying the model.
The LDF model for gas component i: [25]
where the coefficient of mass transfer ki can be estimated employing the models shown in Table 1.
Table 1.
Mass transfer resistance for three cases.
Three cases are employed for examining the influence of different mass transfer resistances since the dominant resistance of mass transfer is no longer macropore diffusion resistance for the small zeolite particles frequently employed in RCPSA process [12,13]. The resistance of macropore diffusion is solely considered the dominant resistance for case 1 and the combination of macropore diffusion and film resistance is assumed as the dominant resistance for case 2. However, case 3 regards the combination of film resistance, macropore diffusion resistance and axial dispersion effect as the dominant resistance for small LiLSX particles. Notably, a plug flow model replaces Equation (1) for case 3 since the effect of axial dispersion is added through an overall mass transfer coefficient in Equation (2) [13].
Multicomponent Langmuir isotherm [24]:
Heat balance for gas phase:
The heat transfer coefficient of gas and solid hf and the heat transfer coefficient of internal convective gas–wall hw are determined from the Nusselt number Nu (=hdin/Kf) by the following model. The heat transfer coefficient of gas–solid hf is in the presence of axial dispersion effect [28]:
Internal convective gas and wall heat transfer coefficient hw [29]:
Solid phase-heat balance:
The adsorption heat for N2 and O2 at an adsorbate loading of qi* is determined [30]:
Pressure drop is calculated [26]:
2.2. Model Parameters
The model parameters employed in the PSA simulations are summarized in Table 2 [7].
Table 2.
Model parameters.
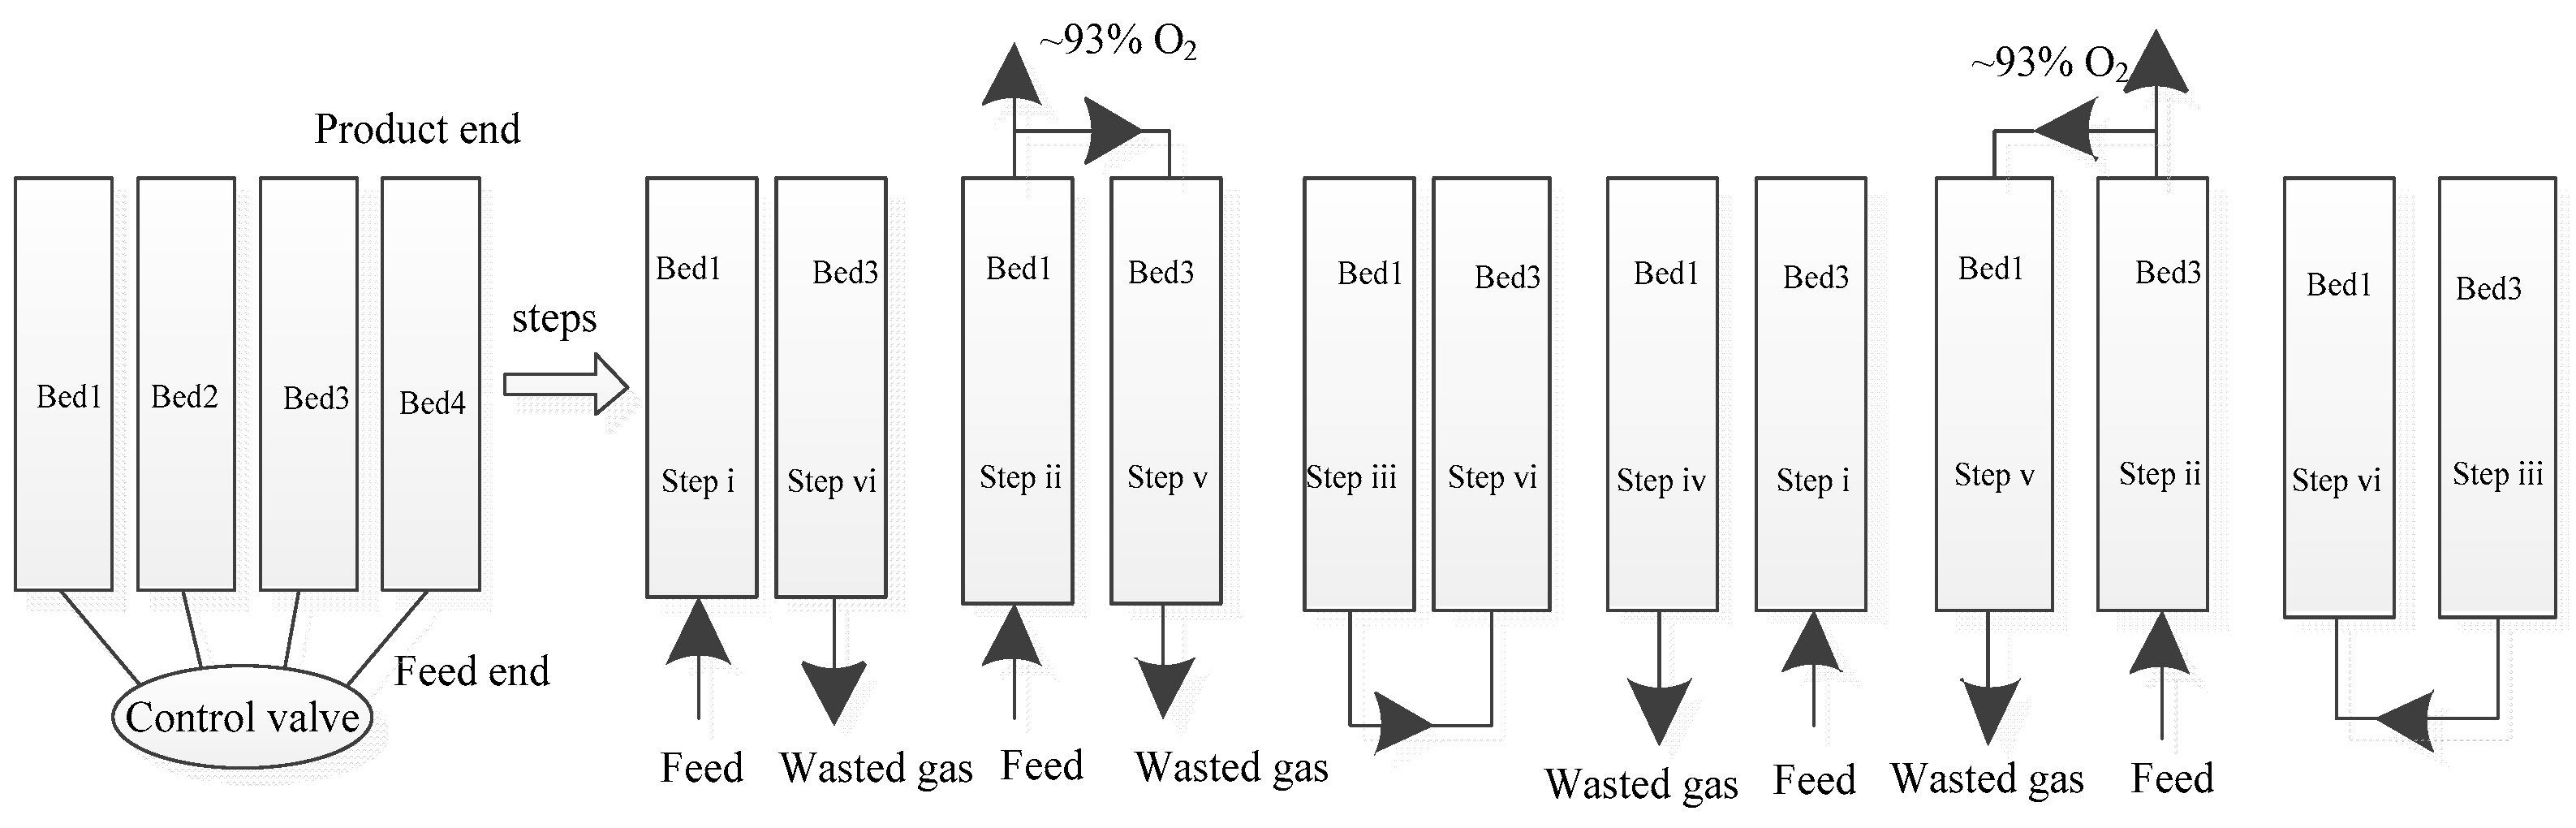
2.3. Cycle Description
The cyclic sequence of the RCPSA oxygen production process is presented in Figure 1. Four beds (labeled bed1, bed2, bed3 and bed4) are employed to conduct rapid cycle and each bed goes though the same cycle steps sequentially [7]. Notably, bed1 and bed3 (bed2 and bed4) are connected for transferring gas and energy during pressure equalization and purge steps. The adsorption cycle consists of (i) co-current pressurization (PR) with compressed air, (ii) selective adsorption (AD) of N2 from compressed air to produce ~93% O2, (iii) pressure equalization down (PED), in which the product end is closed and the feed end is open and connected with another bed, (iv) countercurrent blow down (BD) and (v) purge (PU), in which the continuous purge step is employed for rinsing the desorption bed, (vi) pressure equalization up (PEU), in which the product end is closed and the feed end is open and connected with another bed, and the repetition of the cycle. The O2 enriched gases from the AD step are collected and the N2 enriched effluent gases from the BD are wasted. The step times of adsorption cycle are determined for maximizing the oxygen recovery. The optimal total cycle time is ~6 s and the individual step durations are 0.5, 2, 0.5, 0.5, 1.5 and 0.5 s, respectively, for steps i (tPR), ii (tAD), iii (tPED), iv (tBD), v (tPU) and vi (tPEU) of the cycle.
Figure 1.
Cyclic sequence of RCPSA process.
2.4. Initial and Boundary Conditions
The initial conditions and boundary conditions for each step are shown in Table 3 [31].
Table 3.
Initial conditions and boundary conditions for the models.
2.5. Method of Solution
The mathematical model is solved by self-prepared solver with MATLAB 2019a software, which used the control volume method. The method of upwind differencing scheme on finite elements is preferred to discretize the axial bed distance length into 102 nodes with second-order approximation accuracy. In addition, a 0.01 s time step size is used to conduct the simulations. A change in process performance indicators with ≤0.01% in two consecutive cycles is used as the criteria to confirm the cyclic steady state of the process. The computing time used for convergence is several minutes (5~10), depending on different mass transfer models.
3. Experimental Section
A small scale four-bed RCPSA oxygen production system employing small LiLSX zeolite particles is employed for validating the model. A sample of LiLSX zeolite (supplied by Luoyang Jianlong Micro-nano Novel Materials Co., LTD, Luoyang, China, with diameter of 0.45 mm) is used to operate various RCPSA cycles. The adsorption isotherms of small LiLSX zeolite particles are measured and the Langmuir model is employed for fitting the experimental results and conducting the simulations of mass and transfer process. More detailed results and experimental setup are found in our previous work [7] and the Langmuir isotherm parameters are listed in Table 4.
Table 4.
Langmuir isotherm parameters of LiLSX zeolite particle.
Four beds are set in parallel for continuously producing ~93% O2. Each adsorption bed contains 40 g of LiLSX zeolites and sequentially undergoes the cyclic sequences described in Section 2.1. Process parameters, such as pressures, oxygen purity and flowrates, are instantaneously measured with different sensors when the steady state of the system is achieved. The experimental data are collected by repeating the experiments three times and the process errors are less than 5%.
The process performances of RCPSA oxygen production system are always evaluated with O2 purity, recovery and productivity of product. Oxygen purity is defined as the average oxygen concentration y1P in the product gas and determined as
where QP is the flowrate of O2 (L·min−1), is the local O2 purity with flowrate of QP.
Recovery is determined as
where yF is the oxygen purity in the air and QF is the flowrate of air (L·min−1).
Productivity evaluates adsorbent utilization and is calculated as
4. Results and Discussions
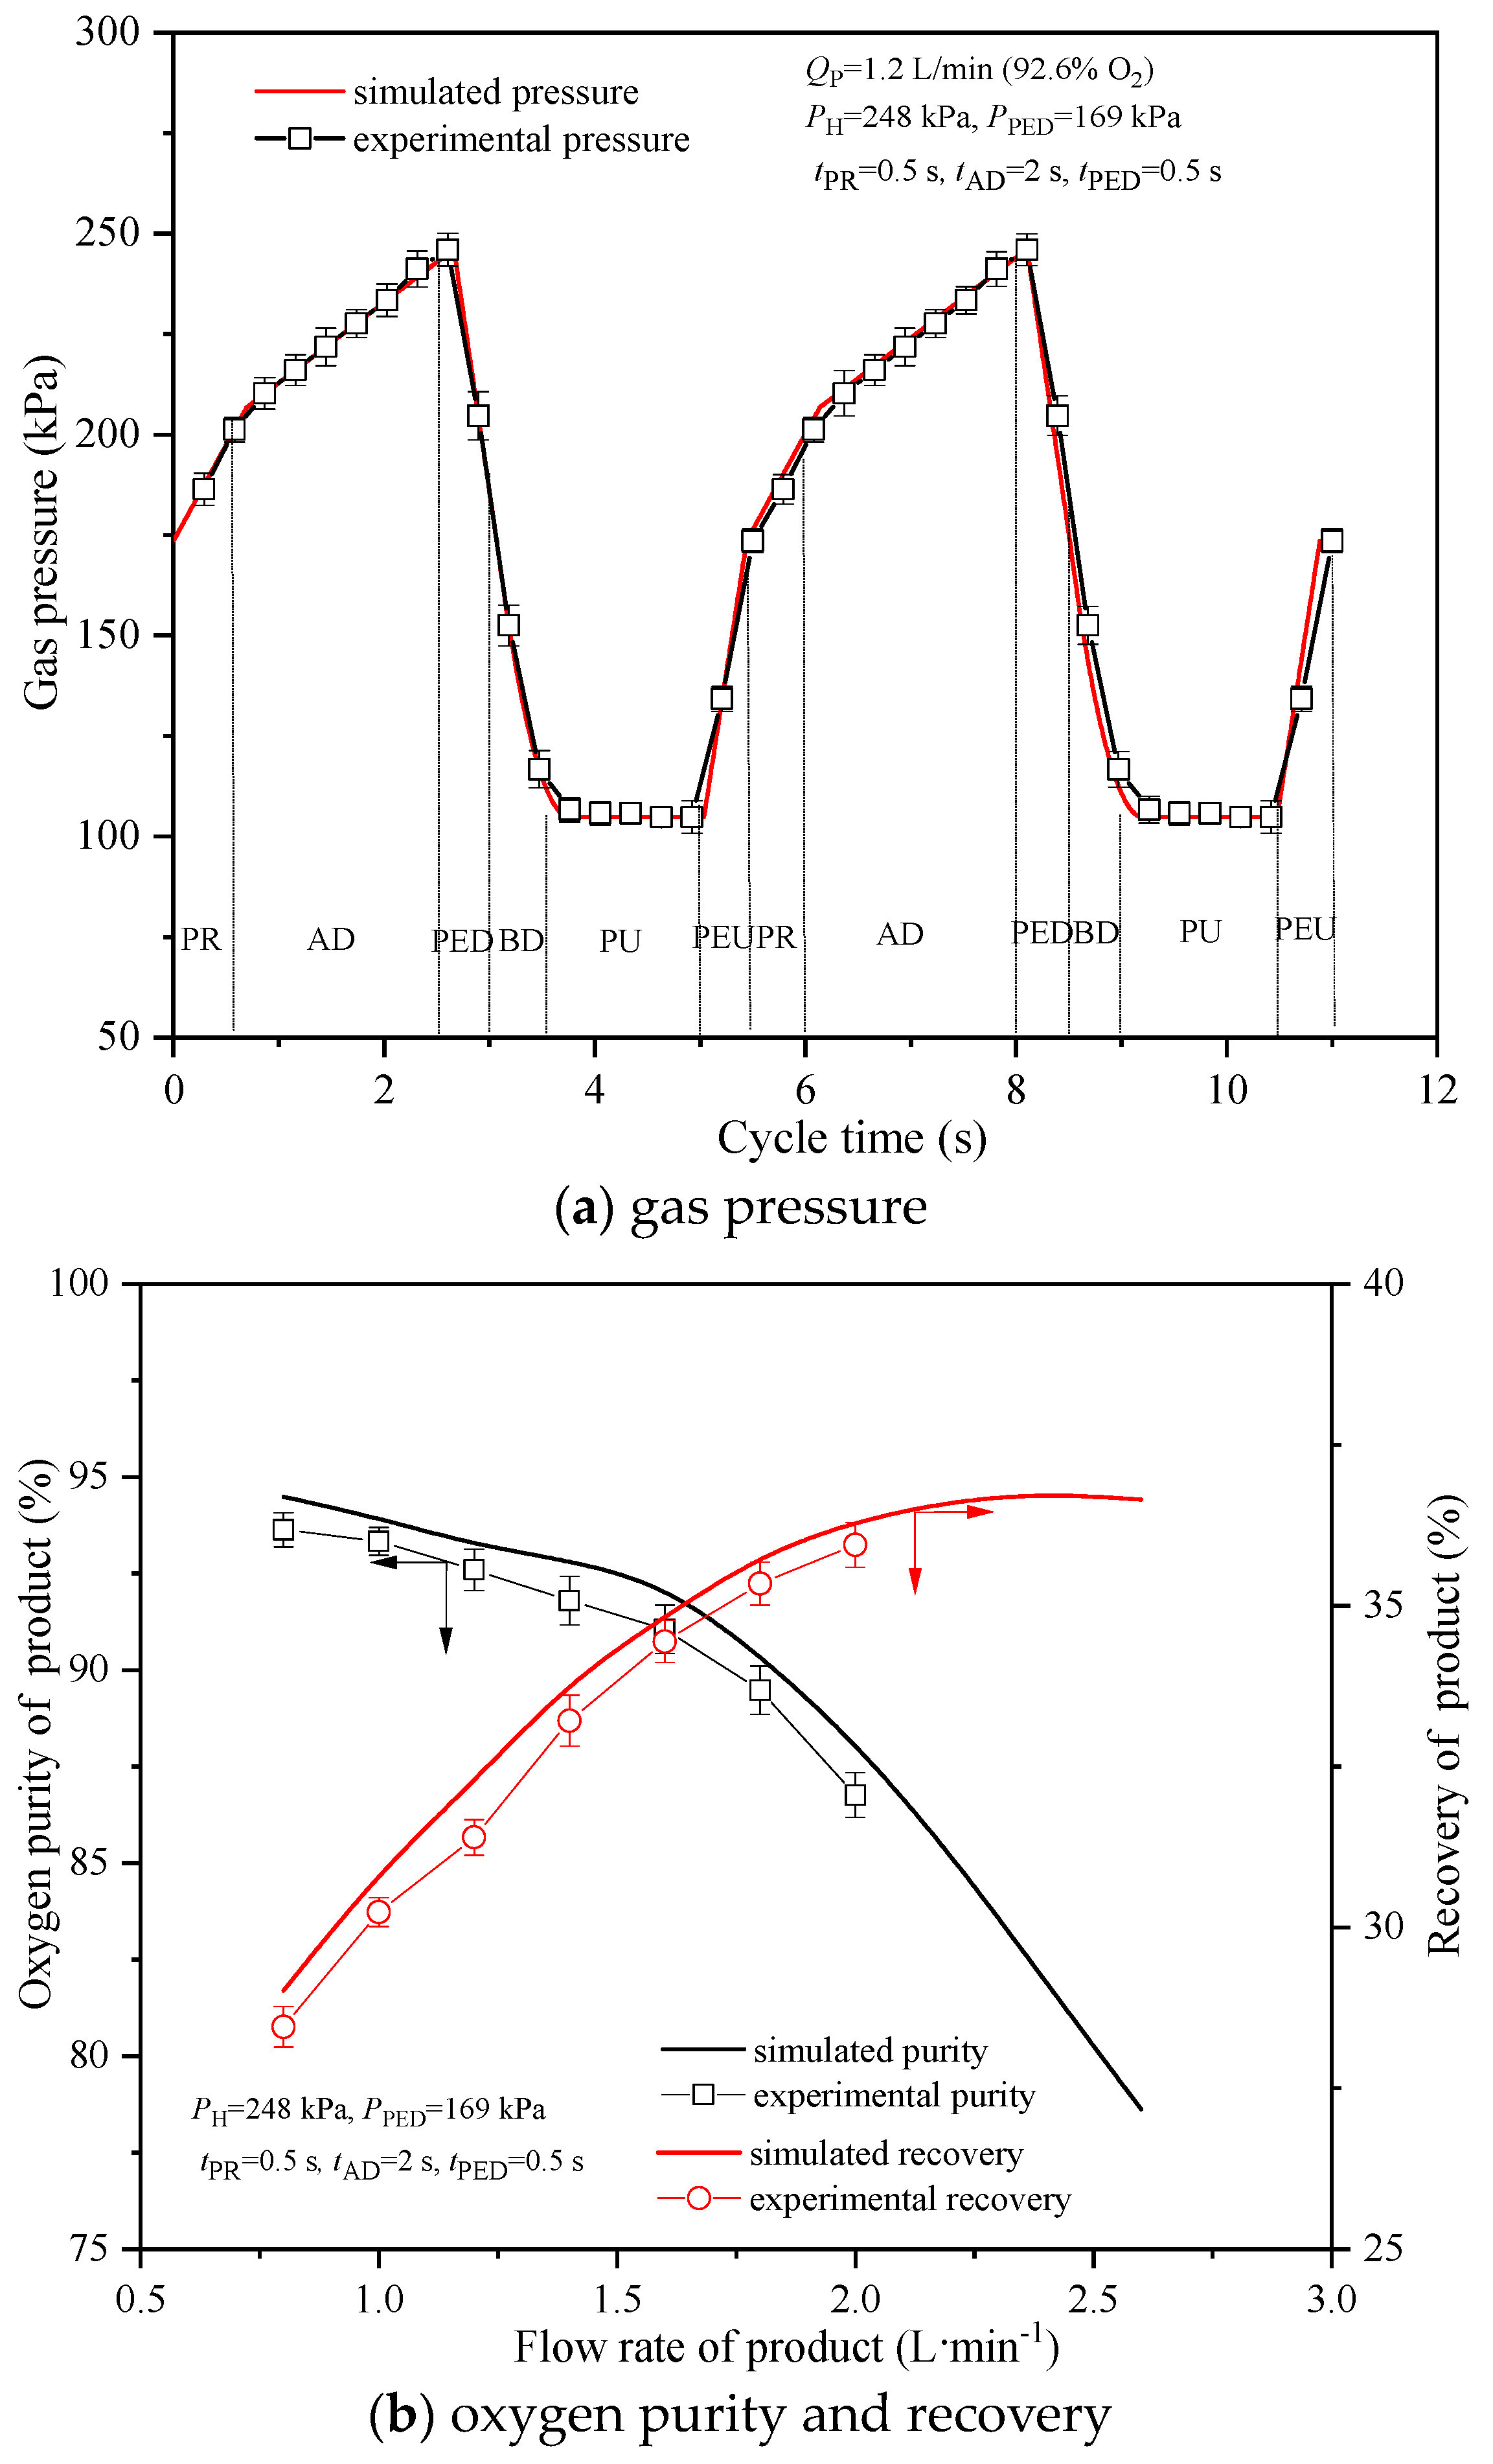
4.1. Model Verification
This section uses the experimental results obtained from our previous work [7] as verification of the simulation program. Figure 2 shows the comparison of experimental and simulated feed pressure change, oxygen purity and recovery (at steady-state operation after 35 cycles) of the RCPSA process with feed flowrate of 16 L·min−1 when the coefficient ki is estimated using case 3. The gas pressure in the experiment is consistent with the simulation results of five steps (PR, AD, PED, PU and PEU steps) except the BD step. However, the errors of gas pressure for the BD step are not caused by large changes of oxygen production performance due to same desorption pressure. The simulated oxygen purity and recovery are higher than the experiment results since the feed is simplified as an ideal gas mixture of N2 and O2 with ratio of 79:21 during the simulation process. However, the relative deviations of oxygen purity and recovery are, respectively, less than 1% and 1.5% with wide product flowrate range, which means the model gives a favorable prediction of the mass and heat transfer characteristics during the PSA process.
Figure 2.
Comparison of experimental data and simulated results with dp = 0.45 mm, εb = 0.39 and QF = 16 L·min−1. The error bar represents the standard deviation of the experimental results.
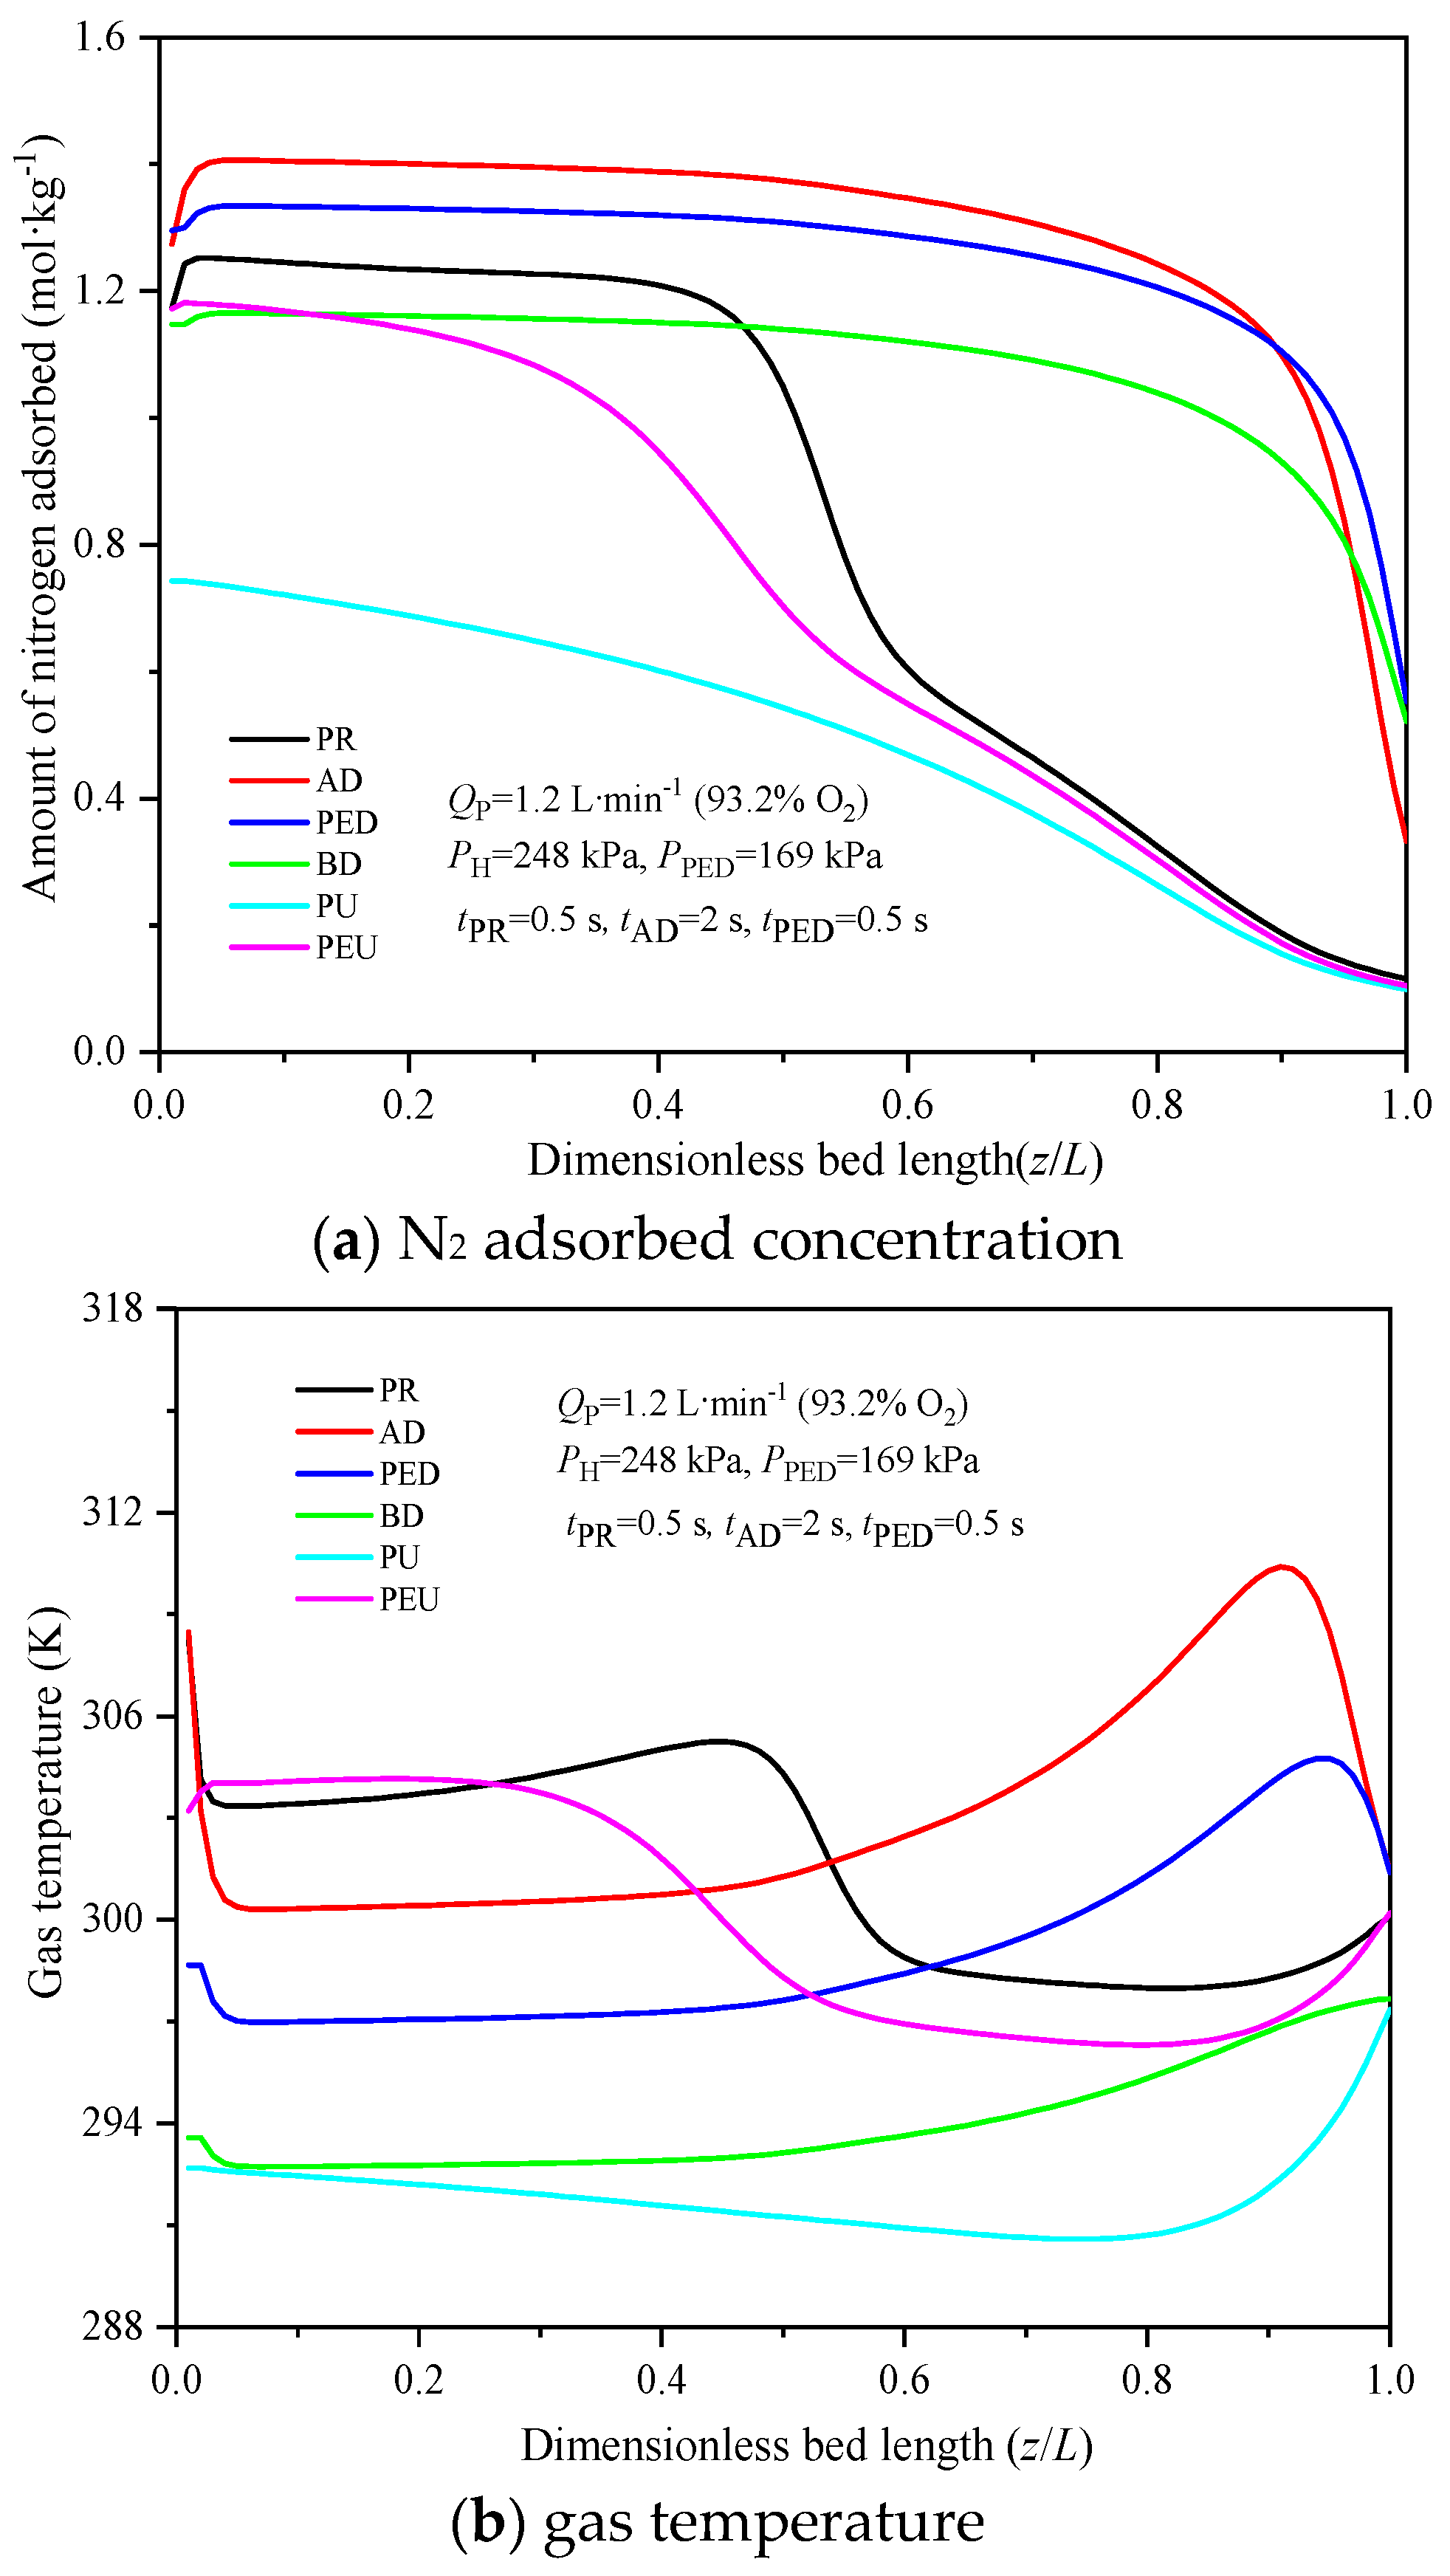
4.2. Gas Concentration, Temperature Distributions at the End of Cycle Step
Figure 3a,b show the steady state axial distributions of nitrogen-adsorbed concentration and gas temperature inside the adsorption bed at the end of cycle step as function of dimensionless bed length when the coefficient ki is estimated using the models of case 3. The leading fronts of the nitrogen mass transfer zones (where there is a corresponding sharp decline in the nitrogen-adsorbed concentration) are located well inside the bed from the product end after adsorption step and they propagate toward the product end after blowdown and pressure equalization down step without breaking through, and they are pushed back toward the feed end during purge and pressure equalization up step. Correspondingly, there is a gentle nitrogen adsorbed-concentration profile at end of the PU and PEU steps. However, the concentration profiles at the end of the AD, PED and BD step are very sharpening since the short mass transfer zone occurs near the product end of these steps.
Figure 3.
N2-adsorbed concentration and gas temperature distributions at the end of each step with dP = 0.45 mm, εb = 0.39 and QF = 16 L·min−1.
The gas temperature profiles within one cycle are presented in Figure 3b. The fluctuation of gas temperature ranges from 290 to 308 K. The distributions of gas temperature inside the adsorption bed are similar, with the nitrogen-adsorbed concentration trends due to the thermal effect dominantly induced by adsorption and desorption. The peak gas temperature is observed after the AD step and the low-gas temperature appears after the PU step since the N2 adsorption of zeolites from air and N2 desorption from the adsorbents are, respectively, an exothermic and endothermic process.
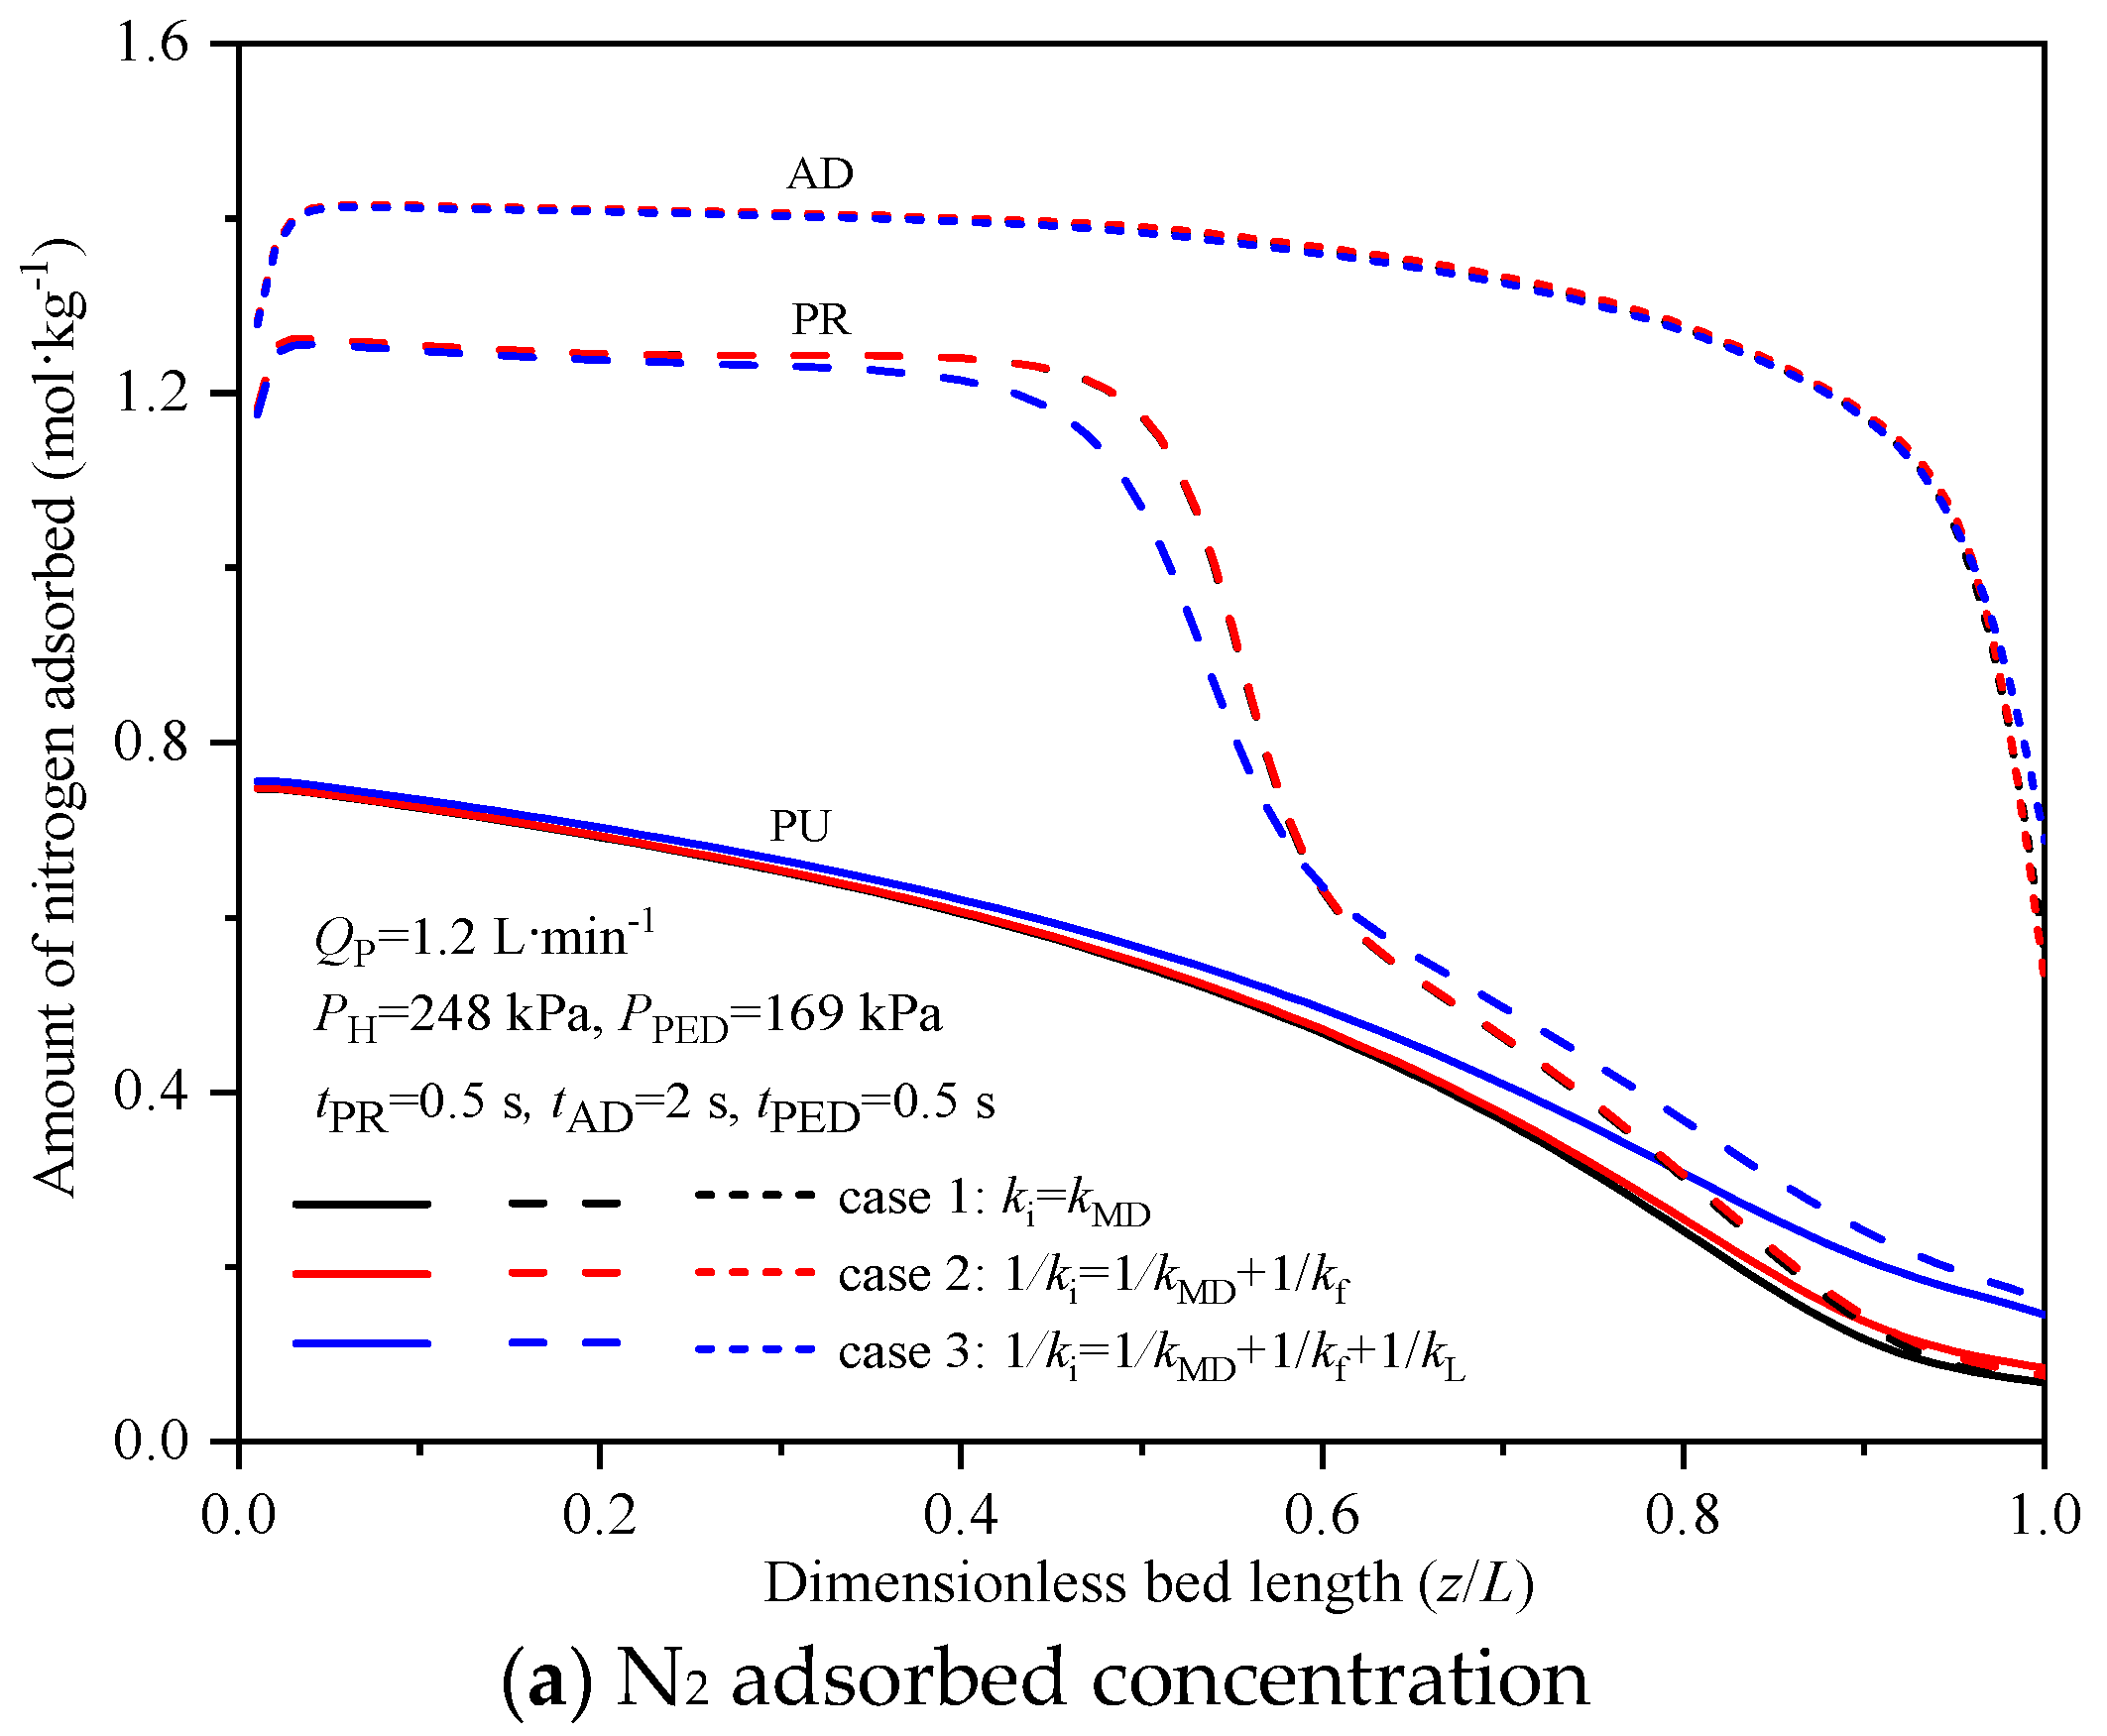
4.3. Effect of Mass Transfer Resistance
Figure 4a–c demonstrate the simulated axial distributions of nitrogen-adsorbed concentration, gas phase oxygen mole fraction and gas temperature at the end of the pressurization, adsorption and purge steps of the RCPSA process with different mass transfer models. After the pressurization and adsorption step, there is a noticeable difference in the nitrogen-adsorbed concentration, oxygen mole fraction and gas temperature profiles under variable mass transfer model conditions. The profiles of case 1 with solely consideration of macropore diffusion exhibit a greater amount of nitrogen-adsorbed concentration and sharper concentration front than case 2 and case 3. This is at least partially responsible for the improvement in oxygen purity, recovery and productivity with increasing mass transfer rate. Since the contributions from film resistance only represent ~9% of the total resistance for small particles [12,13], the concentration and temperature profiles are close for case 1 and case 2.

Figure 4.
N2-adsorbed concentration, O2 mole fraction and gas temperature at different cases with dP = 0.45 mm, εb = 0.39 and QF = 16 L·min−1.
After the purge step, the concentration and gas temperature profiles have nearly the same shape with different mass transfer models except the difference of mass and heat transfer zone near the production end is obvious. Although the profiles are nearly the same at the end of the purge step, there is a noticeable influence on the loading of nitrogen and gas temperature profiles near the production end since the oxygen purity of purge with case 1 is higher than case 2 and case 3.
The simulated process performances of three cases are compared with experiment results, as shown in Table 5.
Table 5.
Simulated performances of three cases with QF = 16 and Qp = 1.2 L·min−1.
Table 5 shows that the oxygen purity, recovery and productivity are overestimated by ~2–4% when axial dispersion effect on the mass transfer is ignored. Such an overestimate of separation performance will induce a highly optimistic system design and therefore the results are practically unacceptable. Case 3 gives a satisfactory agreement between the simulation and experiment results of product purity, recovery and productivity. The assumption of macropore diffusion recognized as the dominant mass transfer resistance traditionally provides a reasonable performance estimation for adsorption involving large zeolite particles [13,27]. While other sources of mass transfer zone spreading external to the particle, like the effect of axial dispersion and film resistance, are not regarded as significant for beds packed with small adsorbent particles in previous studies [13], the results of bed profiles and process performances suggest that the influence of the axial dispersion effect is significant and acts to disperse the mass transfer zone and decrease the working capacity of the bed. Although this additional impact is detrimental to mass transfer, it is more in line with actual performance than the traditional assumption of mass transfer. Consequently, it is recommended that the axial dispersion effect should be accounted for determining the mass transfer rate during a PSA simulation process with small adsorbent particles.
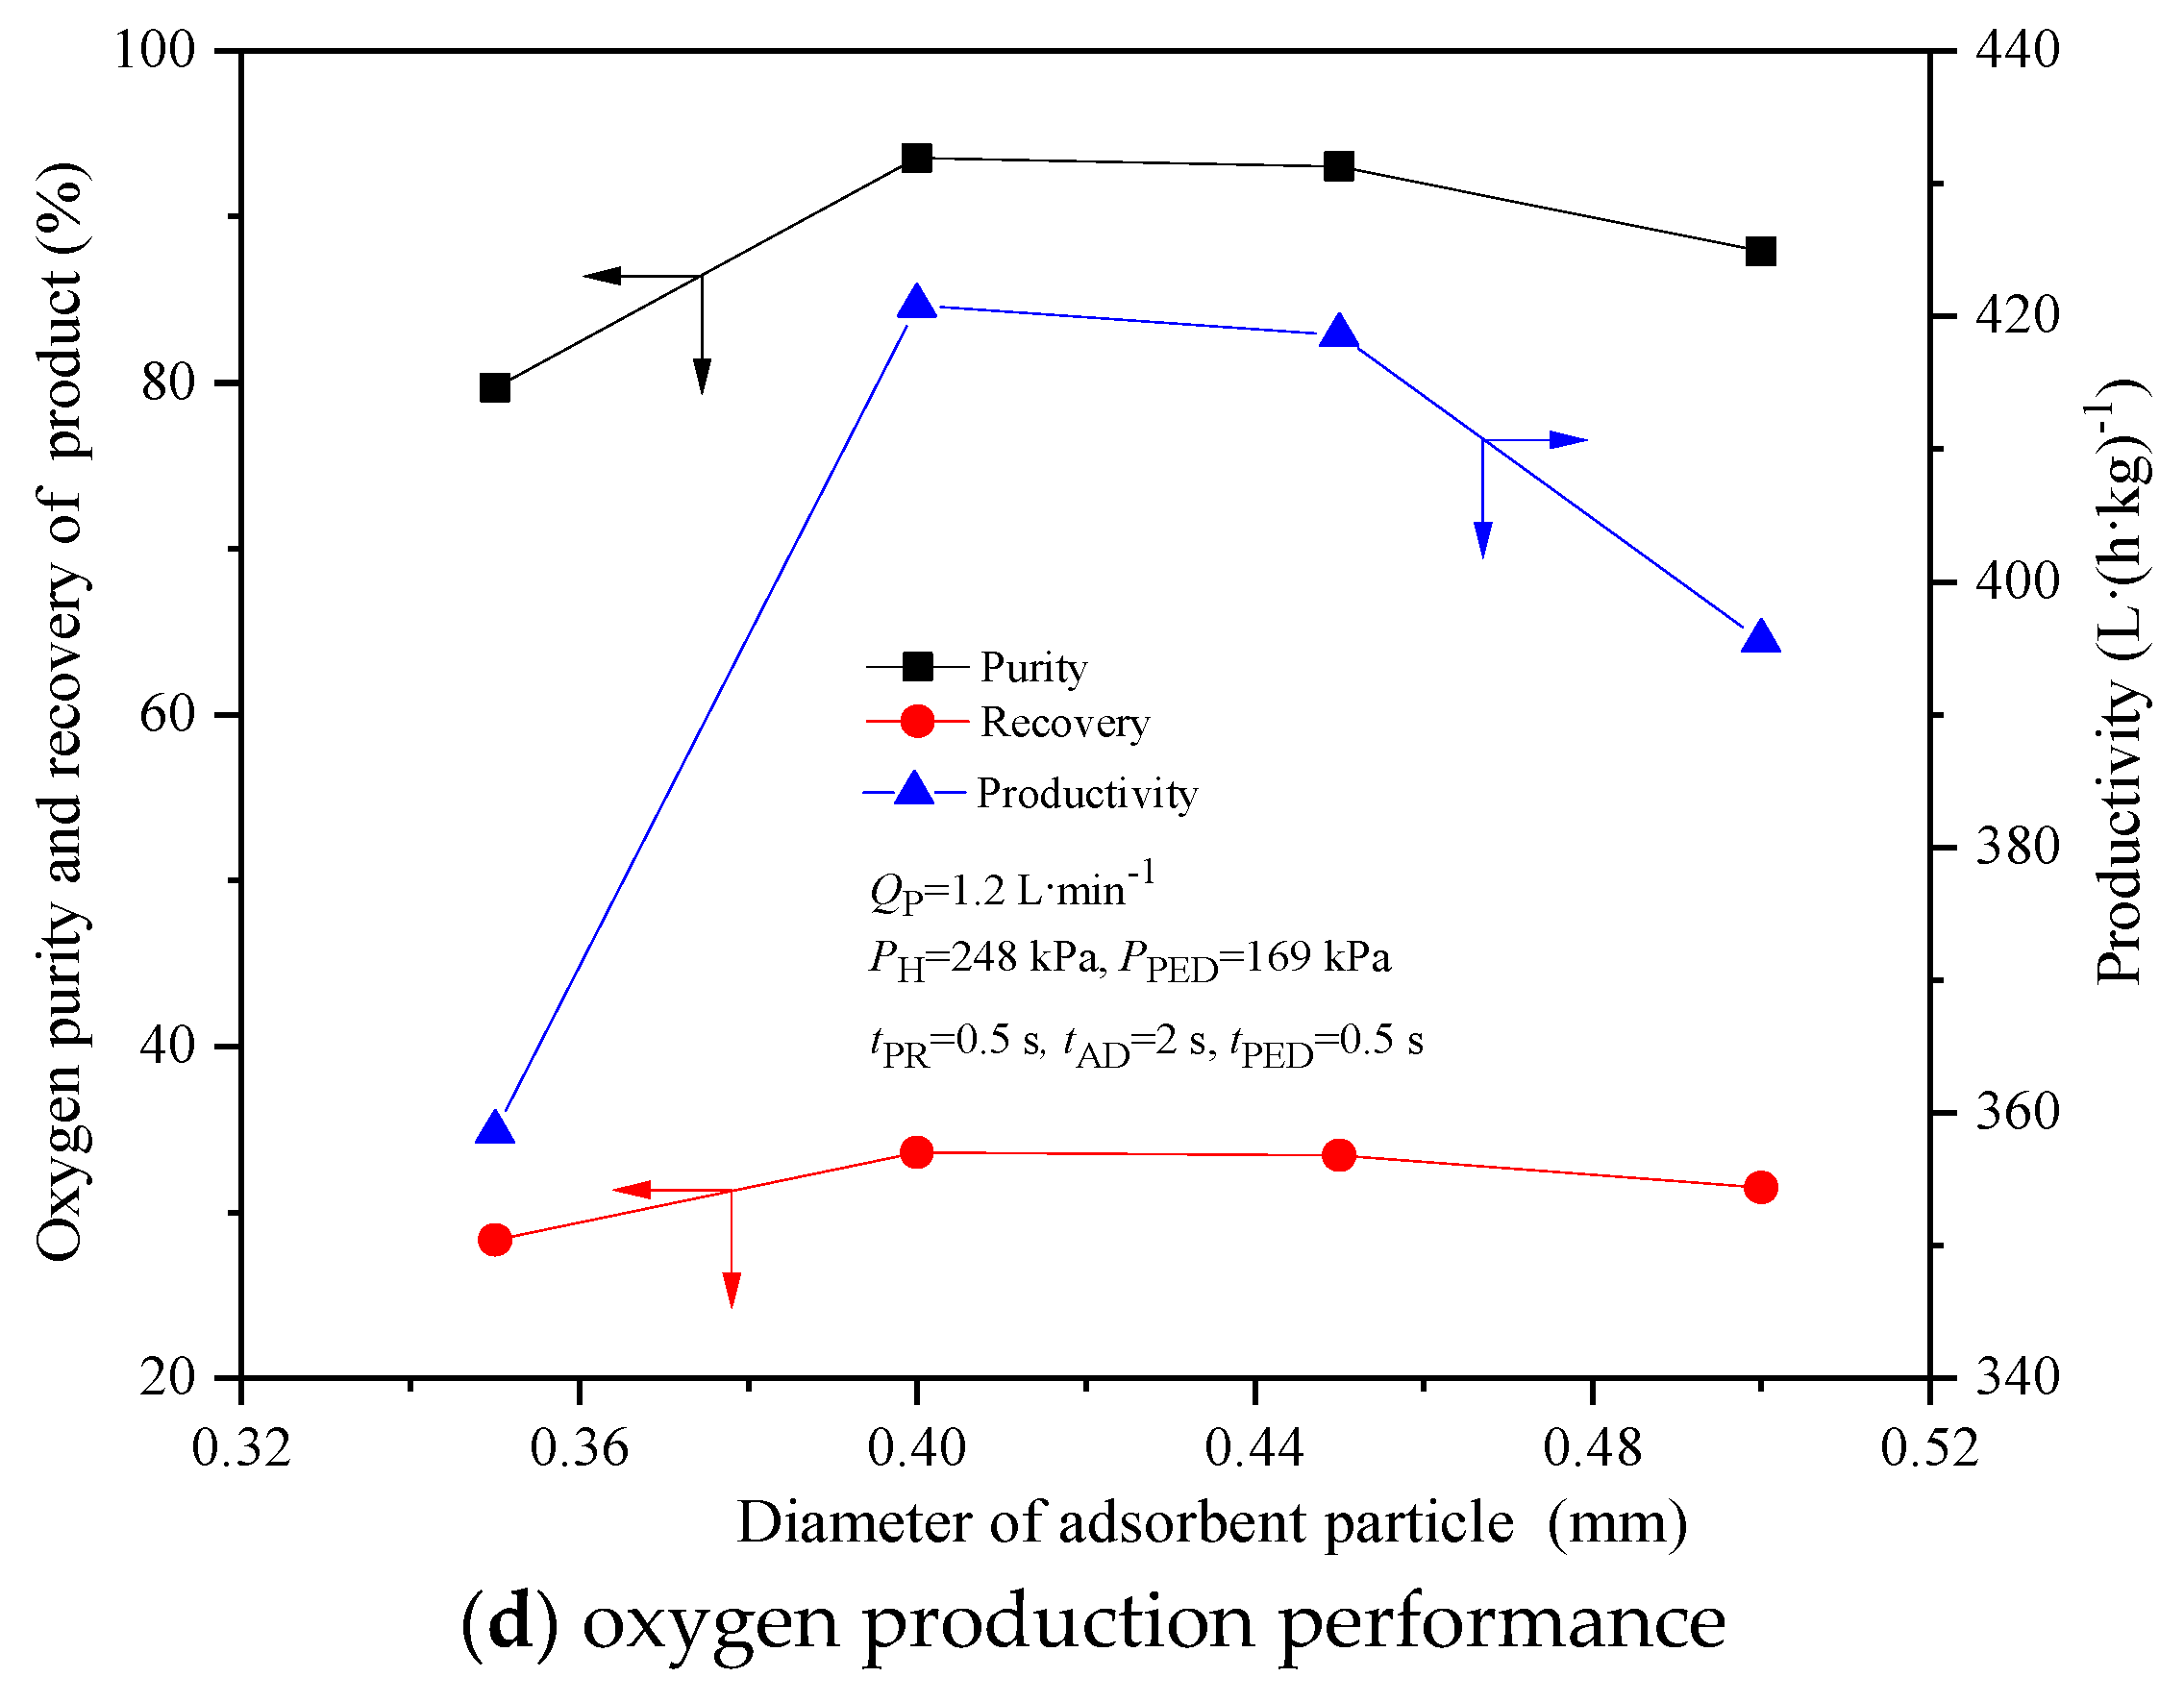
4.4. Effect of Particle Size
The diameter reduction of a zeolite particle is intended to decrease the resistance of macropore diffusion and improve the rate of mass transfer. However, the contributions of film resistance and axial dispersion effect become significant with a decrease in particle size. Figure 5a–d depict the influence of particle size on the profiles of nitrogen-adsorbed concentration, gas phase oxygen mole fraction, gas temperature and the oxygen production performance at the end of pressurization, adsorption and purge steps of the RCPSA process when the film resistance, macropore diffusion and axial dispersion effect are included in total mass transfer resistance.

Figure 5.
N2-adsorbed concentration, O2 mole fraction, temperature and performance at different particle sizes with εb = 0.39 and QF = 16 L·min−1.
As the particle size decreases, the fronts of nitrogen-adsorbed concentration, gas phase oxygen mole fraction and gas temperature become sharp at end of PR and AD step, which effectively improves the performance. However, the adverse effects induced by particle size reduction on the mass transfer zone become significant at very small particles conditions. When the particle size reduces to 0.35 mm, the axial dispersion effect of nitrogen through the gas phase stretches the mass and heat transfer zone toward the product end during the PU, PR and AD steps, which facilitates earlier nitrogen breakthrough and lowers the oxygen production performance. It is obvious that the total mass transfer resistance cannot be indefinitely decreased though reducing the particle size of adsorbents, because of significant axial dispersion effect with very small particles.
Figure 5d shows an optimal oxygen purity and recovery with high productivity is achieved around a particle size of ~0.4 mm. It is worth noting that there is a significant decline in performance with very small particles, which is consistent with the available literature data [15]. It is apparent that the reduction of macropore diffusion resistance does not work because other sources for spreading the mass transfer zone, such as axial dispersion effect, arise in the bed due to very small particles. The primary potential contributor to the performance drop is the axial dispersion effect. It further determines the significance of axial dispersion effect for small adsorbent particles when calculating the overall mass transfer resistance. It is suggested, therefore, that the particle size of adsorbents should be increased as much as possible to improve comprehensive process performance.
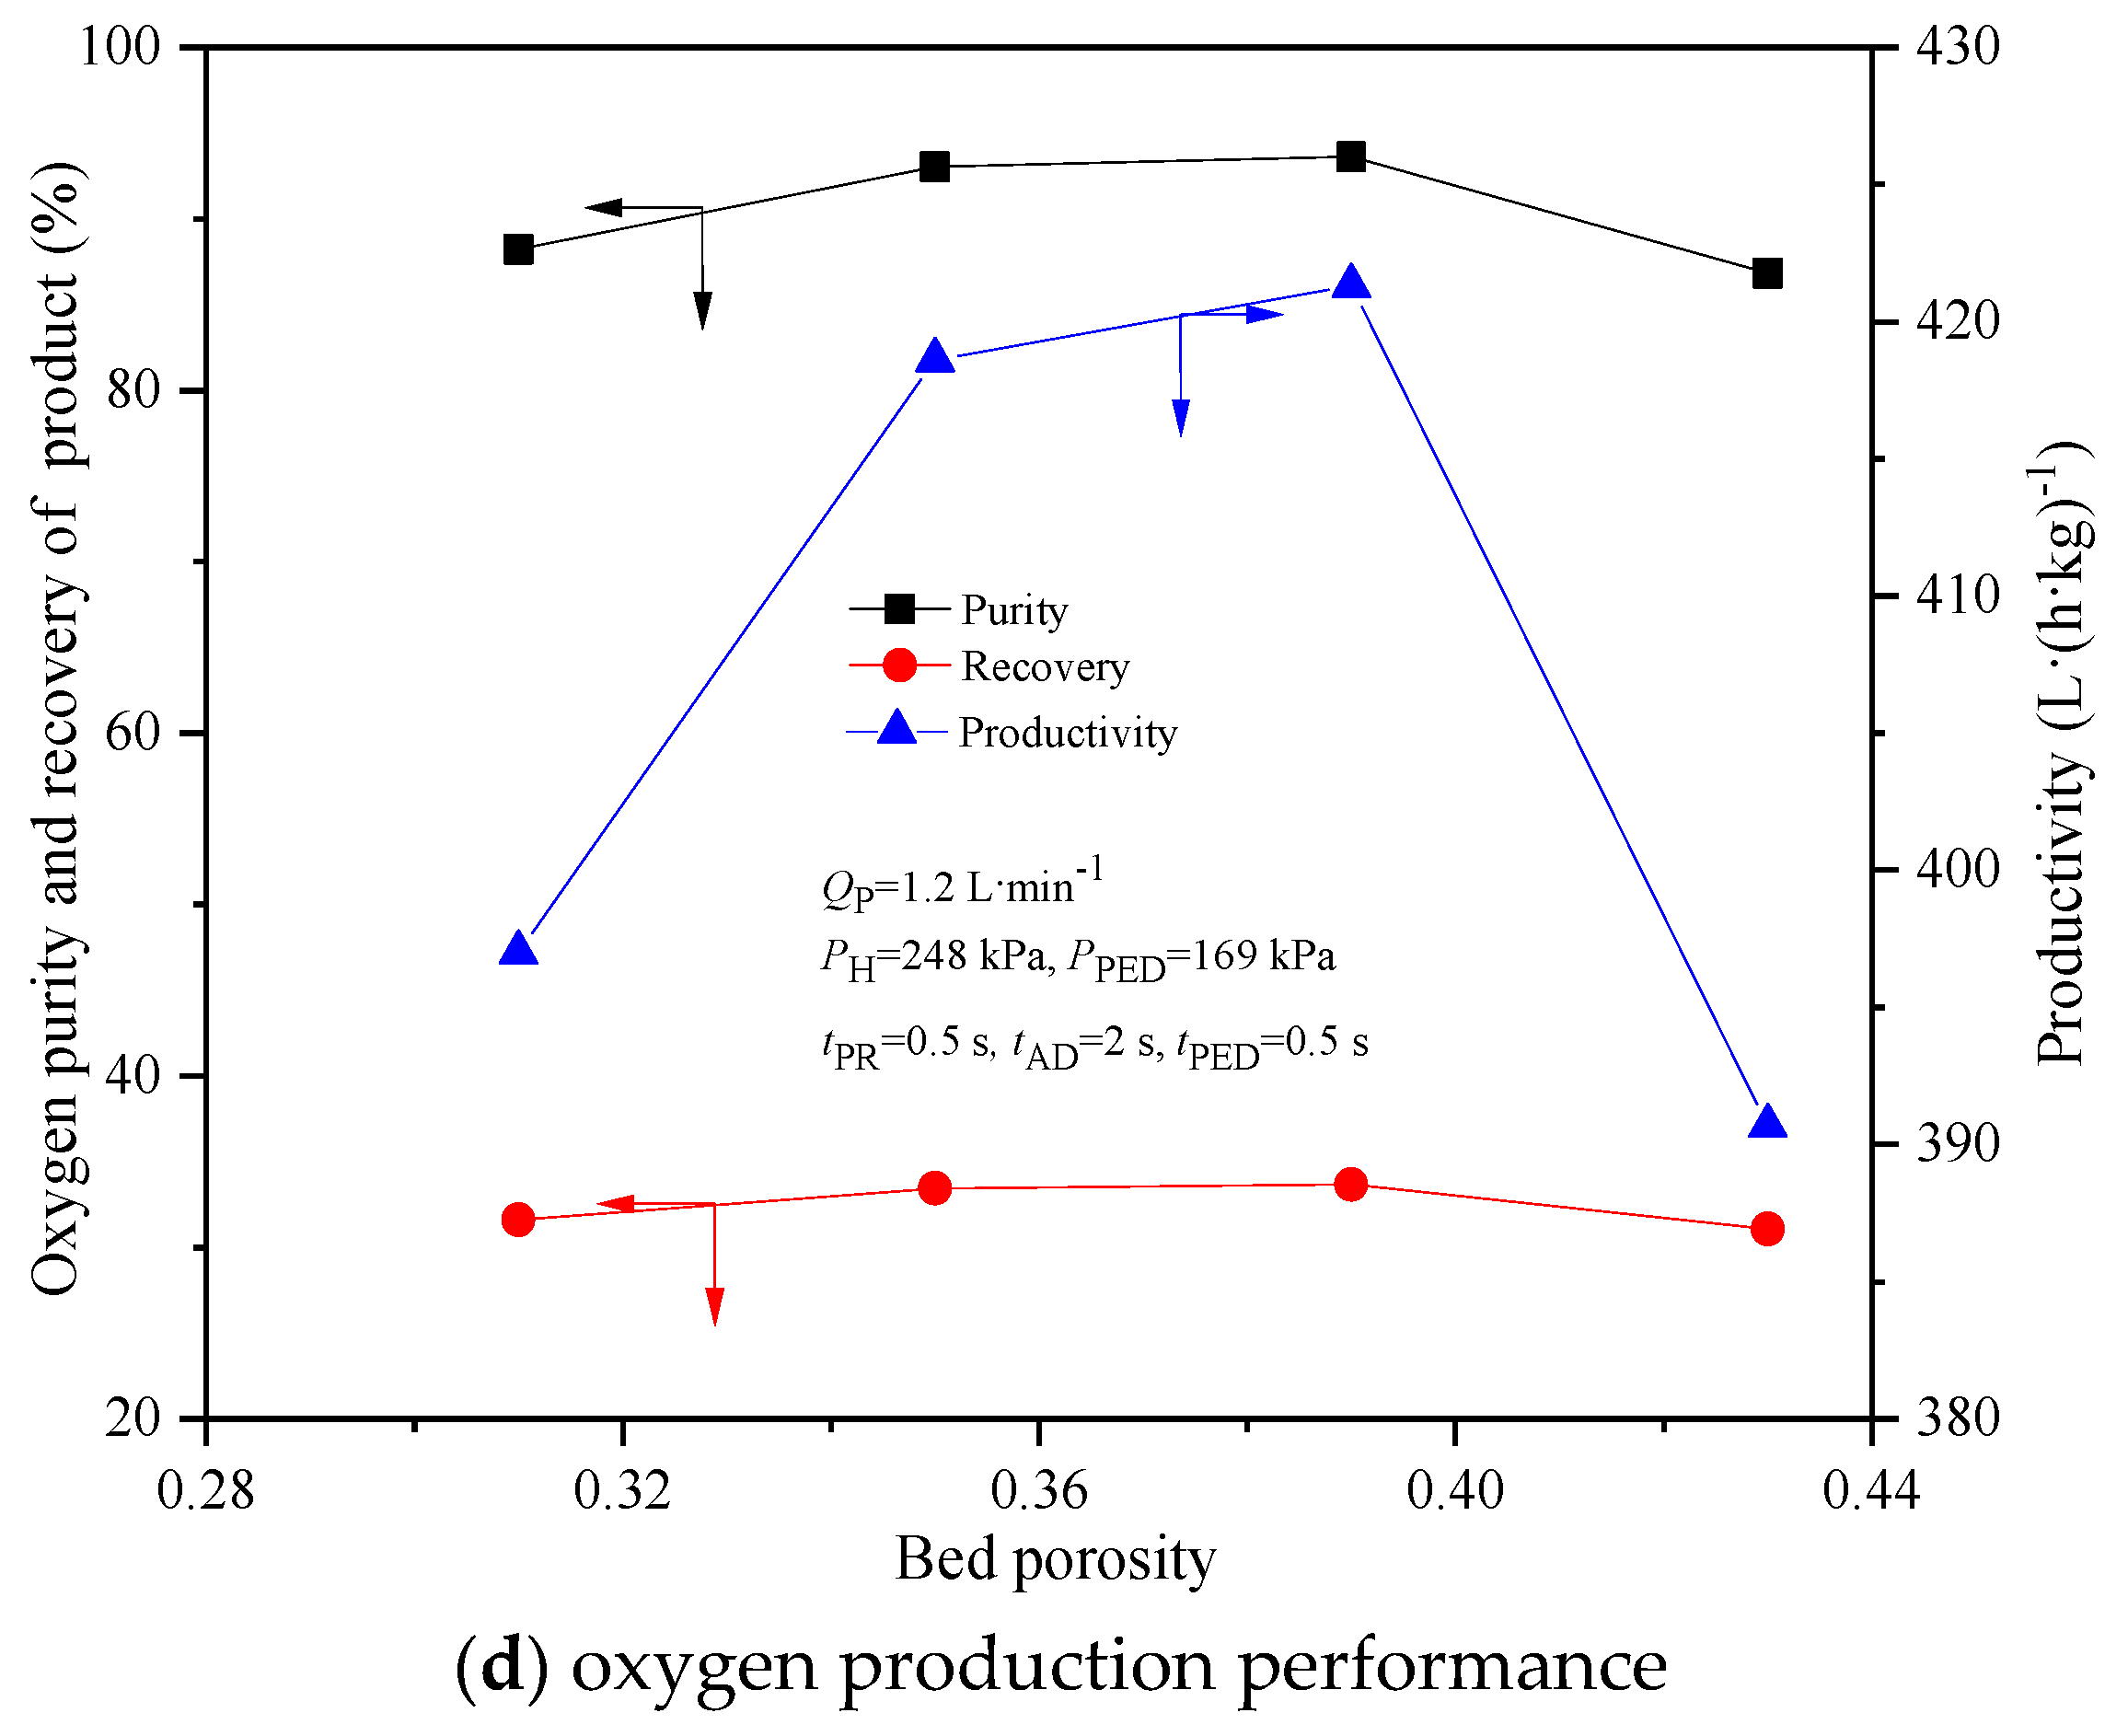
4.5. Effect of Bed Porosity
The effect of bed porosity becomes significant for limiting the axial dispersion effect in the bed with small particles, due to comparable contribution of axial dispersion for mass transfer. The variation of bed porosity is often given little attention since packing the adsorbent in the bed is complicated and unpredictable. Figure 6a–d show the simulated bed axial profiles of nitrogen-adsorbed concentration, gas phase oxygen mole fraction, gas temperature and oxygen production performance at the end of pressurization, adsorption and purge steps of the RCPSA process for bed porosities of 0.31, 0.35, 0.39 and 0.43 when the film resistance, macropore diffusion and axial dispersion effect are included in total mass transfer resistance. As the bed porosity increases, the fronts of nitrogen-adsorbed concentration, gas phase oxygen mole fraction and gas temperature become sharp, which effectively improves the performance. However, this variation becomes reversed with a porosity of 0.43. When the bed porosity increases to 0.43, the axial dispersion stretches the mass and heat transfer zone toward the product end during the PU, PR and AD steps, which facilitates earlier nitrogen breakthrough and lowers the oxygen production performance.

Figure 6.
N2-adsorbed concentration, O2 mole fraction, temperature and performance with variable bed porosities with dp = 0.45 mm and QF = 16 L·min−1.
Figure 6d shows an optimal oxygen purity and recovery with high productivity is achieved around the bed porosity of 0.39. It is worth noting that there is a significant decline in the performance with large bed porosities. The primary potential contributor to the performance drops is the axial dispersion effect. This results also demonstrates the effects of axial dispersion when determining the overall resistance of mass transfer for small particles. It is therefore recommended that the porosity of bed should be decreased as much as possible to improve comprehensive process performance.
5. Conclusions
A detailed numerical analysis of a small-scale rapid-cycle PSA process model for separating oxygen from air to produce ~93% O2 shows that the mass and heat transfer characteristics and separation efficiency are significantly influenced by various mass transfer resistances like film resistance, macropore diffusion resistance and the effect of axial dispersion. The effects of these resistances on the nitrogen and oxygen concentration profiles, temperature distributions and separation performances have been numerically investigated. The essential remarks of this study can be summarized: The oxygen purity, recovery and productivity are overestimated by ~2–4% when the effect of axial dispersion on mass transfer is ignored. The dominant mass transfer resistance of small adsorbents particles is a combination of film resistance, macropore diffusion resistance and the effect of axial dispersion.
As particle size decreases, the front of nitrogen-adsorbed concentration and gas temperature becomes sharp, which effectively improves the performance. However, the adverse effects of axial dispersion effect become significant at very small particles conditions. The total mass transfer resistance cannot be indefinitely decreased by reducing the particle size of adsorbents.
The shapes of nitrogen concentration and gas temperature profiles are nearly identical after the adsorption and desorption steps. The profiles are pushed forward near the production end with increasing of bed porosities. The optimal performances with high oxygen recovery and productivity are achieved with particle diameter of 0.45 mm and bed porosity of 0.39.
Author Contributions
Writing—original draft preparation, Y.S.; Writing—review and editing, C.Z., X.Z., L.D. and X.S. All authors have read and agreed to the published version of the manuscript.
Funding
This research was supported by the Academic Research Projects of Beijing Union University (No. ZK10202203, ZK70202102) and Changzhou University under Grant ZMF21020032, ZMF21020388.
Institutional Review Board Statement
Not applicable.
Informed Consent Statement
Not applicable.
Data Availability Statement
Not applicable.
Conflicts of Interest
The authors declare no conflict of interest.
Nomenclature
| Latin letters | |||
| bi | Langmuir parameter (kPa−1) | QF | feed flowrate (L·min−1) |
| bi0 | Langmuir parameter (kPa−1) | QP | product flowrate (L·min−1) |
| c | molar concentration (mol·m−3) | Rg | gas constant (J·mol−1·K−1) |
| ci | component i molar concentration (mol·m−3) | t | time (s) |
| Cf | gas heat capacity (J·kg−1·K−1) | tAD | duration of AD step (s) |
| Cs | solid heat capacity (J·kg−1·K−1) | tBD | duration of BD step (s) |
| dp | particle diameter (m) | tPED | duration of PED step (s) |
| din | bed diameter (m) | tPR | duration of PR step (s) |
| DL | axial dispersion coefficient(m2·s−1) | tPEU | duration of PEU step (s) |
| L | N2 adsorbents loading height (m) | tPU | duration of PU step (s) |
| m | amount of adsorbents (kg) | Tf | gas temperature (K) |
| Nu | Nusselt number | TF | feed temperature (K) |
| hf | gas-solid heat transfer coefficient (W·m−2·K−1) | TPU | purge gas temperature (K) |
| hw | internal gas-wall convective heat transfer coefficient (W·m−2·K−1) | Ts | solid temperature (K) |
| ki | mass transfer coefficient for adsorbate i (s−1) | Tw | wall temperature (K) |
| Kf | gas thermal dispersion coefficient (W·m−1·K−1) | u | interstitial gas velocity (m·s−1) |
| Ks | solid phase thermal conductivity (W·m−1·K−1) | uin | feed velocity (m·s−1) |
| P | pressure (kPa) | y | oxygen purity of gas |
| Pi | gas partial pressure (kPa) | yF | oxygen purity of feed gas |
| PH | adsorption pressure (kPa) | yPU | oxygen purity of purge gas |
| PL | desorption pressure (kPa) | z | axial position (m) |
| PPED | pressure at end of PED step (kPa) | Greek letters | |
| PPEU | pressure at end of PEU step (kPa) | μ | dynamic viscosity (Pa·s) |
| PPR | pressure at end of PR step (kPa) | ρf | gas density (kg·m−3) |
| Pr (=μCf/Kf) | Prandtl number | ρp | apparent density (kg·m−3) |
| qi | adsorbed concentration of the component i (mol·kg−1) | ρb | bulk density (kg·m−3) |
| qi* | equilibrium adsorption concentration of the component i, mol·kg−1 | εb | inter-particle porosity |
| qis | saturation adsorbed concentration of the component i, mol·kg−1 | εp | particle porosity |
| qis | saturation adsorbed concentration of the component i, mol·kg−1 | εp | particle porosity |
References
- Zhang, R.; Shen, Y.; Tang, Z.; Li, W.; Zhang, D. A Review of Numerical Research on the Pressure Swing Adsorption Process. Processes 2022, 10, 812. [Google Scholar] [CrossRef]
- Xing, Y.; Zhang, C.; Wang, H.; Li, Z.; Liu, Y. Airflow Distributions in a Z Type Centripetal Radial Flow Reactor: Effects of Opening Strategy and Opening Rate. Processes 2022, 10, 1250. [Google Scholar] [CrossRef]
- Zhu, X.; Sun, Y.; Liu, Y.; Sun, X.; Shi, J. Experimental performance analysis of vacuum pressure swing adsorption air separation process under plateau special conditions. Sep. Sci. Technol. 2022, 18, 2885–2893. [Google Scholar] [CrossRef]
- Vemula, R.R.; Urich, M.D.; Kothare, M.V. Experimental design of a “snap-on” and standalone single-bed oxygen concentrator for medical applications. Adsorption 2021, 27, 619–628. [Google Scholar] [CrossRef]
- Zhang, Q.; Liu, Y.S.; Li, Z.; Xiao, P.; Liu, W.; Yang, X.; Fu, Y.; Zhao, C.; Yang, R.T.; Webley, P.A. Experimental study on oxygen concentrator with wide product flow rate range: Individual parametric effect and process improvement strategy. Sep. Purif. Technol. 2021, 274, 118918–118928. [Google Scholar] [CrossRef]
- Zhu, X.Q.; Wang, X.W. Experimental study of a rotary valve multi-bed rapid cycle pressure swing adsorption process based medical oxygen concentrator. Adsorption 2020, 26, 1267–1274. [Google Scholar] [CrossRef]
- Zhu, X.; Sun, Y.; Liu, Y.; Li, Z.; Feng, F.; Ma, J.; Li, S. Correlation analysis between working conditions and the performance of a small-scale pressure swing adsorption oxygen production process. Ind. Eng. Chem. Res. 2022, 61, 14962–14972. [Google Scholar] [CrossRef]
- Rama Rao, V.; Wu, C.W.; Kothare, M.V.; Sircar, S. Comparative performances of two commercial samples of LiLSX zeolite for production of 90% oxygen from air by a novel rapid pressure swing adsorption system. Sep. Sci. Technol. 2015, 50, 1447–1452. [Google Scholar] [CrossRef]
- Zhu, X.Q.; Liu, Y.S.; Yang, R.T. Effects of operating temperature on the performance of small-scale rapid cycle pressure swing adsorption air separation process. Adsorption 2021, 27, 205–212. [Google Scholar] [CrossRef]
- Qadir, S.; Li, D.; Gu, Y.; Yuan, Z.; Zhao, Y.; Wang, S. Experimental and numerical analysis on the enhanced separation performance of a medical oxygen concentrator through two-bed rapid pressure swing adsorption. Ind. Eng. Chem. Res. 2021, 60, 5903–5913. [Google Scholar] [CrossRef]
- Zhong, G.; Rankin, P.J.; Ackley, M.W. High Frequency PSA Process for Gas Separation. U.S. Patent 7,828,878 B2, 9 November 2010. [Google Scholar]
- Wu, C.W.; Kothare, M.V.; Sircar, S. Column dynamic study of mass transfer of pure N2 and O2 into small particles of pelletized LiLSX zeolite. Ind. Eng. Chem. Res. 2014, 53, 17806–17810. [Google Scholar] [CrossRef]
- Moran, A.; Patel, M.; Talu, O. Axial dispersion effects with small diameter adsorbent particles. Adsorption 2018, 24, 333–344. [Google Scholar] [CrossRef]
- Moran, A.; Talu, O. Limitations of portable pressure swing adsorption processes for air separation. Ind. Eng. Chem. Res. 2018, 57, 11981–11987. [Google Scholar] [CrossRef]
- Rama Rao, V.; Farooq, S. Experimental study of a pulsed pressure swing adsorption process with very small 5A zeolite particles for oxygen enrichment. Ind. Eng. Chem. Res. 2014, 53, 13157–13170. [Google Scholar] [CrossRef]
- Zheng, X.G.; Liu, Y.S.; Liu, W.H. Two-dimensional modeling of the transport phenomena in the adsorber during pressure swing adsorption process. Ind. Eng. Chem. Res. 2010, 49, 11814–11824. [Google Scholar] [CrossRef]
- Ogawa, K.; Inagaki, Y.; Ohno, A. Numerical analysis of O2 concentration, gas-zeolite temperatures in two zeolite columns for an oxygen concentrator. Int. J. Heat. Mass Transfer. 2019, 129, 238–254. [Google Scholar] [CrossRef]
- Moran, A.; Talu, O. Role of pressure drop on rapid pressure swing adsorption performance. Ind. Eng. Chem. Res. 2017, 56, 5715–5723. [Google Scholar] [CrossRef]
- Rumbo Morales, J.Y.; López, G.L.; Alvarado Martínez, V.M.; Sorcia Vázquez, F.J.; Brizuela Mendoza, J.A.; García, M.M. Parametric study and control of a pressure swing adsorption process to separate the water-ethanol mixture under disturbances. Sep. Purifi. Technol. 2020, 236, 116214–116224. [Google Scholar] [CrossRef]
- Rumbo Morales, J.Y.; Ortiz-Torres, G.; Domínguez García, R.O.; Torres Cantero, C.A.; Rodriguez, M.C.; Sarmiento-Bustos, E.; Oceguera-Contreras, E.; Flores Hernández, A.A.; Rodríguez Cerda, J.C.; Molina, Y.A.; et al. Review of the Pressure Swing Adsorption Process for the Production of Biofuels and Medical Oxygen: Separation and Purification Technology. Adsorpt. Sci. Technol. 2022, 2022, 3030519. [Google Scholar] [CrossRef]
- Khamseh, A.A.G.; Ghorbanian, S.A.; Amini, Y.; Shadman, M.M. Investigation of kinetic, isotherm and adsorption efcacy of thorium by orange peel immobilized on calcium alginate. Sci. Rep. 2023, 13, 8393–8403. [Google Scholar] [CrossRef]
- Zhu, X.; Sun, Y.; Dong, L.; Sun, X.; Li, S.; Chen, H.; Zhang, J.; Chen, J. Comprehensive performance and numerical analysis of pressure swing adsorption process based medical oxygen concentrator under various operating conditions. Sep. Sci. Technol. 2023. [Google Scholar]
- Rege, S.U.; Yang, R.T. Limits for air separation by adsorption with LiX zeolite. Ind. Eng. Chem. Res. 1997, 36, 5358–5365. [Google Scholar] [CrossRef]
- Langmuir, I.; Amer, J. The adsorption of gases on plane surfaces of glass, mica and platinum. JACS 1918, 40, 1361–1403. [Google Scholar] [CrossRef]
- Gleuckauf, E.; Coates, J.I. The Influence of Incomplete Equilibrium on the Front Boundary of Chromatograms and the Effectiveness of Separation. J. Chem. Soc. 1947, 78, 1315–1321. [Google Scholar] [CrossRef]
- Ergun, S. Fluid flow through packed columns. Chem. Eng. Prog. 1952, 48, 89–94. [Google Scholar]
- Ruthven, D.M.; Farooq, S.; Knaebel, K.S. Pressure Swing Adsorption; VCH Publisher: New York, NY, USA, 1994. [Google Scholar]
- Wakao, N.; Kaguei, S.; Funazkri, T. Effect of fluid dispersion coefficients on particle to fluid heat transfer coefficients in packed beds. Chem. Eng. Sci. 1979, 34, 325–336. [Google Scholar] [CrossRef]
- Lopes, F.V.S.; Grande, C.A.; Rodrigues, A.E. Fast-cycling VPSA for hydrogen purification. Fuel 2012, 93, 510–523. [Google Scholar] [CrossRef]
- Yang, R.T. Adsorbents: Fundamentals and Applications; JohnWiley & Sons: Hoboken, NJ, USA, 2003. [Google Scholar]
- Zhu, X.Q.; Liu, Y.S.; Yang, X.; Liu, W.H. Study of a novel rapid vacuum pressure swing adsorption process with intermediate gas pressurization for producing oxygen. Adsorption 2017, 23, 175–184. [Google Scholar] [CrossRef]
Disclaimer/Publisher’s Note: The statements, opinions and data contained in all publications are solely those of the individual author(s) and contributor(s) and not of MDPI and/or the editor(s). MDPI and/or the editor(s) disclaim responsibility for any injury to people or property resulting from any ideas, methods, instructions or products referred to in the content. |
© 2023 by the authors. Licensee MDPI, Basel, Switzerland. This article is an open access article distributed under the terms and conditions of the Creative Commons Attribution (CC BY) license (https://creativecommons.org/licenses/by/4.0/).