Article

Seismic Response Variance of Depositional Sequences: Implications for Reservoir Prediction in Lacustrine Basin

1
Institute of Petroleum Exploration and Development, PetroChina Tarim Oilfield Company, Korla 841000, China
2
School of Resources and Environment, Yangtze University, Wuhan 430100, China
3
Key Laboratory of Oil and Gas Resources and Exploration Technology, Ministry of Education, Yangtze University, Wuhan 430100, China
*
Author to whom correspondence should be addressed.
Processes 2023, 11(8), 2481; https://doi.org/10.3390/pr11082481
Submission received: 28 May 2023 / Revised: 3 August 2023 / Accepted: 4 August 2023 / Published: 18 August 2023

Abstract

:
In recent years, lithologic oil and gas reservoirs have become an important target in continental hydrocarbon-bearing basins. Geophysical prospecting technology using seismic data is an indispensable tool for oil and gas exploration. However, while previous work has paid much attention to the seismic responses of reservoirs (sandstones), the seismic responses of depositional sequences composed of sandstone–mudstone cycles are not well understood in reservoir prediction. This problem seriously restricts efficient oil–gas exploration and development. The Cretaceous Baxigai Formation in the Yingmaili area, west of the Tabei Uplift, is an important exploration target for lithologic oil and gas reservoirs in the Tarim Basin. The Baxigai Formation is deeply buried with thin thickness. The Baxigai Formation in the study area is divided into a lower sandstone section and an upper mudstone section. Braided river delta sand bodies are developed in the lower sandstone section, and braided river delta sand bodies and beach bar sand bodies are developed in the upper mudstone section. According to the difference in the depositional sequences in different zones, five types of the vertical combination style of sandstone and mudstone were identified. Through seismic forward modeling, the seismic response variance of the five kinds of sequence models was established. Then, the amplitude attributes were extracted via wavelet decomposition to reflect the distribution of sandstone–mudstone in different zones. This could help predict the vertical and horizontal distributions of different depositional sequences and the sandstones in these sequences. During the sedimentary period of the upper mudstone section of the Baxigai Formation, the beach bar sand bodies were distributed along the northeast coast. The thin sand bodies pinched out along the up-dip direction to form favorable lithologic traps, which has important significance for lithologic reservoir exploration.

1. Introduction

With the continuous progress of the exploration of oil and gas reservoirs, lithologic oil and gas reservoirs have become important targets in continental hydrocarbon-bearing basins. The subsurface sandstone distribution could be well related to the scale of hydrocarbon reservoirs. However, due to the complex sedimentary cycles and strong reservoir heterogeneity, how to further clarify the scale of thin sandstone reservoirs to achieve greater exploration results is still not well illustrated. The spatial distribution pattern of deep-buried, subsurface, thin sand bodies has become a crucial challenge that restricts efficient exploration and development in continental basins. In recent years, geophysics technologies, such as wavelet decomposition and reconstruction [1,2,3,4,5,6,7,8], stratigraphic slicing, multi-attribute fusion, spectral decomposition, and attribute inversion, have emerged for the recognition and prediction of thin sandstone and have achieved certain applications [9,10,11,12,13,14,15,16,17,18,19]. Although sandstone characteristics have been given much consideration, the vertical combination style of the subsurface sandstone–mudstone in the depositional sequence has still not been well considered in previous research.
The Cretaceous strata in the west of the Tabei Uplift is a set of clastic depositional systems, including the Shushanhe Formation, Baxigai Formation, and Bashijiqike Formation, from bottom to top. The Shushanhe Formation has lacustrine sedimentary records composed of thick mudstone and thin siltstone and is a set of fine-grained clastic rock deposits. The overall thickness of the Shushanhe Formation is between 50 m and 350 m. The Bashijiqike Formation is a delta sedimentary body that accumulated via thick–very thick sandstone with a thin layer of inter-bedded mudstone [20]. The Baxigai Formation developed a transitional depositional record between the lacustrine and delta facies. The Baxigai Formation sandstone reservoir is mainly terrigenous clastic rocks, and the lithology is dominated by fine sandstone, followed by siltstone and medium sandstone. The rock types are feldspar lithic sandstone and lithic feldspar sandstone, with low compositional maturity. In the study area, the thickness of the Baxigai Formation is 40 m~60 m, with a burial depth of 4850–5200 m (average burial depth exceeding 5000 m), and it has a stable distribution throughout the study area [21]. The Cretaceous Baxigai Formation in the western part of the Tabei Uplift is one of the key exploration targets. As early as 2008, thin sandstone reservoirs, with a thickness of only 2.5 m, were discovered in the Cretaceous Baxigai Formation of the research area [22]. Since 2016, multiple horizontal wells have been drilled in this 1 m–4 m thick, thin layer of sandstone, all of which have achieved substantial production of industrial oil and gas flows. This further confirms that the thin sandstone of the Baxigai Formation has good exploration and development potential [23,24]. Conventional geophysical methods based on 3D seismic data are widely used to predict the spatial distribution of thin sand bodies [25,26] for hydrocarbon exploration.
This study focuses on the seismic responses of the depositional sequence composed of sandstone–mudstone cycles using core, wireline log curves, and 3D seismic data. The study aims were as follows: (1) to describe and interpret the depositional characteristics of delta–lacustrine deposits and sandstone–mudstone sequences in different zones; (2) to design corresponding geological models to carry out seismic forward modeling for determining the seismic responses of different vertical depositional sequences in different zones of the study area; and (3) to use wavelet decomposition and reconstruction technology to extract the amplitude attributes and summarize the relationship between the seismic attributes and subsurface geological deposits. Then, the horizontal distribution of the thin-bed sand bodies was clarified in the Baxigai Formation. This study could have implications for sand body prediction in other continental basins with similar geological conditions.

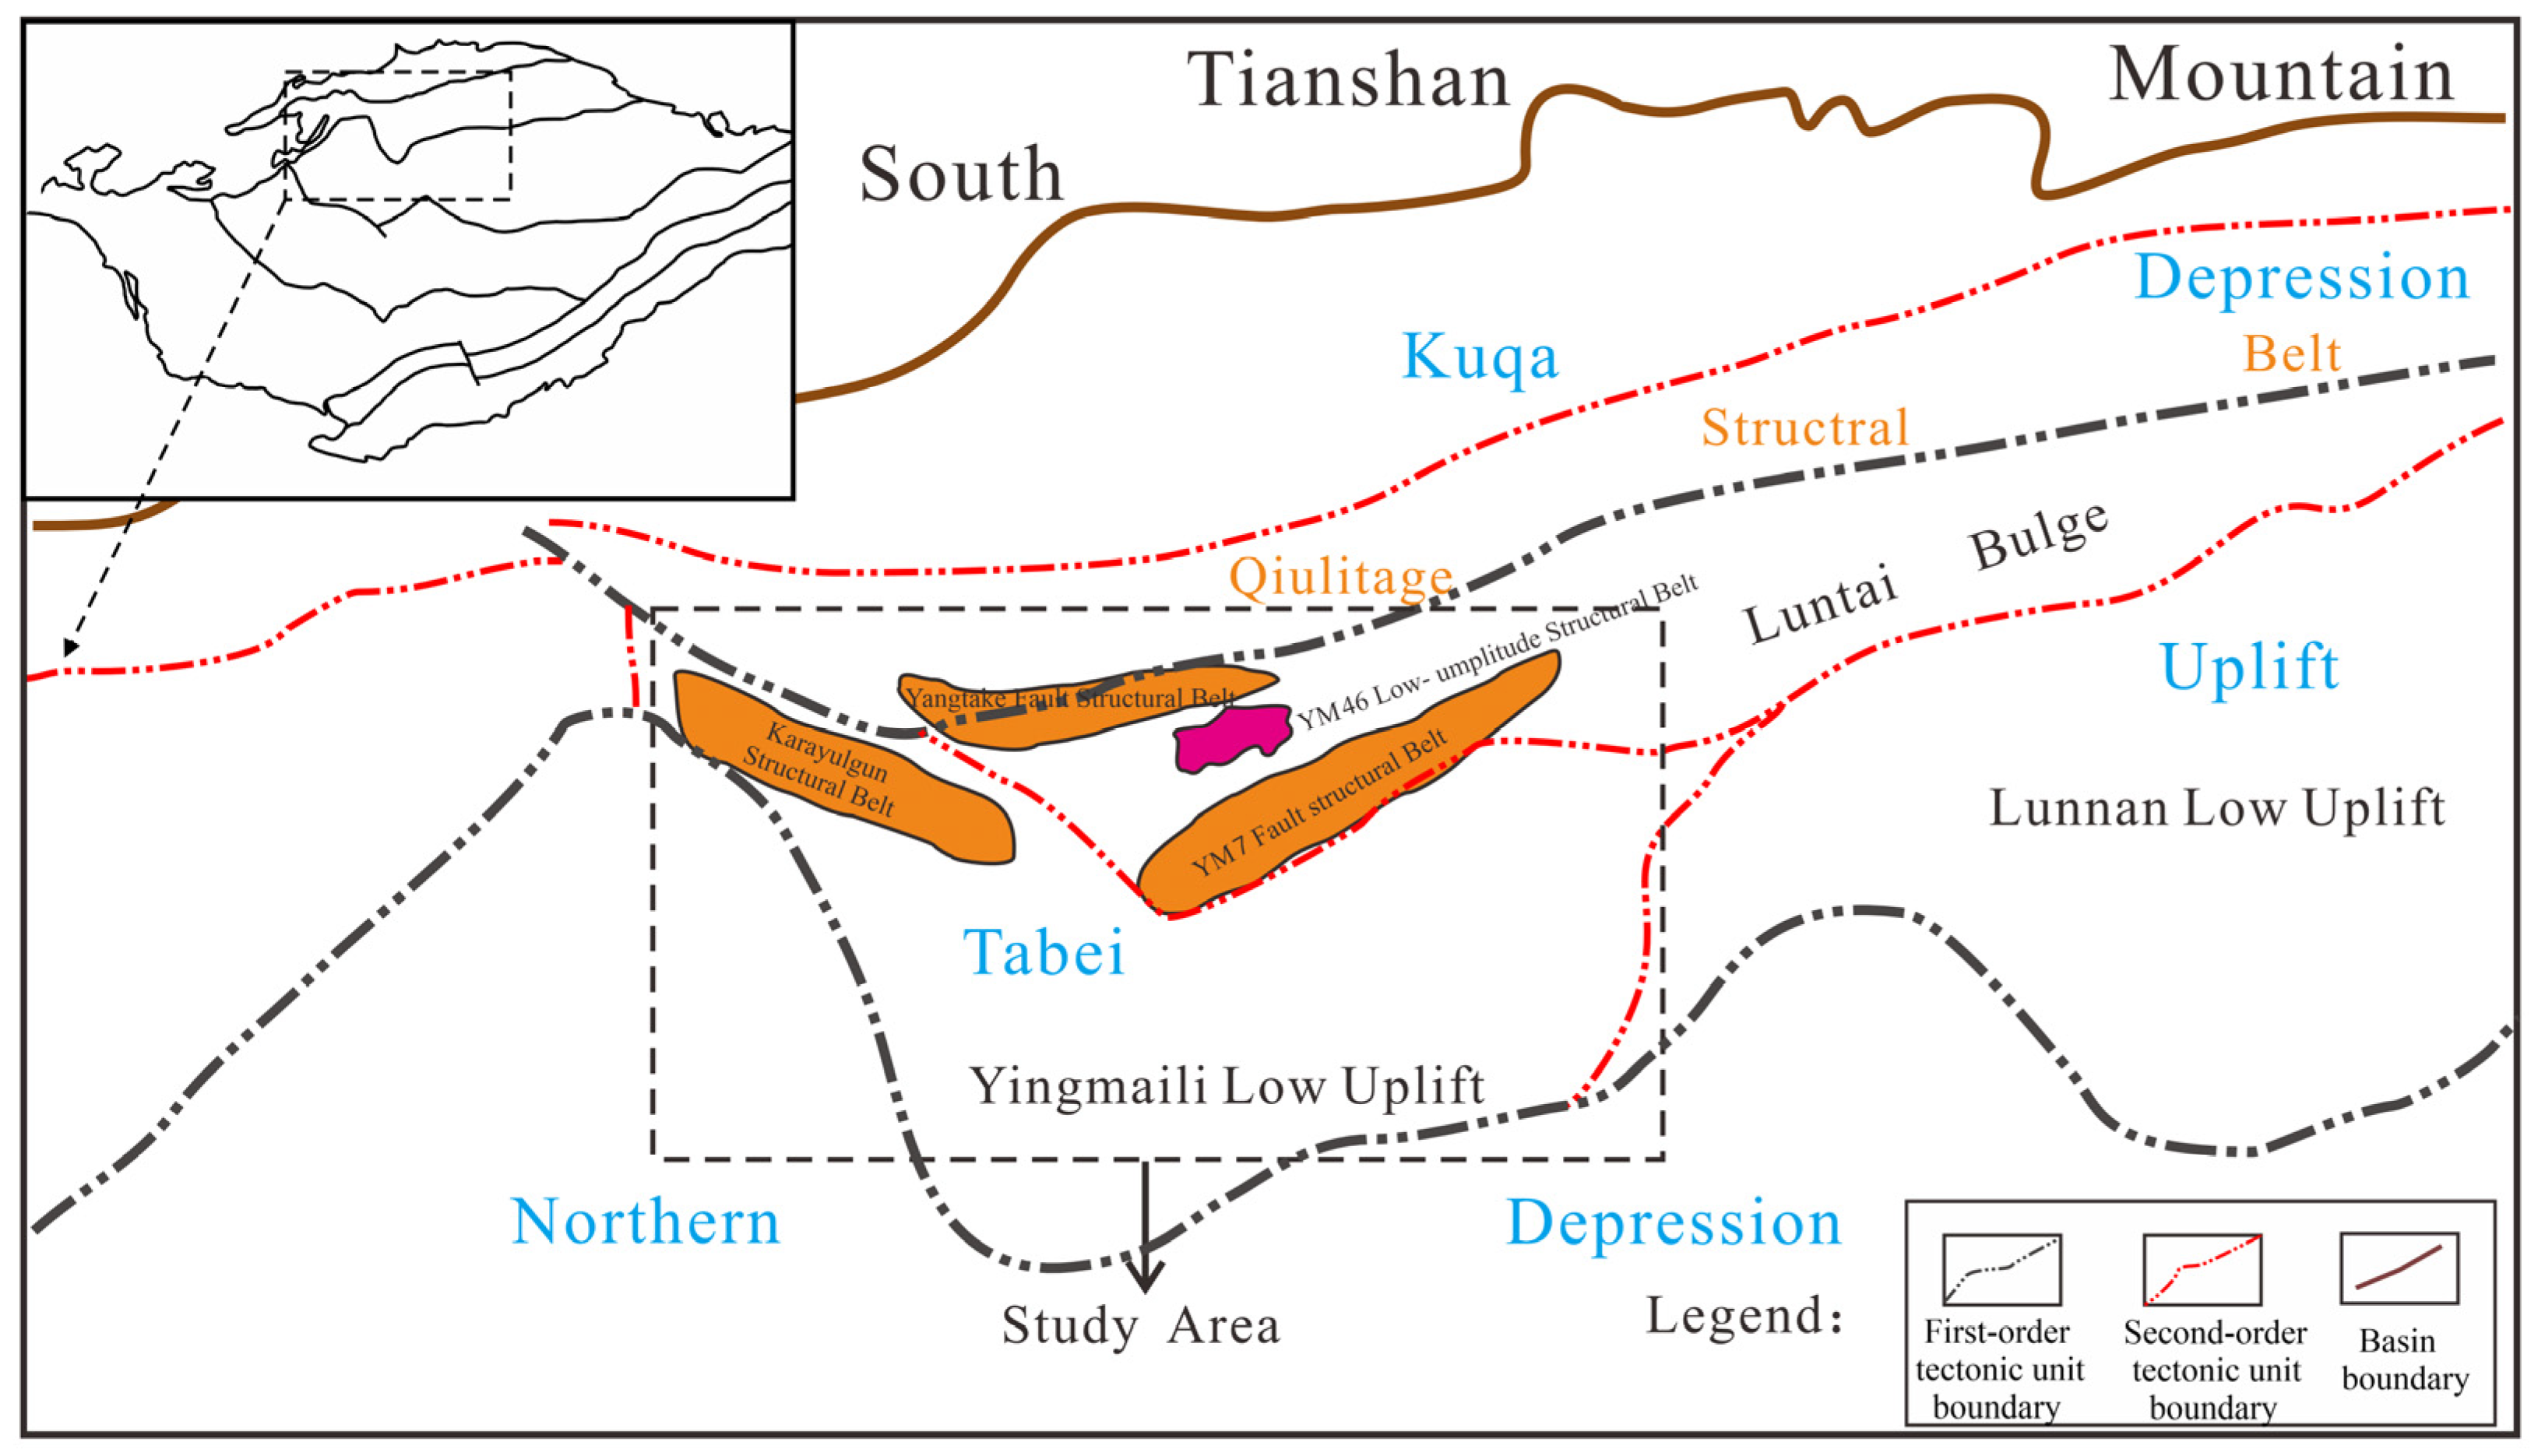
2. Geological Setting

The Tarim Basin is China’s largest oil–gas-bearing basin, with an area of about 560,000 square kilometers. It is a large, superimposed basin composed of the Paleozoic craton basin and the Mesozoic–Cenozoic foreland basin. It is in the northwest of China, surrounded by the Tianshan Mountains, Kunlun Mountains, and Altun Mountains [27,28]. The basin can be divided into seven first-order structural units: three uplifts and four depressions from north to south, which are the Kuqa Depression, Tabei Uplift, North Depression, Central Uplift, Taxinan Depression, Tadongnan Depression, and Tanan Uplift [29,30]. The research area is in the western Tabei Uplift. The Tabei Uplift is a first-order structural unit located in the north of the Tarim Basin, northwest China. Tectonically, it is the transitional area between the Kuqa foreland basin and the Craton basin. It is located between the Kuqa Depression and the North Depression. The Tabei Uplift includes three secondary-order structural units: the Yingmaili Low Uplift, Lunnan Low Uplift, and Luntai Uplift (Figure 1). From the perspective of basin formation, the Tabei Uplift is a “residual paleo uplift” of the Paleozoic craton [31,32]. After several tectonic movements, from the Cretaceous, Tabei Uplift gradually evolved into a north-dipping low slope and was completely covered by the Cretaceous Baxigai Formation after the Cretaceous Shushanhe Formation depositional period [33,34]. The research area mainly includes the Yingmaili Low Uplift and the western part of the Luntai Low Uplift area. The Karayuergun structural belt, YM7 fault structural belt, Yangtake fault structural belt, and YM46 low-amplitude structural belt are developed.
The source of sediments of the Baxigai Formation comes from the southeast of the basin [35,36,37]. The Baxigai Formation is mainly developed as a large braided river delta and lacustrine system. The delta originates from the southeast and gradually pinches out to the northwest. According to the lithological characteristics within the study area, the Baxigai Formation can be classified into two lithological sections: ① a lower sandstone section, mainly composed of sandstone layers, with thin mudstone intercalated in local areas; and ② an upper mudstone section, mainly composed of relatively thick mudstone, with locally developed thin sandstone layers of 1 m–4 m thickness (Figure 2). This set of thin sandstone layers is the oil exploration target layer of this study. According to core routine analysis experiments and logging data, it is known that thin sandstone is often found in reservoirs with medium–high porosity and medium–high permeability, with porosity mainly varying from 15% to 24%, with an average of about 20%. The permeability mainly varies from 1 to 500 mD, with an average of about 250 mD.

3. Data and Methods

The datasets used in this study were 3D seismic surveys that cover the central part of the study area (3174 km2), well-logging data from 114 boreholes, and core data from 3 boreholes. The 3D seismic surveys were in SEG-Y format, and well-logging data were in LAS format in this study. The particle size analysis data and core photographs used in this study were derived from the database of PetroChina Tarim Oilfield Company.
The characteristics of lithofacies from the different depositional sequences were described and interpreted using core descriptions and well-logging curves in the Baxigai Formation. On this basis, the vertical depositional sequences of the Baxigai Formation from the proximal to distal part were summarized to obtain a vertical combination style of sandstone–mudstone. Through comprehensive analyses of the vertical combination style of sandstone–mudstone in different zones, seismic forward modeling was conducted for determining the seismic response characteristics of different kinds of depositional sequences.
Then, wavelet decomposition was used to extract multi-wavelet series in the medium- and high-frequency bands. This process reconstructs and synthesizes new seismic data volumes, and RMS amplitude attributes were extracted. The corresponding relationship between seismic attributes and the geological characteristics of the vertical depositional sequences from well-tied profiles was investigated. With the assistance of those processes, the vertical and horizontal distributions of deposits were investigated through sedimentary facies and sandstone isopach figures. A depositional model for the Baxigai Formation thin-bedded sandstones was proposed for further hydrocarbon exploration.

4. Results

4.1. Facies Interpretation in Different Depositional Sequences

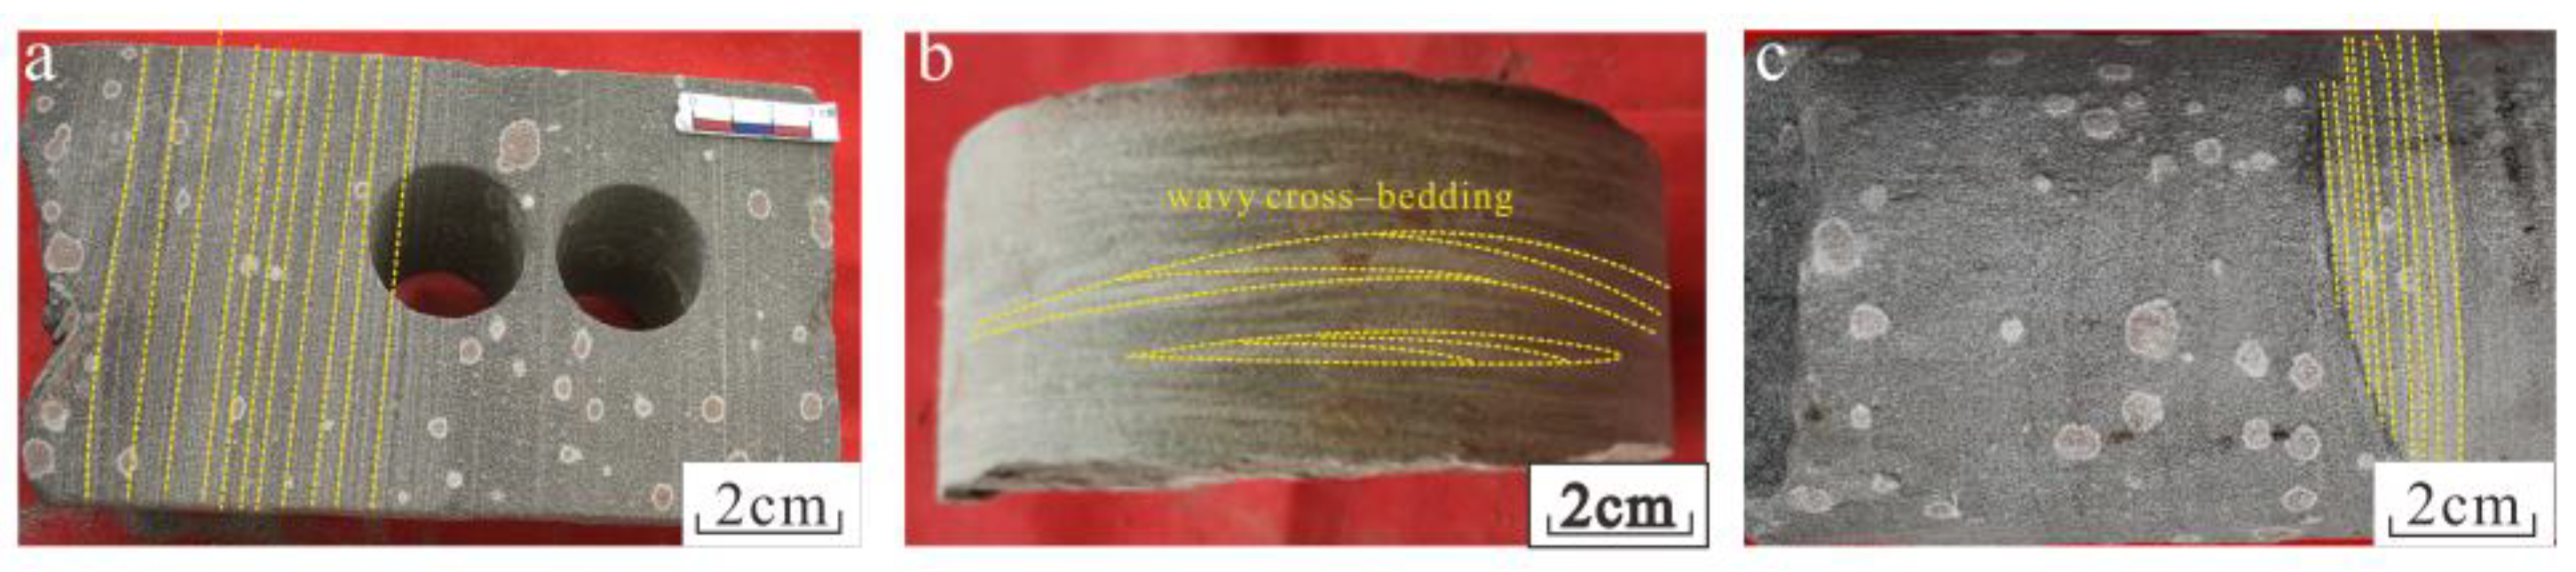
4.1.1. Depositional Facies of the Lower Sandstone Section

Lithofacies’ type and sequence combination are the main basis for distinguishing sedimentary architecture. In this study, cored wells in the Yingmaili area were comprehensively analyzed for lithofacies. Based on factors such as color, gravel diameter, and structure that can reflect sedimentary origin and environment, lithofacies of the lower sandstone section can be divided into 12 types: (1) massive bedding medium sandstone (Figure 3a) often occurs in underwater distributary channel deposits and reflects the sedimentary characteristics of tractive flow. The hydrodynamic force during the sedimentation period was strong; (2) erosion surface medium–fine sandstone (Figure 3b) is generally developed in rivers and alluvial fan environments and reflects rapid deposition under strong hydrodynamic conditions; (3) medium sandstone with rip-up mud clasts (Figure 3c) is frequently found in underwater distributary channel deposits and reflects strong hydrodynamic conditions; (4) massive bedding fine sandstone (Figure 3d) generally appears in distributary channel deposits, reflecting the sedimentary characteristics of tractive flow with strong and stable hydrodynamic forces; (5) trough cross-bedding fine sandstone (Figure 3e) generally appears in the river environment and various channel deposits; (6) medium sandstone with residual deposits (Figure 3f) usually occurs in fluvial sedimentary environments, and fine-grained sediments are carried away and coarse-grained sediments are retained, reflecting strong hydrodynamic conditions; (7) inclined bedding siltstone (Figure 3g) is more common in rivers flowing into lakes, reflecting unidirectional flow and weaker hydrodynamic conditions; (8) ripple cross-bedding siltstone (Figure 3h) is mostly deposited in the mouth bar and far sand bar of the delta front and is formed by the action of relatively high-energy water flow; (9) mudstone (Figure 3i) is mostly deposited in inter-distributary bays of delta fronts and formed in a clean water environment; (10) massive bedding siltstone (Figure 3j) generally appears on top of underwater distributary channel deposition; (11) parallel bedding fine sandstone (Figure 3k) often appears in underwater distributary channel deposition. The hydrodynamic force during the sedimentation period was strong and stable; (12) scouring and filling structure medium sandstone (Figure 3l) is generally developed in rivers and alluvial fan environments and undergoes rapid sedimentation under strong hydrodynamic conditions.
According to the core description, the lower sandstone section of the Baxigai Formation in the study area is formed in the braided river delta sedimentary environment, and the sedimentary facies such as subaqueous distributary channel, mouth bar, and inter-distributary bay can be identified (Figure 3).
The subaqueous distributary channel is mainly composed of gray-brown fine sandstone. Typical sedimentary structures include scouring surfaces, massive bedding, and parallel bedding (Figure 3). The particle size probability cumulative curve mainly consists of a saltation transport section and a suspension transport section (Figure 4c).
Taking wells YD701 and Y46-1 as examples, the content of saltation transport is very high (>90%), and the sandstone is well sorted, with a total suspension of less than 10%. The sandstone deposition is mainly characterized by saltation transport (Figure 4c). The wireline log curves are mainly box-shaped and bell-shaped (Figure 4a,b).
The river mouth bar is mainly composed of brown fine sandstone–siltstone, with developed inclined bedding, and ripple cross-bedding. (Figure 3). The particle size gradually coarsens upwards. The logging curve is mainly funnel-shaped (Figure 4b). The inter-dis–tributary bay is mainly brown mudstone with thin thickness, often alternating with siltstone (Figure 4b).

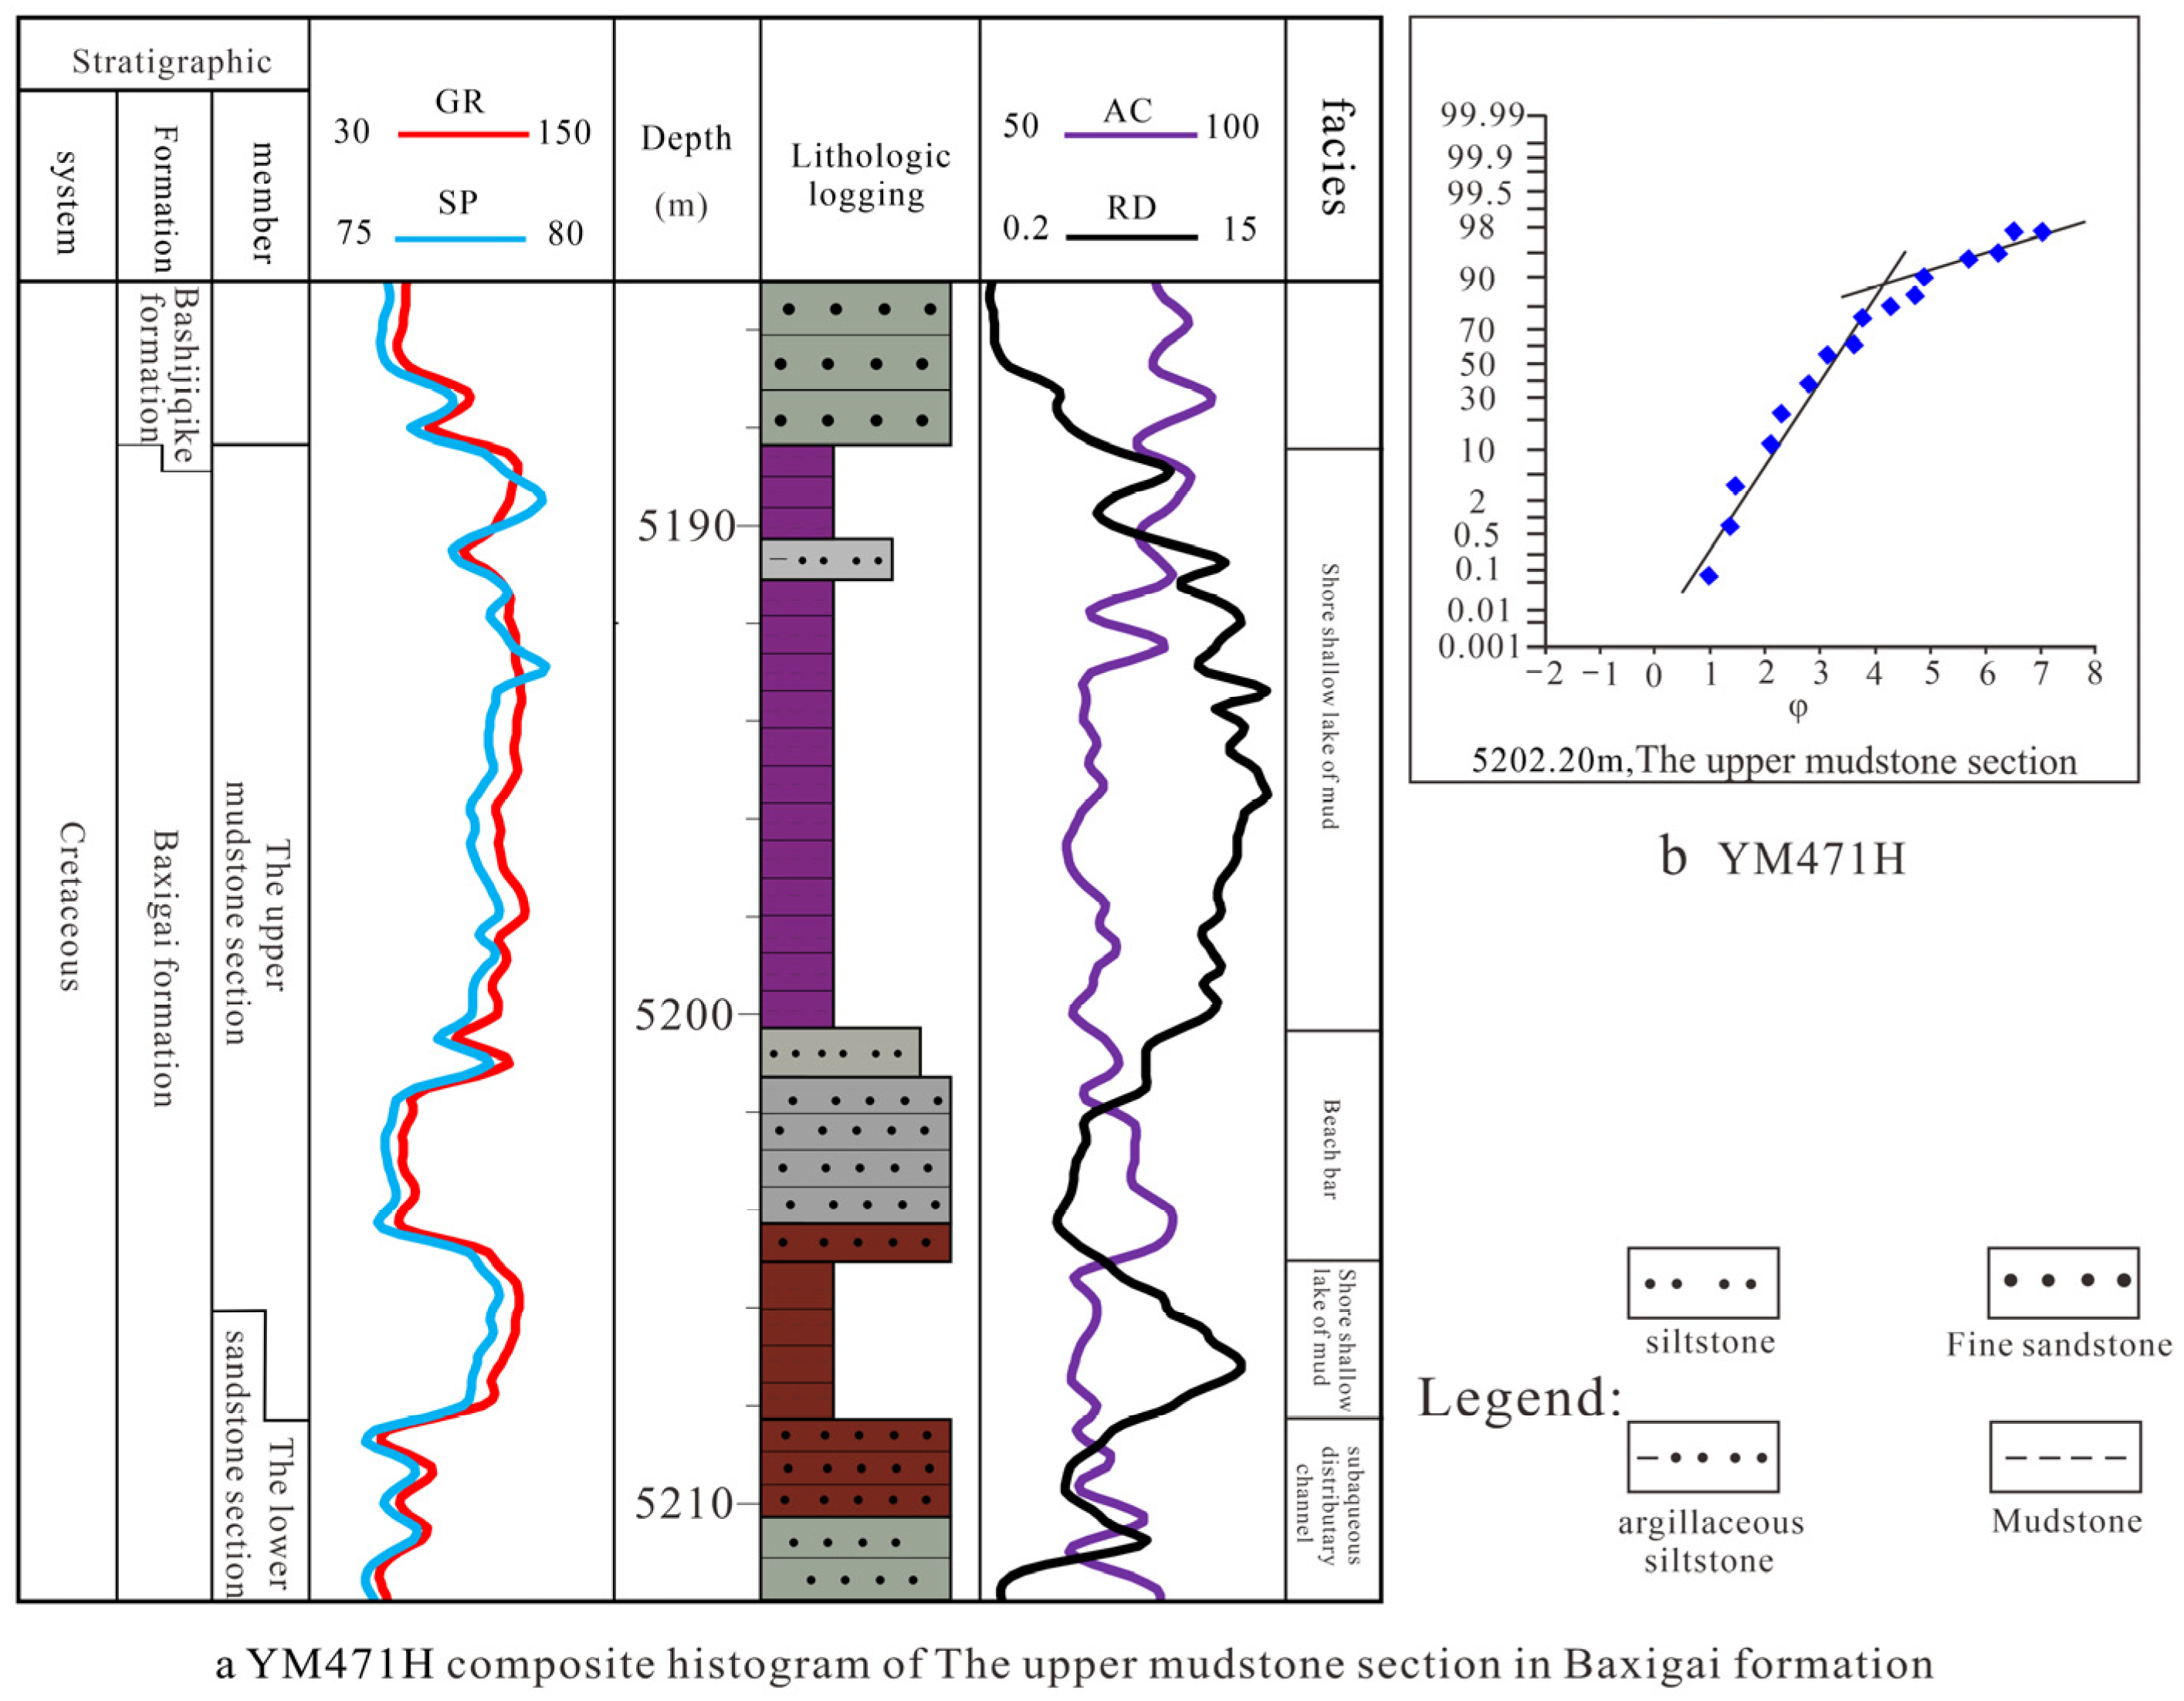
4.1.2. Depositional Facies of the Upper Mudstone Section

Lithofacies of the upper mudstone section can be divided into Three types: (1) parallel bedding siltstone (Figure 5a) represents a high-energy depositional environment, and the hydrodynamic force during the sedimentation period was strong and stable; (2) wavy cross-bedding siltstone (Figure 5b) is formed by the action of strong energy water flow, affected by waves and tides, and is mostly deposited in lake environments; and (3) massive bedding–Parallel bedding fine sandstone (Figure 5c) for which the hydrodynamic force during the sedimentation period was strong.
The thickness of the sand body in the upper mudstone section of the study area is relatively thin (1 m–4 m) (Figure 6a), which is significantly different from the lower sandstone section. The sandstone develops in lacustrine mudstone as interlayers. The lithology is mainly light-brown fine sandstone, with the internal development of wave-formed sand cross-bedding, parallel bedding, and massive structure. The probability accumulation curve of particle size is mainly composed of a two-stage equation, which mainly develops two populations: saltation and suspension. The hydrodynamic force is relatively strong, and it is often developed in the beach bar sand body, with good sorting (Figure 6b). The logging curves are mainly funnel-shaped and composite box-shaped. In most areas of the study area, only single-stage sand bodies are developed vertically in the upper mudstone section. According to the above analysis, clastic rock beach bar deposits were formed in the upper mudstone member of the Baxigai Formation in the study area.

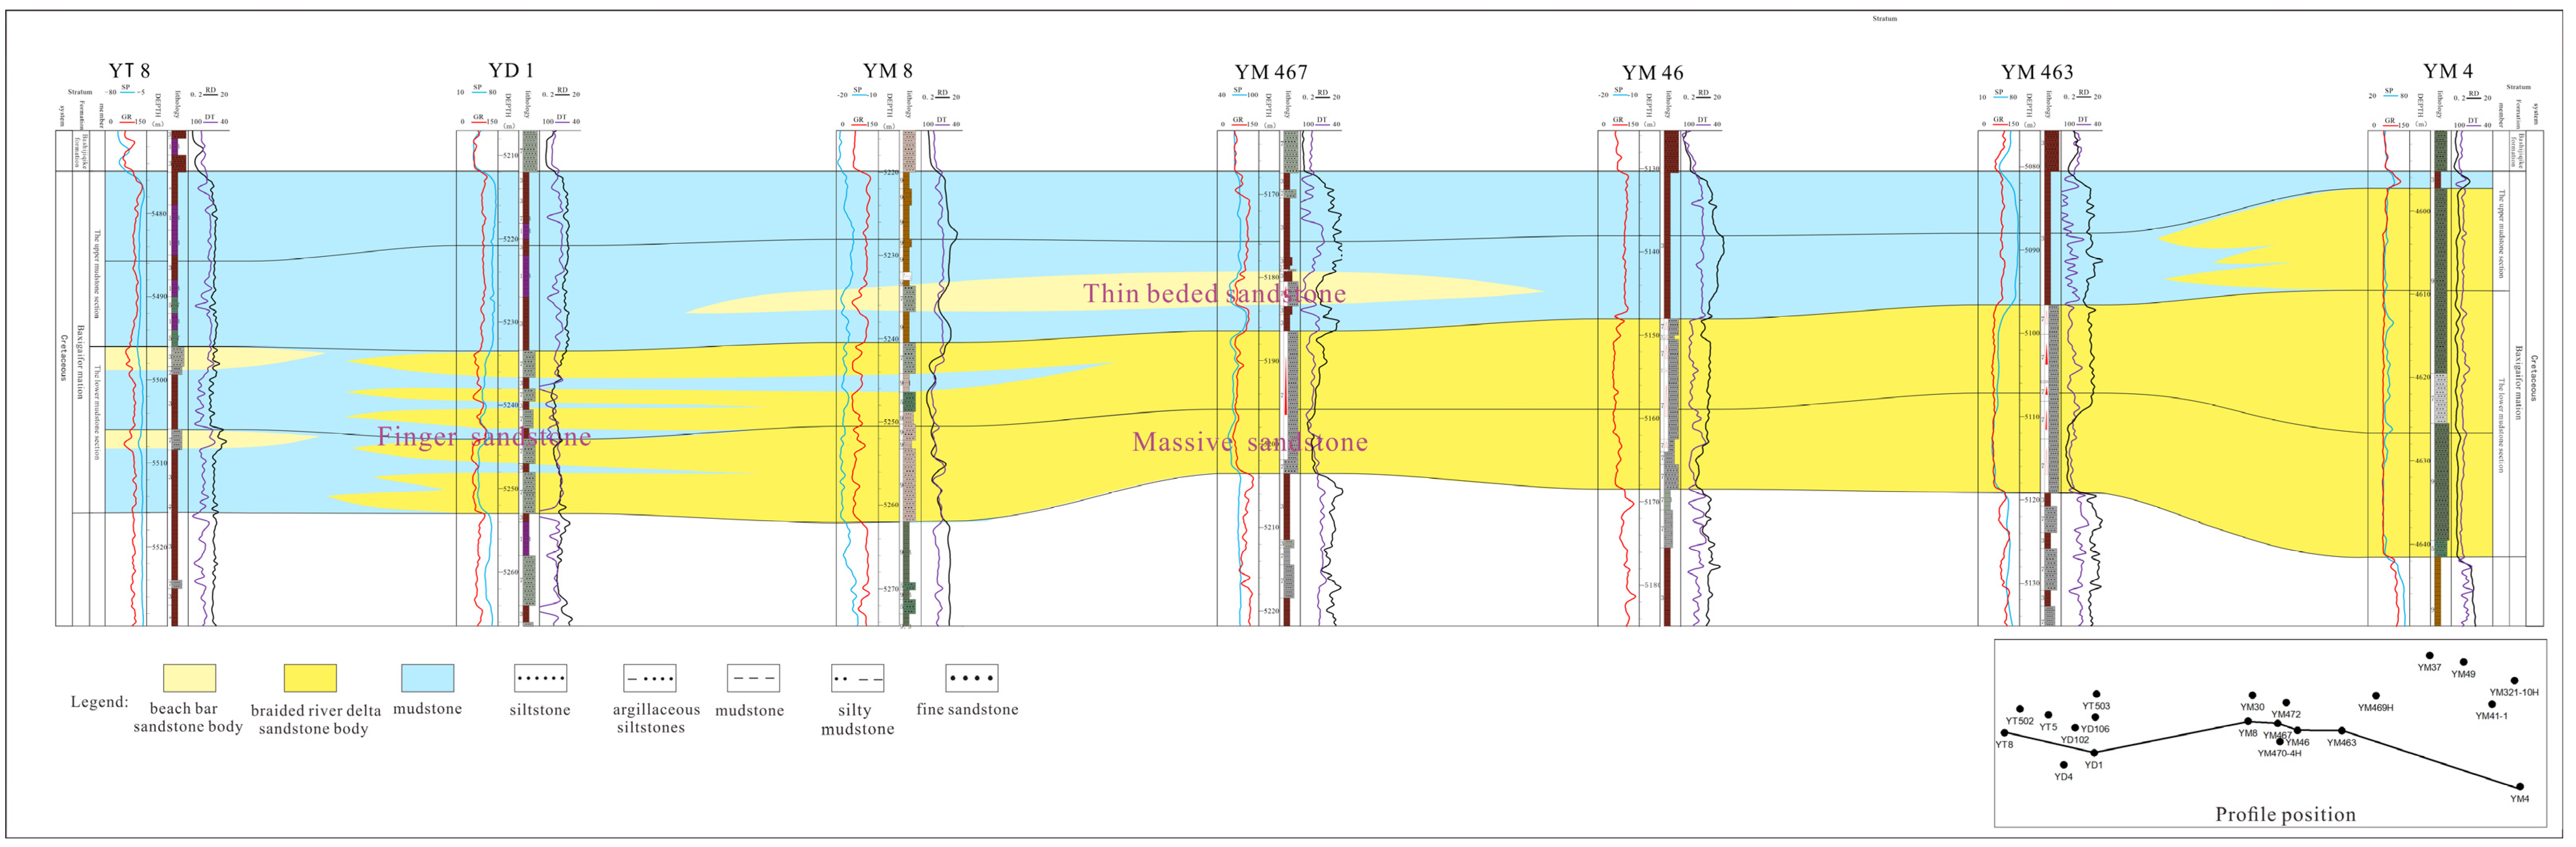
4.1.3. Vertical Style of Depositional Sequences

Through the comparison of typical sedimentary profiles from proximal to distal direction, from the Yingmaili to the Yudong area, the lower sandstone section evolved from a large set of sandstone to finger-shaped sand with mudstone inter-bedded, isolated vertically. Among them, the thickness of the lower sandstone in the Yingmaili area is about 20 m (Wells YM46 and YM463). From the west of Well YM467, sandstone is gradually inter-bedded by mudstone. In the Yudong area (Well YD1), the sandstone gradually varies into a finger-shaped distribution, with a total thickness of about 15 m. In the Yangta area (Well YT8), the sand body at the front of the braided river delta is transformed by lake waves into the beach bar sand body, and several sets of sand bodies are developed vertically with thin thickness; the thickness of the single-stage sand body is about 2–4 m (Figure 7).
The distribution characteristics of sand bodies in the upper mudstone are significantly different from those in the lower sandstone section. Delta front sand deposits are developed in the Well YM4 area in the southwest of the study area. After entering the Well YM463 area in the northwest distal direction of the delta deposition, the sandstone development significantly pinched out, mainly consisting of shallow lake mudstone deposition. Shallow lake thin-layer beach bar sand bodies are developed near Well YM467-YM8, with a thickness of about 1 m–4 m. The sand bodies have a small distribution range and poor continuity and are interbedded with mudstone vertically. There are different vertical combination styles of sand and mudstone from the proximal to the distal area of the delta-lacustrine deposition (Figure 7).

4.2. Seismic Responses of Different Vertical Depositional Sequences

4.2.1. Forward Simulation Based on Different Sand and Mudstone Combination Styles

Based on the above understanding of the development style of sandstone–mudstone associations, seismic forward modeling was conducted to clarify the seismic response characteristics of the sandstone bodies. Firstly, geological models were designed based on the development pattern of sand bodies to determine the lithology parameters. From the distribution profile of the sand bodies mentioned above (Figure 7), the lower sandstone section develops with block-shaped–finger-shaped sand layers, and the thickness varies from southeast to northwest. The upper mudstone section gradually thickens from southeast to northwest and locally develops with thin layers of sandstone.
A corresponding model was constructed based on the distribution characteristics of typical sand body profiles (Figure 8a), clarifying the lithological combination of sand and mudstone, stratigraphic structure, distribution patterns, and their velocity parameters. According to multiple well data statistics, the average thickness of the sandstone (top plate) of the Bashijiqike Formation, the mudstone (bottom plate) of the Baxigai Formation, and the mudstone (bottom plate) of the Shushanhe Formation is set at 40 m. The average thickness of the proximal massive sandstone, massive sandstone, and distal finger-shaped sand of the Baxigai Formation are 38 m, 20 m, and 14 m, respectively. The thickness of the thin layer of sand in the upper mudstone section is 3 m. In addition, the sandstone velocity is set to 3600 m/s~3700 m/s, and the mudstone velocity is 3900 m/s~4000 m/s. Due to the good reservoir properties of the sandstone in the study area, the sandstone velocity is smaller than that of the mudstone. From the geological model profile, it can be seen that the vertical combination relationship of the Baxigai Formation can be divided into five types of combination models from southeast to northwest. Model 1 is a thin layer of upper mudstone and thick sandstone (Well YM4), Model 2 is a medium-thick layer of upper mudstone and a medium-thick layer of sandstone (Wells YM46, YM463, and YM468), Model 3 is a medium-thick layer of upper mudstone, a thin layer of sandstone and massive sand (Well YM467), Model 4 is a medium-thick layer of upper mudstone, a thin layer of sandstone and finger-shaped sand (Well YM8), and Model 5 is a thick layer of upper mudstone and finger-shaped sand (Well YD1).
Based on this, the forward modeling and actual seismic well profile are divided into four zones (Figure 8b,c), clarifying the corresponding relationship and amplitude response characteristics between each zone and the geological model (Figure 9). In Zone 1, which corresponds to Model 1 (thin-layer mudstone and lower thick sandstone), there is a weak peak amplitude at the top of the thick sand. Zone 2 corresponds to the range of Model 2 (medium-thick upper mudstone and lower medium-thick sand), where the peak and valley amplitudes of block sand waves are the strongest. In Zone 3, corresponding to Model 3 (medium-thick upper mudstone, thin sandstone, and lower thick sandstone) and Model 4 (medium-thick upper mudstone, thin sandstone, and lower finger-shaped sand), the peak and valley amplitudes of the thin sandstone section are relatively weak compared with those of Zone 2. In Zone 4, corresponding to Model 5 (thick mudstone and finger-shaped sandstone), the amplitude of the wave peak below the finger-shaped sandstone section is weaker. The important exploration target layer in the study area, the thin sand layer in the upper mudstone section of the Baxigai Formation, is mainly distributed in Zone 3.

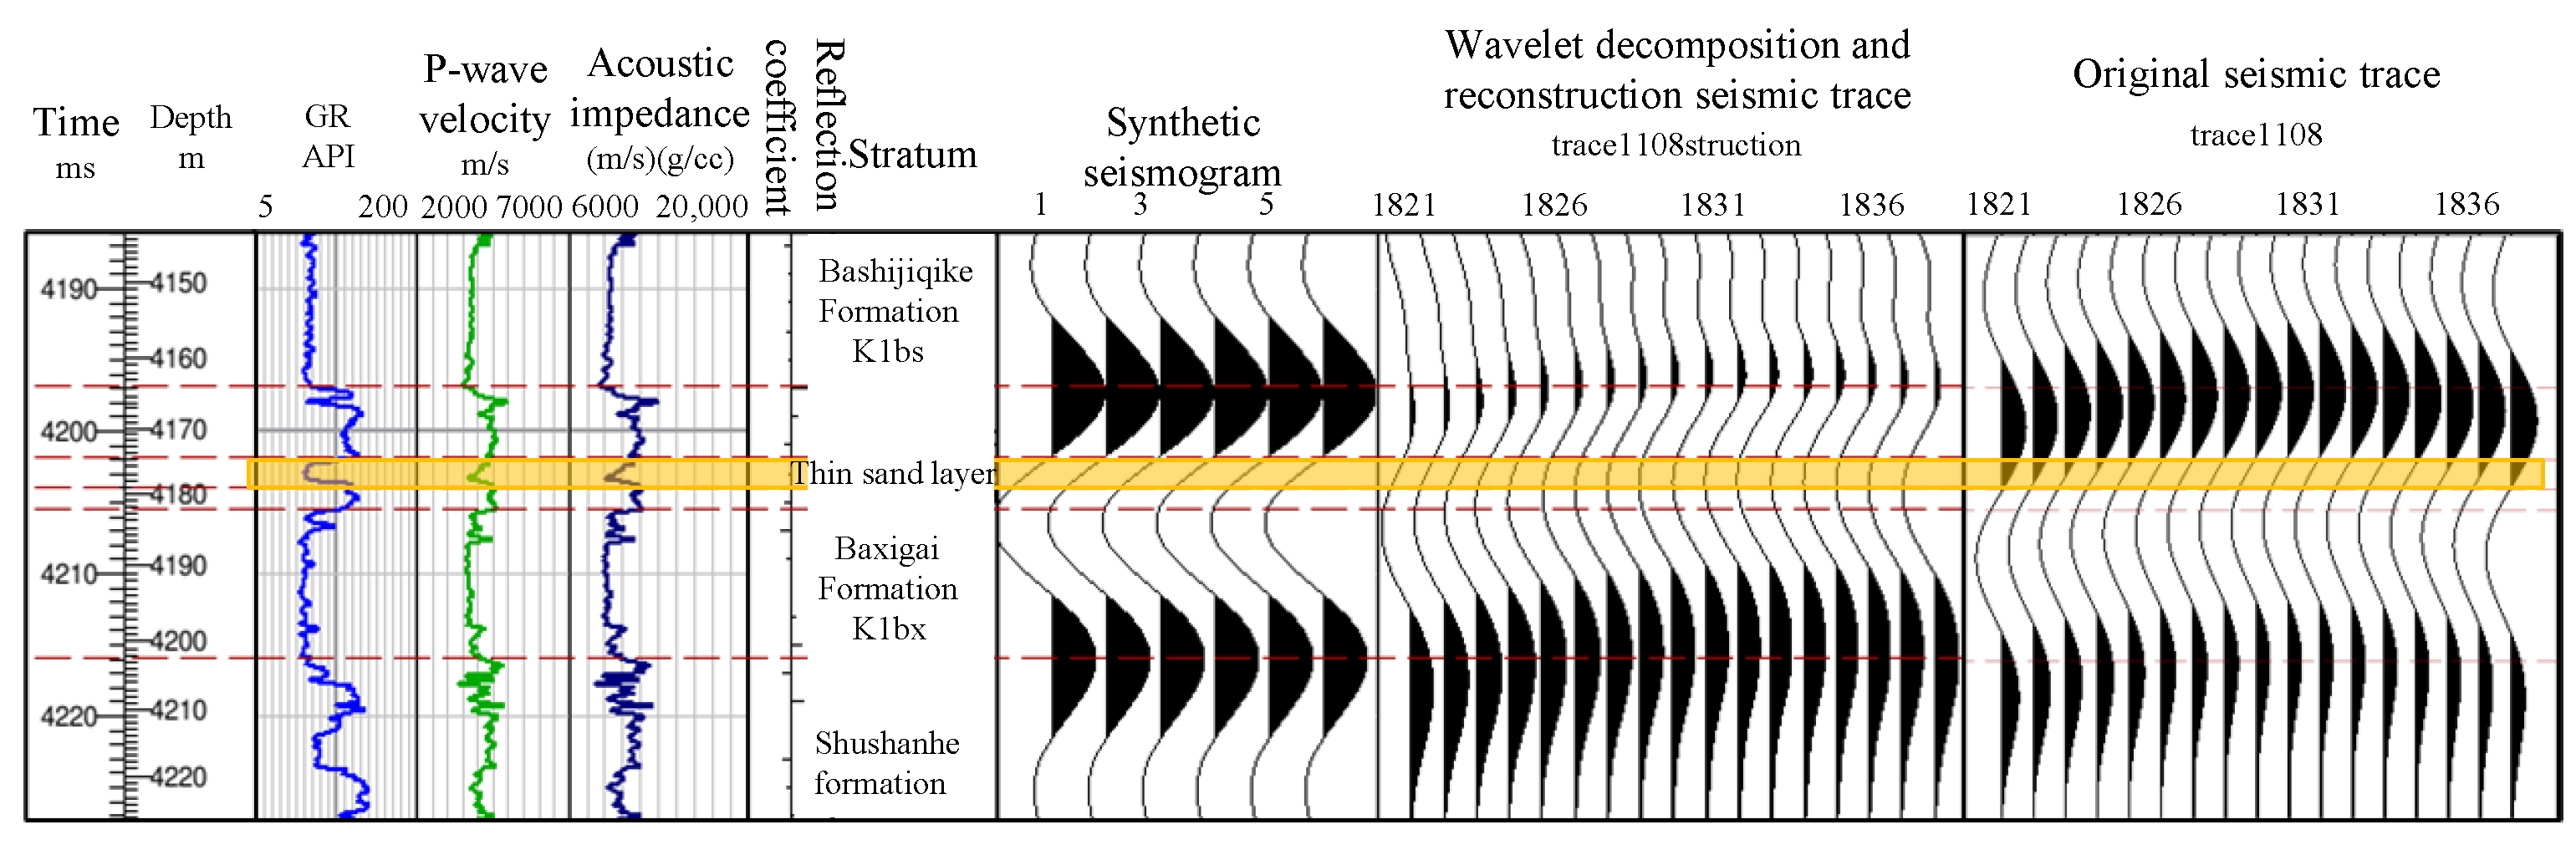
4.2.2. Wavelet Decomposition and Reconstruction

The basic principle of wavelet decomposition and reconstruction technology is to use seismic time–frequency decomposers to decompose seismic traces into wavelet sets with different main frequencies and time components in the time and frequency domains. Then, for different geological targets, single-wavelet sets with different frequencies or a certain frequency band are selected, and finally, based on multi-wavelet convolution models, new seismic profiles or data volumes are reconstructed and generated [38,39]. The seismic traces decomposed and reconstructed using wavelet transform are more conducive to the precise interpretation of geological targets, and the seismic attributes extracted based on reconstructed seismic traces are more conducive to identifying complex hidden reservoirs, improving the accuracy of reservoir prediction.
In this study, wavelet decomposition and reconstruction technology based on a matching pursuit algorithm were used to process the original seismic trace and obtain the reconstructed seismic trace. According to the thin reservoir target information of the known wells, the original seismic traces in the study area were decomposed into a series of wavelet sets using the matching pursuit method, and the multi-wavelet series in the medium- and high-frequency bands, which can reflect the thin reservoir, was selected from them. The wavelets in the medium- and low-frequency bands (less than 30 Hz) related to the strong reflection caused by lithologic changes were discarded, and new seismic traces were reconstructed.
On a single well, the seismic calibration of Well YM466 was selected for comparative analysis and presentation of results (Figure 10). Due to the significant differences in lithology, velocity, and wave impedance between the sandstone of the Bashijiqike Formation (high-porosity sandstone with lower velocity) and the upper mudstone section of the Baxigai Formation, the synthesized records and actual seismic peak amplitudes of the top boundary of the Baxigai Formation are both strong. However, the thin sandstone of the upper mudstone section is close to the lithological interface, making the seismic responses of the thin sandstone (marked in yellow color) hidden in the strong wave-peak reflection. Therefore, it is difficult to identify the reflection characteristics of thin sandstone from actual seismic traces. Through comparison, the seismic traces obtained via wavelet decomposition and reconstruction eliminate the blocking effect of strong wave-peak reflection at the top of the Baxigai Formation. This highlights the seismic amplitude variation characteristics of lithological association related to thin sandstone layers (Models 3 and 4) (Figure 10). It is also more conducive to tracking and identifying thin reservoirs using seismic data.
Considering the profiles, the wavelet decomposition and reconstruction profile with the same well section position as the forward model profile (Figure 8) was selected for comparison with the original seismic profile (Figure 11).
Well YM8 and Well YM462 in the figure are areas of thin-bedded sandstone development. After wavelet decomposition and reconstruction, the strong peak reflection amplitude at the top of the Baxigai Formation restructuring is overall weakened. From Well YM46 to Well YM463, there is no thin-bedded sandstone, and the wave-peak reflection amplitude is overall strengthened (Figure 11a). Therefore, the amplitude of the seismic reflection corresponding to different lithological combinations has significant differences. Correspondingly, from the original seismic profile, the top of the Baxigai Formation has a single strong wave-peak event, and lateral tracking revealed that the change in the amplitude of the top wave peak was relatively small, making it difficult to identify the amplitude change characteristics caused by lithological combination changes (Figure 11b). This method improves the visual resolution of thin sand layer identification.

4.2.3. RMS Amplitude Attribute

Based on wavelet decomposition and reconstruction of seismic data volume, the RMS amplitude attribute of the upper mudstone section (including thin sandstone) was extracted to clarify the amplitude attribute characteristics related to the lithology of thin sandstone in the upper mudstone section. Through the comparison of attribute plane features in the study, the RMS amplitude attribute extracted from the 15 ms time window below the top boundary of the Baxigai Formation could reflect lithological variation (Figure 12). The RMS amplitude plane distribution has obvious zonal characteristics, and its amplitude value changes are consistent with the seismic forward modeling results (Figure 8c).
From northwest to southeast, the amplitude attribute is divided into four-zone (red and yellow; low-value zone), three-zone (green; high-value zone), two-zone (blue and light blue; high-value zone), and one-zone (green, red, and yellow; low-value zone) areas. The three-zone area is the thin-bedded sandstone development zone (beach bar) in the upper mudstone section of the Baxigai Formation. The distribution boundary is shown in the figure (Figure 12). Based on the forward simulation results, it can be concluded that the RMS amplitude attribute extracted from the wavelet decomposition and reconstruction data volume can better reflect the distribution characteristics of thin-bedded sandstone.

5. Discussion

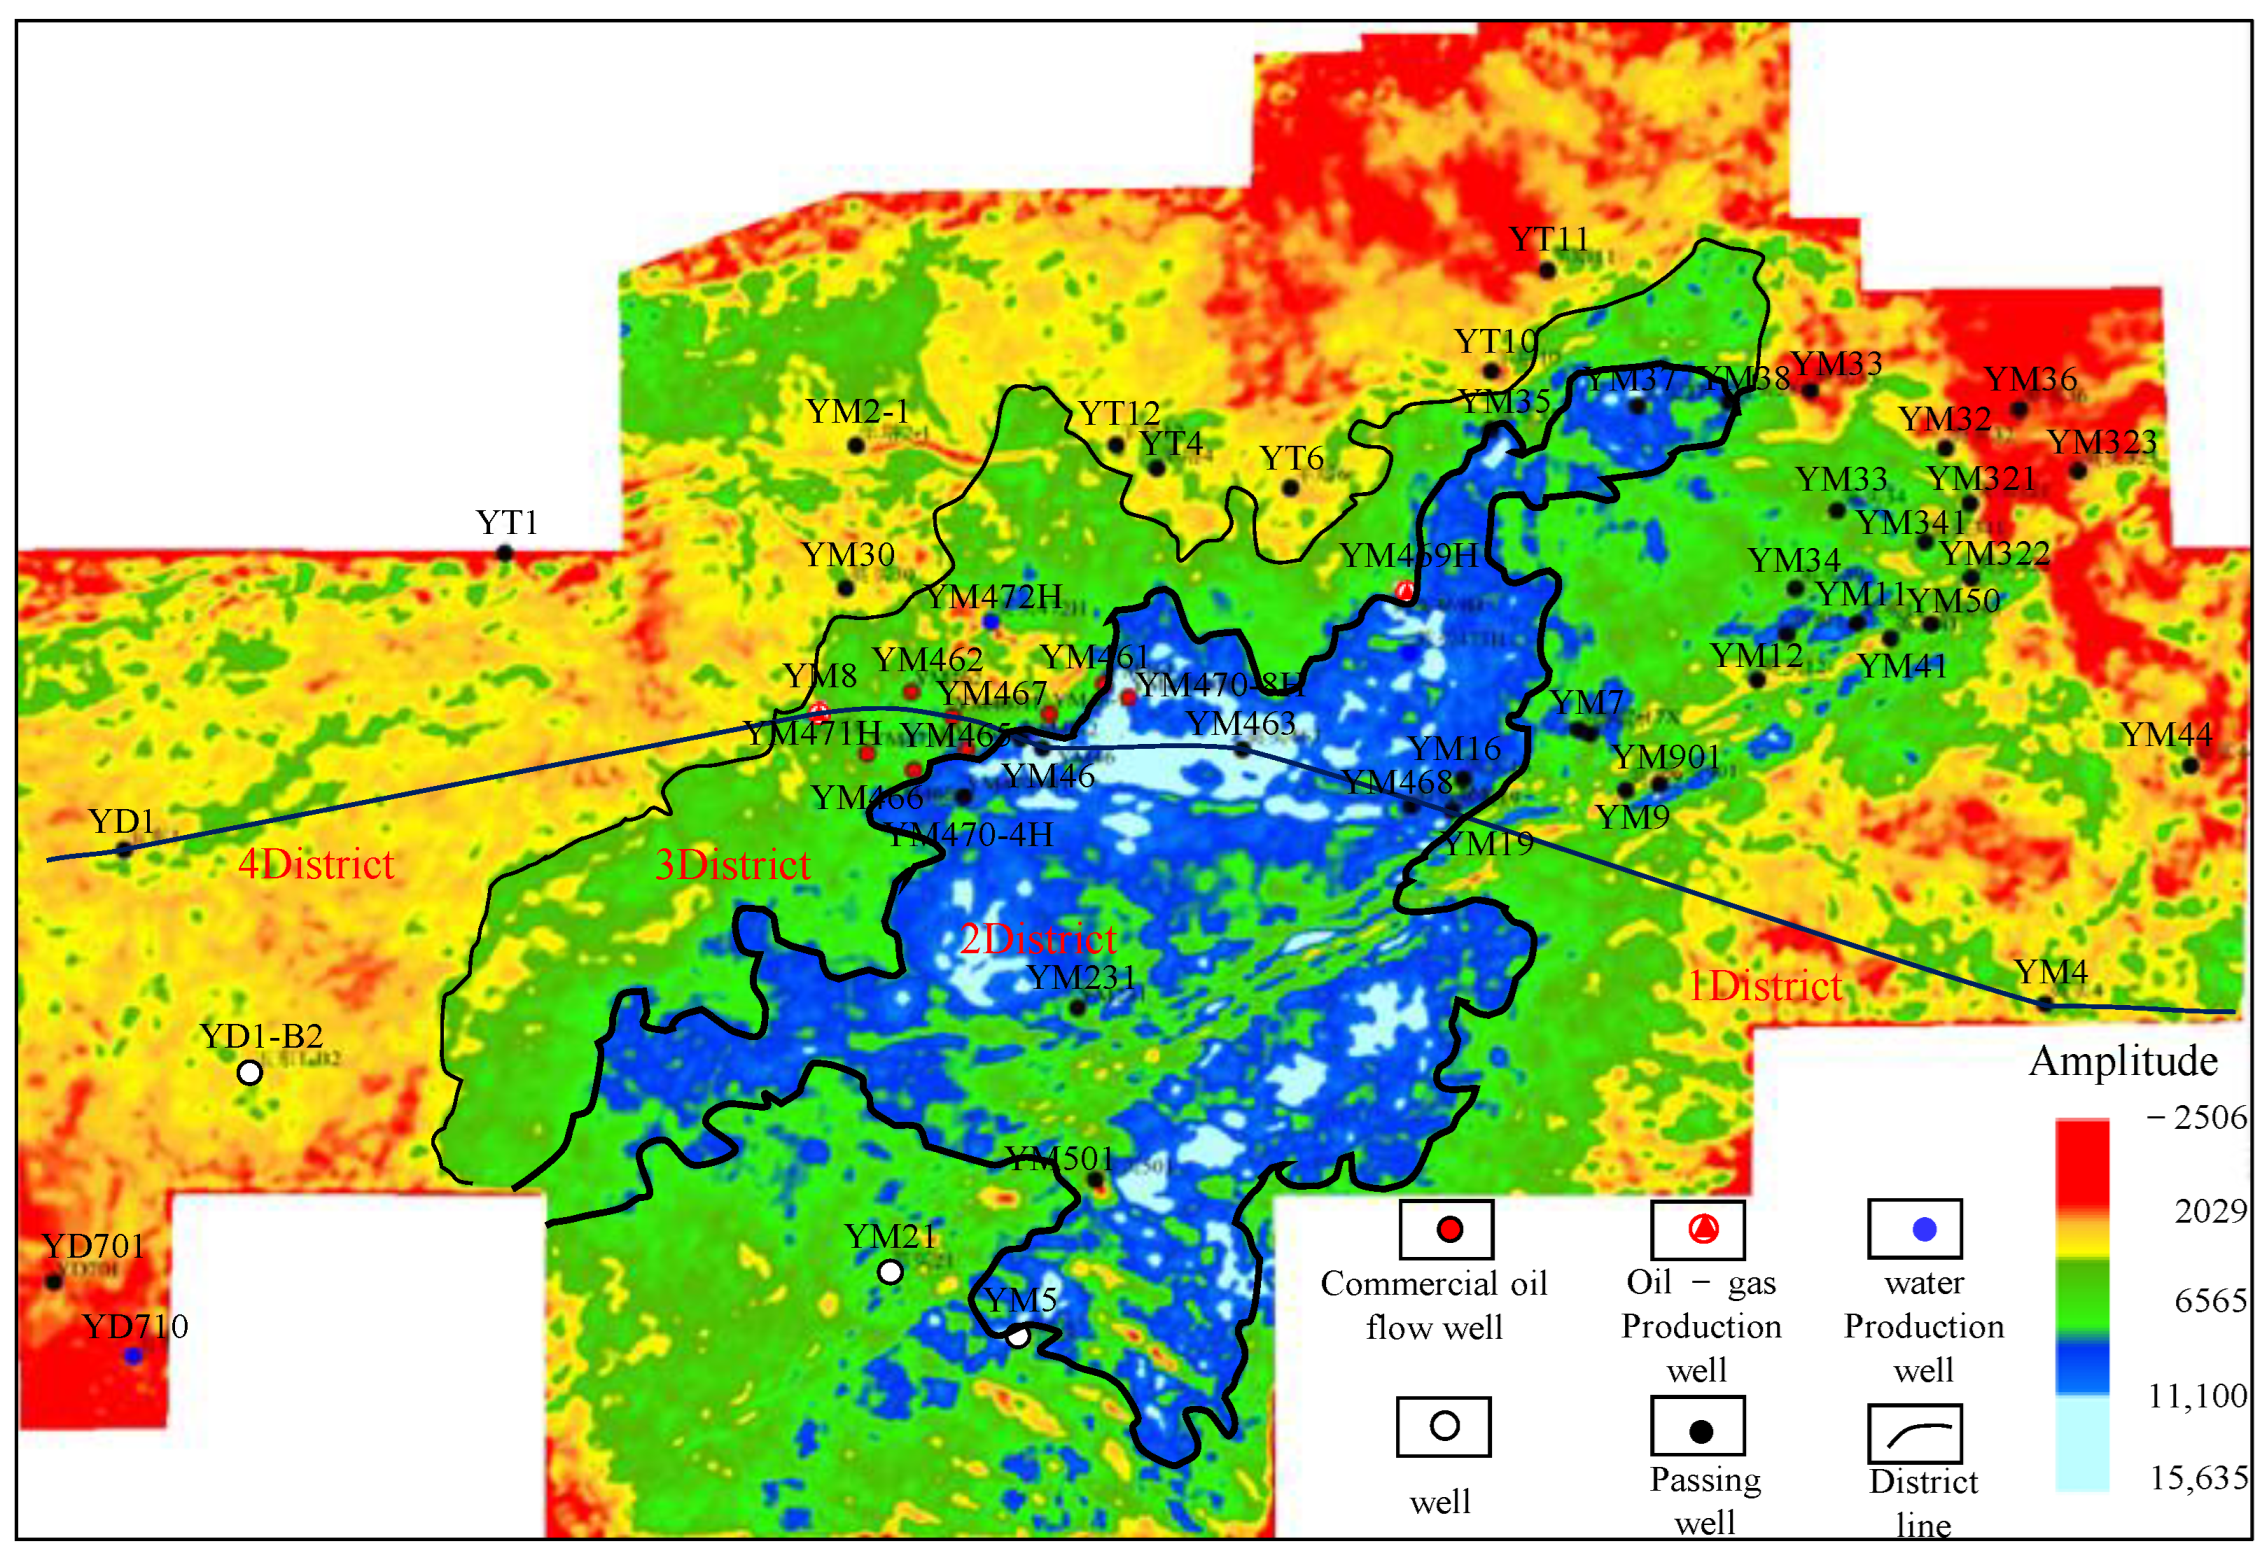
5.1. Distribution Characteristics of Sandstone in District

Based on the information gained from the RMS amplitude attribute extracted through wavelet decomposition processing, combined with the sedimentary facies interpretation, the lateral boundaries of sandstone were identified. This process also allowed us to obtain sedimentary facies distribution of the lower sandstone section and the upper mudstone section of the Baxigai Formation in the study area (Figure 13). Compared with previous studies based on seismic attribute extraction in the Baxigai Formation [28], this study focuses on descriptions of the thin-bed sandstone reservoirs on a finer scale to obtain more details of the deposition.
During the deposition of the lower sandstone section of the Baxigai Formation in the study area, the braided river delta had a wide sedimentary range. The delta plain and delta front were distributed from the southeast to the northwest. The deltaic sand body was distributed in a lobed shape (Figure 13a), with a large scale. During the sedimentary period of the upper mudstone section, the delta in the study area was retrograded, and the development range and scale of the sand body were significantly reduced (Figure 13b). The delta front sand body transformed into a thin layer of beach bar sandstone, mainly distributed in a northeast–southwest trending strip. The sandstone was in an isolated state surrounded by shallow lake mudstone deposits.

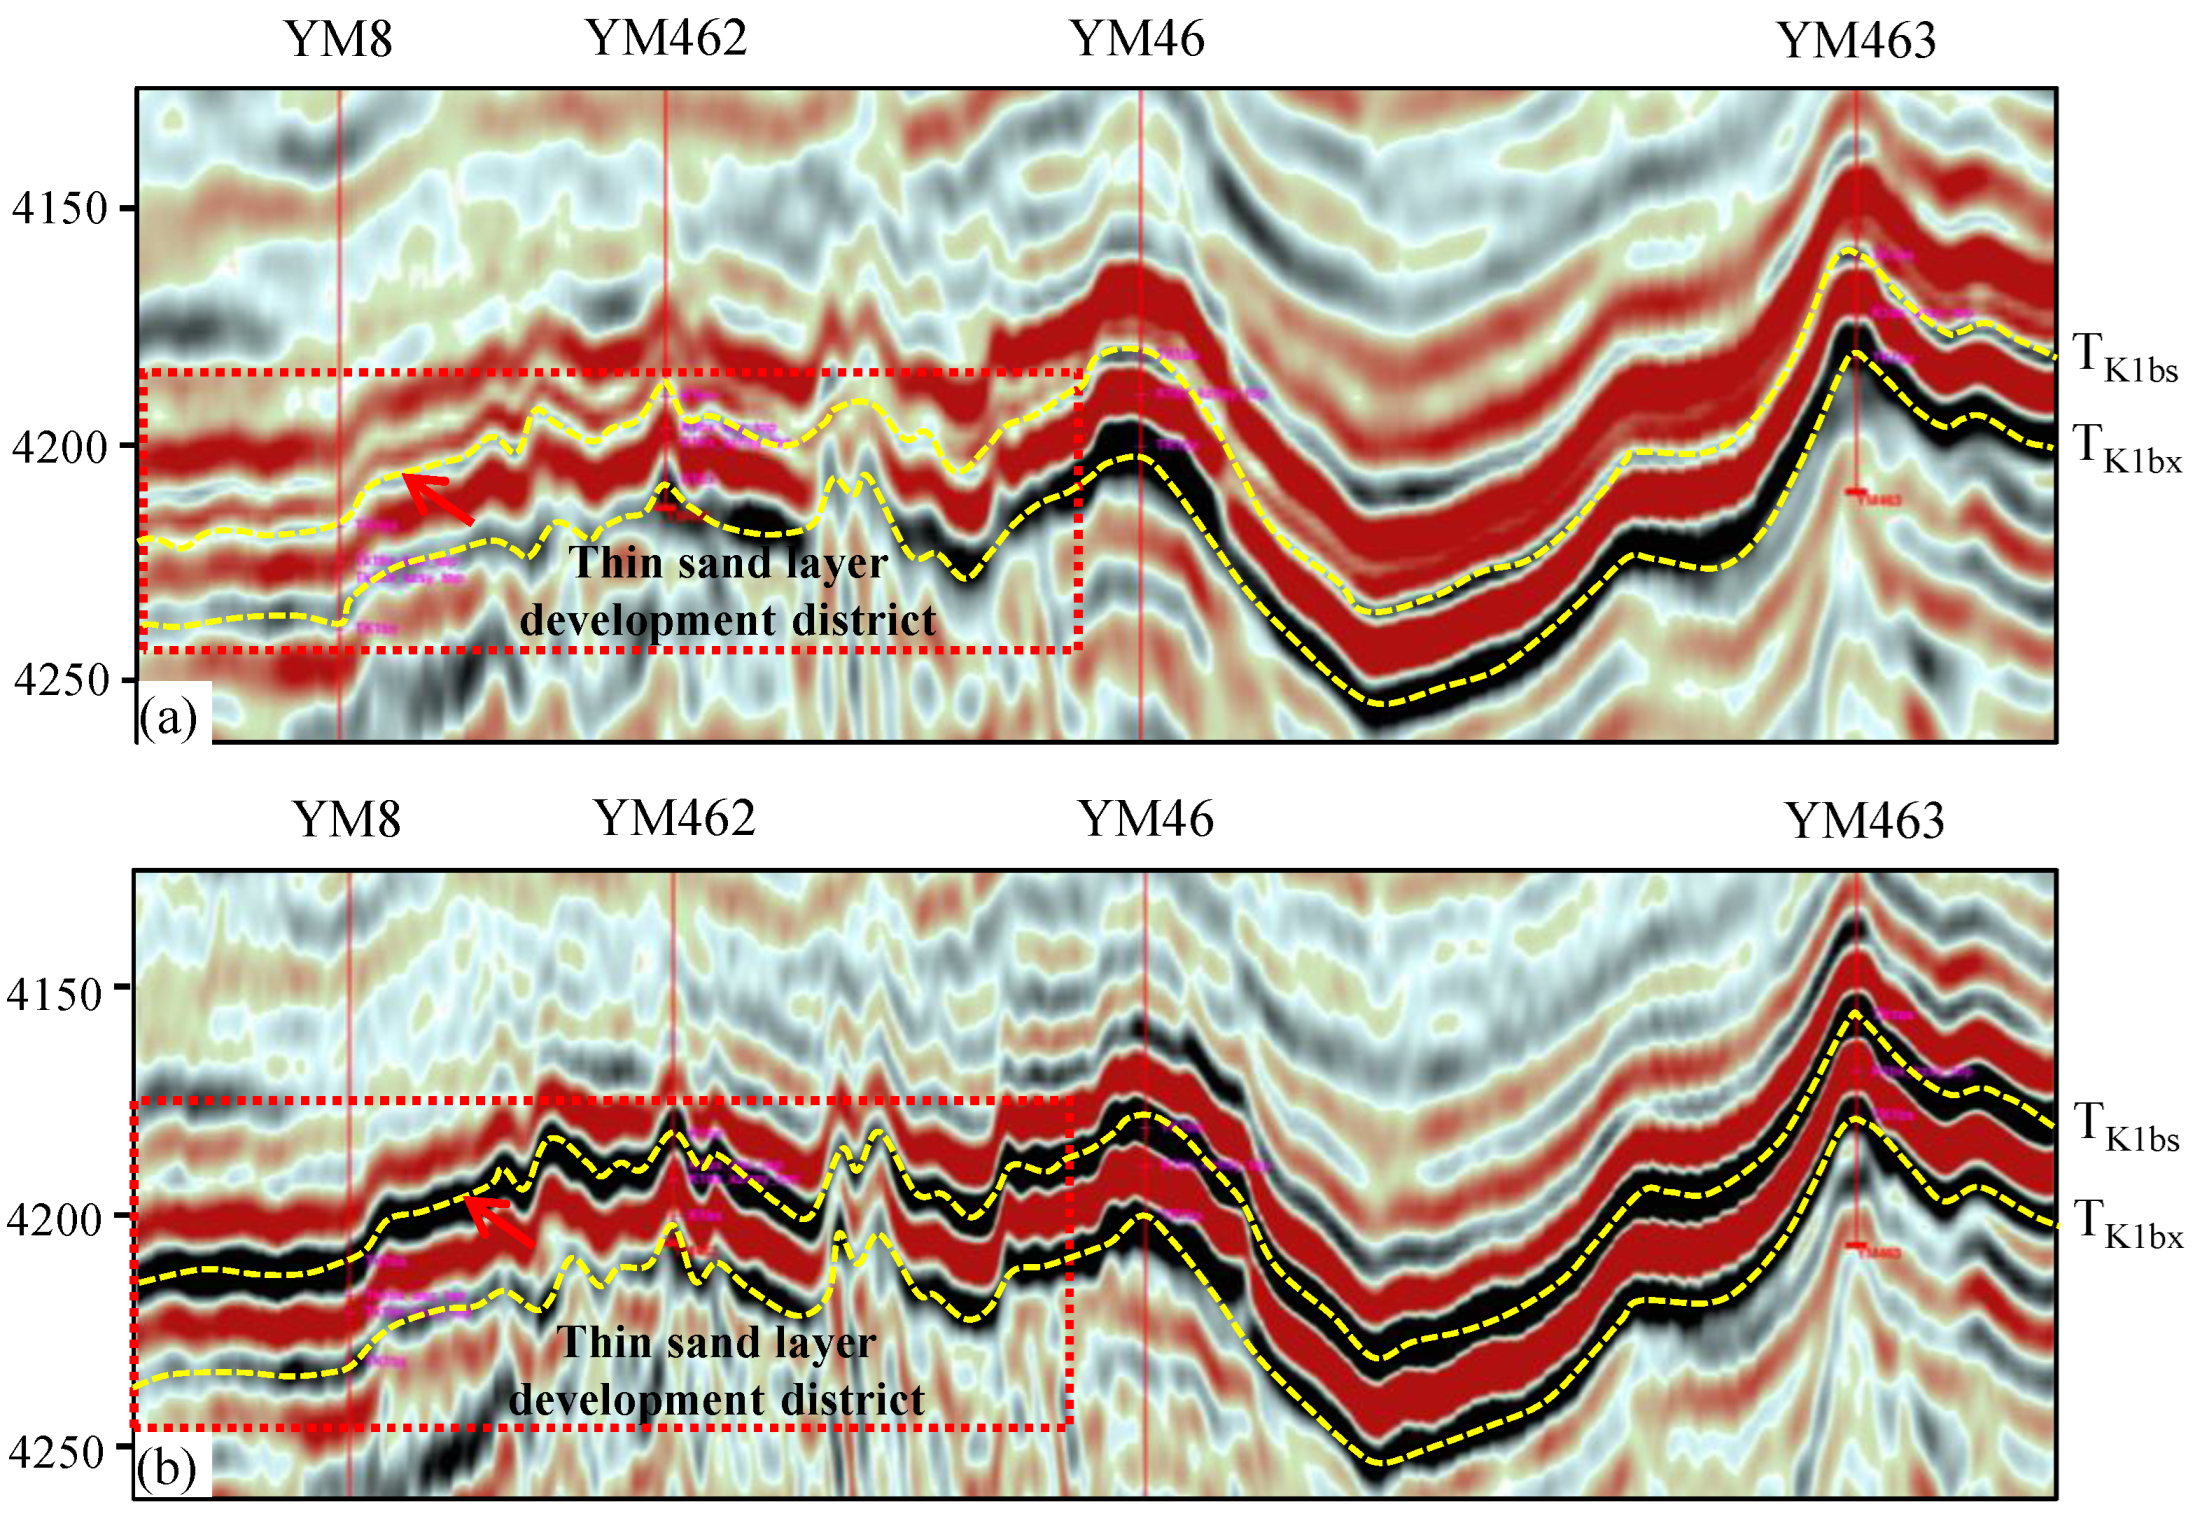
5.2. Distribution Model of Thin Sand Bodies in the Upper Mudstone Section

Previous studies have shown that the Cretaceous Baxigai Formation was deposited in a sedimentary transition period. After the development of the ancient uplift in the Shushanhe Formation sedimentary period, the ancient uplift in the study area began to be submerged, becoming a subaqueous low uplift, and river-dominated delta–lacustrine deposits developed [33,40,41,42]. Although the previous models have revealed the conceptual model of deltaic deposition, the facies distribution in finer scale and beach bar deposition have not been determined yet, due to limitations in the seismic data resolution. In this study, new details of the deltaic deposits were found, and this could provide new implications for reservoir exploration. Additionally, we believe more thin-bedded sandstone deposits with similar conditions can be found in other continental basins.
These deltaic deposits have a sedimentary process of progradation and later retrogradation (Figure 14). During the sedimentary period of the lower sandstone section, the distributary channel from the southeast rapidly progrades toward the center of the lacustrine basin. Due to the river-dominated process, the delta has a large distribution scale. In the proximal location, sand bodies developed continuously vertically. In the distal part of the delta deposition, the thickness of the sand body decreased, and inter-bedded mudstone could be found in the sedimentary records. During the deposition of the upper mudstone section, the lake level rose, and the braided river delta sand body retrograded. Due to the rise in the lake level and wave action, the delta front deposits formed a thin layer of beach bar sand body. The genesis of sand bodies is closely related to the transformation of waves and coastal currents in local areas [43,44,45]. The lower sandstone section and upper mudstone section form five sandstone–mudstone combination styles in different areas (Figure 14).
The prediction of the thin-layer sand body reveals the lateral distribution characteristics of sandstone in the upper mudstone section. This sedimentary model reveals the distribution pattern of beach bar sandstone in the upper mudstone section. The top and bottom layers of that sandstone are, respectively, composed of stable developed lacustrine mudstone. As the structural characteristics of the area are high in the south and low in the north, the thin beach bar sand bodies in the upper mudstone section of the northwest of the study area are pinched out in the upward direction, forming a favorable zone for the development of lithologic traps, which has huge potential for lithologic oil reservoir exploration.

6. Conclusions

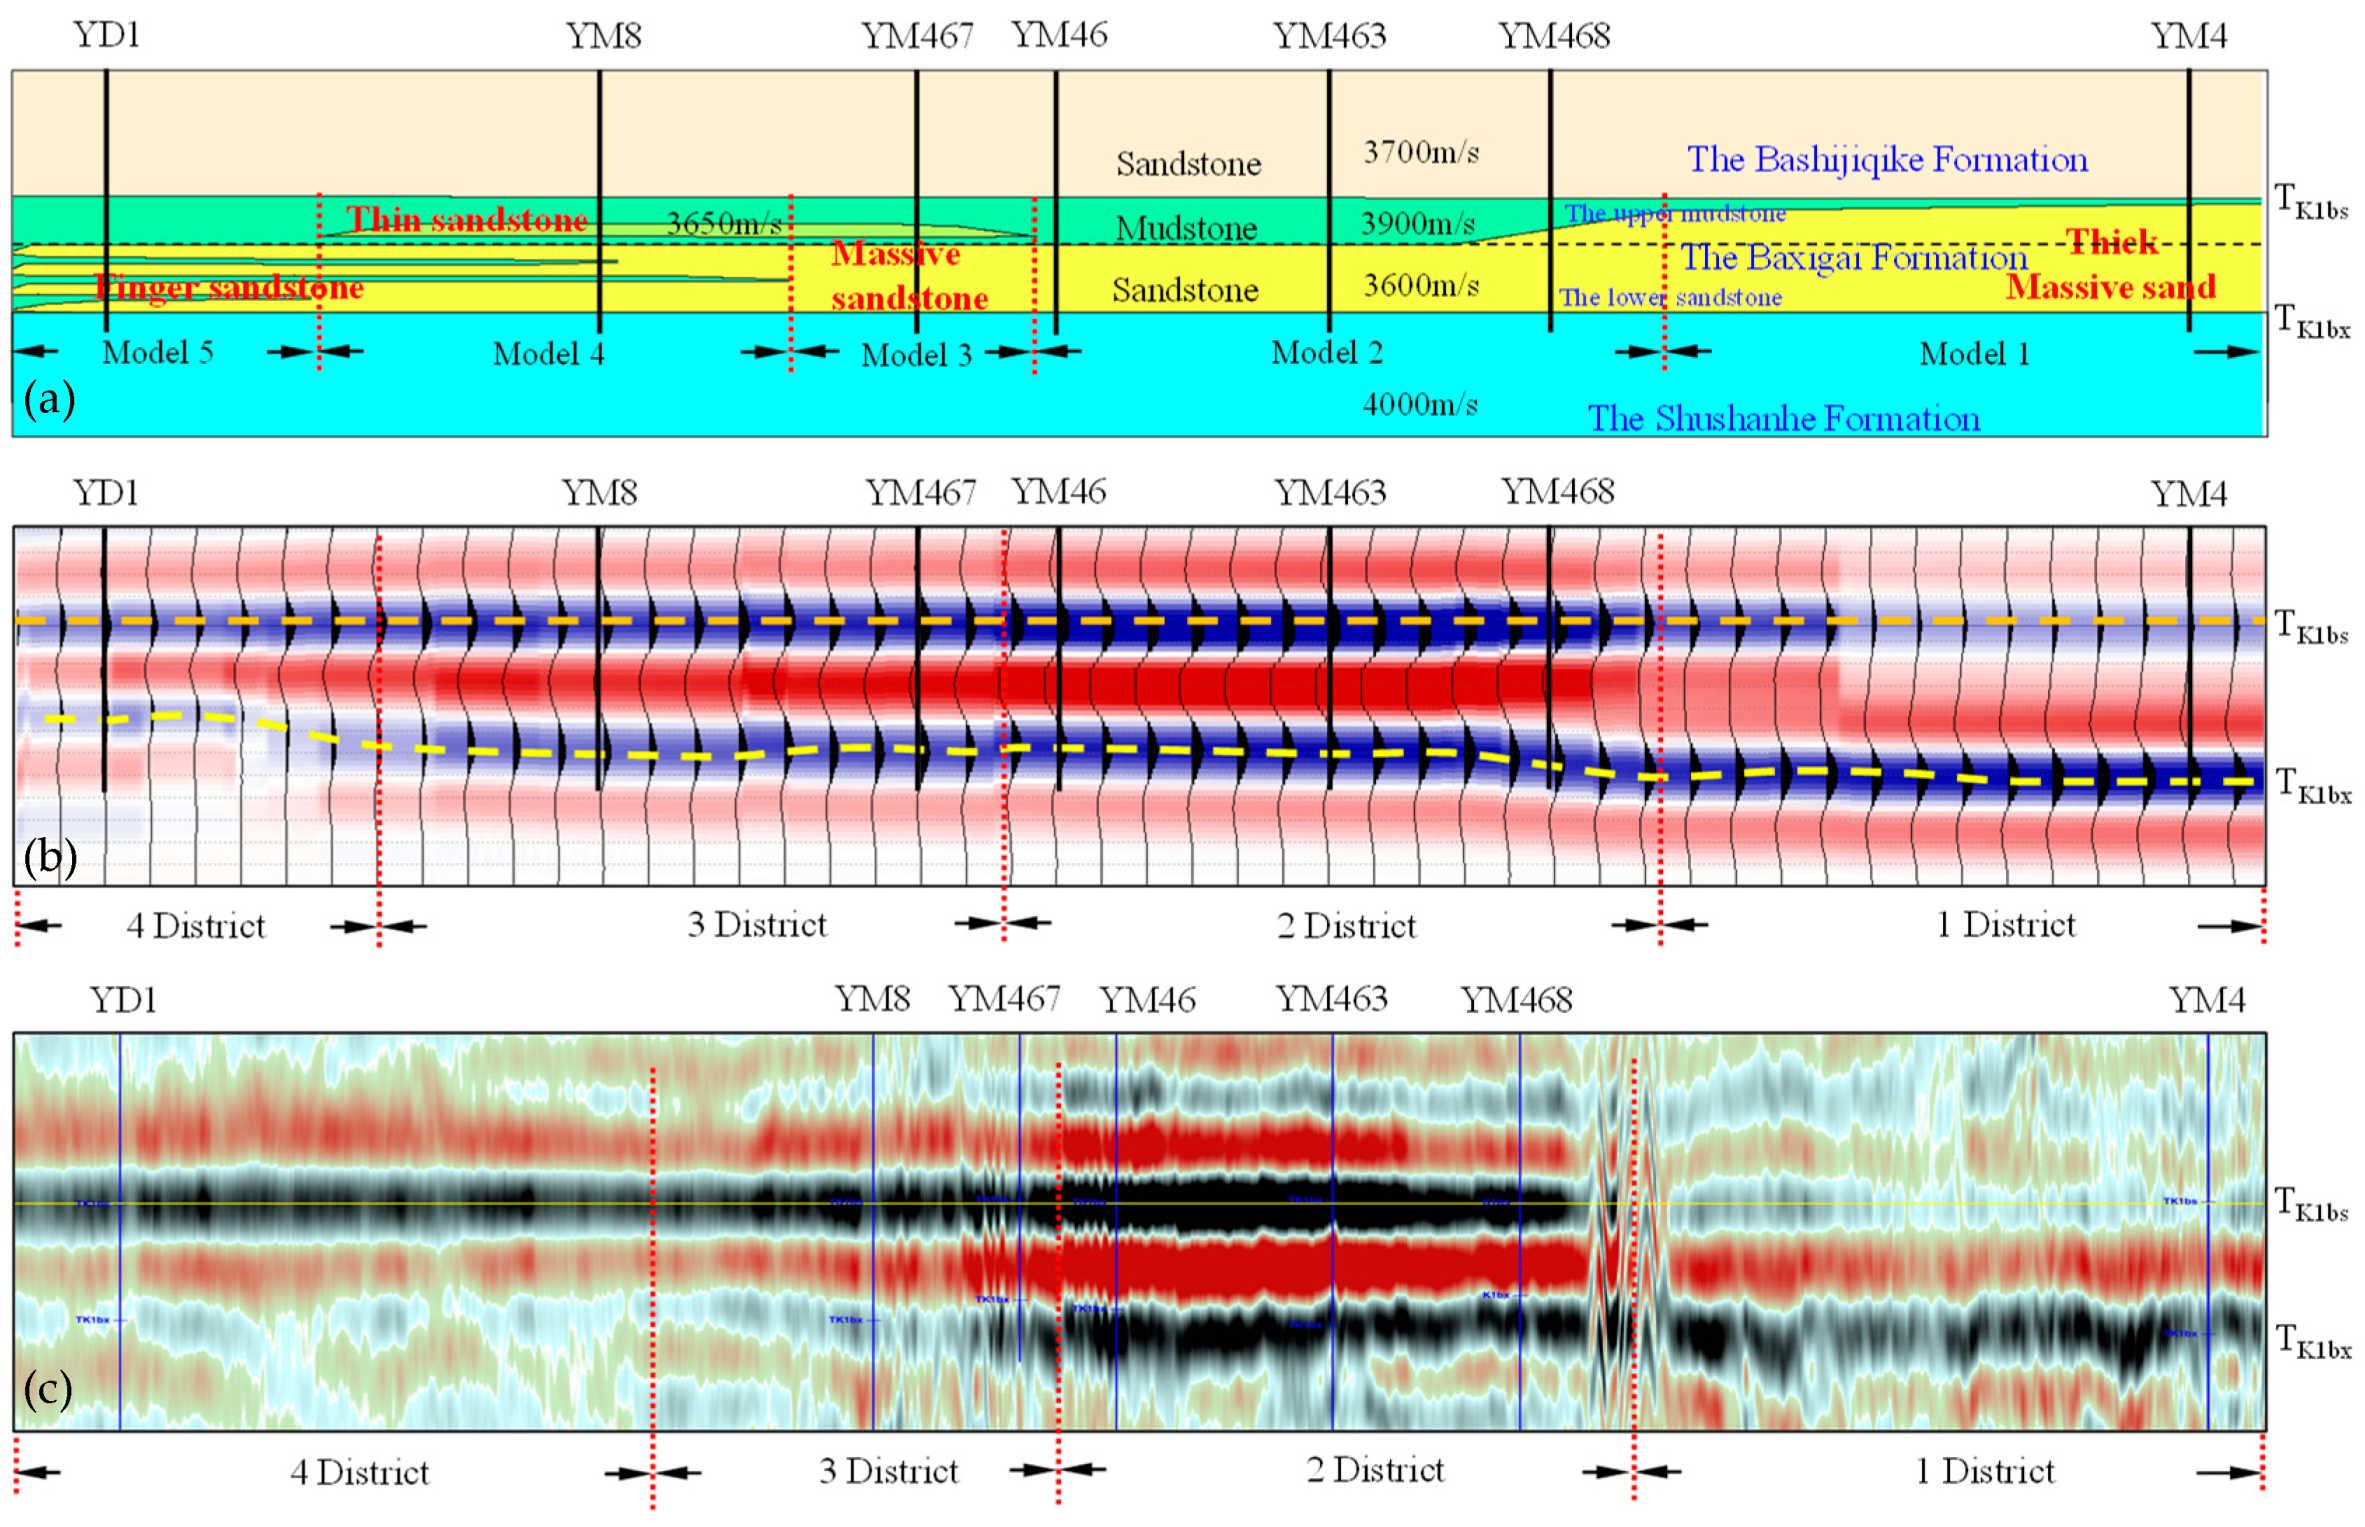
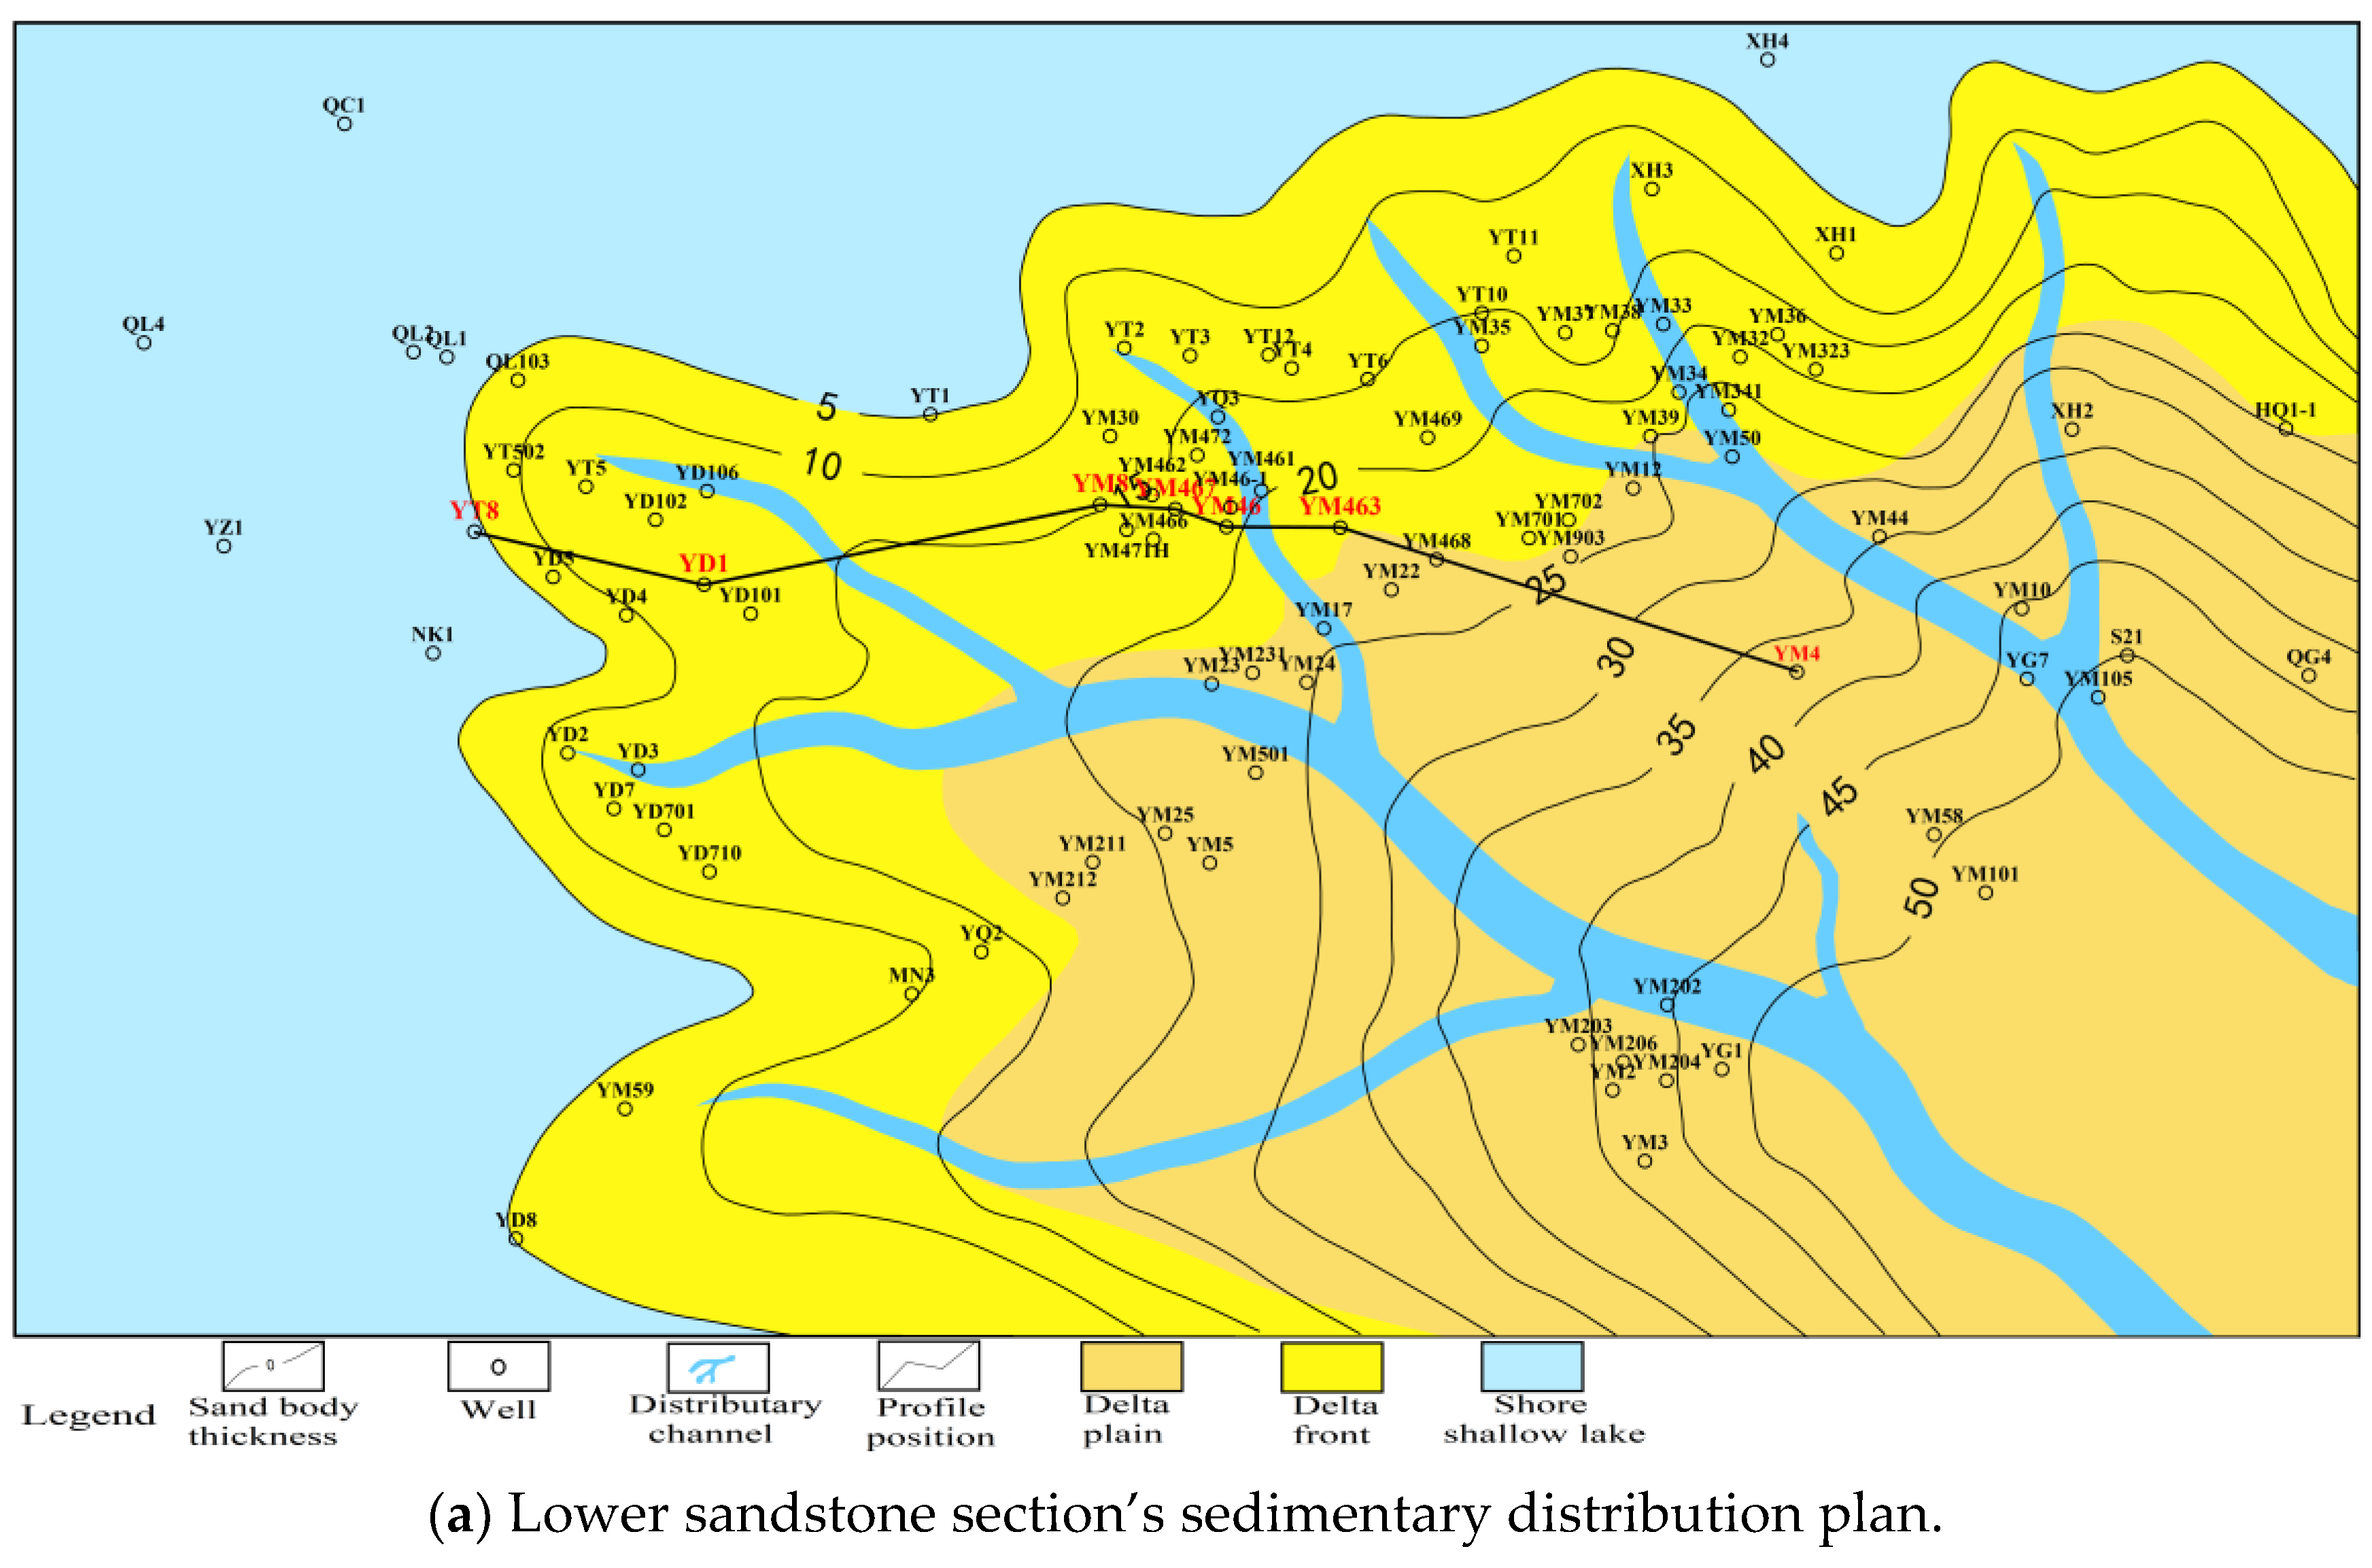
  • The Baxigai Formation in the western part of Tabei Uplift mainly develops with braided river delta deposits. The lower sandstone section develops with thick sandstone and finger-shaped sandstone in distributary channels. The sandstone in the upper mudstone section gradually pinches out from southeast to northwest, and an isolated thin layer of beach bar sandstone is developed in coastal areas.
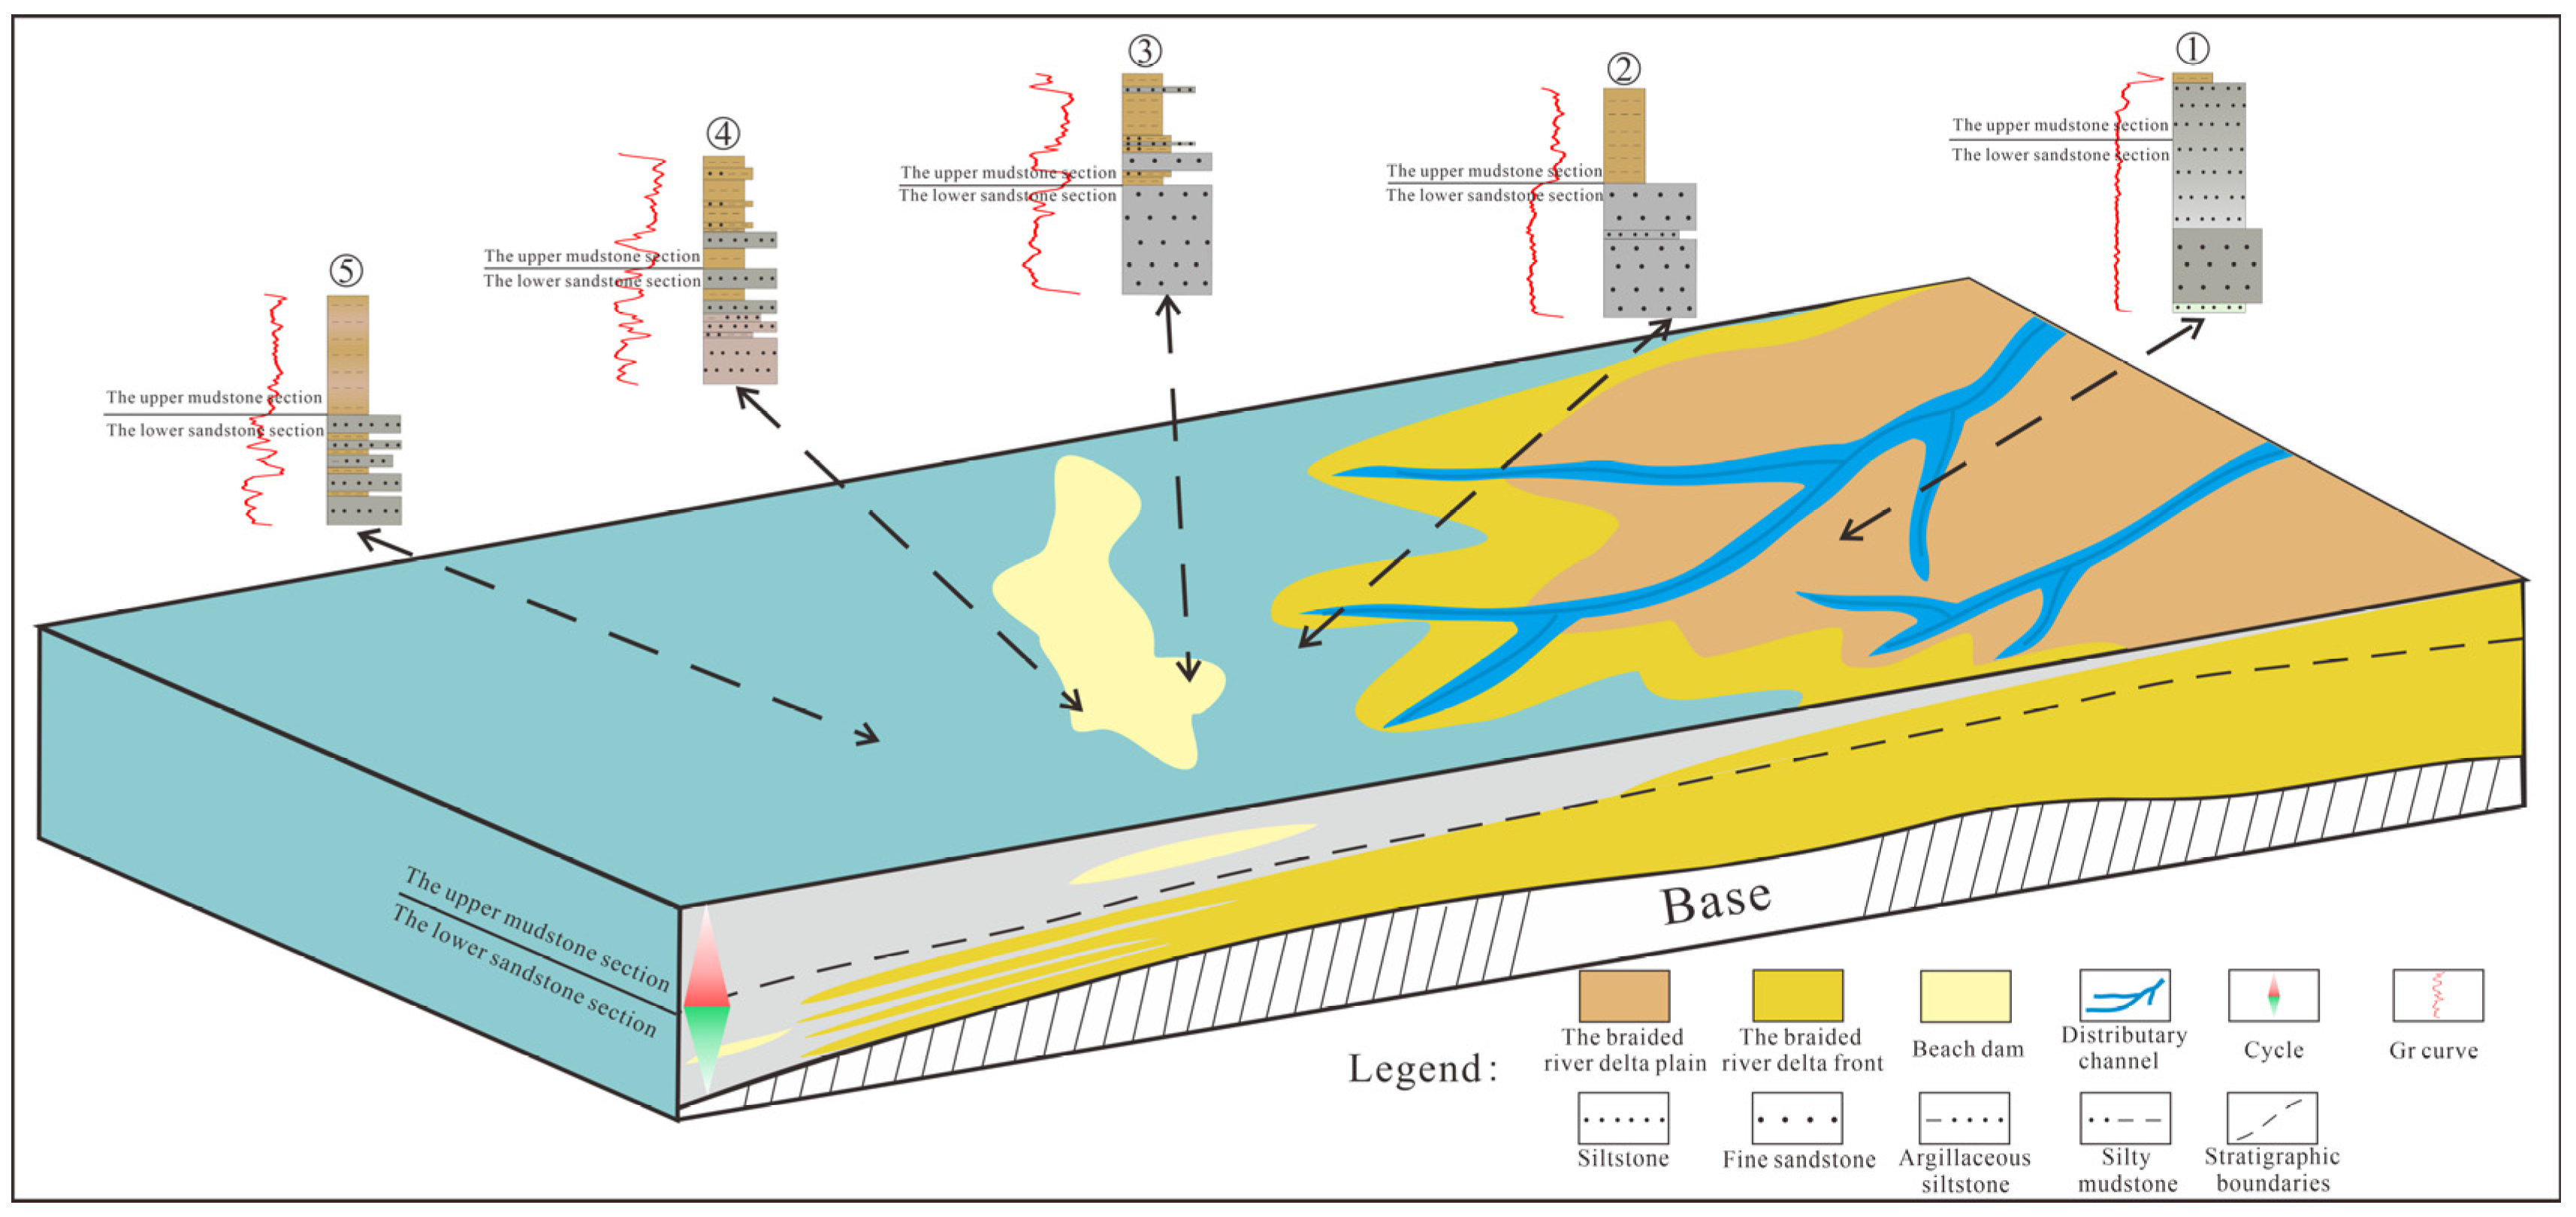
  • Based on the spatial distributions of the lower sandstone section and the upper mudstone section, five combination styles were identified: thin-layer upper mudstone–thick sandstone; medium-thick-layer upper mudstone–medium-thick sandstone; medium-thick-layer upper mudstone–thin-layer sandstone-block sandstone; medium-thick-layer upper mudstone–thin-layer sandstone–finger-shaped sandstone; and thick-layer upper mudstone–finger-shaped sandstone.
  • Five seismic forward modeling models were established according to the sandstone–mudstone combination style. The results correspond to four different seismic responses. Using wavelet decomposition and reconstruction techniques, multi-wavelet series was determined in the medium- to high-frequency range. The seismic amplitude variation characteristics of sandstone–mudstone combinations related to thin sandstone were determined. The RMS amplitude attribute was optimized to complete the prediction of sandstone distribution.
  • Based on the seismic prediction of thin sandstone distribution, the sedimentary model of thin-bedded sandstone in the upper mudstone section of the Baxigai Formation was established. During the sedimentation period of the lower sandstone section, the delta rapidly progrades toward the lacustrine basin. In the proximal location, the sand bodies are continuously developed and relatively thick. At the distal part in the downflow direction, the thickness of the sand body varies greatly, appearing as a finger shape in profile. During the depositional period of the upper mudstone section, the scale of the delta decreased. Deltaic deposits were transported by waves and coastal currents to form beach bars.
  • The thin sand bodies in the upper mudstone section of the Cretaceous Baxigai Formation in the western Tabei Uplift could form lithologic traps, which have important exploration and development value for lithologic oil reservoirs. The thin beach bar sandstone is pinched out in the upward tilt direction, forming a favorable zone of the lithologic traps.

Author Contributions

Conceptualization, T.W. and Q.H.; methodology, W.H.; software, S.Y.; validation, Y.H., X.G. and T.W.; formal analysis, W.H.; investigation, X.G.; resources, W.H.; data curation, X.G.; writing—original draft preparation, Q.H.; writing—review and editing, T.W.; visualization, S.Y.; supervision, Y.H.; project administration, W.H.; funding acquisition, W.H. All authors have read and agreed to the published version of the manuscript.

Funding

This research was funded by [Scientific Research Foundation of Yangtze University] grant number [8021003201] And The APC was funded by [8021003201].

Data Availability Statement

All the data have been presented in the article, there is no need to share the research data.

Conflicts of Interest

The authors declare that there are no conflict of interest.

References

  1. Geronimo, J.S.; Hardin, D.P.; Massopust, P.R. Fractal functions and wavelet expansions based oil several scaling functions. J. Approx. Theory 1994, 78, 373–401. [Google Scholar] [CrossRef]
  2. Jonathan, M.; Lilly, J.P. Multiwavelet spectral and polarization analyses of seismic records. Geophys. J. Int. 1995, 122, 1001–1021. [Google Scholar]
  3. Xu, T.; Shen, Z.; Wen, X. Research and application of multi-wavelet decomposition and reconstructing technology. J. Chengdu Univ. Technol. 2010, 3, 660–665. [Google Scholar]
  4. Dai, S.H.; Chen, Z.G.; Yu, J.B.; Xie, J.L.; Mao, F.J.; Wei, T.C.; Li, Y.B. Application of multi-wavelet decomposition and reconstruction technigue in reservoir characterization in TKT-NGS Oilfield, Algeria. Oil Geophys. Prospect. 2011, 46, 103–109. [Google Scholar]
  5. Xiong, X.; Gong, S.; Cui, Z.F.; Jian, S.K.; Huang, J. Improved wavelet decomposition method and its application. Prog. Geophys. 2018, 33, 1617–1621. [Google Scholar]
  6. Xiang, L.; Li, D. Eliminating seismic shielding of igneous rock using wavelet decomposition and seismic cycle analysi. Geol. Sci. Technol. Inf. 2016, 35, 210–215. [Google Scholar]
  7. Xie, C.; Huang, W.; Guan, X.; Gu, H.; Xu, L. Thin sand identification under strong reflection with volume-based waveform decomposition. Oil Geophys. Prospect. 2017, 5, 516–520. [Google Scholar]
  8. Li, K.; Zheng, X.; Zhao, H.; Yang, Z.; Zhou, L. Application of reconstructed seismic data volume technology based on wave-form decomposition in prediction of thin tight oil reservoir. Pet. Geol. Oilfield Dev. Daqing 2022, 41, 131–137. [Google Scholar]
  9. Wang, X.; Fan, S.; Ren, Y.; Xu, B.; Liu, X. Multi-attribute regression and neural network series inversion to predict thin reservoirs. Xinjiang Pet. Geol. 2013, 34, 324–327. [Google Scholar]
  10. Xiong, R.; Zhao, J.; Hou, G. Prediction of thin sandstone reservoirs by spectral decomposition and seismic peak attribute analysis. Xinjiang Pet. Geol. 2013, 34, 225–227. [Google Scholar]
  11. Ni, C.; Su, M.; Liu, H.; Cai, G.; Branch, N. Discussion on the application conditions and resolution of stratigraphic slices. Nat. Gas Geosci. 2014, 25, 1830–1838. [Google Scholar]
  12. Chen, W.; Wang, Z.; Hou, J.; Wei, C. Application of stratigraphic sectioning technology in sedimentary facies research. Oil Geophys. Explor. 2015, 50, 1007–1015. [Google Scholar]
  13. Gu, W.; Xu, M.; Wang, D.; Zheng, H.; Zhang, X.; Zhang, D.; Luo, J. Application of seismic waveform indication inversion technology in thin reservoir prediction-a case study of thin sandstone gas reservoirs in B area of Junggar Basin. Nat. Gas Geosci. 2016, 27, 2064–2069. [Google Scholar]
  14. Gao, J.; Bi, J.; Zhao, H.; Fu, Z.; Amp, S.E. Seismic waveform indication inversion thin reservoir prediction technology and its application. Prog. Geophys. 2017, 32, 142–145. [Google Scholar]
  15. Guo, X.; Li, X.; Li, B.; Yang, Y.; Jiang, S.; Xu, J. Multi-attribute fusion method is used to predict the thin sandstone reservoir of Wutonggou Formation in Dixi 178 well area, Xinjiang. Nat. Gas Geosci. 2018, 29, 1172–1180. [Google Scholar]
  16. Peng, J.; Zhou, J.; Ma, G.; Sui, B.; Wang, Y.; Tang, X. Application of high-precision three-parameter wavelet spectral analysis in thin reservoir prediction. Xinjiang Pet. Geol. 2018, 39, 230–235. [Google Scholar]
  17. Chen, Y.; Bi, J.; Qiu, X. A method of seismic meme inversion and its application. Pet. Explor. Dev. 2020, 47, 1235–1245. [Google Scholar] [CrossRef]
  18. Zhou, L.; Qian, Y.; Wu, Y.; Zhang, L.; Lan, X.; Wang, Y.; Zhong, G. Seismic prediction of thin oolitic shoal reservoirs constrained by favorable facies belts-A case study of the second member of Feixianguan Formation in Jiulongshan area, northwestern Sichuan. Gas Geosci. 2021, 32, 1532–1545. [Google Scholar]
  19. Xiong, X.; Luo, H.; Xiao, Y.; Zhang, M. Thin reservoir prediction of Permian Qixia Formation in central Sichuan based on waveform indicator inversion method. Prog. Geophys. 2022, 37, 2460–2468. [Google Scholar]
  20. Zhang, Z.; Lin, C.; Liu, Y. Lacustrine to fluvial depositional systems: The depositional evolution of an intracontinental depression and controlling factors, Lower Cretaceous, Northern Tarim Basin, Northwest China. Mar. Pet. Geol. 2021, 126, 104904. [Google Scholar] [CrossRef]
  21. Sun, D. Quantitative evaluation the physical properties evolution of sandstone reservoirs constrained by burial and thermal evolution reconstruction: A case study from the Lower Cretaceous Baxigai Formation of the western Yingmaili Area in the Tabei Uplift, Tarim Basin, NW China. J. Pet. Sci. Eng. 2022, 208, 109460. [Google Scholar]
  22. Zhao, H.; Sun, Q.; Li, W.; Gao, D.; Zhao, F.; Lu, S.; Zhu, P. Cretaceous hydrocarbon accumulation rules in Yingmaili area of Tabei Uplift-Taking Yingmai 46 well area as an example. J. China Univ. Min. Technol. 2022, 5, 137–147. [Google Scholar]
  23. Yang, H.; Liu, Y.; Su, Z.; Han, J. Main controlling factors for the formation of high-quality reservoirs of deep clastic rocks in the Tabei Uplift. Geol. Rev. 2020, 6, 169–179. [Google Scholar]
  24. Xu, Z.; Shi, W.; Wang, R.; Luo, F.; Xia, Y.; Tan, S.; Zhang, X. Oil and gas accumulation rules and models of Cretaceous clastic rocks in western Tabei Uplift. Lithol. Reserv. 2023, 35, 31–46. [Google Scholar]
  25. Su, Z.; Liu, Y.; Han, J.; Luo, H.; Yang, F.; Cui, Y.; Peng, P.; Zhang, H.; Du, L.; Liu, Z. Application of ultra-deep thin sand body prediction technology under facies-controlled constraints in Yudong block of Tabei Uplift. Gas Geosci. 2020, 31, 295–306. [Google Scholar]
  26. Bashir, Y.; Faisal, M.A.; Biswas, A.; Babasafari, A.A.; Ali, S.H.; Imran, Q.S.; Siddiqui, N.A.; Ehsan, M. Seismic expression of miocene carbonate platform and reservoir characterization through geophysical approach: Application in central Luconia, offshore Malaysia. Pet. Explor. Prod. Technol. 2021, 11, 1533–1544. [Google Scholar] [CrossRef]
  27. He, B.; Jiao, C.; Liu, R.; Cao, Z.; Cai, Z.; Lan, M.; Run, X.; Zhu, D.; Jiang, Z.; Yang, Y. Neoproterozoic Paleostructure-Paleogeography and Prediction of Deep Favorable Source Rock Development Areas in Tarim Basin. Geosci. Front. 2023, 30, 19–42. [Google Scholar]
  28. Tian, J. Oil and Gas Exploration Achievements and Exploration Direction. Xinjiang Pet. Geol. 2019, 40, 1–11. [Google Scholar]
  29. Wu, G.; Zhang, Z.; Lin, C.; Tian, N.; Zuo, X.; Li, H.; Kong, F.; Li, J. Sedimentary Evolution Characteristics of Mesozoic in Tabei Uplift Area, Tarim Basin. Oil Gas Geol. 2022, 43, 845–858. [Google Scholar]
  30. Jia, C. Structural Features and Oil and Gas in Tarim Basin, China; Petroleum Industry Press: Beijing, China, 1997; pp. 1–438. [Google Scholar]
  31. He, D.; Zhou, X.; Yang, H.; Guan, S.; Zhang, C. Genetic mechanism and tectonic type of paleo-uplifts in the craton of Tarim Basin. Geol. Front. 2008, 15, 207–221. [Google Scholar]
  32. Xu, G.; Lin, C.; Liu, Y.; Qi, S. Paleo-uplift evolution and its control on sedimentation during the deposition of the Early Cretaceous Kapushaliang Group in western Tabei. Earth Sci. 2016, 41, 619–632. [Google Scholar]
  33. Li, J.; Wu, G.; Lin, C.; Liu, Y.; Liu, J.; Sun, Q.; Li, H.; Xu, G. Control of stratigraphic traps by unconformity triangle zone in paleo-uplift slope area - A case study of Cretaceous in western Tabei Uplift. J. Northeast. Pet. Univ. 2019, 43, 68–78. [Google Scholar]
  34. Wu, G.; Lin, C.; Yang, H. Major unconformities in the Mesozoic sedimentary sequences in the Kuqa–Tabei region, Tarim Basin, NW China. J. Asian Earth Sci. 2019, 183, 103957.1–103957.16. [Google Scholar] [CrossRef]
  35. Chen, G.; Huang, Z.; Zhan, H.; Zhang, R.; Yan, X. Provenance analysis of clastic rocks in the Cretaceous Bashijiqike Formation at Kuqa depression. Nat. Gas Geosci. 2012, 23, 1025–1033. [Google Scholar]
  36. Luo, H.; Chen, J.; Zhang, X.; Meng, X.; Zhao, F.; Wu, S.; Guo, X. Sedimentary characteristics of fluvial dominated shallow water delta front and its control on lithologic reservoir: A case study of Baxigai Formation in south slope of Kuqa Depression. Lithol. Reserv. 2021, 33, 70–80. [Google Scholar]
  37. Liu, J.; Wang, P.; Chen, J.; Meng, X. Identification of the Cretaceous sandbody pinchout line in the south of Kuqa Dpression, China, via seismic sedimentology. Geophys. Prospect. Peroleu 2018, 57, 788–794. [Google Scholar]
  38. Chen, R.; Tong, S.; Liu, H.; Zhu, J. Reservoir prediction technology based on wavelet decomposition and reconstruction. Mar. Geol. Front. 2014, 30, 55–61. [Google Scholar]
  39. Chen, C. Research on Seismic Multiwavelet Decomposition and Reconstruction Technology Based on Matching Pursuit Algorithm; Northeast Petroleum University: Daqing, China, 2015. [Google Scholar]
  40. Liu, C.; Chen, S.; Zhao, J.; Chen, G.; Su, Z.; Gao, Q. Conditions of distal hydrocarbon accumulation and main controlling factors of enrichment-A case study of Mesozoic-Cenozoic reservoirs in the southern slope of Kuqa depression. Pet. J. 2021, 42, 307–318. [Google Scholar]
  41. Wu, G.; Lin, C.; Liu, Y.; Liu, J.; Yang, X.; Li, H. The main unconformity and paleo-uplift geomorphological characteristics of the key Mesozoic transformation period in Kuqa-Tabei area. Oil Gas Geol. 2019, 40, 763–777. [Google Scholar]
  42. Zhao, H.; He, Q.; Yuan, R.; Yi, Z.; Li, B.; Yang, S.; Shi, F.; Liu, L. Sequence stratigraphic filling model of the Cretaceous in the western Tabei Uplift, Tarim Basin, NW China. Open Geosci. 2022, 14, 1137–1146. [Google Scholar] [CrossRef]
  43. Xue, H.; Han, C.; Xiao, B.; Wang, F.; Li, L. Sedimentary characteristics and model of shallow-water delta front in the lower submember of the first member of Shahejie Formation in Gaoyang area of Lixian slope. Lithol. Reserv. 2020, 32, 69–80. [Google Scholar]
  44. Wu, J.; Zhu, C.; Yang, G.; Zhao, J.; Gong, Q.; Song, G. High-resolution sequence stratigraphic characteristics and sedimentary evolution of thin-layer sandstone under high-frequency lake level changes—A case study of the bottom sandstone member of the Kumugeliemu Group in the Wensu uplift-Yingmaili uplift area. Oil Gas Geol. Recovery 2020, 27, 38–46. [Google Scholar]
  45. Liu, J.; Ji, Y.; Yang, K.; Zhou, Y.; Chen, X.; Gao, C.; Jia, L. Sand control mechanism of delta shoreline in shallow lake basin and its significance for oil and gas exploration-a case study of Penglaizhen Formation in the middle part of Western Sichuan Depression. Pet. J. 2015, 36, 1060–1073. [Google Scholar]
Figure 1. Structural map and the location of the study area in western Tabei Uplift.
Processes 11 02481 g001
Figure 2. Well-logging interpretation of Baxigai Formation of Well YM467 in the study area.
Processes 11 02481 g002
Figure 3. Core pictures of YM46-1, YD701well in the lower sandstone section of the Baxigai Formation: (a) Well YM46-1, 5172.1 m; medium sandstone massive bedding; (b) Well YM46-1, 5173.5 m; medium–fine sandstone with erosion surface (marked by black dotted line) and muddy clast (marked by yellow dotted lines); (c) Well YM46-1, 5174.6 m; medium sandstone with rip-up mud clasts (marked by yellow dotted lines); (d) Well YM46-1, 5175.4 m; fine sandstone massive bedding; (e) Well YM46-1, 5176.1 m; fine sandstone trough cross-bedding (marked by yellow dotted lines); (f) Well YM46-1, 5179.4 m; medium sandstone with the residual deposit (marked by black dotted lines) and fine gravel; (g) Well YD701, 4973.63 m; siltstone inclined bedding (marked by yellow dotted lines); (h) Well YD701, 4974.12 m; siltstone ripple cross-bedding; (i) Well YD701, 4980.3 m; mudstone; (j) Well YD701, 4981.8 m; massive bedding; (k) Well YD701, 4984.29 m; fine sandstone parallel bedding (marked by yellow dotted lines); (l) Well YD701, 4986.2 m; medium sandstone scouring and filling structure with gravel (marked by yellow dotted lines).
Processes 11 02481 g003
Figure 4. Typical characteristics of sand body development in the lower sandstone section of the Baxigai Formation.
Processes 11 02481 g004
Figure 5. Core pictures of YM471H well in the upper mudstone section of the Baxigai Formation: (a) Well YM471H, 5201.65 m; siltstone parallel bedding (marked by yellow dotted lines); (b) Well YM471H, 5202.33 m; siltstone wavy cross-bedding (marked by yellow dotted lines); (c) Well YM471H, 5204.55 m fine sandstone massive bedding–parallel bedding (marked by yellow dotted lines).
Processes 11 02481 g005
Figure 6. Typical characteristics of sand body development in the upper mudstone section of the Baxigai Formation.
Processes 11 02481 g006
Figure 7. Sedimentary profile of lower sandstone section–upper mudstone section of Cretaceous Baxigai Formation in NW–SE direction in the study area.
Processes 11 02481 g007
Figure 8. Seismic forward modeling of restructured sand bodies in the Baxigai Formation: (a) geology model schematic diagram; (b) seismic model profile; (c) actual seismic profile.
Processes 11 02481 g008
Figure 9. Amplitude variation diagram of the seismic profile along the top and bottom wave peaks and their inter-wave trough of the Baxigai Formation.
Processes 11 02481 g009
Figure 10. The well seismic calibration comparison of thin sandstone of Well YM 466 restructured in the Baxigai Formation.
Processes 11 02481 g010
Figure 11. Comparison between wavelet decomposition and reconstruction profile and original seismic profile: (a) wavelet decomposition profile; (b) original profile.
Processes 11 02481 g011
Figure 12. RMS amplitude attribute plane of thin sandstone section extracted based on wavelet decomposition.
Processes 11 02481 g012
Figure 13. Sedimentary distribution of Cretaceous Baxigai Formation in western Tabei Uplift.
Processes 11 02481 g013aProcesses 11 02481 g013b
Figure 14. Sedimentary model of Baxigai Formation in the study area.
Processes 11 02481 g014
Disclaimer/Publisher’s Note: The statements, opinions and data contained in all publications are solely those of the individual author(s) and contributor(s) and not of MDPI and/or the editor(s). MDPI and/or the editor(s) disclaim responsibility for any injury to people or property resulting from any ideas, methods, instructions or products referred to in the content.

