Article

Development of Ultrasound Piezoelectric Transducer-Based Measurement of the Piezoelectric Coefficient and Comparison with Existing Methods

by
Chandana Ravikumar
* and
Vytautas Markevicius
Department of Electrical Engineering, Faculty of Electrical and Electronics Engineering, Kaunas University of Technology, Student Street 50-438, LT-51365 Kaunas, Lithuania
*
Author to whom correspondence should be addressed.
Processes 2023, 11(8), 2432; https://doi.org/10.3390/pr11082432
Submission received: 23 June 2023 / Revised: 8 August 2023 / Accepted: 10 August 2023 / Published: 12 August 2023

Abstract

:
Energy harvesting using the piezoelectric material in the development of compact vibration energy harvesters can be used as a backup power source for wireless sensors or to fully replace the use of fossil-resource-wasting batteries and accumulators to power a device or sensor. Generally, the coefficient is used as the metric for evaluating the property in materials. Recent research reports that accurate measurement and calculation of the coefficient in materials, especially in polymers, can be challenging for various reasons. From the reviewed references, different methods, including the quasi-static, dynamic, interferometric, and acoustic methods, are discussed and compared based on the direct and indirect effect, accuracy, repeatability, frequency range, and so on. A development of an ultrasound piezoelectric transducer is conducted to estimate d 33 coefficient with a reference value. The purpose of the method was mainly to measure the values of piezoelectric material in order to measure the efficiency of the poling process in piezoelectric materials. The test setup described in this study allowed for the effective measurement of the d 33 factor of piezoelectric materials using a 1.4 MHz PZT ultrasonic piezoelectric transducer. The arrangement of the components, including the use of organic glass, copper, and aluminum electrodes, ensured accurate and reliable measurements. This setup can be valuable for various applications requiring the characterization of piezoelectric materials and for understanding their behavior under specific conditions. The advantages and challenges in this method are discussed and compared with existing works.

1. Introduction

The wide application of piezoelectric materials allows the development of renewable energy generation from mechanical vibrations. In addition to the generation of electricity, materials are also used in various sensors using direct and reverse effects. Some are crystalline materials with a well-defined crystal structure, such as perovskite [1,2]. They possess a periodic arrangement of atoms or ions, which gives rise to their unique electrical properties. On the other hand, polymers such as metallized polyvinyl fluoride (PVDF) films [3,4] exhibit spontaneous and reversible polarization, which arises from the collective alignment of electric dipoles along a preferred direction within the crystal lattice, even in the absence of an external electric field. The polarization can be switched or reversed by applying an external electric field [5,6,7]. They are typically synthesized through controlled solid-state reactions or chemical processes to achieve the desired crystal structure and properties [8].
In order to extract electricity as efficiently as possible, materials need to oscillate in a certain mode. Some of the modes are transverse shear, meaning the direction of the impact is parallel to the polarization direction, and others are longitudinal shear, meaning the direction of the mechanical impact is perpendicular to the polarization direction [8].
The next section discusses the different modes vibration in piezoelectric materials. In mechanical oscillators, the modes are commonly used [9,10,11]. Measurement of this parameter is essential for optimizing the performance of the piezoelectric material including critical quality control parameters for ensuring the consistent and reliable performance of these materials in various applications. Accurate measurement of capacity is important for characterizing the properties of materials. From the reviewed references, different electrometers or high-resistance input voltmeters are used to measure the charges created when the sample is mechanically deformed [12,13,14]. High-cost commercial measuring devices are offered by companies such as Piezotest and HC Materials Corporation. Additionally, commercial devices are mainly for piezoelectric ceramic materials and not for soft materials, such as PVDF. Calculating and measuring the coefficient in piezoelectric materials can be challenging for several reasons: They are often non-uniform in their structure, which can make it difficult to accurately measure the coefficient [15,16]. The voids or cavities in the polymer matrix can vary in size and shape, which can lead to variations in the response [17,18]. They can also exhibit anisotropic behavior, which means that their response can vary depending on the direction of the applied force. This can make it challenging to accurately measure the coefficient, as multiple measurements may be needed to account for the anisotropic behavior where the properties of the material depend on the direction [19]. The fabrication process for piezoelectric materials can also impact the response, and the polarization of the films is one of the most crucial steps in manufacturing. There are no reliable ways to evaluate the quality of the polarization of such films in a laboratory setting [20,21]; however, one can use the estimation of the coefficient of material, measured after the poling process, to evaluate the quality of the polarization. Hence, this study proposes a measurement methodology for the coefficient suitable for the evaluation of any polarization. Moreover, there is not enough understanding of the factors in manufacturing and poling that affect the value of the piezoelectric coefficient and, hence, there should be more ways to experimentally measure this value which can become a way to evaluate the influence of other processes, such as poling. The study also aims to show the findings of an intensive literature review of existing works on measurement methods. To summarize, the main contributions of this review study are listed below:
  • The various purposes for measuring piezoelectric coefficients are listed, and the importance of accurate coefficients is emphasized.
  • The theory behind the coefficient is mentioned, and the practical ways to measure it are discussed, including the quasi-static method, dynamic method, interferometric technique, and acoustic method.
  • The drawbacks and suitability of each measurement method to specific materials in energy harvesting are discussed and compared with other related works.
  • We developed a new measurement method for the coefficient, experiment setup, and methodology. These are explained in detail, and the applications of this method are suggested within the evaluation of other manufacturing processes. The advantages and challenges presented by the method are discussed.
  • The proposed method is compared with other existing methods based on the direct and indirect effect, the accuracy, the repeatability, the frequency range, etc.
The remainder of the article is presented in the following order. Section 2 presents the theory behind the piezoelectric coefficient. The types of measurement methods are introduced in Section 3 where, in detail, each method is described and related works are compared. Section 4 shows the experimental setup and methodology to measure the coefficient for a reference sample. Section 5 discusses the features of each measurement technique against various conditions. Section 6 summarizes the conclusions.

2. Longitudinal Piezoelectric Coefficient

When generating electrical energy from mechanical vibrations using piezoelectric material, in order to maximize the efficiency of the generator, it is important to take into account a number of piezoelectric parameters: the dielectric constant ε/ε0, the piezoelectric coefficient of charge d, and the electro-mechanical coefficient k [21,22]. The piezoelectric coefficient of the charge is defined as the electric charge generated per unit area divided by the force applied to the material. It is desirable for these parameters to be as high as possible, along with the dielectric constant of the material. This is because a higher dielectric constant results in a lower impedance due to the increased capacitance of the piezoelectric material [23,24]. The choice of the piezoelectric material used to generate electricity is based on the mechanical design of the generator and the type of external mechanical effects. When a mechanical stress is applied to the piezoelectric material in either the z-axis direction (represented by the subscript 3 in equations and variables) or the x-axis direction (represented by the subscript 1), it produces the longitudinal piezoelectric 33-mode or transverse piezoelectric 32 or 31-mode effects, as illustrated in Figure 1b. In Figure 1a,b, the arrow inside the rectangle shows the direction of the polarization, and the arrows outside show the direction of force applied on the material. For instance, when a compressive force, depicted as the arrow “F” in Figure 1b, or when a uniform weight is applied to the film, the longitudinal piezoelectric effect is activated, shown in Figure 1b. However, when a force is acting on the film to elongate it, such as a tip mass attached to the edge of the film, then the transverse piezoelectric effect is applied as shown in Figure 1a.
Particularly in piezoelectric polymers due to the nature of the material, essentially only large longitudinal piezoelectric activity is generated, expressed by large coefficients while their transverse coefficients are very small [25,26]. The 33 coefficient for a single-layer cellular polymer is given below [27]:
d 33 = ε Y s 1 i s 2 i σ i s 2 s 1 + ε s 2 2
where, ε , Y, s 1 ,   s 2 , s 2 i , and σ i are the permittivity of the strong material, the Youngs modulus, the absolute thicknesses of the strong or vaporous layers, the thickness of the ith vaporous layer, and the charge density on the surface of the ith layer, individually. Therefore, using Equation (1), the theoretical value of the 33 coefficient can be calculated and can be evaluated experimentally using different practical methods discussed in the next section.

3. Practical Methods to Determine Longitudinal

In this work, the most common techniques are discussed and compared, namely, the quasistatic, dynamic, interferometric, and acoustic techniques.

3.1. Quasi-Static Method

This is the most common measurement method, which involves exerting a known force on the material and then measuring the voltage produced as a result of the piezoelectric effect. The coefficient can then be calculated based on the applied force and the measured voltage. For instance, a metal box with a ferroelectret sample inside it is grounded. A 100 nF capacitor (greater than the capacitance of the sample) is connected in parallel to the polished electrodes of the sample [18,28]. A digital oscilloscope records the final voltage of the capacitor. To ensure that uniform stress is applied across the sample, the usage of a conductive pad between the top electrode and the sample is emphasized. By utilizing a charge amplifier connected to an oscilloscope, this configuration enables the determination of the quasi-static direct piezoelectric constant by establishing the relationship between the generated charge density and the applied force. With the known value of charge generated and the force applied, the d 33 coefficient can be found [29]:
Q A = d 33 P
Hence, we have the following:
d 33 = q P = Q F
where Q, A, P, F, d 33 are the generated charge, surface of the electrode, stress, force acting on the film sample, and the longitudinal piezoelectric constant. At frequencies higher than 50 kHz, the coefficient begins ascending toward a thickness resonance around 300 kHz [11]. It is seen that the piezoelectric materials show nonlinear behavior over a few 100 Pa, i.e., they become pressure dependent [17,30]. This feature could restrict certain applications of piezoelectric material. One needs to note that in the quasi-static method, a preload is required, such as 10 N, to hold the sample between the measurement heads, and, therefore, the sample is always in compression [31]. This can cause the sample to generate less charge. Therefore, the test results from the quasi-static method need to be extrapolated to zero preload conditions. In order to obtain precise results, it is necessary to compare the tested sample with a reference sample that has a known piezoelectric coefficient. The reproducibility of results is poor, mainly because of the manual handling of the weights used during the experiment. Figure 2 shows the setup of the quasistatic measurement.

3.2. Dynamic Method

In contrast to the quasistatic method, the dynamic method involves applying a high-frequency force to the material and measuring the resulting voltage. The dynamic piezoelectric activity of the cellular polypropylene is exercised by placing a mass m on the sample which is fixed on an exciter supplied with sinusoidal acceleration. A stationary force mg and a dynamic force ma are simultaneously acting on the sample giving rise to a static load p 0 and a dynamic load p ^ d cos w t [14]:
p t = m A g + a ^ cos ω t = p 0 + p ^ d cos ω t
where a ^ and A are the exciter acceleration and the area of sample, respectively. Four distinct parameters, namely, frequency, the amplitude of the input signal of the exciter, mass, and area of the sample, offer viable options for setting boundaries. By varying these parameters, the coefficient can be evaluated under a wide range of conditions. In reference [26], the authors performed the measurement of dynamic d 33 of fluorinated ethylene propylene (FEP) films which shows high values of 1200–1300 pC/N from 5 Hz to 35 Hz. The experiment setup is illustrated in Figure 3. Adhesive tape is used to fix a seismic mass on top of the sample; an electrodynamic exciter is used to accelerate which is connected to a function generator and a power amplifier. A vibration meter measures the acceleration given to the exciter; the electrode charge developed by the sample is recorded with a signal collector through an electrometer, and, by substituting these values in Equation (4), we get the dynamic coefficient value. The frequency independence of dynamic coefficients in the experimental low-frequency range is implied by their experiment [5,11]. Figure 3 shows the setup of the dynamic method.
It should be noted that keeping the static pressure constant is necessary; if the dynamic pressure is increased, then the coefficient also increases over all frequencies [27,32,33]. A comparison of results shows that the d 33 value obtained by the dynamic method is approximately 7% lower than the quasi-static method [34]. The difference is justified by the increase in frequency, resulting in an improvement of Young’s modulus which, in turn, results in a low d 33 value for the dynamic method. After reviewing the dynamic method of measurement of the piezoelectric coefficient, it is seen that the main shortcoming is the same as that for the quasi-static method which is that the results are for only the parts of the sample that are compressed more readily, showing the need for a more averaged value resultant method.

3.3. Interferometric Method

Laser interferometry works on the principle of the inverse piezoelectric effect [5,35,36]. By interferometrically measuring the vibration amplitude of the sample, the ratio of this amplitude and the applied voltage gives the coefficient value. The coefficient can be calculated using the following equation [37]:
d 33 = Δ L   L   F ~
where ΔL is the change in length of the sample, L is the original length of the sample and F ~ is the applied force. An example of such a setup is shown in [38] where the sample under testing was fixed on a platform (probe table) as illustrated in Figure 4. The AC voltage signal is provided to the sample with two probes, and the telescope is used to observe the contact details. Commercial laser interferometers are used to measure the displacement of the top surface of the sample. A glass plate is placed on the piezoelectric sample so that there is a better reflection of the laser signal from the interferometer. The authors performed a frequency response of coefficient over a wide frequency range. During the experiment [39], a voltage of 14 V was applied to the piezoelectric sample, resulting in a 1 nm vibration amplitude at all frequencies. The coefficient gradually decreased from approximately 150 pC/N to about 85 pC/N over the frequency range of 1 Hz to 50 Hz. Young’s modulus for the solid material is the reason behind this behavior. For a thickness resonance for higher frequencies of approximately 300 kHz, the coefficient value starts to rise, reaching up to more than 600 pC/N at resonance. Figure 4 shows the experiment setup for the interferometric method.
Some researchers [39] suggest that laser interferometry and quasistatic methods are mostly adopted when there is not enough time to determine the piezoelectric charge or voltage constant. These interferometers have high resolution (up to nanometers); hence, they are widely used in laboratory conditions. In examination with dynamic techniques (commonly up to 1 kHz), the interferometric strategy for the most part works better in a bigger frequency range (up to a few hundred kHz). After reviewing the literature there are some drawbacks to the interferometric method that one should consider. The Interferometric method is expensive as there is a compulsion to isolate the measuring table from all parasitic vibrations. The whole measurement on a fixed optical table is placed on a single base in order to eliminate maximum outer vibrations. Another aspect to remember is the need to have precision identified with the development of the estimating equipment. Any little inconsistency or aggravation during the estimation impacts the accuracy of measurement. Since the diameter of the laser in the interferometer is supposed to be no more than 100 μm, there is not enough averaging conducted over the sample area [40,41].

3.4. Acoustic Method

The direct piezoelectric impact, in a more roundabout methodology, is utilized in an acoustic method for deciding the coefficient. The cellular film can function as a microphone, and the sensitivity of the microphone can be used to determine the piezoelectric strain d 33 coefficient, which is defined as follows [34]:
M = V ¯ p ¯ = d 33 S 1 + ε S 2 ε ε 0
33 = M C A
where, S 1 , S 2 , ε , M, V ¯ , p are combined thicknesses of all solid and gaseous layers, permittivity of the solid material, the microphone sensitivity, open circuit voltage, the sound pressure acting on the microphone diaphragm, respectively. The coefficient is found by knowing the capacitance of the cellular ferroelectret sample used and its surface area. In reference [42], the authors employed the acoustic technique within the 300 Hz to 1000 Hz frequency range. The author utilized a circular ferroelectret film sample with a 22 mm diameter. The experiment setup used is illustrated in Figure 5. Double-sided adhesive conductive tape is used to stick the sample on a brass back electrode. An aluminum housing is used to protect the acoustic measurements from other noise interferences. However, the experiment is performed in an anechoic chamber to avoid all noise. The sound source is an active loudspeaker placed 30 cm away from the ferroelectret microphone. A power amplifier is used to amplify the loudspeaker sound. A charge amplifier is used to amplify the charge generated which is then received by a signal recorder. Equation (6) can be used to calculate the pressure sensitivity of the film microphone. With knowledge of the sensitivity, effective capacitance, and sample area, Equation (8) can be used to easily calculate the coefficient. For the tested sample at 300 Hz, the coefficients ranged from 400 to 700 pC N−1, despite a measured pressure of only 0.001 kPa. Thus, acoustic method gives the most found middle value out of the wide range of various methods [43,44,45]. However, its major drawback is the need for an anechoic chamber which makes it costly and a long methodology. Figure 5 shows the setup of the acoustic method.

4. Proposed Measurement Device

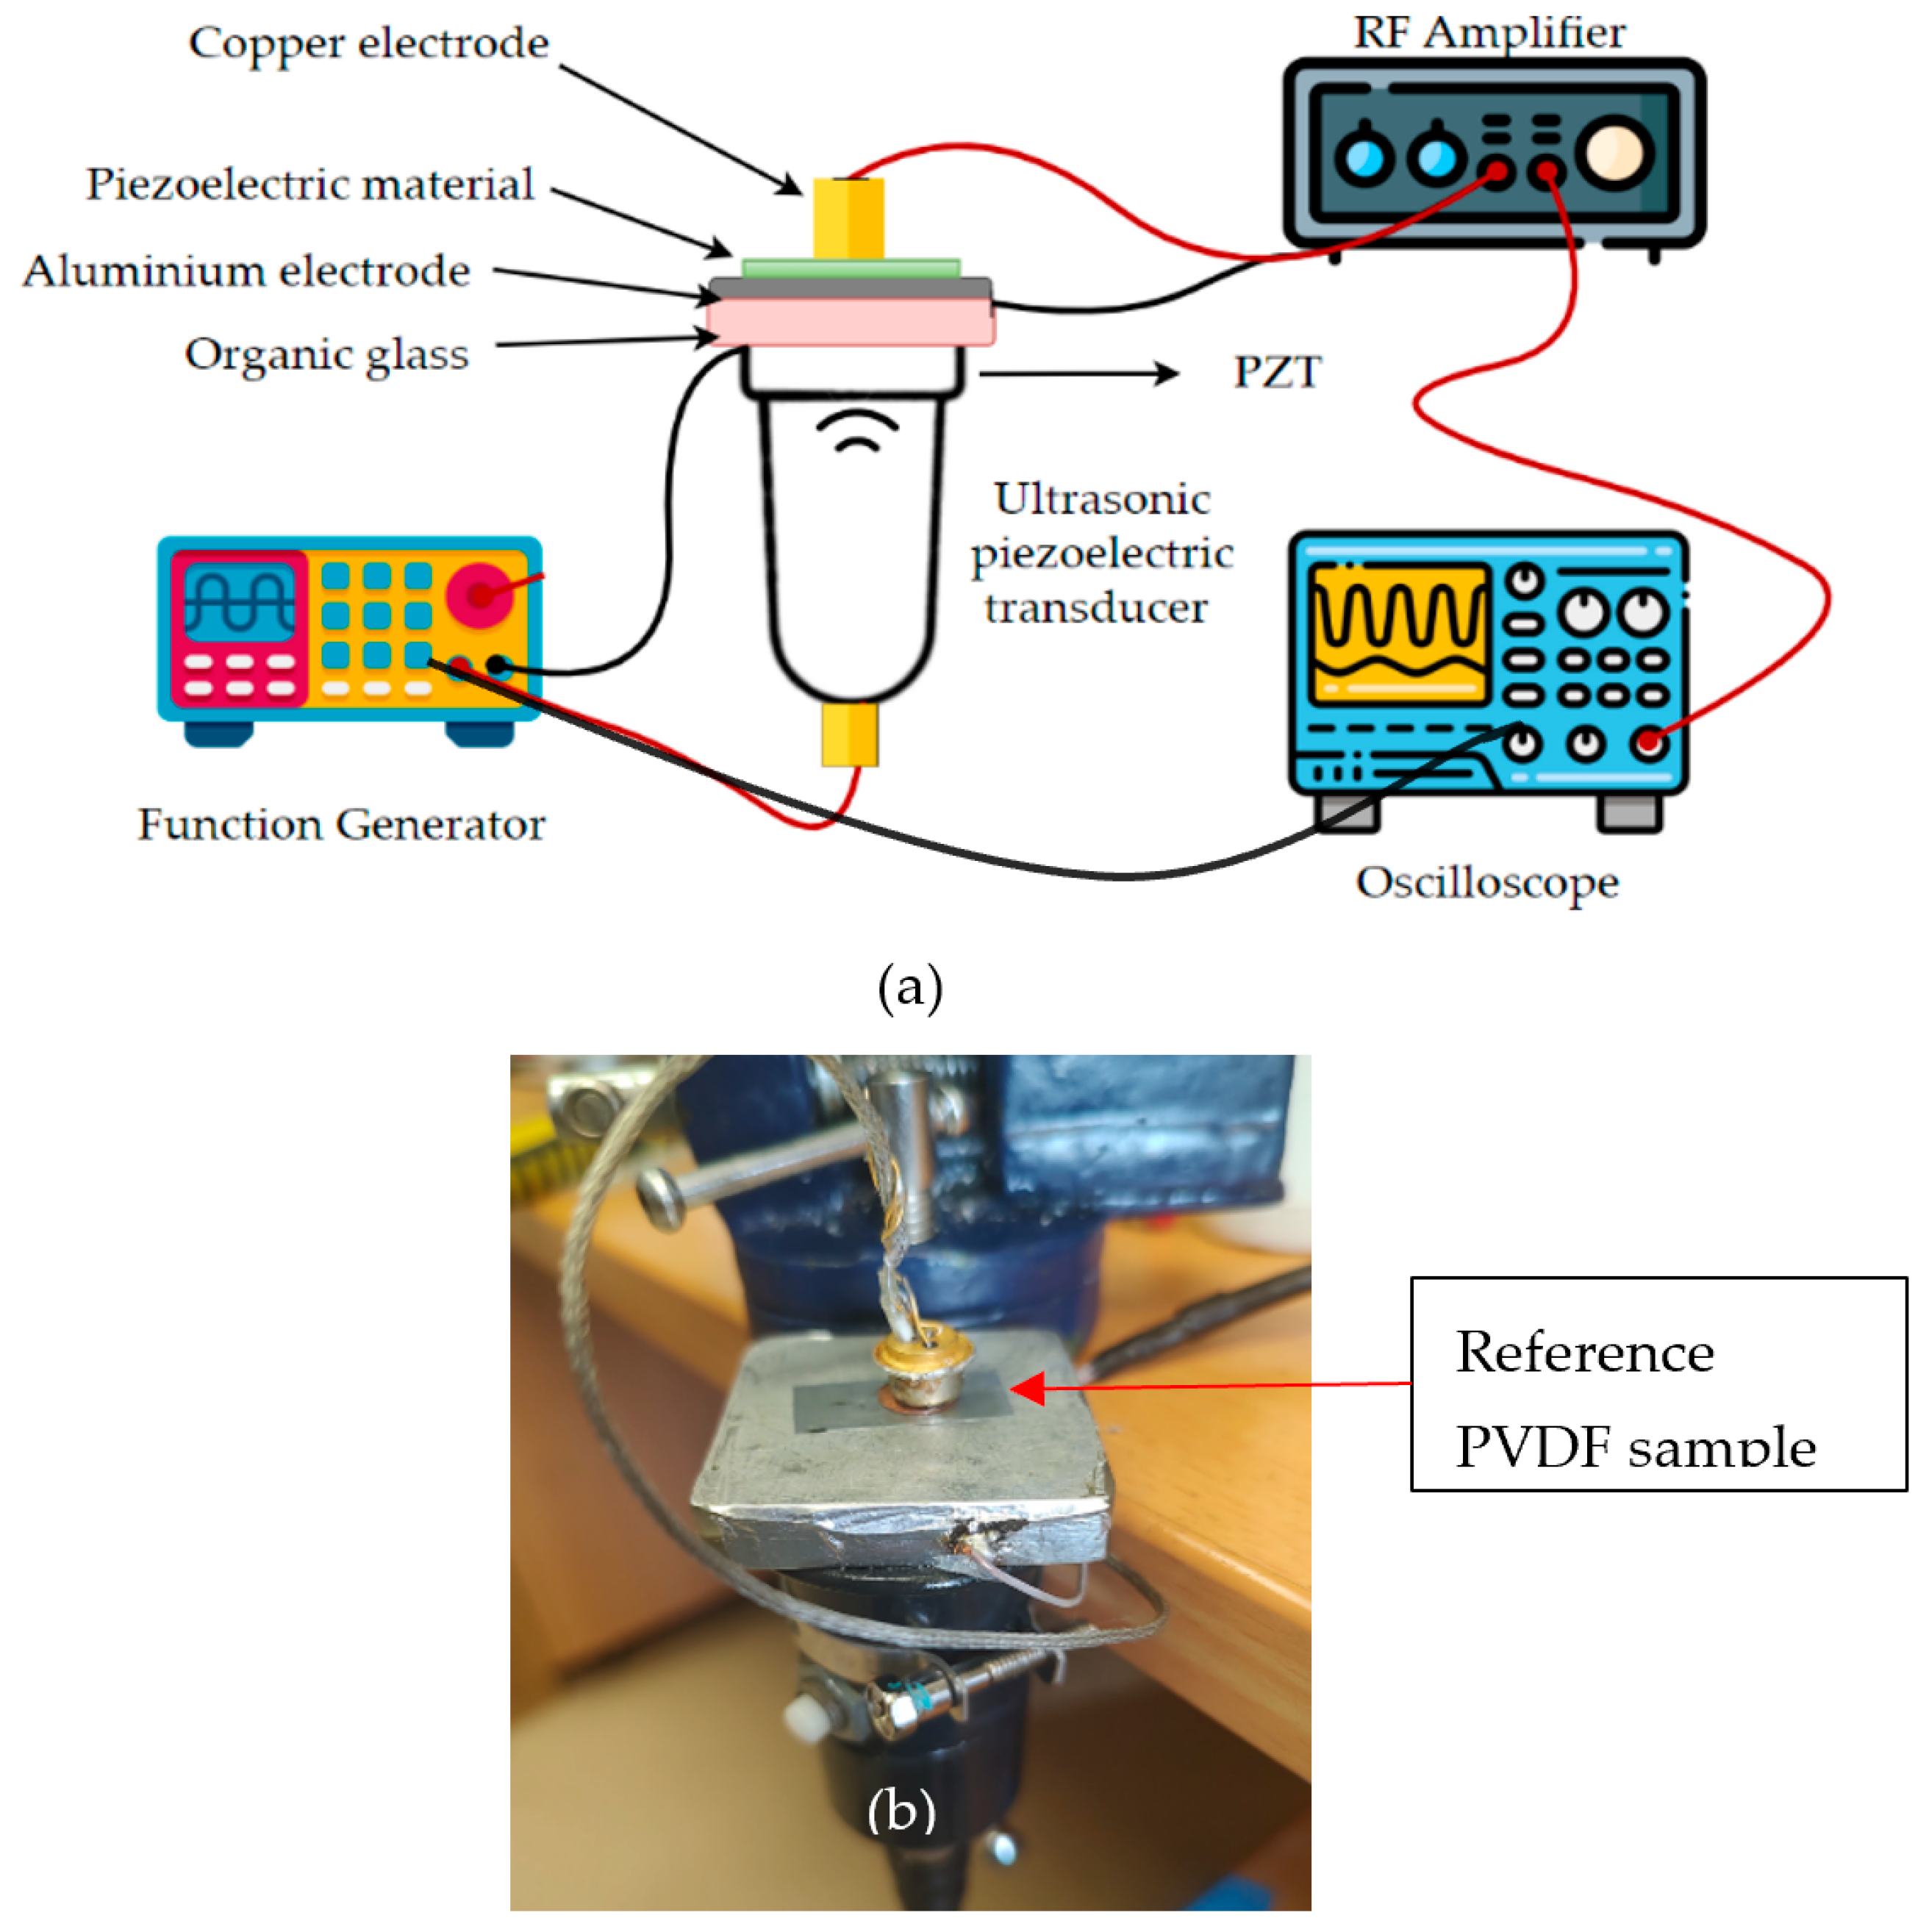
4.1. Experiment Setup

In this study, a test setup was devised to conduct measurements using a 1.4 MHz PZT (lead zirconate titanate) ultrasonic piezoelectric transducer, a probe, and an amplifier. The primary purpose of the setup was to stimulate the piezoelectric material under examination using ultrasonic oscillations and obtain a response impulse correlated with the 33 factor. The test setup consisted of several key components. The heart of the setup was the PZT ultrasonic piezoelectric transducer, specifically designed to apply ultrasonic oscillations to the piezoelectric material being tested. This transducer was chosen for its ability to induce vibrations in the material at a frequency of 1.4 MHz, which is ideal for our experiment.
The sample being tested was carefully positioned on an earth electrode plate. This plate was strategically placed above the piezoelectric transducer to ensure that the vibrations generated by the transducer effectively reach the sample. The use of an earth electrode plate is essential as it provides a stable reference potential for the measurements, reducing noise and improving accuracy.
To create the necessary electrodes for the setup, two different materials were used. The bottom electrode, which came in direct contact with the sample, was made using a thin aluminum foil of 50µm. The choice of aluminum was driven by its cost-effectiveness and robustness. On the other hand, the upper electrode was made of copper. Copper was chosen for its mechanical robustness and excellent conductivity, ensuring the efficient transfer of electrical signals. A few drops of machine oil were used on the sample to ensure that there were no small air bubbles under the sample. To delay the mechanical vibrations reaching the sample, an organic glass layer made of PMMA (Poly(methyl methacrylate)) was used. This delay is essential to ensure that the vibrations from the ultrasound sensor are well-timed and synchronized with the measurements of the piezoelectric material.
The samples used for the experiment were polarized PVDF (polyvinylidene fluoride) films. These samples were carefully positioned on the organic glass layer. To enable the oscilloscope to measure the output voltage induced by the vibration from the ultrasound sensor, copper and aluminum connectors were used on both sides of the PVDF samples. This output voltage was directly related to the 33 factor, allowing us to characterize the piezoelectric material under examination accurately.
Figure 6 illustrates the complete experiment setup for conducting the measurements. The arrangement of the components, including the PZT ultrasonic piezoelectric transducer, the PVDF samples on the organic glass, and the oscilloscope, is shown in the figure.

4.2. Methodology and Result

A standard PVDF material with a precise d 33 value was prepared as a benchmark. Subsequently, the piezoelectric charge constant of PVDF can be assessed by measuring the output voltage with an oscilloscope, as depicted in Figure 7. The piezoelectric transducer was stimulated at a frequency of 1.4 MHz using 3-period pulses every 10 ms. These pulses had an amplitude of 20 Vpp. The probe recorded the signal with a positive electrode connected to the piezoelectric material. The negative electrode of the testing apparatus consisted of an aluminum foil located at the base of the piezoelectric transducer. The signal from the probe was amplified and then transmitted to the oscilloscope. The attenuation factor in the RF preamplifier is 10.30 DB. The attenuation factor does not affect measurement errors, because measuring equipment accuracy (reference) is calibrated using a piezoelectric material sample with well-known d 33 . In the oscilloscope, the signal was synchronized and correlated with the output of the signal generator. An overview of the entire testing apparatus is presented in Figure 6a. The d33 value can be calculated as follows:
d 33 = V o V s t d × d s t d ,
where Vo is the output voltage from experimental PVDF material and Vstd is the output voltage from standard material. dstd is 25 pC/N as provided by the manufacturer. The whole process of the experiment was carried out step by step as shown in Figure 7.
In Figure 7, one can observe 2 channels of signals: the first channel (in yellow) is the signal at the output of the amplifier and the second channel (in blue) is the synchronization signal from the signal generator. The first pulse sequence on channel one, above the synchronization signal, is the probing signal, and it can be seen from the figure that the probing signal recorded was very weak. The second signal is the pulse train caused by the piezoelectric phenomenon that was measured. The other pulses were considered as reflections, and their amplitudes were not measured. The test bench set up was only suitable for inter-sample comparison. In order to calculate the d 33 coefficients of the available samples, it was decided to compare them with a reference sample. A reference specimen is a commercially available, industrially polarized specimen with measured and described parameters and characteristics. It was decided to use this sample for the calculation of all the results obtained in the polarization experiments, and its results are also shown in Figure 7. The peak amplitude of the reference sample due to the piezoelectric phenomenon was measured on the test bench to be 1200 mV, and, if we assume this value corresponds to the piezoelectric coefficient mentioned by the manufacturer, then the peak amplitudes of the other samples can be measured, and their d 33 can be estimated using Equation (8).

5. Discussion

The proposed ultrasound transducers offer distinct advantages and specific challenges when used for d 33 coefficient measurement compared to other techniques such as the quasi-static, dynamic, interferometric, and acoustic methods. We have examined this method and observed the problems and advantages of ultrasound transducers. The advantages of ultrasound Transducers are as listed below:
  • Non-Destructive Testing: Ultrasound transducers enable non-destructive testing, allowing measurements to be taken without damaging the sample. This advantage is particularly useful when evaluating the d 33 coefficient in piezoelectric materials, as it ensures the material’s integrity is preserved.
  • Wide Frequency Range: Ultrasound transducers can operate over a broad frequency range, making them suitable for measuring the d 33 coefficient in various materials with different resonance frequencies. This versatility allows for the comprehensive characterization of piezoelectric materials across different applications.
  • Real-Time Measurements: Ultrasound transducers provide real-time measurements, enabling immediate feedback on the d 33 coefficient. This real-time capability facilitates prompt adjustments or modifications during material development or quality control processes.
  • High Sensitivity: Ultrasound transducers offer high sensitivity, making them capable of detecting small variations in the d 33 coefficient. This sensitivity allows for precise measurements, crucial in applications that require accurate characterization and optimization of piezoelectric materials.
The challenges of the proposed ultrasound transducer method are listed below:
  • Problems with Electrode Contact: Measurements are affected by the acoustic junction between the sample and the electrode while in contact. If there is an air gap between the electrode and sample, the ultrasound signal can be reflected away from the sample due to the three big differences between the air impendence and the acoustic impedance. Hence, the use of any kind of liquid layer such as oil on the electrode is necessary.
  • Coupling Issues: Achieving effective coupling between the ultrasound transducer and the sample surface can be challenging. Proper coupling is necessary to ensure efficient transmission and reception of ultrasound waves, which directly affects the accuracy of the d 33 coefficient measurement.
  • Reflections and Interference: Ultrasound waves can encounter reflections and interference, leading to inaccuracies in the measured d 33 coefficient. These issues arise when ultrasound waves encounter boundaries or interfaces within the material, causing signal distortion and potential measurement errors.
  • Calibration Requirements: Calibration is crucial for an accurate d 33 coefficient measurement using ultrasound transducers. Calibration ensures that the transducer response is well-characterized and properly accounted for during measurements. However, calibration procedures can be time-consuming and require careful attention to detail.
In comparison to other techniques such as quasi-static, dynamic, interferometric, and acoustic methods, ultrasound transducers offer the advantages of non-destructive testing, wide frequency range, real-time measurements, and high sensitivity. However, they also face challenges related to coupling, reflections, calibration, and signal processing complexity. The choice of measurement technique depends on the specific requirements of the application, the desired accuracy, and the nature of the material being characterized. Advantages and limitations of all the methods reviewed in the literature are compared and highlighted in Table 1.

6. Conclusions

From the reviewed references about d 33 estimation methods, the following points are worth noting:
  • Laser interferometry and quasistatic methods can be used to estimate the piezoelectric charge or voltage constants quickly. To investigate the sensitivity of piezoelectricity to mechanical fatigue and static stresses, the dynamic method is preferred. Whereas, when a clear understanding of the frequency response of piezoelectricity is needed, then the acoustical method is suitable.
  • The development of an ultrasound piezoelectric transducer was performed to estimate the coefficient with a reference value. The purpose of the method was mainly to measure the values of piezoelectric materials in order to measure the efficiency of the poling method which will be presented in future works. The investigation of the proposed ultrasound piezoelectric transducer is yet in the preliminary stage, and future work will aim to calibrate the device and to eliminate the other challenges discussed in the previous section.
  • The test setup described in this study allowed for the effective measurement of the d 33 factor of piezoelectric materials using a 1.4 MHz PZT ultrasonic piezoelectric transducer. The arrangement of the components, including the use of organic glass, copper, and aluminum electrodes, ensured accurate and reliable measurements. This setup can be valuable for various applications requiring the characterization of piezoelectric materials and understanding their behavior under specific conditions.
  • We put forward a comparative review to investigate the behavior of piezoelectric polymers under different pressure and temperature conditions. The piezoelectric capacity of these harvesters is crucial in predicting their service life and determining the maximum safe operating temperature range. This information is critical for storage and final applications, as it can help reduce device failures and promote a more efficient use of existing materials.

Author Contributions

C.R. and V.M. jointly conceived the idea. C.R. and V.M. designed and fabricated the device, built the experimental setup, and performed experiments. C.R. wrote the manuscript with contributions from all co-authors. All authors have read and agreed to the published version of the manuscript.

Funding

This research received no external funding.

Data Availability Statement

The data presented in this study is available on request from the corresponding author.

Conflicts of Interest

The authors declare no conflict of interest.

References

  1. Tian, D.; Jeong, D.-Y.; Fu, Z.; Chu, B. Flexoelectric Effect of Ferroelectric Materials and Its Applications. Actuators 2023, 12, 114. [Google Scholar] [CrossRef]
  2. Pal, S.; Sarath, N.V.; Priya, K.S.; Murugavel, P. A review on ferroelectric systems for next generation photovoltaic applications. J. Phys. D Appl. Phys. 2022, 55, 283001. [Google Scholar] [CrossRef]
  3. Ben Dali, O.; Pondrom, P.; Sessler, G.M.; Zhukov, S.; von Seggern, H.; Zhang, X.; Kupnik, M. Cantilever-based ferroelectret energy harvesting. Appl. Phys. Lett. 2020, 116, 243901. [Google Scholar] [CrossRef]
  4. Gerard, M.; Bowen, C.R.; Osman, F.H. Processing and Properties of PTFE-FEP-PTFE Ferroelectret Films. Ferroelectrics 2011, 422, 59–64. [Google Scholar] [CrossRef]
  5. Zhang, Y.; Phuong, P.T.T.; Roake, E.; Khanbareh, H.; Wang, Y.; Dunn, S.; Bowen, C. Thermal Energy Harvesting Using Pyroelectric-Electrochemical Coupling in Ferroelectric Materials. Joule 2020, 4, 301–309. [Google Scholar] [CrossRef]
  6. Ma, X.; Zhang, X. Low cost electrostatic vibration energy harvesters based on negatively-charged polypropylene cellular films with a folded structure. Smart Mater. Struct. 2017, 26, 085001. [Google Scholar] [CrossRef]
  7. Klimiec, E.; Królikowski, B.; Machnik, M.; Zaraska, W.; Dzwonkowski, J. Increase of Piezoelectric Constant and Thermal Durability of Polypropylene Electret by Introducing SiO2 and Kaolin Filler and Creating a Cellular Structure. J. Electron. Mater. 2015, 44, 2283–2291. [Google Scholar] [CrossRef]
  8. Wang, J.; Lou, J.; Wang, J.F.; Qu, S.B.; Du, H.L.; Cui, T.J. Ferroelectric composite artificially-structured functional material: Multifield control for tunable functional devices. J. Phys. D Appl. Phys. 2022, 55, 303002. [Google Scholar] [CrossRef]
  9. Zhao, Y.; Zhang, Y.; Xu, J.; Zhang, M.; Yu, P.; Zhao, Q. Frequency domain analysis of mechanical properties and failure modes of PVDF at high strain rate. Constr. Build. Mater. 2019, 235, 117506. [Google Scholar] [CrossRef]
  10. Kivirand, T. Method for Measuring Piezoelectric Charge Coefficients. Master’s Thesis, Tallin University of Technology, Tallin, Estonia, 2015; pp. 1–66. [Google Scholar]
  11. Stewart, M.; Battrick, W.; Cain, M. Measuring Piezoelectric d 33 co-efficients using the Direct Method Measuring Piezoelectric d 33 coefficients using the Direct Method Contents. In Measurement Good Practice Guide No. 44; Materials Centre National Physical Laboratory: Teddington, UK, 2001. [Google Scholar]
  12. Hillenbrand, J.; Sessler, G.M.; Zhang, X. Verification of a model for the piezoelectric d33 coefficient of cellular electret films. J. Appl. Phys. 2005, 98, 064105. [Google Scholar] [CrossRef]
  13. Gusarov, B.; Gusarova, E.; Viala, B.; Gimeno, L.; Cugat, O. PVDF piezoelectric voltage coefficient in situ measurements as a function of applied stress. J. Appl. Polym. Sci. 2015, 133, 43248. [Google Scholar] [CrossRef]
  14. Guo, Q.; Cao, G.Z.; Shen, I.Y. Measurements of Piezoelectric Coefficient d33 of Lead Zirconate Titanate Thin Films Using a Mini Force Hammer. J. Vib. Acoust. 2013, 135, 011003. [Google Scholar] [CrossRef]
  15. Finot, E.; Passian, A.; Thundat, T. Measurement of Mechanical Properties of Cantilever Shaped Materials. Sensors 2008, 8, 3497–3541. [Google Scholar] [CrossRef]
  16. Yang, K.; Li, Z.; Jing, Y.; Chen, D.; Ye, T. Research on the resonant frequency formula of V-shaped cantilevers. In Proceedings of the 2009 4th IEEE International Conference on Nano/Micro Engineered and Molecular Systems, Shenzhen, China, 5–8 January 2009; pp. 59–62. [Google Scholar] [CrossRef]
  17. Fang, P.; Holländer, L.; Wirges, W.; Gerhard, R. Piezoelectric d33 coefficients in foamed and layered polymer piezoelectrets from dynamic mechano-electrical experiments, electro-mechanical resonance spectroscopy and acoustic-transducer measurements. Meas. Sci. Technol. 2012, 23, 035604. [Google Scholar] [CrossRef]
  18. Shetty, S.; Yang, J.I.; Stitt, J.; Trolier-McKinstry, S. Quantitative and high spatial resolution d33 measurement of piezoelectric bulk and thin films. J. Appl. Phys. 2015, 118, 174104. [Google Scholar] [CrossRef]
  19. Zhang, X.; Hillenbrand, J.; Sessler, G.M. Ferroelectrets with improved thermal stability made from fused fluorocarbon layers. J. Appl. Phys. 2007, 101, 054114. [Google Scholar] [CrossRef]
  20. Kos, T.; Slabki, M.; Petrovcic, J.; Vrancic, D.; Dolanc, G.; Koruza, J. Measurement System for Piezoelectric Resonance Impedance Spectroscopy Under Combined AC and High-Voltage DC Loading. IEEE Trans. Ultrason. Ferroelectr. Freq. Control. 2022, 69, 3137–3144. [Google Scholar] [CrossRef]
  21. Kelley, T. Effect of temperature on the pulse-echo performance of ultrasonic transducers fabricated with PVDF film. IET Sci. Meas. Technol. 2019, 13, 370–374. [Google Scholar] [CrossRef]
  22. Mahbub, I.; Wang, H.; Islam, S.K.; Pullano, S.A.; Fiorillo, A.S. A low power wireless breathing monitoring system using piezoelectric transducer. In Proceedings of the 2016 IEEE International Symposium on Medical Measurements and Applications (MeMeA), Benevento, Italy, 15–18 May 2016. [Google Scholar] [CrossRef]
  23. Jiang, L.; Wu, B.; Wei, X.; Lv, X.; Xue, H.; Lu, G.; Zeng, Y.; Xing, J.; Wu, W.; Wu, J. Flexible lead-free piezoelectric arrays for high-efficiency wireless ultrasonic energy transfer and communication. Mater. Horizons 2022, 9, 2180–2190. [Google Scholar] [CrossRef]
  24. Lu, H.; Cui, H.; Lu, G.; Jiang, L.; Hensleigh, R.; Zeng, Y.; Rayes, A.; Panduranga, M.K.; Acharya, M.; Wang, Z.; et al. 3D Printing and processing of miniaturized transducers with near-pristine piezoelectric ceramics for localized cavitation. Nat. Commun. 2023, 14, 054114. [Google Scholar] [CrossRef]
  25. Wu, N.; Cheng, X.; Zhong, Q.; Zhong, J.; Li, W.; Wang, B.; Hu, B.; Zhou, J. Cellular Polypropylene Piezoelectret for Human Body Energy Harvesting and Health Monitoring. Adv. Funct. Mater. 2015, 25, 4788–4794. [Google Scholar] [CrossRef]
  26. Zhang, X.; Sessler, G.M.; Wang, Y. Fluoroethylenepropylene ferroelectret films with cross-tunnel structure for piezoelectric transducers and micro energy harvesters. J. Appl. Phys. 2014, 116, 074109. [Google Scholar] [CrossRef]
  27. Hillenbrand, J.; Sessler, G. Quasistatic and dynamic piezoelectric coefficients of polymer foams and polymer film systems. IEEE Trans. Dielectr. Electr. Insul. 2004, 11, 72–79. [Google Scholar] [CrossRef]
  28. Neugschwandtner, G.S.; Schwödiauer, R.; Vieytes, M.; Bauer-Gogonea, S.; Bauer, S.; Hillenbrand, J.; Kressmann, R.; Sessler, G.M.; Paajanen, M.; Lekkala, J. Large and broadband piezoelectricity in smart polymer-foam space-charge electrets. Appl. Phys. Lett. 2000, 77, 3827–3829. [Google Scholar] [CrossRef]
  29. Mohebbi, A.; Mighri, F.; Ajji, A.; Rodrigue, D. Cellular Polymer Ferroelectret: A Review on Their Development and Their Piezoelectric Properties. Adv. Polym. Technol. 2016, 37, 468–483. [Google Scholar] [CrossRef]
  30. Fialka, J.; Benes, P. Comparison of methods of piezoelectric coefficient measurement. In Proceedings of the 2012 IEEE International Instrumentation and Measurement Technology Conference Proceedings, Graz, Austria, 13–16 May 2012; pp. 37–42. [Google Scholar] [CrossRef]
  31. Longbiao, H.; Xiujuan, F.; Triantafillos, K.; Feng, N.; Bo, Z.; Ping, Y. Comparison between Methods for the Measurement of the d33 Constant of Piezoelectric Materials. In Proceedings of the ICSV25, Horoshima, Japan, 9–12 July 2018; pp. 77–84. [Google Scholar]
  32. Hillenbrand, J.; Sessler, G. Foamed and solid polymer electrets with high piezoelectric constants. In Proceedings of the Annual Report Conference on Electrical Insulation and Dielectric Phenomena, Cancun, Mexico, 20–24 October 2002; pp. 287–290. [Google Scholar] [CrossRef]
  33. Hillenbrand, J.; Sessler, G. Piezoelectricity in cellular electret films. IEEE Trans. Dielectr. Electr. Insul. 2000, 7, 537–542. [Google Scholar] [CrossRef]
  34. Zhang, X.; Hillenbrand, J.; Sessler, G. Thermally stable fluorocarbon ferroelectrets with high piezoelectric coefficient. Appl. Phys. A 2006, 84, 139–142. [Google Scholar] [CrossRef]
  35. Zabek, D.; Bowen, C.R.; Taylor, J. Electrical capacitance with meshed electrodes for piezo- and pyro-electric energy harvesting applications. In Proceedings of the 2015 Joint IEEE International Symposium on the Applications of Ferroelectric (ISAF), International Symposium on Integrated Functionalities (ISIF), and Piezoelectric Force Microscopy Workshop (PFM), Singapore, 24–27 May 2015; pp. 83–86. [Google Scholar] [CrossRef]
  36. Basso, H.; Neto, L.G.; Lima, L.; Altafim, R.; de Aquino, C. Piezoelectricity in multi-air voids electrets. In Proceedings of the CEIDP ‘05. 2005 Annual Report Conference on Electrical Insulation and Dielectric Phenomena, Nashville, TN, USA, 16–19 October 2005; pp. 669–672. [Google Scholar] [CrossRef]
  37. Bernard, C.A.; Correia, J.P.M.; Ahzi, S.; Bahlouli, N. Numerical implementation of an elastic-viscoplastic constitutive model to simulate the mechanical behaviour of amorphous polymers. Int. J. Mater. Form. 2016, 10, 607–621. [Google Scholar] [CrossRef]
  38. Pardo, L.; Jiménez, R.; García, A.; Brebøl, K.; Leighton, G.; Huang, Z. Impedance measurements for determination of the elastic and piezoelectric coefficients of films. Adv. Appl. Ceram. 2010, 109, 156–161. [Google Scholar] [CrossRef]
  39. Gusarov, B. PVDF Piezoelectric Polymers: Characterization and Application to Thermal Energy Harvesting. Available online: https://theses.hal.science/tel-01241414 (accessed on 9 August 2023).
  40. Zhang, Y.; Bowen, C.R.; Ghosh, S.K.; Mandal, D.; Khanbareh, H.; Arafa, M.; Wan, C. Ferroelectret materials and devices for energy harvesting applications. Nano Energy 2018, 57, 118–140. [Google Scholar] [CrossRef]
  41. Anton, S.R.; Farinholt, K.M. An evaluation on low-level vibration energy harvesting using piezoelectret foam. Act. Passive Smart Struct. Integr. Syst. 2012, 8341, 83410G. [Google Scholar]
  42. Ma, X.; Von Seggern, H.; Sessler, G.M.; Zhukov, S.; Ben Dali, O.; Kupnik, M.; Zhang, X. High performance fluorinated polyethylene propylene ferroelectrets with an air-filled parallel-tunnel structure. Smart Mater. Struct. 2020, 30, 015002. [Google Scholar] [CrossRef]
  43. Chiu, F.-C.; Chuang, Y.-C.; Liao, S.-J.; Chang, Y.-H. Comparison of PVDF/PVAc/GNP and PVDF/PVAc/CNT ternary nanocomposites: Enhanced thermal/electrical properties and rigidity. Polym. Test. 2018, 65, 197–205. [Google Scholar] [CrossRef]
  44. Qiu, X.; Groth, F.; Wirges, W.; Gerhard, R. Cellular polypropylene foam films as DC voltage insulation and as piezoelectrets—A comparison. IEEE Trans. Dielectr. Electr. Insul. 2018, 25, 829–834. [Google Scholar] [CrossRef]
  45. Guo, Y.; Bao, C.; Song, L.; Yuan, B.; Hu, Y. In Situ Polymerization of Graphene, Graphite Oxide, and Functionalized Graphite Oxide into Epoxy Resin and Comparison Study of On-the-Flame Behavior. Ind. Eng. Chem. Res. 2011, 50, 7772–7783. [Google Scholar] [CrossRef]
Figure 1. (a) Transverse piezoelectric coefficient. (b) Longitudinal piezoelectric coefficient.
Processes 11 02432 g001
Figure 2. Setup of quasistatic measurement.
Processes 11 02432 g002
Figure 3. Setup of dynamic measurement method.
Processes 11 02432 g003
Figure 4. Interferometric method setup.
Processes 11 02432 g004
Figure 5. Acoustic method experiment setup.
Processes 11 02432 g005
Figure 6. (a) Schematic of measurement of PVDF coefficient via ultrasound sensor. (b) Photo of the proposed ultrasound test equipment.
Processes 11 02432 g006
Figure 7. Test result of the reference sample measured from the proposed ultrasound method.
Processes 11 02432 g007
Table 1. Summary of a comparison of the different methods used to measure values.
No.FeaturesQuasi-StaticDynamicInterferometricAcousticProposed Method
1ProcedureDirectDirectIndirectIndirectDirect
3 33 coefficient(pC/N)1000–25001200–1300150–700300–350All values
4AccurateNoNoYesYesModerate accuracy
5RepeatableNoNoYesYesYes
6Time-consumingYesYesYesYesno
7Special equipment neededNoNoYesYesyes
8Wide frequency rangeNoNoYesYesyes
9Non-destructiveNoNoYesYesyes
10Independent of geometry, electrode contactNoNoYesYesDepends on electrode conatct
11Suitable for the highly viscoelasticand resistive materialNoNoYesYesyes
Disclaimer/Publisher’s Note: The statements, opinions and data contained in all publications are solely those of the individual author(s) and contributor(s) and not of MDPI and/or the editor(s). MDPI and/or the editor(s) disclaim responsibility for any injury to people or property resulting from any ideas, methods, instructions or products referred to in the content.

