Abstract
The power quality estimation for distribution network connected DG (distributed generation) is important in the power system. The significance testing for power quality indicator is less used in traditional power quality evaluation. However, the power quality indicator is affected by various factors of the power system, which seriously impact the power quality evaluation result. To solve this problem, A novel power quality comprehensive estimation model based on multi-factor variance analysis for distribution network with DG is proposed in this paper, in which the significance testing is carried out for power quality indicator with the various system factors, and then to generate the evaluation weights in different levels, further to obtain the power quality assessment results for single node. And then, the dual-significance tests are carried out to generate the weight of node and to obtain the comprehensive estimation result of whole system. At last, an example is developed to validate that, compared with the traditional power quality evaluation, the proposed method is more reasonable and effective in the power quality evaluation for DG connected distribution network.
1. Introduction
Energy is always one of the driving forces for social development. The human demand for energy is increasing gradually with the development of social and economic. However, the limitations of the traditional fossil energy sources appear, such as being not renewable, being unfriendly to the environment, etc. Therefore, various forms of renewable energy are gradually developed and utilized, in which the PV (photovoltaic) system and WP (wind power) system are utilized widely because of their renewable and clean, and their utilized scale is second to the traditional thermal power and hydropower [1,2,3,4].
The new energy power generation can be divided into centralized power generation and DG, in which the distributed PV system or the WP system is built in the around load, the output power of which is injected into the distribution network and most of them are consumed by the local load. In this case, the new energy resources around the load are fully developed, and the impact of new energy to the main grid is reduced by using the ‘used locally’ mode. At the same, the loss of long-distance transmission is also reduced. Therefore, the DG has attracted more and more research [5,6,7,8,9,10].
However, the DGs are connected to the distribution network at multiple nodes, and they are mixed and connected with loads. In addition, the generation power of DG and load power are randomness and volatility. In this case, the distribution network power flow appears uncertain while multiple DGs are integrated into the distribution power network. At the same, they also may result in a variety of power quality problems, such as voltage deviation, frequency deviation, harmonics, and so on [11,12,13,14,15,16].
It is necessary to develop reasonable power quality estimation model for distribution network with DG, to reflect the power quality level of the network quantificationally. The power quality estimation model includes the power quality estimation for the node and the power quality estimation for the whole system. Generally, in the estimation process, the typical power quality indicators are selected firstly, and then the data of those power quality indicators are collected. A further step is that the power quality indicators will be quantified and weighted to obtain the power quality evaluation result [17,18,19,20,21,22,23,24,25,26,27,28,29]. The estimation model can provide a useful reference for power quality management.
Therefore, how to assign reasonable weight for the power quality indicators is needed to study intensively.
In the traditional power quality evaluation, the most of studies are focused on the selection of power quality indicators, the formulation of standards, and the power quality evaluation of the distribution network. In several power quality evaluation methods based on the characteristics of power quality data are proposed and applied, such as the EW (entropy weight) method, CRITIC (criteria importance though intercriteria correlation) method, clustering, etc. [18,19,20,21]. And then, in order to combine the management experience and the characteristics of power quality data, several combination power quality evaluation methods are proposed, for example, the combination of AHP (analytic hierarchy process) method and objective entropy weight method [22,23].
At present, more and more mathematical optimization algorithms are used to evaluate the power quality, or power quality index assessment [24,25,26,27,28,29], to improve the data processing ability and the evaluation accuracy, including fuzzy algorithms, machine learning, aggregation, cluster analysis, etc.
Nowadays more and more DGs are connected to the distribution network, which results in serious power quality problems. Therefore, more requirements for power quality evaluation are needed such as the characteristics of each power quality index should be reflected in the process and result of power quality evaluation.
However, while the DGs are connected to the multiple nodes of the distribution network. It will cause a variety of power quality problems and those power quality problems are independent and correlated, which are related to the operating conditions, network topology and load characteristics of the distribution network and DG. It appears the characteristics of multi-factor interaction.
By using the traditional power quality evaluation method, the statistical law of power quality data is considered. However, the correlation between power quality data and operating conditions, connection grid nodes, is less considered. In the actual evaluation process, the power quality index data may change with the net nodes of DG connected, and the different sampling times (as the different working conditions).
Focusing on the above-mentioned problem in the power quality evaluation, a novel power quality comprehensive estimation model based on multi-factor variance analysis for distribution network with DG is proposed in this paper, the significance test is developed to check out whether the influence factor is existing or results from the random error. And then, the significance test result is taken into the power quality evaluation, to obtain a more reasonable power quality evaluation result, to provide more useful reference for the subsequent power quality management in the distribution network.
2. Power Quality Problem Analysis for Distributed Power Network Connected Multi-DGs
2.1. Topological Structure
While the DGs, such as wind power and PV system, are connected to the grid, they should satisfy the relevant grid-tied standards. As shown in Figure 1, there are multiple DGs connected to the distributed power network.
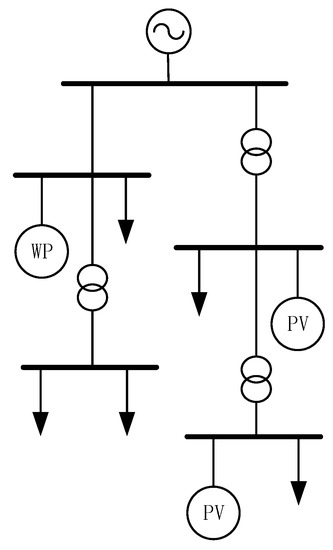
Figure 1.
Schematic diagram of distributed power network with DGs.
Most of the DGs are connected to the network by using the power electronic converters and transformers. There are some loads that are also in the grid-tied node, which absorb the output power of the nearby DG. The surplus output power of the DG is injected into the distributed power network.
2.2. Power Quality Problem Analysis
The output power of DGs, such as the wind power and PV system, fluctuates and is intermittent, because of the relationship between the output power and climate factors. At the same time, the load power is also randomness and volatility. All of which are result in the power flow fluctuation of distributed power network, and lead to the power quality problem which will be analyzed in the following.
2.2.1. Power Quality Analysis for the Distributed Power Network Connected Wind Power
The voltage quality problems, including voltage deviation, may result from the wind power. In the wind power system, the doubly-fed generator set and direct drive permanent magnet generator are usually used, in which the power electronic converter is used to realize the transformation of power form and the control of the active power and reactive power of the unit to a certain value. However, while the wind power fluctuation is dramatic, the short-term reactive power imbalance may appear which may lead to the voltage deviation.
Moreover, the working performance of the power electronic converter may be affected by the interaction between the power electronic converter and the nonlinear load or the three-phase unbalanced load in the local load, which may generate the harmonic current or negative sequence current.
Compared with the distribution network whose capacity is large, the capacity of the distributed wind power system is generally smaller. Therefore, the wind power fluctuation cannot cause the frequency fluctuation obviously. However, in the weak distribution power network which is also at the end of the main power grid, the power fluctuation may result in the frequency fluctuation obviously.
2.2.2. Power Quality Analysis for the Distributed Power Network Connected PV System
The power quality problem after the distributed PV system is connected to the distribution power network is mainly affected by the short-time power imbalance caused by power flow changing. In addition, the harmonic is also the concern power quality problem.
The output power of PV system is volatile and intermittent due to the influence of weather factors, which will lead to the fluctuation of the power flow in the distribution power network. And then the voltage level of node will be changed.
Moreover, the performance of the PV inverter may be reduced when the voltage of the distribution power network is changing, such as the three-phase imbalance or harmonic distortion, and then the output current of the inverter may contain the harmonic components or the negative sequence component.
2.2.3. Typical Power Quality Index
As mentioned above, several power quality problems may be generated in the distribution power network with DG, the typical power quality index included the THD (total harmonic distortion), voltage deviation, three-phase unbalance degree, etc. THD is the important index of harmonic, its definition is as follows:
where xn and x1 are the nth harmonic variate and the fundamental harmonic, respectively. The variate is voltage or current. n is harmonic order.
The voltage deviation is used to show the offset degree of the voltage, its definition is as follows:
where Uop and UN are the operational voltage and the nominal voltage, respectively.
The three-phase unbalance degree is the index to present the three-phase unbalance of voltage or current, its definition is as follows:
where x(2) and x(1) are the root mean square value of negative sequence and positive sequence, respectively.
3. Proposed Comprehensive Estimation Model Based on Multi-Factor Variance Analysis
By using the traditional power quality evaluation model, the index weighting is the important factor to appraise the characteristic of power quality, which contains the subjective method and objective method.
As mentioned above, in the traditional power quality evaluation model, the significance test is not conducted to reflect the correlation between power quality index and the multiple factors of the distribution power network. Therefore, a dual multi-factor analysis of variance-based power quality assessment method for DG connected distribution network is proposed in this paper.
3.1. The Principle of Proposed Power Quality Evaluation Method
While the distributed PV system and wind power system are integrated into the distribution network, the main power quality index includes the voltage deviation caused by the transient unbalance of reactive power, the harmonic problem caused by the power electronic converter, and the three-phase unbalance. In order to check out whether the influence factor of the power quality index is existing or results from a random error, the significance test is developed.
The power quality indicators can be selected according to the different composition forms and operation characteristics of the distribution network. In this paper, the multi-factor variance method is adopted, in which the power quality indicators are taken as the analyzed factors, which can be shown as PQn, such as the voltage deviation, harmonics, three-phase unbalance degree, etc. The different influencing factors are considered as the levels, and the experiments at different levels constitute analytical data sets.
By using the conventional power quality evaluation method, the overall power quality evaluation result is obtained by weighting each power quality index and node. However, in the conventional power quality evaluation, the data significance test is not conducted.
In the actual evaluation process, the power quality index data may change with the net sampling nodes, different sampling times, and different working conditions. At the same time, the sampling random error should also be considered.
Therefore, it is necessary to conduct the significance test for the above mentioned situations namely as the levels. At the same time, the significance test results are used in the power quality evaluation to improve the reasonability of power quality evaluation.
Based on the above analysis, the general principle of the proposed power quality assessment proposed in this paper is shown in Figure 2:
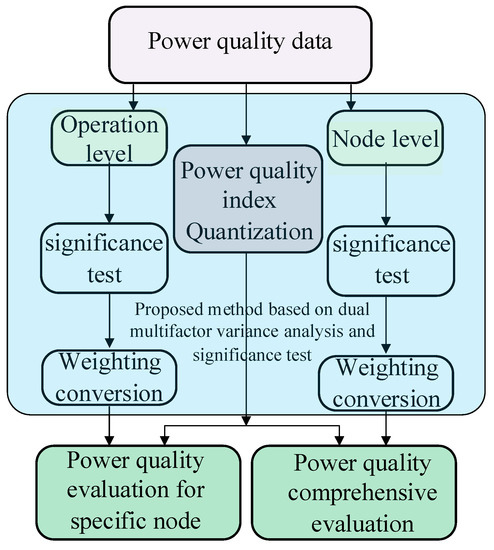
Figure 2.
Principle block diagram of proposed power quality evaluation model.
By using the proposed multiple factor variance analysis, nodes and operating conditions are taken as different factors to be analyzed, and which are significance tests at different levels. In this case, the influence of random error is also tested. Furthermore, the significance test results are converted into weights, and the quantized index evaluation results and node evaluation results are doubly weighted, to obtain the power quality evaluation results. By using which, the rationality and accuracy of power quality evaluation for distribution network connected DG can be improved.
3.2. The Proposed Significance Test Method for Power Quality Index
With the power system development, the structure of the distribution network is complex. More and more loads with different types are connected to the power distribution network, and the uncertainty of load gradually increases. At the same time, a variety of DGs, such as wind power and PV systems, which output power is volatile and intermittent, are also connected to the node of the distribution network. As mentioned above, the node of the distribution network shows different characteristics due to different objective conditions and power flow. For example, for the nodes with more wind power, the voltage fluctuation is obvious. While for the nodes with more loads, there are more harmonic problems or three-phase unbalance problems.
In actual work, the nodes and operating conditions can be seen as the analyzed factors of the power quality index, and the relationship between the above factors and the power quality index needs to be significance tested. In this paper, the different levels of the different factors are analyzed and the multivariate variance analysis is carried out.
By using the proposed method, firstly, each power quality index is analyzed respectively. For a power quality index PQn, the data characteristics are analyzed under different factor levels.
Under different working conditions, assuming that the power quality index data meet the normal distribution basically, it will meet the following requirements:
where D is the data set; i = 1, 2, …… k; j = 1, 2, …… m.
where r and c are the levels of the factors influenced respectively; li and lj are the effect of factors influenced in level i and level j, respectively; μij is the theoretical mean value; eij is random error.
While testing the impact degree for the power quality index, the following hypothesis is made, and whether the hypothesis is valid is demonstrated.
For factor F1, if the following equation is right, the hypothesis is true:
If the following equation is right, the hypothesis is not valid:
Similarly, for the F2, if the following equation is right, the hypothesis is true:
If the following equation is right, the hypothesis is not valid:
Based on the above assumptions, F value can be used to test whether hypothesis H is valid. F value is a test statistic value, which is equal to the squares sum of deviation divided by squares sum of error, it can be shown as:
And:
where S is squares sum of error, which can be shown as:
where is the mean value.
While the following conditions are true, H11 and H21 are true, there is no difference between each level:
Instead, if H11 and H21 are true, the different levels may lead to that makes the difference.
Comparing the F value and the critical value to determine whether the factors level is significant.
3.3. Weighting and Quantification Methods for Power Quality
According to the above multivariate variance analysis, the influence degree of each power quality index on different factors can be tested, and the significant test result can be used to weight the power quality index and realize the quantitative analysis.
Firstly, the power quality index can be graded and quantified as Table 1. In order to obtain the power quality quantification result for each DG-connected node, the basic idea of the proposed multiple factor variance analysis is to integrate the F value that comes from the significance test into the power quality evaluation weight.

Table 1.
The degree standards and the corresponding score of the typical power quality index.
The convert equation is as follows:
By using the proposed method, the power quality index weight is generated by the significance test. In some situations, the significance test weight is sensitive to the power quality index data seriously, and the difference between F values may be too large, resulting in too large a difference in power quality weighting. In order to overcome the above defects, furtherly, an improved weighting method with logarithm function correction is proposed, by using which the power quality index weight is more reasonable, as follows:
where Fi is the F value that came from the significance test at different levels; a is the logarithm base and b is a number greater than or equal to 1. The parameters a and b can be adjusted to change the correction degree. According to the above equation, the significance test result can be used to generate the power quality weight.
For power quality evaluation of the specific nodes connected to DGs, the above F value shows the significance relationship between the power quality index and the working condition or other factors, and the relationship is expressed by the weight. And then it will affect the power quality evaluation result by the following:
where SnPQi is power quality index assessment score for the nth node.
For comprehensive power quality evaluation of multiple nodes connected DGs, the node evaluation results are obtained from Formula (19) firstly, and then the weight conversion is carried out by the first significance test, as the following:
In the above weight conversion, the first test result is contained in the parameter Snodei. And the weight wnn is used to convert the quantization value of the node power quality index PQn into the quantization value of the multiple nodes. Moreover, the results are the basic data for the second significance test in the next step. In the equation, the reciprocal value is to make the power quality assessment results more sensitive to nodes that show serious power quality problem.
The power quality index assessment score of the whole power distribution network can be quantified as:
where SnPQi is power quality index assessment score for the nth node and the ith power quality index.
In the second significance test, the level is each node tested. The Fnode value comes from the PQn and the node tested. By using this, the influence degree is represented and is converted to the weight for the power quality:
The above equation is used to obtain the second weight. In the equation, the Fnode value and the weight show the influence degree. The large weight shows that the node level is significant, namely the node power quality is greater specificity while the DGs are connected into the different node of distribution network. Conversely, the node power quality is widespread.
Similar to the Equation (18), the reasonableness of the evaluation may be affected by the relatively large differences in Fnode. Therefore, the weight can be modified furtherly by the following method:
By using the above weights, the power quality evaluation result can be obtained as:
In the traditional model, taking the entropy weight model for example, the evaluation weight of the power quality index is related to the entropy value of the power quality index data. In other words, the value of evaluation weight presents the data dispersion. However, it cannot present whether the power quality index data is affected by the relate factors such as the operational condition, node, etc. In some situations, the discreteness of power quality index data may resulted from the sampling error, or other random errors.
By using the proposed model, the significance testing is carried out for power quality indicator with the various system factors, namely the main affecting factors for the power quality index and the influence degree can be significance tested, and the significance test result are taking into the power quality evaluation.
Therefore, the power quality evaluation is more reasonable. It can provide accurate reference and data support for subsequent power quality evaluation management.
4. Example Verification
In order to verify the rationality and effectiveness of the proposed power quality comprehensive estimation model, an algorithm model of distribution network connected DGs is developed. In which the power distribution network is simulated by the IEEE standard 14-node model [30], and the DGs include 2 PV system models (80 kW and 200 kW, respectively) and 1 wind power model (100 kW), which are connected into the different node of the IEEE standard 14-node model.
4.1. Power Quality Evaluation for Node
While the DGs are connected to the power distribution network, generally the power quality of the injection node is affected seriously. Therefore, the operating conditions of the injection node is set as the different level, which can be divided into OC1, OC2 and OC3.
The typical power quality problems in the distribution network include voltage deviation, THD, three-phase unbalance degree, frequency deviation, and voltage flicker. We consulted the relevant literature and analyzed the power quality power for the distribution network with different DGs. The capacity of distributed PV or distributed wind power is generally small and the output power is consumed by local load, and it is less likely to lead to frequency deviation and voltage flicker. Therefore, in this manuscript, The typical power quality index such as voltage deviation, THD, and three-phase unbalance degree are selected as PQn in the example to verify the effectiveness of the proposed method.
The power quality index data in different test nodes are shown in Figure 3.
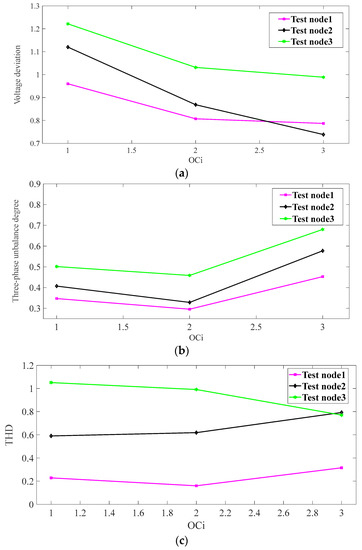
Figure 3.
Power quality index in different test nodes. (a) Voltage deviation in different test nodes; (b) Three-phase unbalance degree in different test nodes; (c) THD in different test nodes.
As can be seen from Figure 3, the power quality index is relevant to the nodes and operation conditions.
Firstly, the significance test is carried out on the operating condition level for each injection node (named as: nodeinj1, nodeinj2, nodeinj3). According to the model operating condition, the operating data under 3 operating conditions are sampled, and then multi-factor variance analysis is carried out about the 3 power quality indicators PQn (PQ1: voltage deviation, PQ2: 3-phase unbalance degree, PQ3: THD). The numerical analysis results are shown in Table 2.
Table 2.
Variance analysis result for power quality index to the working condition.
As seen from Table 2, due to the similar fluctuation of data, Fcrit values in statistics are 3.89. In nodeinj1 and nodeinj2, the F values of PQ1 to PQ3 are all greater than the rejection domain. Therefore, the hypothesis is not true, namely, the working condition level, has a significant impact on the power quality index.
In nodeinj3, the F value of PQ1 is less than the value of Fcrit, which means that there is no obvious influence for PQ1 in nodeinj3. For PQ2 and PQ3, the working condition impacts the power quality.
From the above analysis, it can be seen that, generally, different working conditions with different states for DGs and loads, lead to different power quality. For some nodes, the power quality index may not be closely related to the working condition because of the combination of influencing factors. The above analysis is consistent with the actual operation of the distribution network. Therefore, a significance test is needed to determine whether each level has an impact on the factors analyzed.
According to the above significance test, the significance test results can be included in the quantitative analysis of power quality assessment, by using the Equation (17). And the power quality index weights of the above 3 nodes can be obtained, as shown in Figure 4.
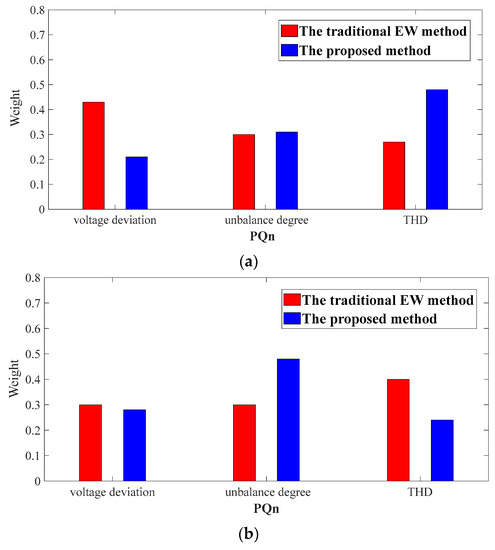
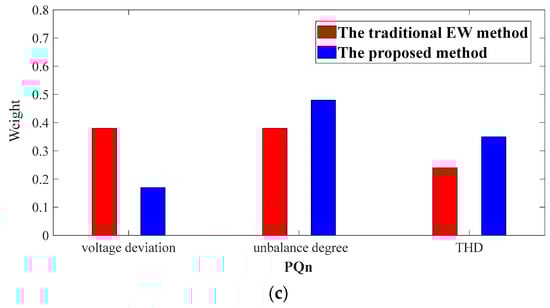
Figure 4.
Power quality indicators weights. (a) Indicators weights of nodeinj1; (b) Indicators weights of nodeinj2; (c) Indicators weights of nodeinj3.
In order to verify the rationality and effectiveness of the proposed model. Meanwhile, the traditional EW model is also used to generate the power quality index weights, which are shown in Figure 4.
As seen in Figure 4, by using the traditional EW model, the power index weight can reflect the discreteness degree of power quality index data. However, it cannot present whether the discreteness of power quality index data is affected by the related factors or the random errors. In addition, the difference of weights that came from the EW model may be small while the data fluctuation is similar.
However, by using the proposed model in this manuscript, the power index weight came from the significance test result, which presents the affecting degree of the system factor to the power quality index, and the power quality evaluation result is more helpful to the power quality management in the future. The difference of weight is obvious compared with the traditional model, which is helpful to distinguish the influence of different power quality indexes in the power quality evaluation process. Therefore, the proposed model is more reasonable for the distribution network with multiple DGs, and the power quality evaluation result can provide a useful reference for the design of power quality devices and the location of power quality problems in power quality management.
According to Table 1, the power quality indicators of each injection node can be quantified into specific scores. By using Equation (19) and the weight above, the power quality result can be obtained:
4.2. Overall Evaluation and Comparative Analysis for Multiple Nodes
According to the multivariate variance analysis, the node level can be significance tested. In this case, the test results of each PQ for nodes are as follows Table 3.
Table 3.
The variance analysis result of power quality index to node level.
In order to obtain the comprehensive evaluation results of multiple nodes, the first weight should be converted by using the Equation (20), as shown in Figure 5a.
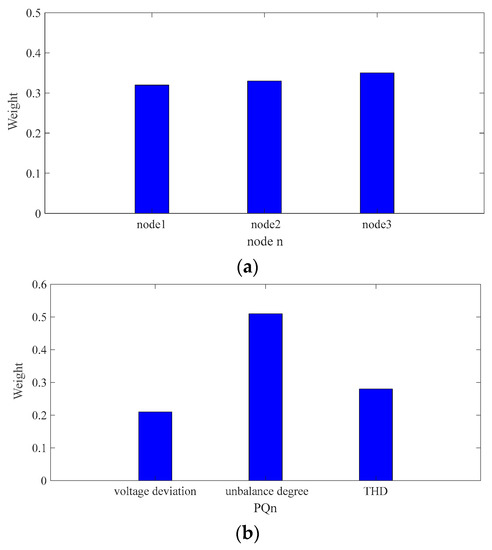
Figure 5.
Node weights. (a) The first weights. (b) The second weights.
As seen in Table 3, In this case, F value is greater than Fcrit value, showing the correlation between power quality index and node. Similarly, the index weights are transformed according to Equation (23), as shown in Figure 5b. These weights contain the significance test for nodes, and also reflect the fluctuation character of the power quality index data with the node level. And then the weights of each power quality index can be obtained, which is the second multivariate variance analysis weight.
Figure 6 shows the quantifiable results of power quality indicators, which can be obtained by the Equation (21). they reflect the status of various power quality indicators directly.
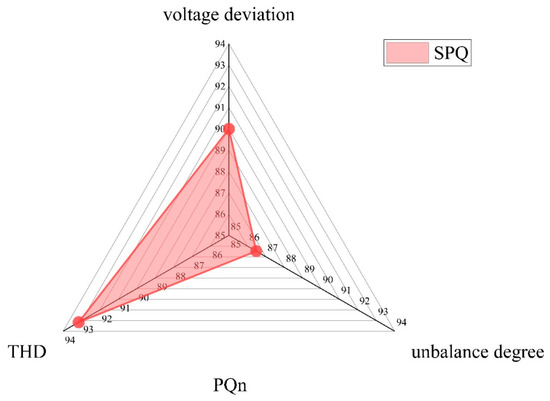
Figure 6.
Power quality index estimation scores.
As seen from Figure 6, the quantifiable results of THD and voltage deviation are 93 and 90, respectively. This presents the good voltage level and lower harmonic level. Similarly, the quantifiable result of unbalanced degree is 86, to show the relatively low voltage balance.
According to the above first weighting and second weighting, the comprehensive power quality evaluation score can be obtained according to Equation (24):
It can be seen that, in the above power quality evaluation process, whether the single-node evaluation or the multi-node evaluation, the significance test results are included in the whole process, to make the evaluation more reasonable. At the same time, the evaluation result represents the fluctuation character of the power quality index with different working conditions or different node. The power quality evaluation result can provide a reasonable reference for subsequent power quality management.
5. Conclusions
A novel power quality comprehensive estimation model based on multi-factor variance analysis for distribution network with DG is proposed. The affecting factors of power quality for distributed network with DGs are conducted double significance tests to obtain the power quality comprehensive assessment result. the rationality and effectiveness of the proposed method is verified by the example. Compared with the traditional power quality evaluation method for power distribution network, by using the proposed method, the main factors affecting the power quality index and the influence degree can be significance tested by the double multi-factor variance analysis. The overall power quality of the evaluation power grid is more reasonable. Further, it also can present the power quality index and the related influence factors. Therefore the proposed estimation model can provide a useful reference for the design of power quality devices and the location of power quality problems in the power quality management.
Author Contributions
Conceptualization, H.D.; methodology, H.D. and P.L.; software, B.Z.; validation, H.D., P.L., X.C. and B.Z.; formal analysis, H.D. and P.L.; investigation, H.D. and B.Z.; resources, H.D. and X.C.; data curation, X.C. and B.Z.; writing—original draft preparation, H.D. and P.L.; writing—H.D., P.L. and B.Z.; visualization, B.Z.; supervision, X.C.; project administration, H.D. and P.L.; funding acquisition, X.C. and B.Z. All authors have read and agreed to the published version of the manuscript.
Funding
This research was funded by 2022 Innovation and Efficiency Projects: Research and application of power quality analysis for Smart IoT Electricity Meters, grant number [JG29YX220041].
Informed Consent Statement
Not applicable.
Data Availability Statement
Not applicable.
Conflicts of Interest
The authors declare no conflict of interest.
References
- Nasser, N.; Fazeli, M. Buffered-Microgrid Structure for Future Power Networks; a Seamless Microgrid Control. IEEE Trans. Smart Grid 2021, 12, 131–140. [Google Scholar] [CrossRef]
- Li, H.; Ren, Z.; Trivedi, A.; Verma, P.P.; Srinivasan, D.; Li, W. A Noncooperative Game-Based Approach for Microgrid Planning Considering Existing Inter-connected and Clustered Microgrids on an Island. IEEE Trans. Sustain. Energy 2022, 13, 2064–2078. [Google Scholar] [CrossRef]
- Neto, P.J.d.S.; Barros, T.A.d.S.; Silveira, J.P.C.; Filho, E.R.; Vasquez, J.C.; Guerrero, J.M. Power Management Strategy Based on Virtual Inertia for DC Microgrids. IEEE Trans. Power Electron. 2020, 35, 12472–12485. [Google Scholar] [CrossRef]
- Fan, B.; Guo, S.; Peng, J.; Yang, Q.; Liu, W.; Liu, L. A Consensus-Based Algorithm for Power Sharing and Voltage Regulation in DC Microgrids. IEEE Trans. Ind. Inform. 2019, 16, 3987–3996. [Google Scholar] [CrossRef]
- Wu, H.; Yuan, Y.; Zhu, J.; Qian, K.; Xu, Y. Potential Assessment of Spatial Correlation to Improve Maximum Distributed PV Hosting Capacity of Distribution Networks. J. Mod. Power Syst. Clean Energy 2021, 9, 800–810. [Google Scholar] [CrossRef]
- Peng, Y.; Shuai, Z.; Guerrero, J.M.; Li, Y.; Luo, A.; Shen, Z.J. Performance improvement of the unbalanced voltage compensation in islanded mi-crogrid based on small-signal analysis. IEEE Trans. Indus. Electron. 2020, 67, 5531–5542. [Google Scholar] [CrossRef]
- Fathi-Jowzdani, A.H.; Sadeghkhani, I.; Mehrizi-Sani, A. Islanding Detection for DC Microgrids Based on Episode of Care Severity Index. IEEE Trans. Smart Grid 2022, 13, 954–961. [Google Scholar] [CrossRef]
- Feng, F.; Zhang, P.; Zhou, Y. Authentic Microgrid State Estimation. IEEE Trans. Power Syst. 2022, 37, 1657–1660. [Google Scholar] [CrossRef]
- Pannala, S.; Patari, N.; Srivastava, A.K.; Padhy, N.P. Effective Control and Management Scheme for Isolated and Grid Connected DC Microgrid. IEEE Trans. Ind. Appl. 2020, 56, 6767–6780. [Google Scholar] [CrossRef]
- Guan, Y.; Wei, B.; Guerrero, J.M.; Vasquez, J.C.; Gui, Y. An overview of the operation architectures and energy management system for multiple microgrid clusters. iEnergy 2022, 1, 306–314. [Google Scholar] [CrossRef]
- Ravindran, V.; Rönnberg, S.K.; Bollen, M.H. Interharmonics in PV systems: A review of analysis and estimation methods; considerations for selection of an apt method. IET Renew. Power Gen. 2019, 13, 2023–2032. [Google Scholar] [CrossRef]
- Shi, H.; Su, G.; Pan, J.; Feng, K.; Zhou, J. A novel microgrid power quality assessment model based on multivariate Gaussian. IET Power Electron. 2022, 16, 145–156. [Google Scholar] [CrossRef]
- Patarroyo-Montenegro, J.F.; Andrade, F.; Guerrero, J.M.; Vasquez, J.C. A Linear Quadratic Regulator With Optimal Reference Tracking for Three-Phase Inverter-Based Islanded Microgrids. IEEE Trans. Power Electron. 2021, 36, 7112–7122. [Google Scholar] [CrossRef]
- Ray, P.; Ray, P.K.; Dash, S.K. Power Quality Enhancement and Power Flow Analysis of a PV Integrated UPQC System in a Distribution Network. IEEE Trans. Indus. Appl. 2022, 58, 201–211. [Google Scholar] [CrossRef]
- Zhong, Q.; Qiu, Y.; Zhao, Y.; Li, H.; Wang, G.; Wen, F. Interharmonic Analysis Model for Grid-connected PV System Based on Dynamic Phasor Disturbances. High Vol. Eng. 2022, 48, 1177–1186. (In Chinese) [Google Scholar]
- Elphick, S.; Robinson, D.A.; Perera, S.; Knott, J.C.; David, J.; Drury, G. Impact of Sustained Supply Voltage Magnitude on Consumer Appliance Behaviour. IEEE Trans. Power Deliv. 2022, 37, 4933–4944. [Google Scholar] [CrossRef]
- Zeng, Z.; Yang, H.; Zhao, R.X. A catastrophe decision theory based power quality comprehensive evaluation method for distributed generation system. Auto. Elec. Power Syst. 2011, 35, 52–57. (In Chinese) [Google Scholar]
- Zhu, X.; Zhang, J.; Liu, W.; Qiu, W.; Wu, X.; Jiang, C. Regional Power Grid Quality Evaluation Method Considering Index Characteristics. Proc. CSU-EPSA 2022, 34, 150–158. (In Chinese) [Google Scholar]
- Wang, J.; Pang, W.; Wang, L.; Pang, X.; Yokoyama, R. Synthetic evaluation of steady-state power quality based on combination weighting and principal component projection method. CSEE J. Power Energy Syst. 2017, 3, 160–166. [Google Scholar] [CrossRef]
- Zhao, H.; Li, J.; Mi, Z.; Pu, L.; Cui, Y. Grading evaluation of power quality based on CRITIC and improved Grey-TOPSIS. Power Syst. Prot. Control 2022, 50, 1–8. (In Chinese) [Google Scholar]
- Shi, H.; Li, Y.; Jiang, Z.; Zhang, J. Comprehensive power quality evaluation method of microgrid with dynamic weighting based on CRITIC. Meas. Control 2021, 54, 1097–1104. [Google Scholar] [CrossRef]
- Yin, J.; Du, X.; Yuan, H.; Ji, M.; Yang, X.; Tian, S.; Wang, Q.; Liang, Y. TOPSIS power quality comprehensive assessment based on a combination weighting method. In Proceedings of the 2021 IEEE 5th Conference on Energy Internet and Energy System Integration (EI2), Taiyuan, China, 22–24 October 2021; pp. 1303–1307. [Google Scholar]
- Zhang, H.; Li, Y.; Wang, Z.; Tao, J.; Deng, T.; Zhang, Y. An Extended GRA-EDAS with Combination Weighting Method for Power Quality Evaluation. In Proceedings of the 2022 Power System and Green Energy Conference (PSGEC), Shanghai, China, 25–27 August 2022; pp. 732–738. [Google Scholar]
- Wang, J.; Ye, N.; Ge, L. Steady-State Power Quality Synthetic Evaluation Based on the Triangular Fuzzy BW Method and Interval VIKOR Method. Appl. Sci. 2020, 10, 2839. [Google Scholar] [CrossRef]
- Ali, S.; Wu, K.; Weston, K.; Marinakis, D. A Machine Learning Approach to Meter Placement for Power Quality Estimation in Smart Grid. IEEE Trans. Smart Grid 2016, 7, 1552–1561. [Google Scholar] [CrossRef]
- Chen, J.; Pan, G.; Jing, O.; Zhang, L. A power quality evaluation method for distribution system with renewable energy. Int. J. Electron. 2020, 107, 792–807. [Google Scholar] [CrossRef]
- Ostrowska, A.; Michalec, Ł.; Skarupski, M.; Jasiński, M.; Sikorski, T.; Kostyła, P.; Lis, R.; Mudrak, G.; Ostrowska, T. Power Quality Assessment in a Real Microgrid-Statistical Assessment of Different Long-Term Working Conditions. Energies 2022, 15, 8089. [Google Scholar] [CrossRef]
- Liu, S.; Zheng, C.; Zhang, B.; Dai, S.; Tang, Y.; Wang, Y. A Data-Driven Self-Learning Evaluation Method of Voltage Sag Severity. CPSS Trans. Power Electron. Appl. 2022, 7, 328–334. [Google Scholar] [CrossRef]
- Sharma, M.; Rajpurohit, B.S.; Agnihotri, S.; Singh, S.N. Data Analytics Based Power Quality Investigations in Emerging Electric Power System Using Sparse Decomposition. IEEE Trans. Power Del. 2022, 37, 4838–4847. [Google Scholar] [CrossRef]
- Boming, Z.; Shousun, C.; Zheng, Y. Advanced Power Network Analysis; Tsinghua University Press: Beijing, China, 2007; pp. 323–325. [Google Scholar]
Disclaimer/Publisher’s Note: The statements, opinions and data contained in all publications are solely those of the individual author(s) and contributor(s) and not of MDPI and/or the editor(s). MDPI and/or the editor(s) disclaim responsibility for any injury to people or property resulting from any ideas, methods, instructions or products referred to in the content. |
© 2023 by the authors. Licensee MDPI, Basel, Switzerland. This article is an open access article distributed under the terms and conditions of the Creative Commons Attribution (CC BY) license (https://creativecommons.org/licenses/by/4.0/).