Article

Perovskite Nano-Powder and Nano-Film Catalysts in Mineralization of Aqueous Organic Contaminants through Solar Simulated Radiation

1
Department of Chemistry, College of Science, An-Najah National University, Nablus P400, Palestine
2
Department of Pharmacy, College of Medical and Health Sciences, An-Najah National University, Nablus P400, Palestine
3
High Temperature Laboratory, Korea Institute of Energy Research, 152, Gajeong-ro, Yuseong-gu, Daejeon 34129, Republic of Korea
*
Author to whom correspondence should be addressed.
Processes 2023, 11(8), 2378; https://doi.org/10.3390/pr11082378
Submission received: 5 July 2023 / Revised: 30 July 2023 / Accepted: 5 August 2023 / Published: 7 August 2023
(This article belongs to the Special Issue Synthesis and Applications of Novel Functional Materials)

Abstract

:
Water contamination with various contaminants, including organic species, is a global concern. Reclamation through safe, economic and technically feasible methods is imperative. Two perovskites, zinc titanate (ZnTiO3) and manganese titanate (MnTiO3), mixed with TiO2 phases, were prepared as nano-powders and nano-films. The materials were characterized and used as catalysts in photodegradation of aqueous methylene blue, a hazardous model contaminant, using solar simulated radiation. The effects of various reaction conditions on the photodegradation were examined. The kinetics indicated the suitability of using the process at various contaminant concentrations and catalyst loadings. Both powder and film catalysts completely removed the contaminant in less than 6 h. Powder and film forms of the MnTiO3 mixture were more efficient than their ZnTiO3 counterparts. In both perovskite mixtures, the films exhibited higher catalytic efficiency than the powders. The film materials exhibited high catalytic efficiency in both the continuous flow and batch processes. Water contaminated with various methylene blue concentrations can be treated by the film catalysts that can be recovered and reused with no technical difficulties. The results open new horizons for larger-scale water purification processes.

1. Introduction

Water contamination with organic compounds is a global concern. According to National Geographic, only ~1% of surface waters are currently available for safe drinking. Ground waters are also heavily contaminated with organic species, including chlorinated hydrocarbons, dyes, and other substances [1]. As there are currently no available tools or policies to completely prevent water contamination, water reclamation is the only choice. To purify water from organic contaminants, a number of conventional methods are available, including adsorption, chlorination, ozonation, reverse osmosis and others. All of these methods have been used at the commercial scale and proven to be effective [2,3]. However, each method has its advantages and shortcomings. For example, chlorination may yield new hazardous chlorinated hydrocarbons [4]. Adsorption needs large adsorbent amounts and yields adsorbents with adsorbed contaminants, which need further recovery [5]. Other methods are costly to many poor communities and may not be suitable for small off-grid and remote places.
Economic, safe and low-cost processes are needed for water purification. One emerging method is using direct solar radiation in the complete photodegradation of aqueous organic contaminants [6,7]. This photodegradation process has many advantages. The contaminant molecules may undergo complete mineralization, leaving no organic matter in the treated water; therefore, hazardous biproducts can be avoided through complete photodegradation. Moreover, the only source of energy being used is solar radiation, which is abundant in many places at no cost. Leaving the photocatalyst to function in stand-alone purification reactors may also be useful in purifying water for off-grid and remote communities.
Photodegradation reactions are normally catalyzed at semiconductor particle surfaces. When the semiconductor particle absorbs a photon of suitable energy, the electrons are excited to the conduction band (CB), leaving holes in the valence band (VB). Such excitation is necessary for the semiconductor catalyst in the photodegradation process. Therefore, the photodegradation method still has shortcomings. Semiconductor materials with narrow to medium band-gap values, such as CdS, are efficient photocatalysts, as they only need highly abundant visible solar light for excitation. However, such materials are unstable and may undergo photo-corrosion under experimental conditions, yielding hazardous ions in the treated water [8,9]. On the other hand, wide band gap semiconductors are normally stable under photodegradation conditions, but require UV radiation for excitation [7]. The UV range in the oncoming solar radiation is only a small fraction of ~5% [10]. This is another limitation of using the photodegradation method.
Fortunately, designing stable wide band gap semiconductor materials that may effectively function in the available solar UV spectrum is possible. Examples of such materials are TiO2, ZnO and perovskites, all of which are easy to prepare, safe and not costly [11]. The materials have been described as photocatalysts for organic contaminants in water under direct or solar simulated radiation. These materials have been widely used in the form of nano-powders suspended in contaminated water under photodegradation processes. However, such methods involve new technical difficulties after treatment completion. Removing the suspended particles from the treated water is not an easy task. Therefore, using a thin film photocatalyst can be an alternative option [12].
Various types of perovskites based on strontium, tantalum [13,14,15] and other metals [16,17] have been described as catalysts in photodegradation processes. Combining both TiO2 and ZnO together in the form of the perovskite ZnTiO3 has been widely described in many applications, such as optoelectronics, dye-sensitized solar cells and others. This perovskite combines the advantages of both TiO2 and ZnO together, with promising characteristics. However, this perovskite has not been widely described as a catalyst for photodegradation processes. Recently, reports have appeared describing ZnTiO3 powders as photocatalysts in organic contaminant photodegradations. Preparing ZnTiO3 and using it as a suspended nano-powder catalyst to photodegrade a number of organic contaminants was recently described [18,19]. Alkaykh et al. prepared MnTiO3 nanoparticles and used them as suspended photocatalysts for methylene blue photodegradation [20].
This work aims to find solutions for the difficulties associated with the photodegradation processes described above. ZnTiO3 and MnTiO3 were prepared in their powder forms and examined as catalysts to photodegrade the widely used model contaminant methylene blue. The toxicity of this dye was documented earlier [21], with a maximum allowed limit of 25 ppm [22]. The WHO has recommended that no amount of methylene blue be allowed, and in Japan, the maximum allowed limit is less than 1% [23]. Finding the actual efficiency of each catalyst in terms of turnover number (T.N. = lost contaminant molecule/g catalyst), turnover frequency (T.N./min) and quantum yield (Q.Y. = T.N./UV photons) is one main objective of this work. To avoid the technical difficulties associated with catalyst separation after water treatment, the perovskites were deposited onto glass substrates and used as films in the photodegradation process. Film efficiency comparisons between the film catalysts and their powder counterparts were made. To assess the feasibility of the perovskites in future water purification applications, the film catalysts were used in continuous flow reaction processes. No similar literature studies have been reported to our knowledge. All the goals were achieved here for the first time.

2. Materials and Methods

2.1. Starting Materials

Common solvents, acids and bases were purchased in AnalaR grade from known vendors. Methylene blue, manganese chloride tetrahydrate MnCl4·4H2O and titanium isopropoxide Ti(OCH(CH3)2)4 were purchased from Sigma-Aldrich, and zinc chloride ZnCl2 was purchased from Chem. Samuel. All the chemicals were purchased in their pure forms.

2.2. Equipment

Solid material XRD structural patterns were measured on a PAN alytical X’Pert Pro diffractometer with a Cu Kα source of 0.154 nm radiation. A JEOL JSM-6700F field emission scanning microscope was used to study the surface morphologies of the solid materials. X-ray photoelectron spectra (XPS) for the solid surfaces were measured using a Multi-Lab 2000 spectrometer. The equipment were available at the Korea Institute of Energy Research, Daejeon, South Korea.
Solid state photoluminescence (PL) spectra were measured for the prepared solid powders as water suspensions on a Perkin-Elmer LS 50 spectrophotometer against a deionized water baseline using an excitation wavelength 324 nm. A UV-3101PC Shimadzu Spectrophotometer was used to measure the electronic absorption spectra to characterize the solid materials as water-suspended particles against the water baseline. Methylene blue electronic absorption spectra for aqueous solutions were also measured on the same spectrophotometer.
For the photodegradation experiments, an Osram 250 W HLX 64657 tungsten–halogen solar simulator lamp with the spectrum shown in Figure S1 was used. The lamp was placed at a fixed height from the reaction mixture surface to yield a light intensity of 100,000 Lux, as measured by a Lux-102 light meter. Through calibration, the total light intensity was 146 W/m2, and 5% of the light was in the useful UV range.
Specific surface area (SSA) values for the solids were determined through the widely known acetic absorption method described in the literature [24]. Langmuir isotherms were constructed to find the number of molecules adsorbed onto the solid surfaces in monolayer coverage patterns.

2.3. Perovskite Powder Preparation

ZnTiO3 powder was prepared using the sol-gel method [25]. Titanium isopropoxide (50 mL, 48 g, 0.17 mole) and zinc chloride (23.17 g, 0.17 mole) were mixed together and stirred at 70 °C for 3 h. NaOH (2 M, 12 mL) was added dropwise. The pH was kept at 12 with stirring at 70 °C for 2 h. The resulting gel was dried at 110 °C, rinsed many times with deionized water, and then calcined at 600 °C for 3 h.
MnTiO3 powder was also prepared using the sol-gel method as described earlier [20]. MnCl4·4H2O (9.0 g, 0.033 mole) was dissolved in deionized water (150 mL). To the solution, conc. HNO3 (1.8 mL) and concentrated acetic acid (24 mL) were added, together with titanium isopropoxide (15 mL, 0.05 mole). The solution was stirred at 50 °C for 12 h. The resulting gel was then dried out at 80 °C for 1 h, rinsed with water many times and calcined at 900 °C for 6 h. Both perovskite powders were characterized using various methods.

2.4. Perovskite Film Preparation

Perovskite films were deposited onto high-quality microscope glass substrates (1 × 4 cm2 coating area). Various methods were examined, but the well-known doctor blade method was followed due to its simplicity [26,27]. Prior to deposition, the glass substrates were cleaned by immersion in HCl (10% v/v) for 1 h with ultrasonication, rinsed with deionized water, sonicated in acetone for 1 h, rinsed with deionized water and dried under nitrogen. The perovskite powder was then mixed with a triton X, acetylacetone and deionized water solution (2:1:1:1 by mass), as described earlier [28], and coated on the glass substrate. The film was heated at 500 °C for 1 h. The nominal perovskite amounts in the film layer was 0.10 g.
The film thicknesses were measured gravimetrically, assuming the density values for ZnTiO3 and MnTiO3 were 5.74 g/cm3 and 4.54 g/cm3 based on known MSDS for the materials. The monolayer film’s approximate gravimetric thickness values were 0.0044 cm (44 μm) and 0.0055 cm (55 μm) for the ZnTiO3 and MnTiO3 films, respectively. Using the cross-sectional SEM micrographs measured for the mono-layer films, the average thickness values were only ~1 μm for both perovskites. The SEM values showed the observed values for the perovskite material thicknesses. This issue will be readdressed in the Discussion section (Section 3).

2.5. Photocatalytic Experiments

In the suspended powder catalyst experiments, the catalyst (variable perovskite loading) was placed inside a thermostated beaker (500 mL and 10 cm diameter) at 25 ± 1 °C, together with the magnetically stirred methylene blue contaminant solution (100 mL, variable concentration) in the dark. The reaction mixture depth was ~1.33 cm. The mixture pH value was controlled as desired using drops of dilute solutions of HCl or NaOH. The photocatalytic experiment was followed with time once irradiation was started from the solar simulator lamp described above. To follow-up the contaminant loss during the photocatalytic experiment, reaction mixture aliquots were syringed out, centrifugated at 500 rpm for 6 min in the dark and analyzed using electronic absorption spectra at 660 nm. The pre-prepared calibration curves were used to determine the remaining contaminant concentrations.
In the catalyst film batch experiments, methylene blue solutions of known concentrations were added to a thermostated beaker (500 mL volume and 10 cm diameter) with perovskite film dipped inside. The methylene reaction mixture was exposed to direct radiations from the solar simulator lamp as described above, with very gentle stirring. The solution depth above the catalyst film was ~1.35 cm. Aliquots of the reaction solution were syringed out with time and analyzed spectrophotometrically at the maximum absorption wavelength of 660 nm to find the remaining contaminant concentrations using calibration curves.
Continuous flow experiments were performed inside a thermostated beaker (500 mL, 10 cm diameter). The beaker had one inlet and one outlet. Contaminated solution (100 mL, 80 ppm) was added dropwise from a burette and allowed to pass atop the catalyst films placed at the beaker bottom with very gentle stirring. The treated solution was received in a beaker and recycled back to the burette. The flow rate was 5 mL/min for a total time of 60 min. Aliquots were syringed out of the treated solution and analyzed spectrophotometrically for remaining methylene blue using calibration curves.

2.6. Control and Confirmation Experiments

Control and confirmation experiments were conducted to confirm photocatalytic degradation of the contaminant molecules under irradiation. Dark experiments with catalyst powder and methylene blue contaminant showed no measurable lowering in the contaminant concentration with time. Under-radiation experiments, conducted in the absence of any catalyst, showed no measurable lowering in contaminant concentration after prolonged times. The control experiments confirmed that the loss in contaminant during the photocatalytic experiments was solely due to photodegradation of the contaminant vide infra.
To see if the photodegradation occurred in the visible or the UV range, special experiments were performed. A cut-off filter that excludes 400 nm and shorter wavelengths was used to remove UV radiation during photodegradation. Reactions with the cut-off filter were much slower than those with no filters. This issue is readdressed below.
To further confirm methylene blue photodegradation, electronic absorption spectra for the reaction mixture were measured at both 660 nm (characteristic for methylene blue) and ~300 nm (characteristic for the phenyl group in the contaminant) with time. These bands are characteristic of methylene blue [29]. Both bands continued to decrease with time, which means that the degradation involves the stable phenyl rings as well. Mineralization of the methylene blue molecules through photodegradation was further confirmed by measuring mineral ions in the treated contaminated solutions. As methylene blue contains nitrogen atoms, the photodegradation process may involve oxidation of the nitrogen atoms, yielding nitrate ions and other species. Special experiments were conducted in which the nitrate ion concentration was measured after prolonged reaction times to determine whether the nitrate ion production was consistent with methylene blue loss. The nitrate ion concentration was measured as described by earlier protocols [30].

3. Results and Discussion

The results describe how aqueous methylene blue can be mineralized through photodegradation using mixed phases of both ZnTiO3 and MnTiO3 catalysts in their various forms. Dark vs. radiation control experiments confirmed that the loss of the contaminant molecules was due to photodegradation rather than adsorption. Photocatalytic activities for the two catalyst systems are correlated and discussed in parallel with their characteristics as described here. The effects of various reaction parameters on the degradation reaction rate are also discussed.

3.1. Characterization Results

Both prepared perovskites, ZnTiO3 and MnTiO3, were characterized using several methods.
  • Emission spectra:
Photoluminescence (PL) spectra measured for ZnTiO3 and MnTiO3 powder suspensions are shown in Figure 1. As described above, the excitation wavelength was 324 nm. The perovskites had main emissions at wavelengths 352 and 403 nm, respectively. For the ZnTiO3, the value resembled the literature value of ~360 nm [31], while for MnTiO3, the value resembled an earlier value of 410 nm [32]. In both prepared perovskites, the emission occurred at slightly shorter wavelengths than earlier reports. This is due to higher disorder in the prepared materials here. With higher disorder, the band gap value increases, and the emission wavelength becomes shorter. The emission spectra for the two perovskites corresponded to band gap values 3.52 and 3.08 eV for ZnTiO3 and MnTiO3, respectively. These values resembled the literature reported band gap values of 3.10–3.65 eV for ZnTiO3 [33,34,35,36,37,38] and ~3.10 eV for MnTiO3 [39].
  • Electronic absorption spectra:
Figure 2 shows the measured electronic absorption spectra (EAS) for ZnTiO3 and MnTiO3 suspensions in water. The ZnTiO3 suspension spectrum shows a band with a maximum value at ~338 nm and an edge at ~350 nm. For the MnTiO3 suspension, the maximum absorption occurs at ~390 nm with an edge at ~400 nm. In both cases, the band edge positions are consistent with PL wavelengths and band gap values. Again, the band gap value for ZnTiO3 is larger than that for MnTiO3. The PL and EAS indicate the need for the UV radiation to excite both perovskites, but the MnTiO3 requires longer wavelength radiations (near visible) to excite.
  • Surface morphology and SEM micrographs:
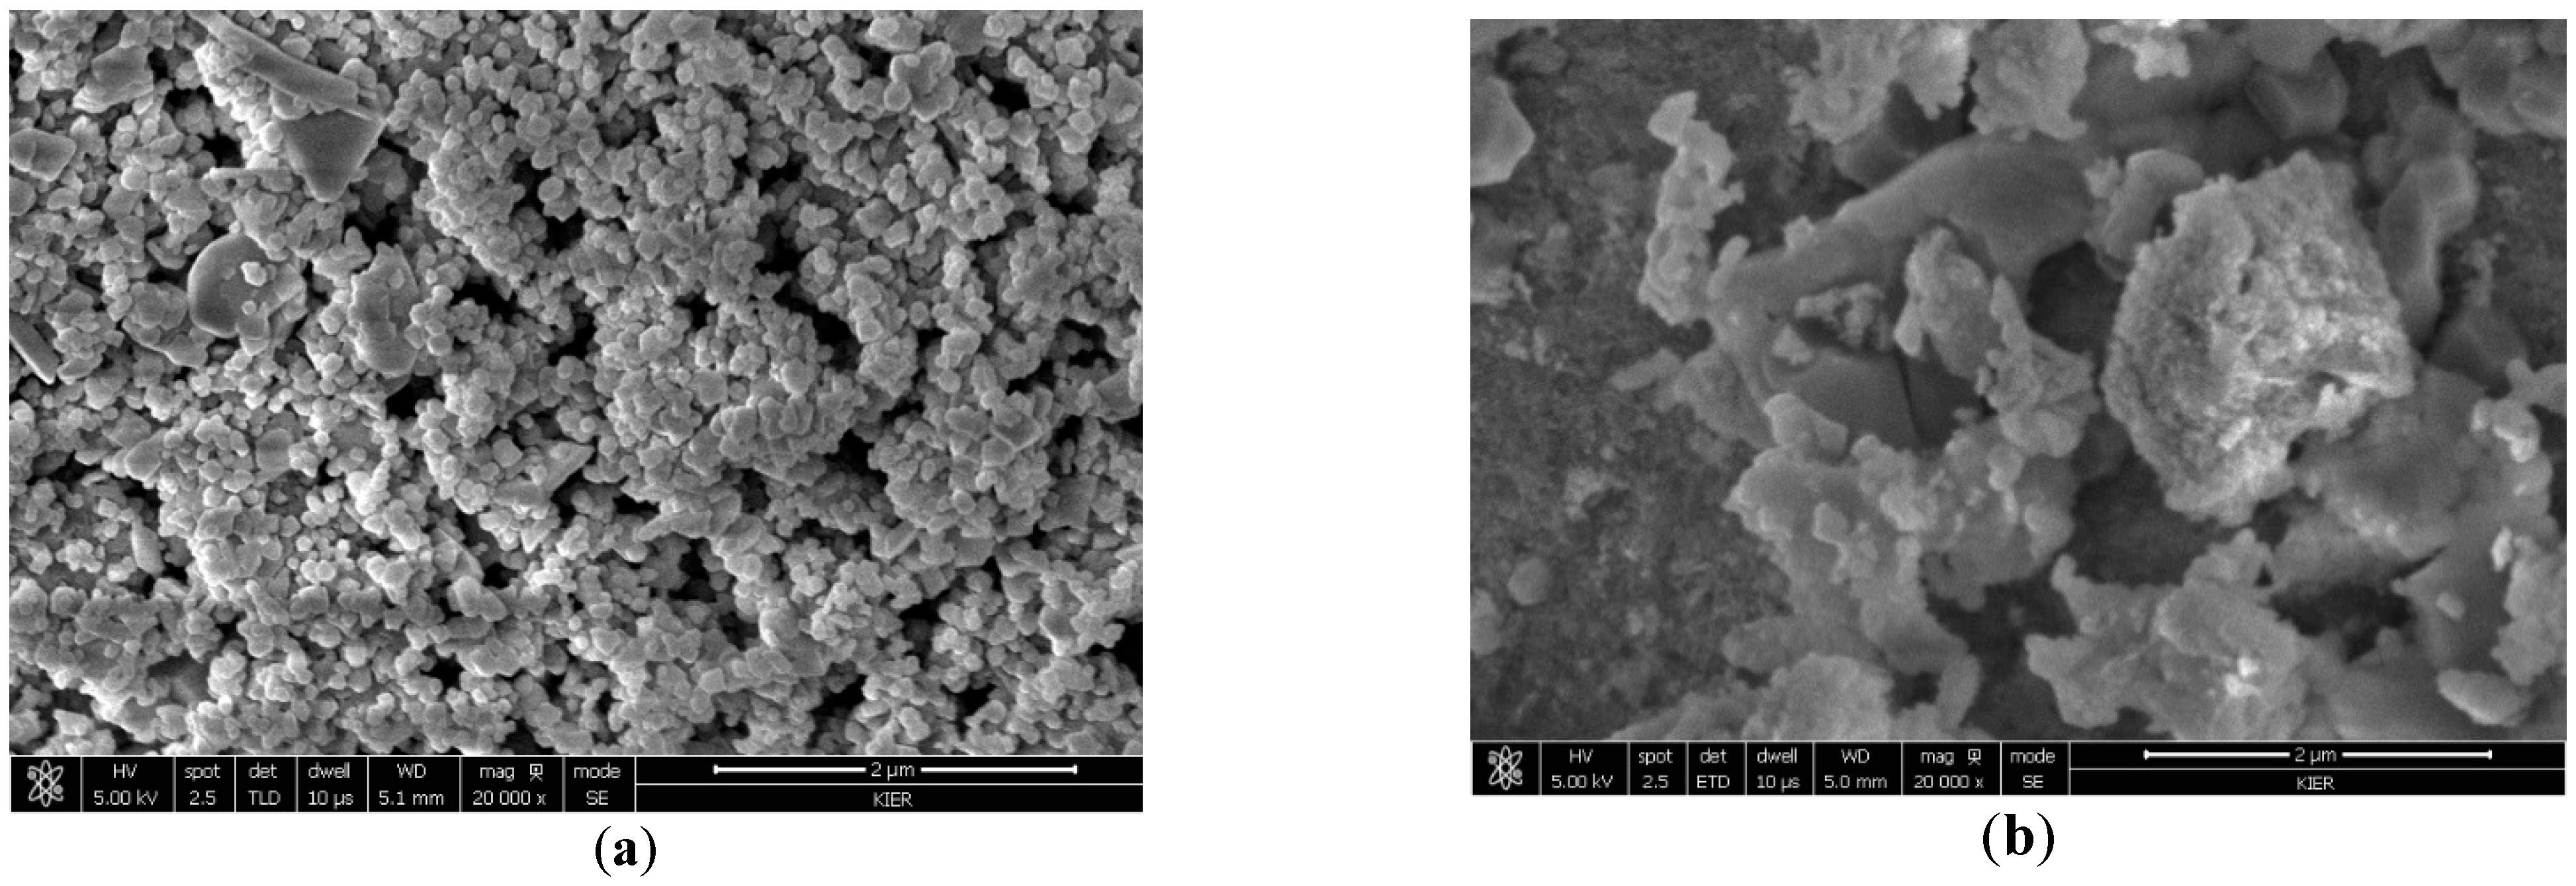
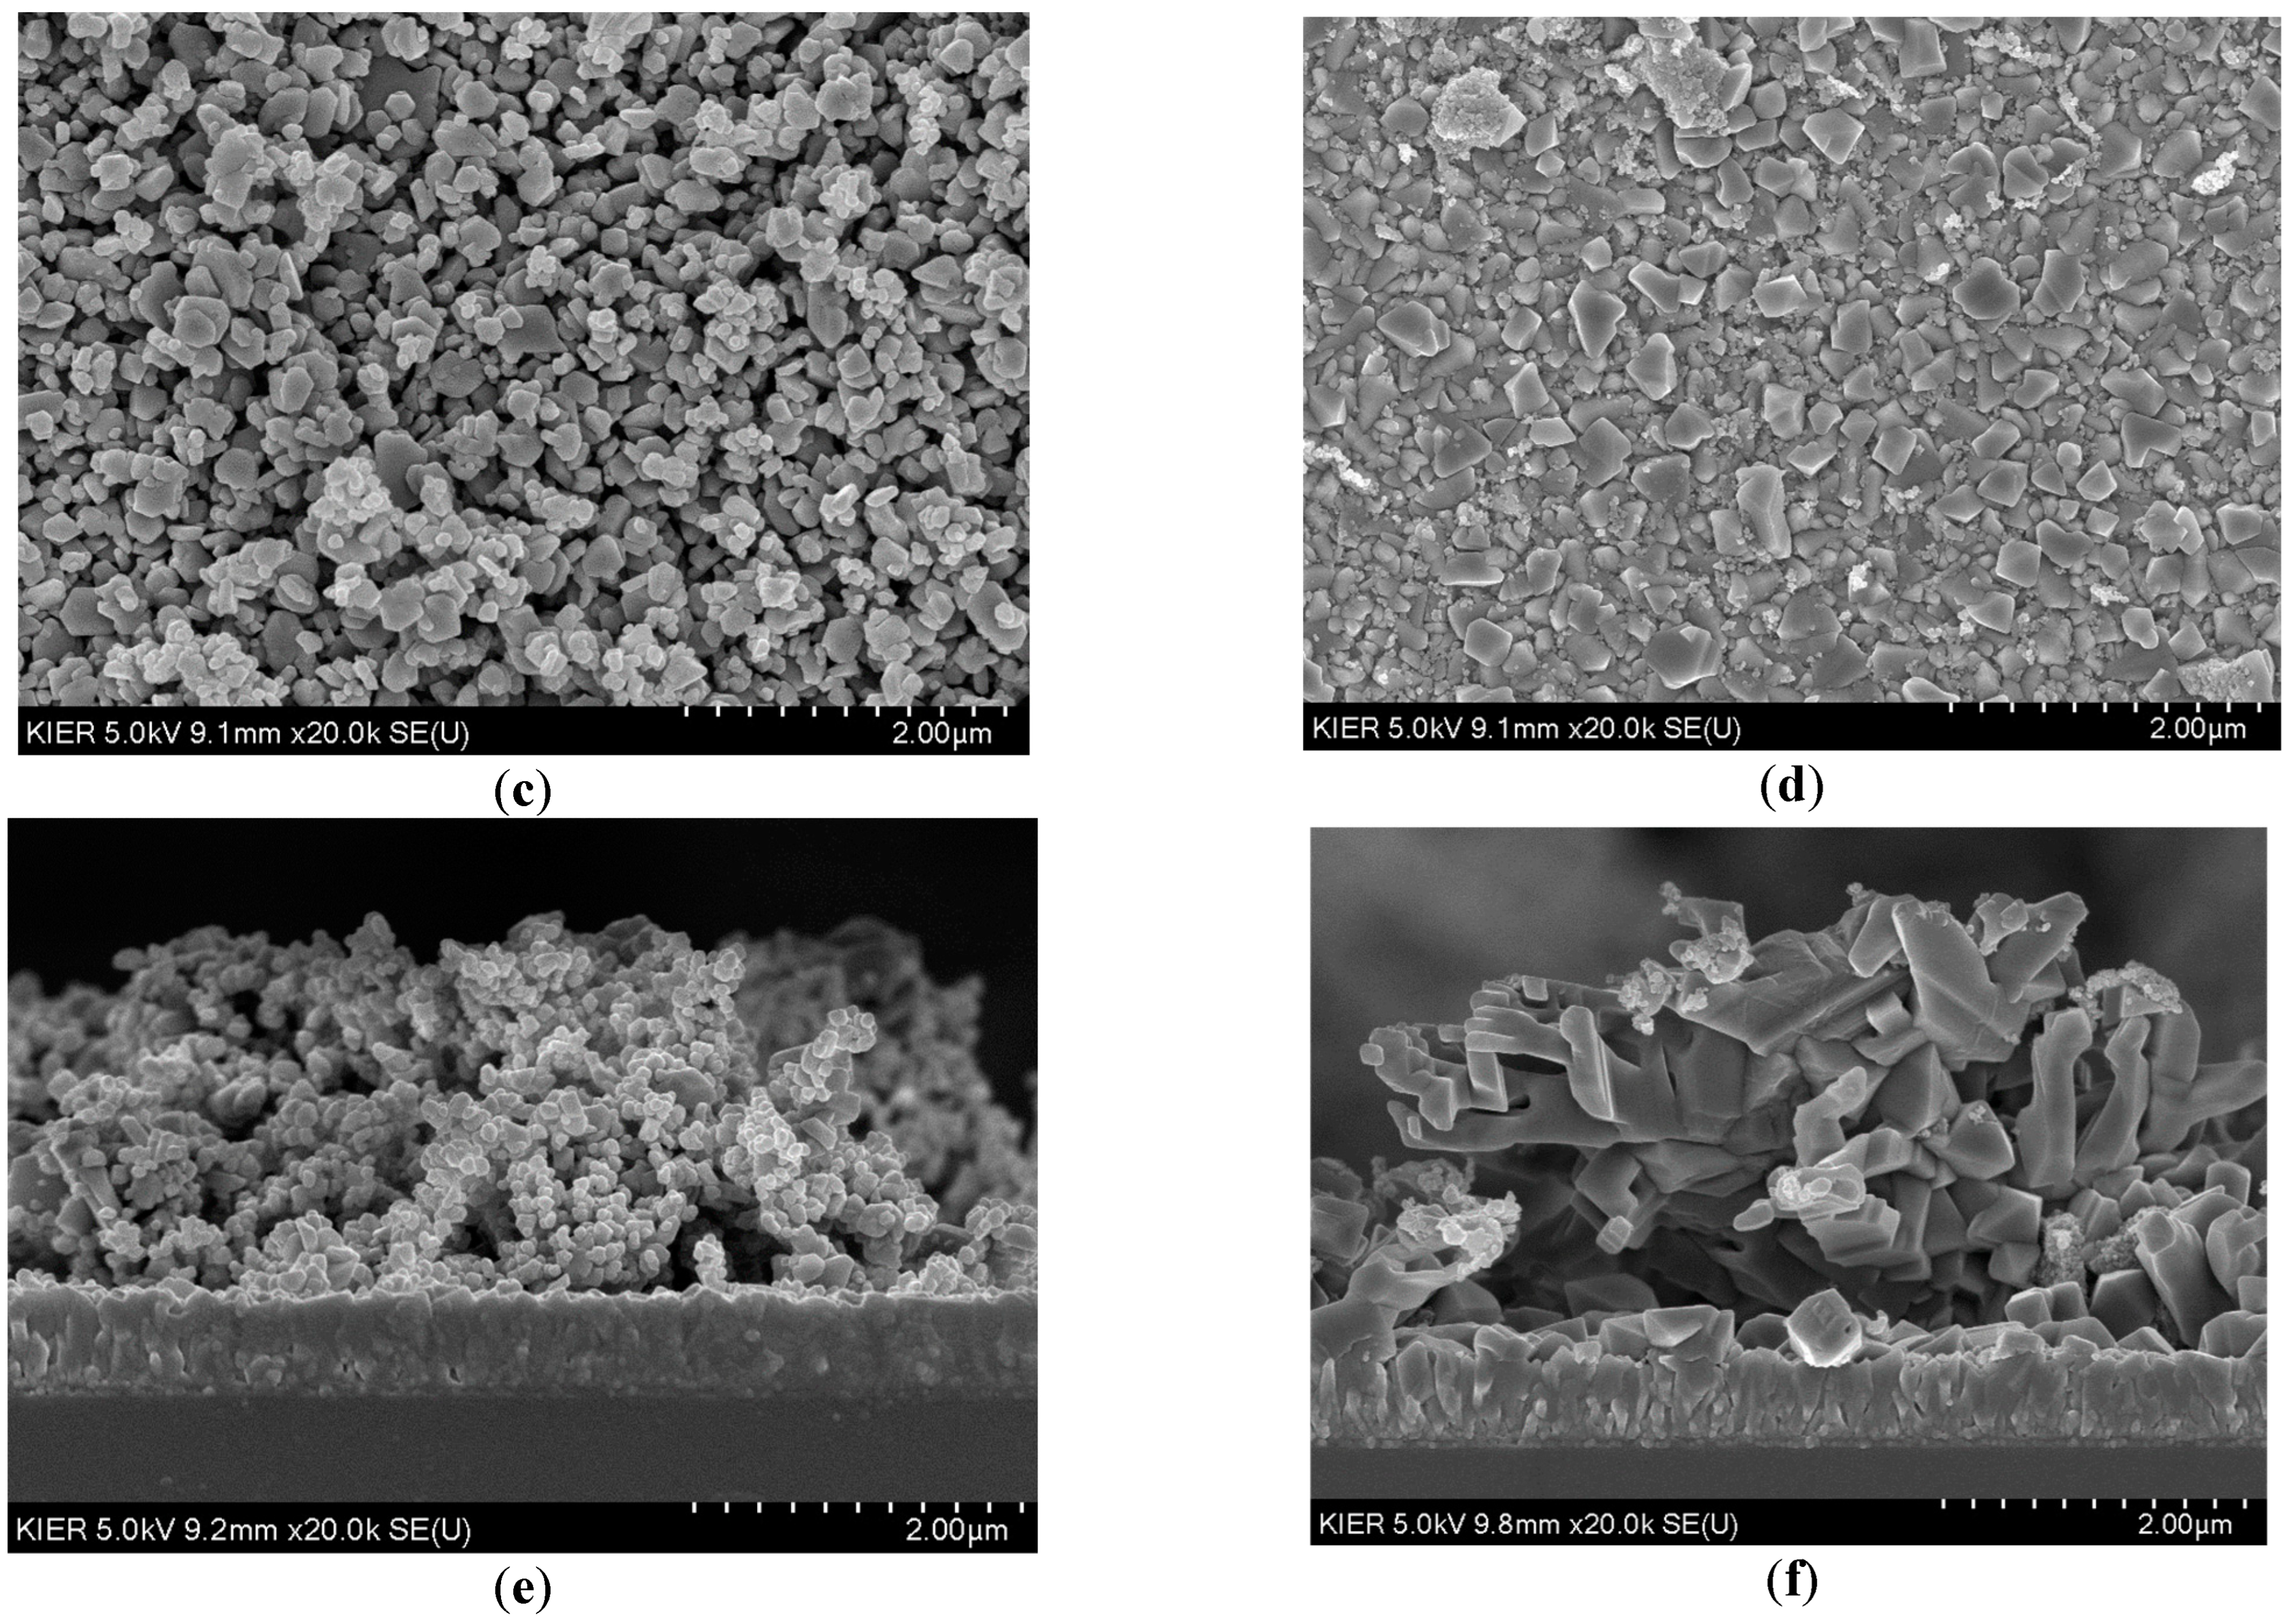
Scanning electronic microscopic (SEM) images were measured for both the powder and film forms of both perovskites, as shown in Figure 3.
Figure 3a,b shows that the MnTiO3 powder existed in larger agglomerates than the ZnTiO3 powder, with average sizes of ~300 and 250 nm, respectively. The ZnTiO3 powder agglomerates consisted of nearly spherical shapes that were more independent of one another. In both cases, the agglomerates existed in larger lumps. Each agglomerate also involved smaller particles that were combined together, vide infra.
In their film forms, Figure 3c,d shows that the ZnTiO3 film involved agglomerates of more spherical shapes that were sparsely packed. In the MnTiO3 film, the agglomerates were more compact, with flattened shapes and higher uniformity.
The film cross-sectional micrographs for the perovskite films are shown in Figure 3e,f. Both films had nonuniform thicknesses of average values ~1 μm (~1000 nm). The Figures clearly show that the MnTiO3 film had larger and more compact agglomerates than its ZnTiO3 counterpart. As the cross-sectional micrographs directly describe the film thicknesses, the values are more reliable than the values calculated based on gravimetry. Based on SEM film thickness values, the total amounts of perovskites in the monolayer films (1 × 4 cm2) were 2.3 × 10⁻³ and 1.8 × 10⁻³ g for ZnTiO3 and MnTiO3, respectively. These values will be accounted for when calculating the film efficiency here.
  • XRD structural study:
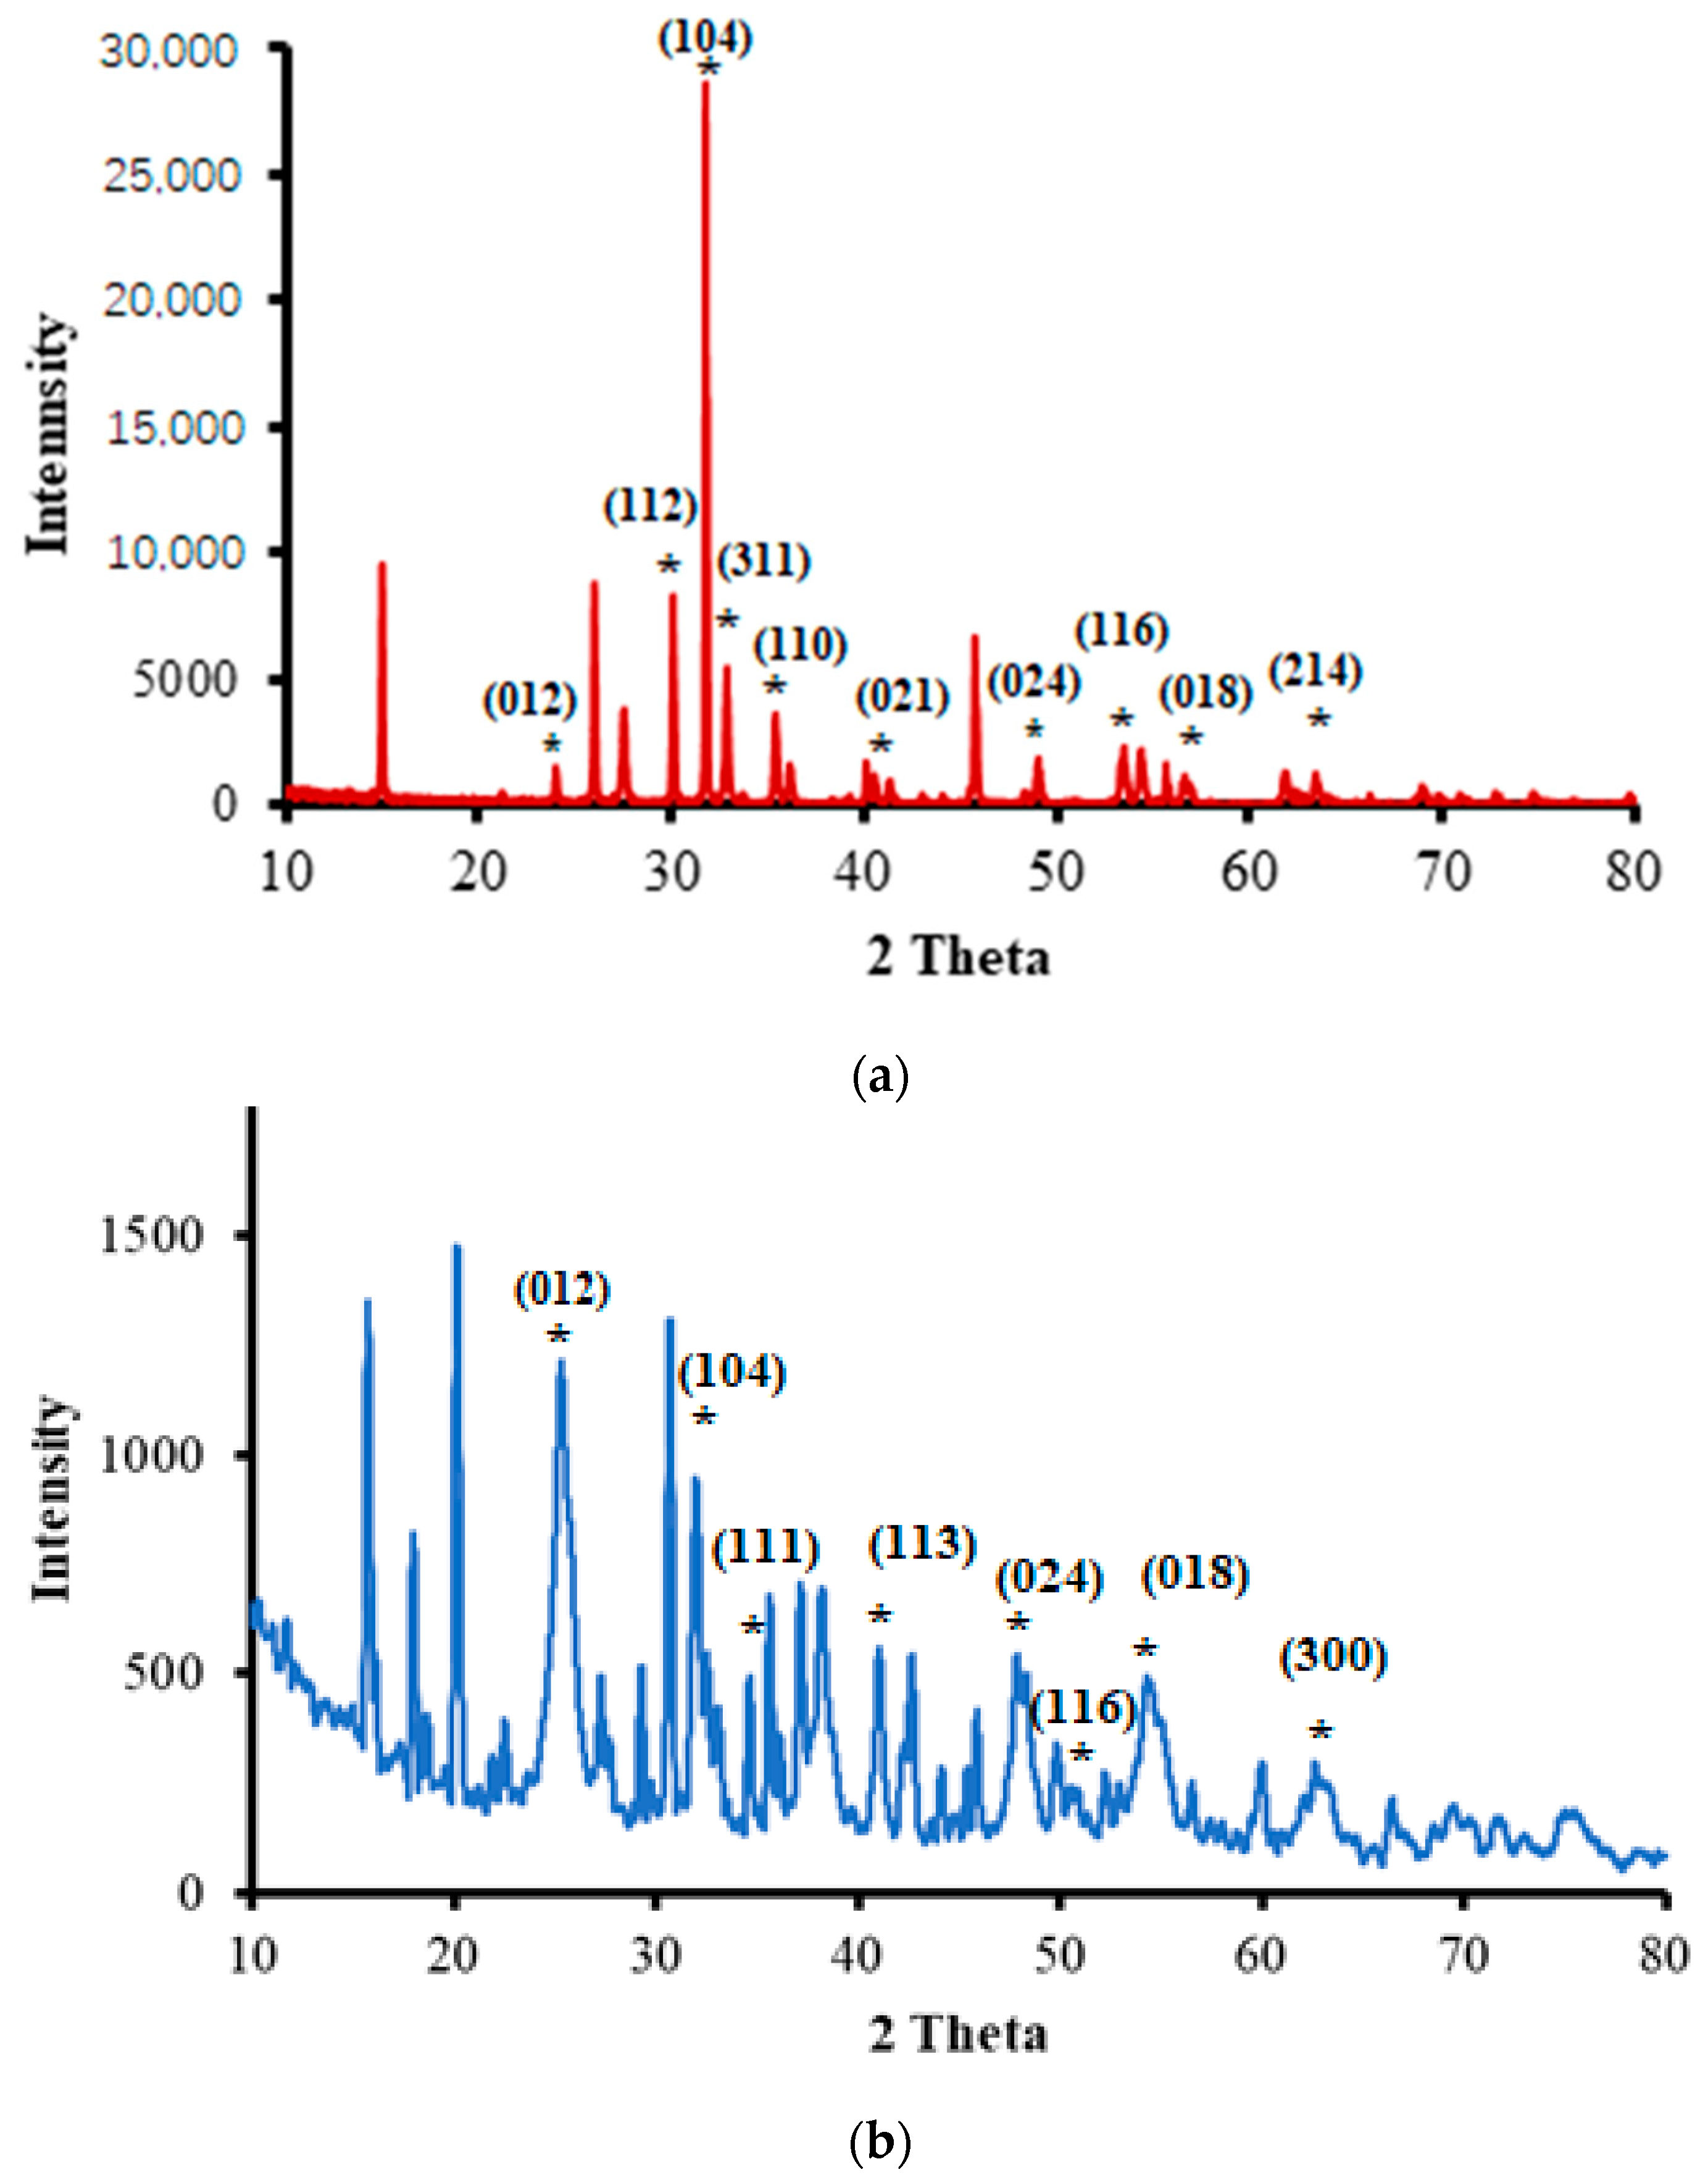
XRD patterns were measured at room temperature for the two perovskites in their powder forms, as shown in Figure 4. In the ZnTiO3 powder calcined at 600 °C, Figure 4a shows reflections 2θ = 31.1° (201), 33.0° (220), 35.5° (311), 40.5° (400), 53.6° (422), 57.0° (511) and 62.0° (440). The observed reflections refer to ZnTiO3 in the cubic structure, based on comparisons with earlier reports [40] and (JCPDS 39-0190). This confirms the presence of the perovskite material. Additional signals can be due to the formation of TiO2, Zn2Ti3O8 and others [41]. The results indicate the presence of ZnTiO3 mixed with other phases. Based on the Scherrer formula, using reflections from six different planes, the average crystallite size was ~48 nm.
Figure 4b shows the pattern for MnTiO3 with reflections 2θ = 32.0° (104), 34.6° (111), 40.9° (113), 47.8° (024), 52.3° (116), 54.7° (018) and 63.1° (300). The reflections are consistent with a perovskite structure for MnTiO3 [20,42] and (JCPDS 29-0902). Other reflections are due to other phases such as TiO2 [41]. The crystallite size, measured using the Scherrer equation based on averaging from six reflections, was ~68 nm.
For ZnTiO3, the crystallite size was smaller than for MnTiO3. In a given semiconductor material, larger crystallites yield narrower band gaps [43]. However, the difference here may not have been due to crystallite size differences, as the materials had different electronic and energetic differences. Alternatively, the band gap difference between the two materials was due to the material type difference, as ZnTiO3 has a wider Ebg then MnTiO3, as described above in the PL discussion. The literature values for Ebg also confirm this conclusion.
The crystallite sizes for ZnTiO3 and MnTiO3 were much smaller than the agglomerate sizes observed using SEM. This is known in the literature [44,45]. XRD patterns measure the sizes of the small crystallites at the nanometer scale, while SEM describes the larger agglomerates at micrometer scale sizes. The XRD and SEM results indicated that the smaller crystallites existed inside the larger agglomerates in both perovskites.
  • XPS study:
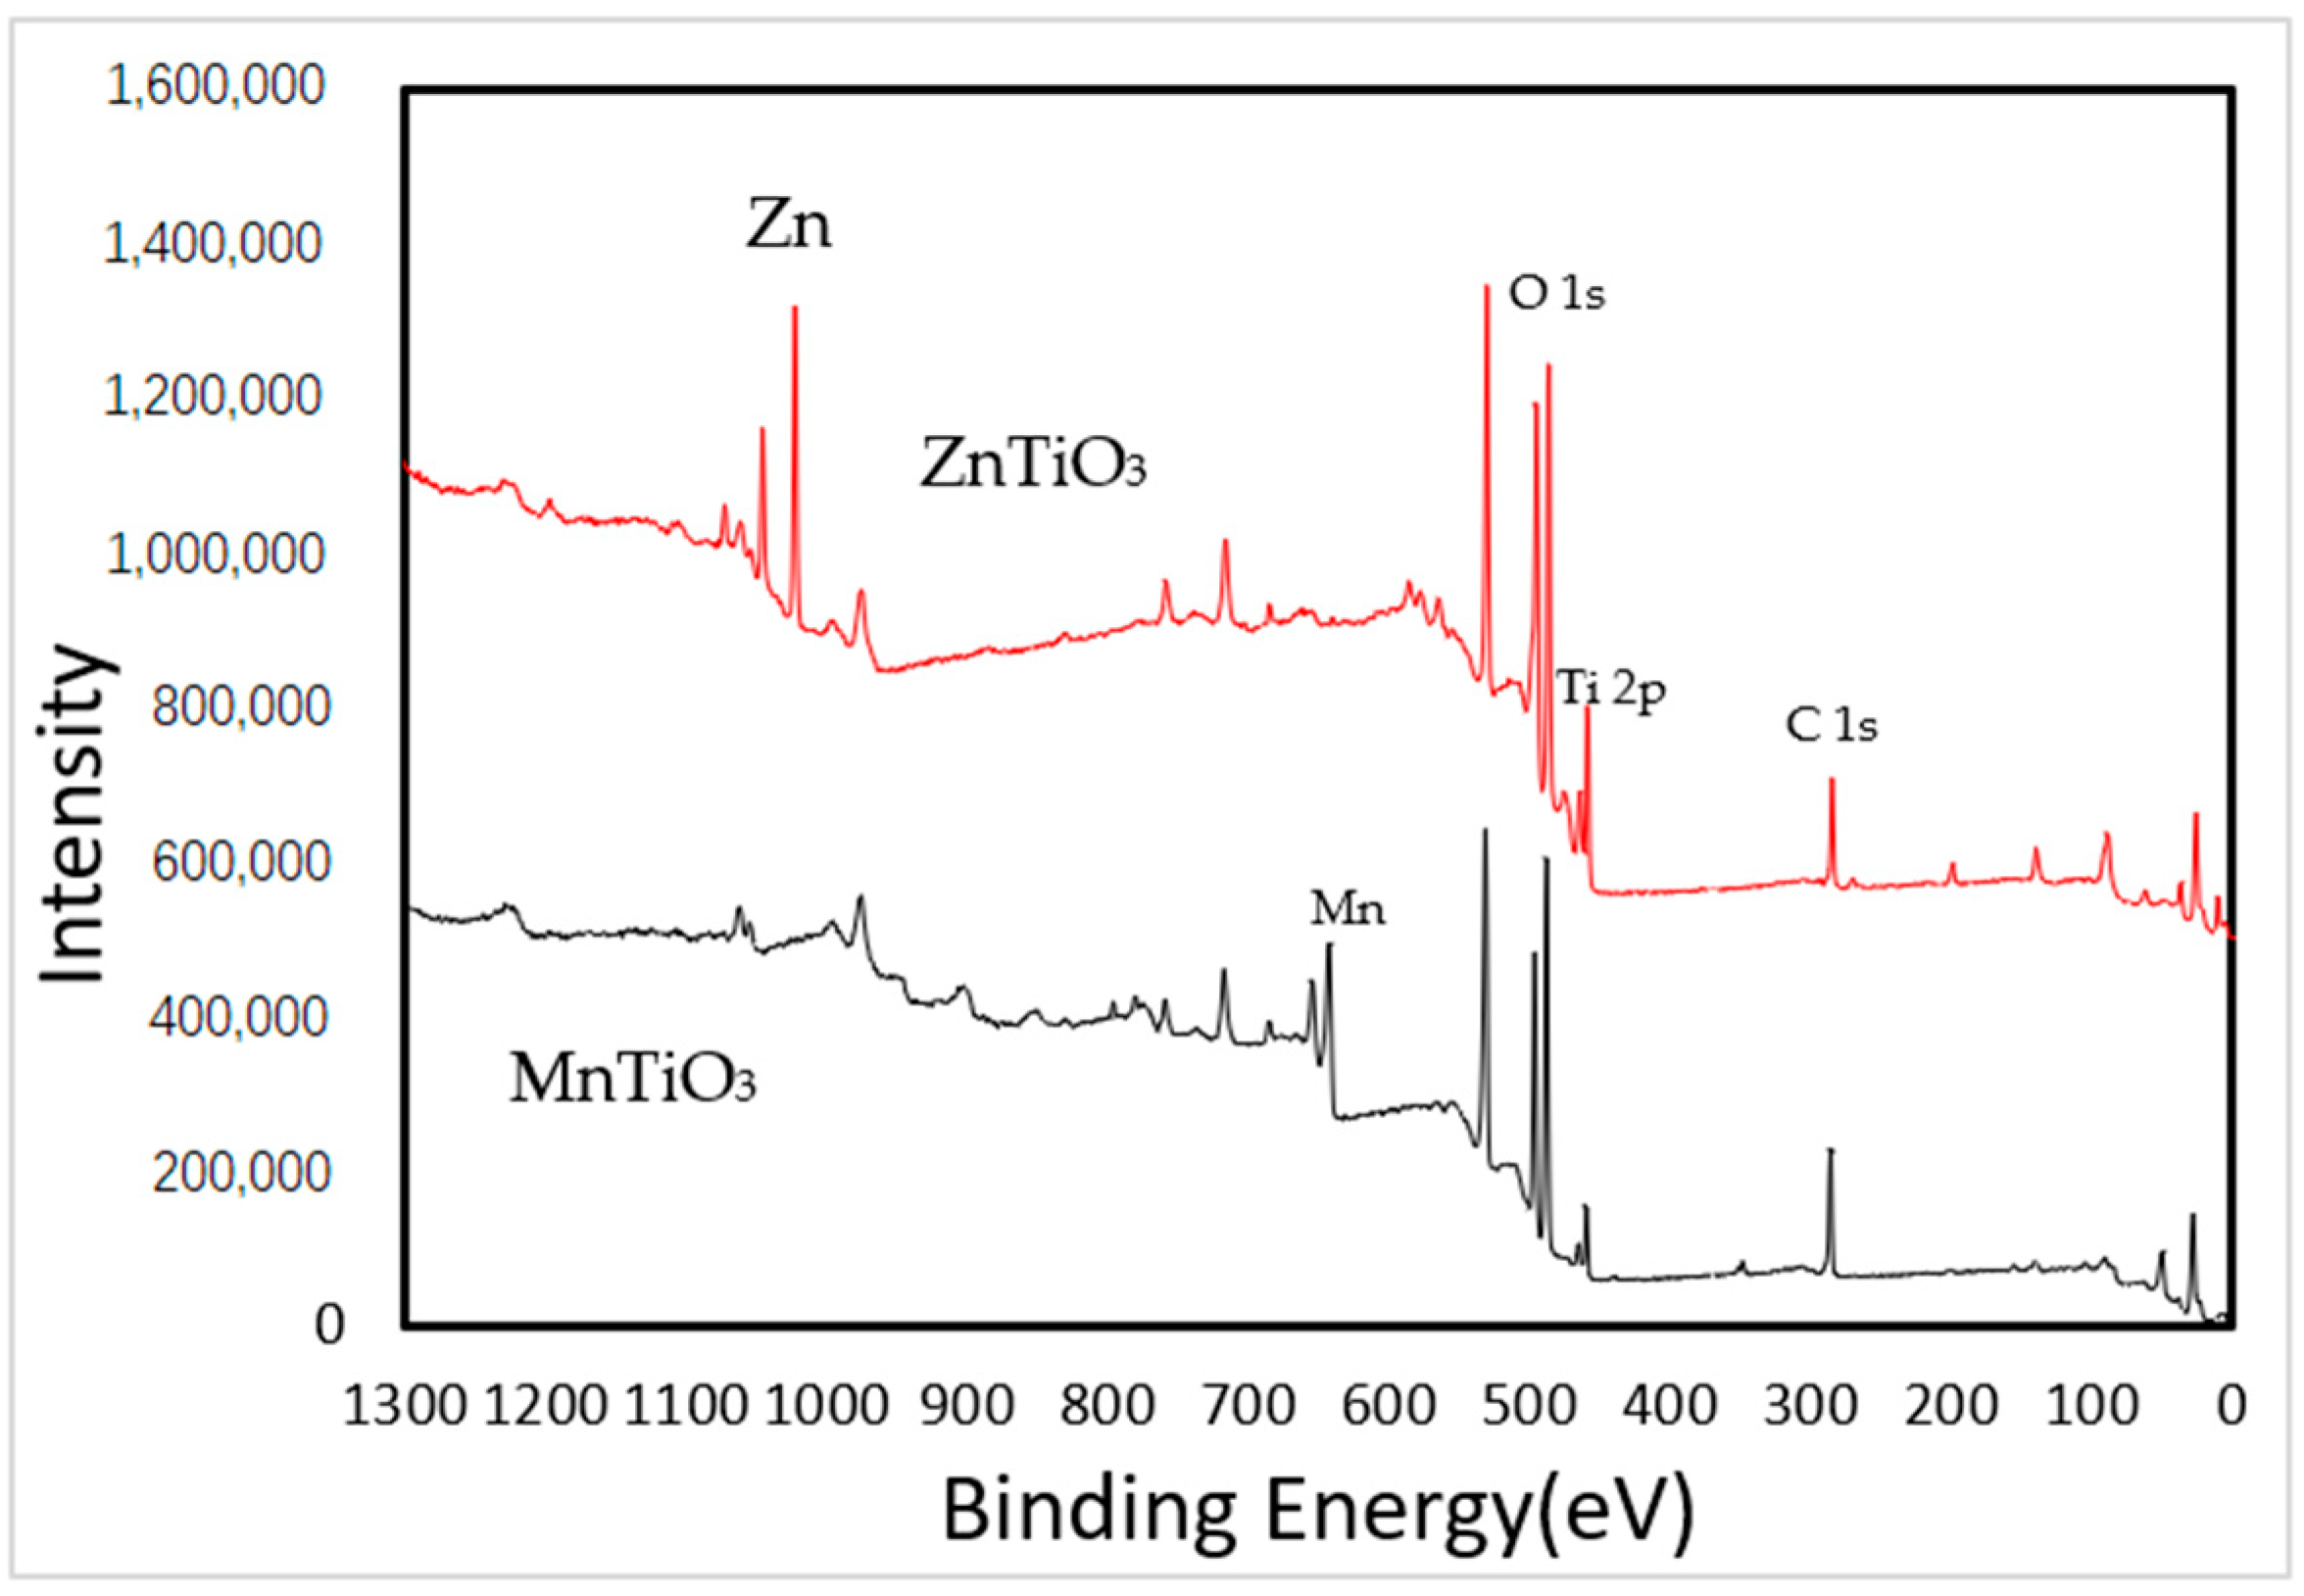
X-ray photoelectron spectroscopy (XPS) was used to check for the present elements in the prepared films, as shown in Figure 5. In ZnTiO3 film shown in Figure 5, all the peaks related to Zn2+ (2p), Ti4+ (2p) and O2− (1s) ions can be clearly observed at 1022.09, 458.09 and 531 eV, respectively. They resemble the peaks at 1021, 458.5 and 530.2 eV reported earlier for ZnTiO3 [46]. The carbon 1s peak at 284.09 eV, which commonly occurs in XPS spectra, is due to impurities.
Figure 5 describes the XPS spectrum for MnTiO3. The peaks for Mn2+ 2p at 644.05 eV, Ti4+ 532.05 at eV and O2− 485.05 at eV resemble literature values at 645.6, 485.3 and 531.1 eV for MnTiO3 perovskite [42]. The C 1s peak observed at 285.05 eV is attributed to impurities.
The XPS spectra further confirmed the presence of Zn2+, Ti4+ and O2− ions in the ZnTiO3 mixture phase, as well as the Mn+, Ti4+ and O2− ions in the MnTiO3 mixture phase. The results are consistent with the EAS and PL spectra and with the XRD pattern analysis, as described above.
  • Specific surface area (SSA):
For each perovskite powder, the specific surface area (SSA) was measured using the widely known acetic acid adsorption method [47,48]. Langmuir adsorption plots were constructed, as shown in Figure S2, and the powder surface areas were calculated for monolayer coverage. The calculated SSA values were 115 m2/g for ZnTiO3 and 90 m2/g for MnTiO3.
The ZnTiO3 powder had a higher SSA than its MnTiO3 counterpart. This is justified by the lower surface uniformity and compactness in the former, as described by the SEM and surface morphology results above. In the ZnTiO3 powder, the agglomerates had smaller sizes. The SSA values measured here were larger than those reported earlier. For the ZnTiO3 powder calcined at 600 °C, the reported SSA value was only 10 m2/g [18]. The literature shows that the SSA area for MnTiO3 powder is ~65 m2/g [42]. In both cases, the present perovskite mixed materials showed higher SSA values than their earlier literature counterparts.

3.2. Contaminant Photodegradation Studies

  • Control and confirmation results:
The control experiments indicated that the aqueous methylene blue concentration decreased under irradiation with solar simulated radiation. In cases of no added catalyst or dark experiments, no measurable contaminant loss was observed with time. The results indicate that the contaminant loss occured only under irradiation in the presence of the perovskite photocatalysts in various forms.
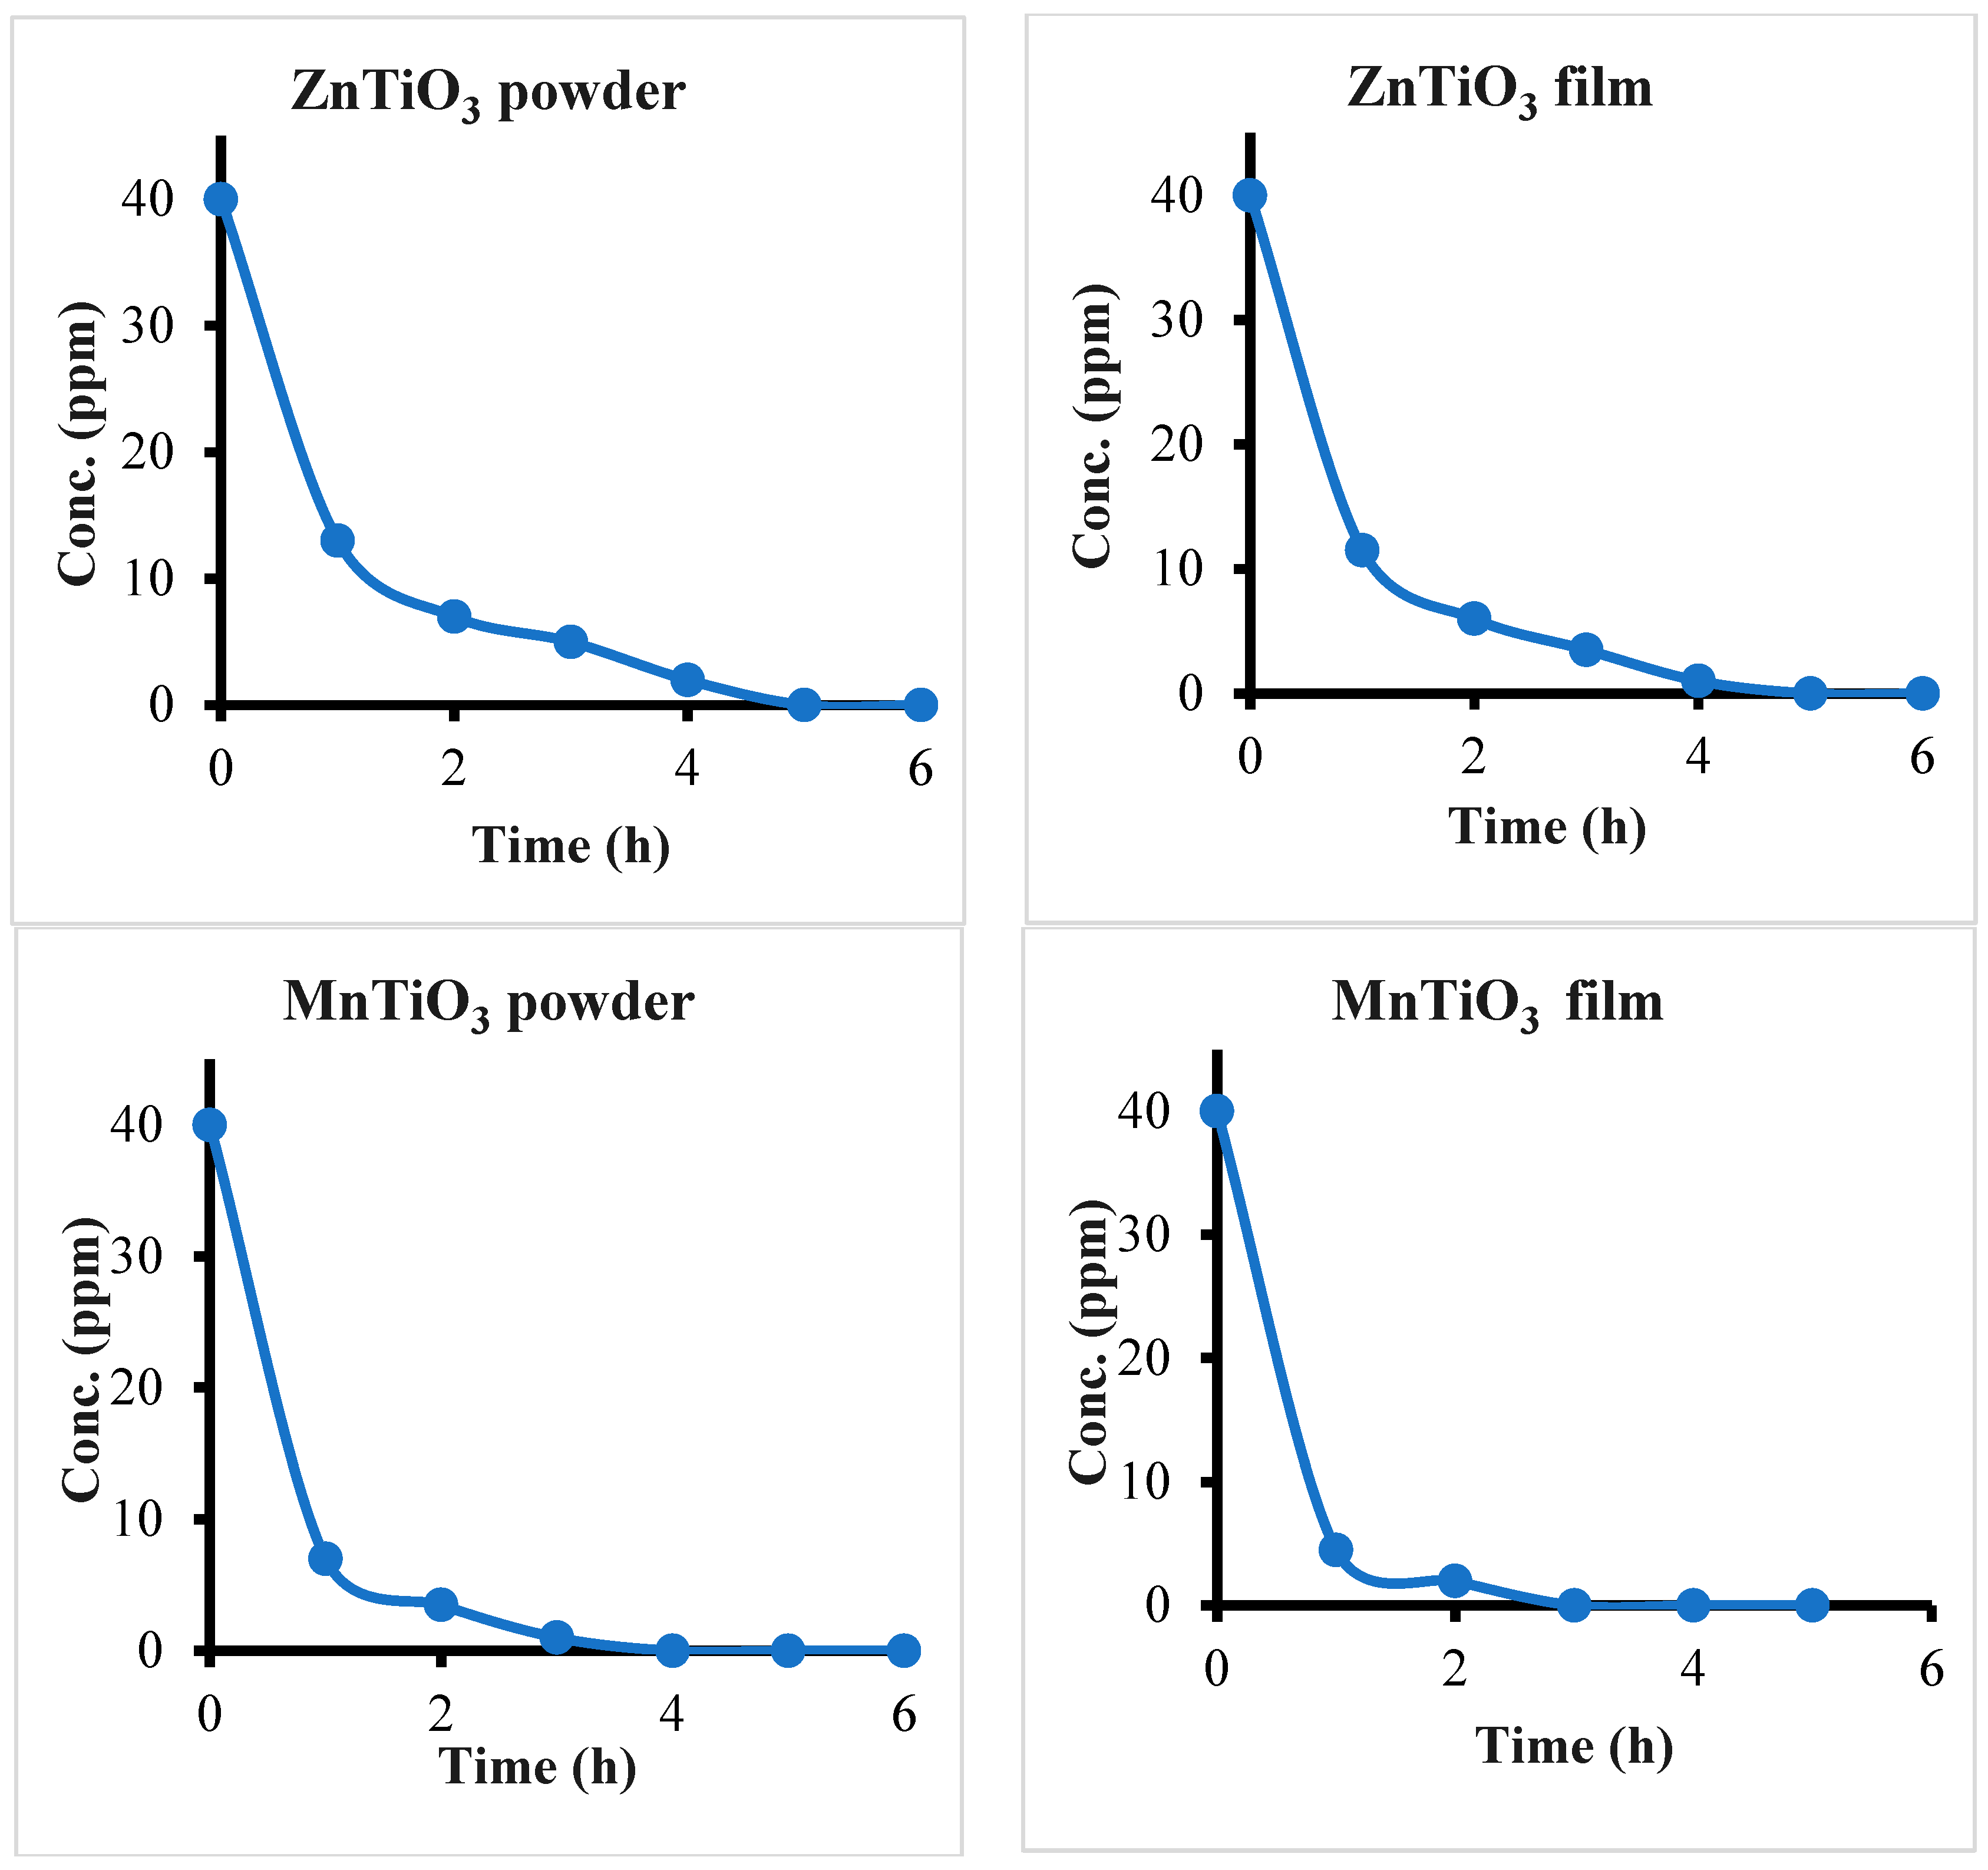
The lowering in the methylene blue absorbance spectra at wavelengths of ~300 and 660 nm indicates that the contaminant underwent complete mineralization under photocatalytic conditions. The stable phenyl groups themselves were also degraded under photodegradation conditions. When allowed enough time, the methylene blue completely disappeared, as confirmed in Figure 6. These conclusions were confirmed by the appearance of nitrate ions after prolonged photocatalytic experimental conditions, as summarized in Table 1.
Based on the molar mass of methylene blue (319.85 g/mole), and knowing that one methylene blue contaminant contains 42 g of N, the maximum expected NO3 ion concentration in the resulting solution should be ~5.2 ppm. Table 1 shows the production of the nitrate ion at measurable concentrations close to the expected value. This confirms the complete mineralization of the contaminant molecules during photodegradation. However, other nitrogen species may also result, such as nitrite ions, nitrogen oxide gases, ammonia gas, nitrogen gas or others species.
The maximum allowed methylene blue in drinking water is 25 ppm based on some references, while the WHO dictates that no amount of methylene blue should be allowed, as described above. The maximum allowed nitrate limit is 10–50 ppm based on the earlier literature [49]. The US Environmental Protection Agency (EPA) limit for nitrate ions is 10 ppm (as nitrogen) [47]. Complete mineralization of 40 ppm methylene blue is therefore virtuous and yields water that is within acceptable limits.
The cut-off experiments showed that both perovskites mixture catalysts need UV radiation. Visible light is not enough for the reaction to proceed effectively. This is due to the wide band gap nature of the two systems, which demands short wavelengths. Fortunately, both catalysts effectively function under solar simulated radiation using the UV tail of ~5% of the oncoming solar radiation. These issues were considered while calculating the quantum yield values, as described below.
  • Effect of pH:
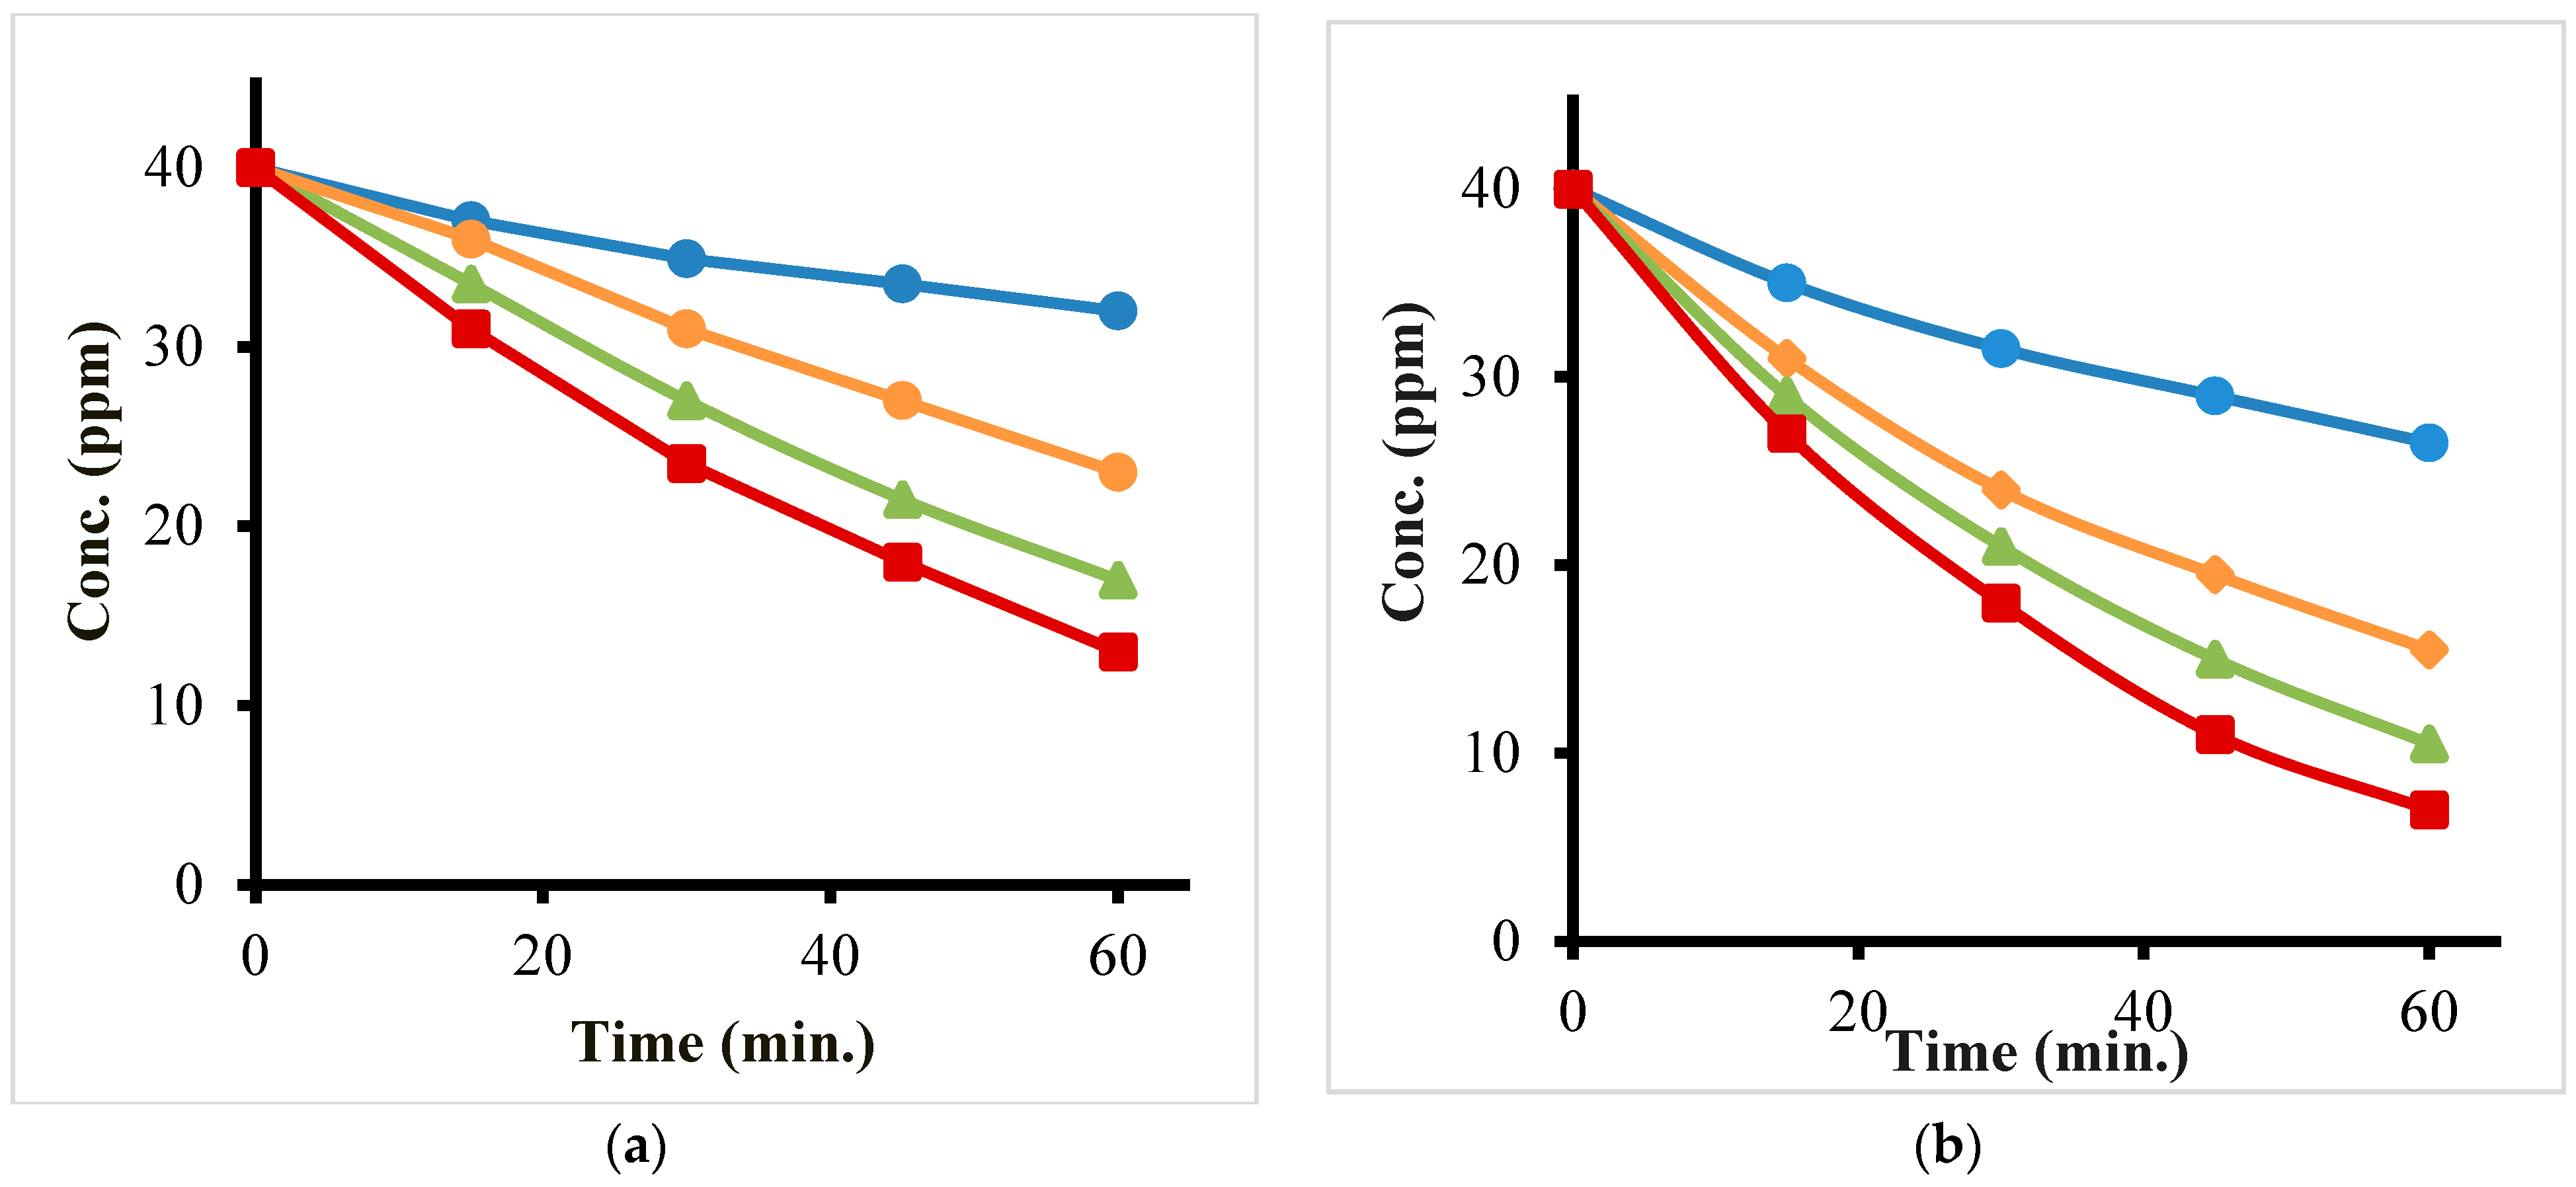
Typically, natural waters have various pH values within the range 6.0–8.5. Therefore, the effect of pH on methylene blue photodegradation was assessed here at various values, ranging from acidic to basic media. The results for both catalysts in their powder and film forms are shown in Figure 7. The Figure shows that the reactions were affected by the pH of all catalysts, in the order of 3.5 < 7 < 11 < 8.5.
For all the perovskite catalysts, the activity was higher in basic media. At a pH value of 8.5, the efficiency was notably highest among the series. The effect of pH on the photodegradation reaction rate is rationalized by the concept of point of zero charge (PZC) for the catalyst surface and the contaminant molecule charge variation with pH.
The structure of methylene blue varies with the solution pH value, as shown in Figure 8. At a pH value lower than 5.6, the molecule is cationic with a positive charge at one terminal N atom. As the pH is increased, the molecules assume a neutral form with no positive charges.
For the ZnTiO3 and MnTiO3 materials, the PZC values were ~7.80 and ~7.83. ZnTiO3 has a PZC value reported in the literature within the range of 7.00–7.60 [51,52], depending on the presence of TiO2. For MnTiO3, the present high values were due to the mixed phase with TiO2, as reported earlier [53]. These variations in PZC are consistent with the XRD results, which confirmed the presence of the TiO2 phase in the perovskites. Therefore, both perovskite surfaces carry positive charges at pH values less than 7.8 and negative charges at higher values. At pH values close to 7.8, the perovskite surfaces are nearly neutral.
Photodegradation processes occur when semiconductor catalyst particles are excited by incident photons to produce shot-lived oxidizing species such as (OH), as described in the literature reported mechanism given below. This short-lived species may exist near the catalyst surface for short times only. Therefore, the contaminant molecule must be close to the semiconductor surface to be affected. Thus, the charges at the semiconductor surface and the methylene blue charge should affect the degradation reaction.
At low pH values, both methylene blue [54] and the semiconductor surface carry positive charges. The catalyst surface thus repels the methylene blue molecules. The molecules therefore stay away from the oxidizing species, and consequently, the degradation reaction is inhibited.
Under basic conditions with high pH values (e.g., 11), the methylene blue molecules are neutral, while the semiconductor surface is negatively charged. Therefore, some electrostatic attractions occur between the partial positive charges at H atoms in methylene blue molecules and negative charges at the semiconductor surface. The methylene blue molecules are in close proximity with the surface and may reach the nearby oxidizing species. Therefore, the reaction is faster at higher pH values compared to lower values. On the other hand, the N atoms in the methylene blue carry negative charges and are repelled by the surface negative charges. Therefore, the reaction is still slow at higher pH values.
At pH values close to 7.8, like the case with 8.5, the methylene blue is neutral, and the semiconductor catalyst surface is nearly neutral. The partially positively charged H atoms (in methylene blue) are more attracted to the partially negatively charged oxygen atoms at the semiconductor surface. Moreover, the partially negatively charged N atoms (in methylene blue) are attracted to the partially positively charged H atoms at the semiconductor surface. The contaminant molecules are thus kept close to the catalyst surface and the oxidizing OH species. The relatively faster photodegradation reaction at pH 8.5 is thus rationalized. Similar results were reported for MnTiO3 powder catalyst in methylene blue photodegradation, where the reaction progressed faster at higher pH values within the range 2–9 [20]. The report did not rationalize the effect of the pH value. Other reports have described ZnTiO3 nanopowders and nanofibers in the photodegradation of methylene blue with no reference to the pH effect [18,55]. In another report [56], ZnTiO3 supported on clays and zeolites adsorbed more methylene at higher pH values within the range of 2–10.
Natural waters normally have pH values ranging from acidic to basic [57]. The present results show the application value in future water purification processes, especially when using the perovskite catalysts in their film form. The catalysts function at various pH values, with special efficiency at 8.5.
  • Effect of contaminant concentration:
The effect of contaminant concentration on the photodegradation reaction rate was investigated for both perovskite powder and film catalysts. Figure 9 shows how the remaining methylene blue concentration varies with time for various contaminant concentrations in cases of both ZnTiO3 and MnTiO3 powder and film forms within 60 min. In all cases, the contaminant concentration decreases with time. After 60 min, the value for degradation % decreases as the initial concentration of the contaminant increases. However, the actual contaminant concentration loss decreases when using higher contaminant concentrations. Therefore, the catalyst efficiency increases with higher initial concentrations of the contaminant.
Figure 9 and Table 2 indicate that the turnover frequency and quantum yield increase with increased initial methylene blue concentration for all catalyst types. Moreover, the film form is superior compared to the powder form of each catalyst.
The reaction kinetics were calculated to determine the effect of the contaminant concentration on the reaction progress. Following the widely known initial rate method, plots of ln(initial rate) vs. ln(initial conc) were constructed for both perovskites in their powder and film forms, as shown in Figure S3. The Figure shows that the rate order values were 0.76, 0.71, 0.60 and 0.65 with respect to methylene blue with ZnTiO3 powder, MnTiO3 powder, ZnTiO3 films and MnTiO3 films, respectively. The values indicate that the degradation reaction rate is faster at higher contaminant concentrations, albeit with no linearity. The values for the reaction rate constant (k) were ~0.021, 0.043, 0.053 and 0.074 min−1 for ZnTiO3 powder (0.1 g), MnTiO3 powder (0.1 g), ZnTiO3 films (2.3 × 10⁻³ g) and MnTiO3 films (1.8 × 10⁻³ g), respectively.
The rate constant values indicate that the MnTiO3 catalyst was more efficient than ZnTiO3 in both powder and film forms. In fact, the prepared ZnTiO3 perovskites had higher SSA values than MnTiO3. Therefore, the SSA value was not the determining factor. As described above, MnTiO3 has a smaller band gap, corresponding to ~403 nm, compared to ZnTiO3 with ~352 nm. Therefore, the former perovskite is more susceptible to excitation by the incident solar simulated radiations at the region close to visible light. The tungsten–halogen lamp spectrum involves radiations with wavelengths just shorter than 400 nm, Figure S1, as described above.
Moreover, the film catalysts in both perovskites had higher rate constant (k) values than their powder forms. The rate constant values were 0.0211, 0.043, 0.053 and 0.074 min−1 for ZnTiO3 powder, MnTiO3 powder, ZnTiO3 film and MnTiO3 film, respectively. These may not describe the real differences between the films and powders here. However, considering that the amounts of catalysts in the film form were much smaller than in the powder form, as described in Table 2 above, the relative values for the rate constant (min−1 per g catalyst) would be much higher for the film than the powder counterparts.
To confirm these findings, the effect of powder catalyst loading on methylene blue photodegradation was studied, as shown in Figure 10. With higher perovskite powder loading, more methylene blue molecules were degraded in 60 min. In the powder form, catalyst particles moving at the reaction mixture may obscure the catalyst sites in the reaction bulk from icident photons. Therefore, within the experimental conditions, higher catalyst loading induced faster reactions. Plots of ln(initial rate) vs. ln(catalyst loading) for methylene blue degradation are described in supplementary Figure S4. For the ZnTiO3 powder, the reaction order with respect to the catalyst was 0.98, and the rate constant k was 0.27 min−1. For MnTiO3 powder, the reaction had 0.44 order with respect to the catalyst, and the rate constant k was 0.62 min−1. In both perovskite powders, increasing catalyst loading sped up the reaction, but not necessarilly linearly. Based on Figure S4, The rate constant values also indicate that the MnTiO3 (0.621 min−1) is more efficienct than ZnTiO3 (0.265 min−1), as described above.
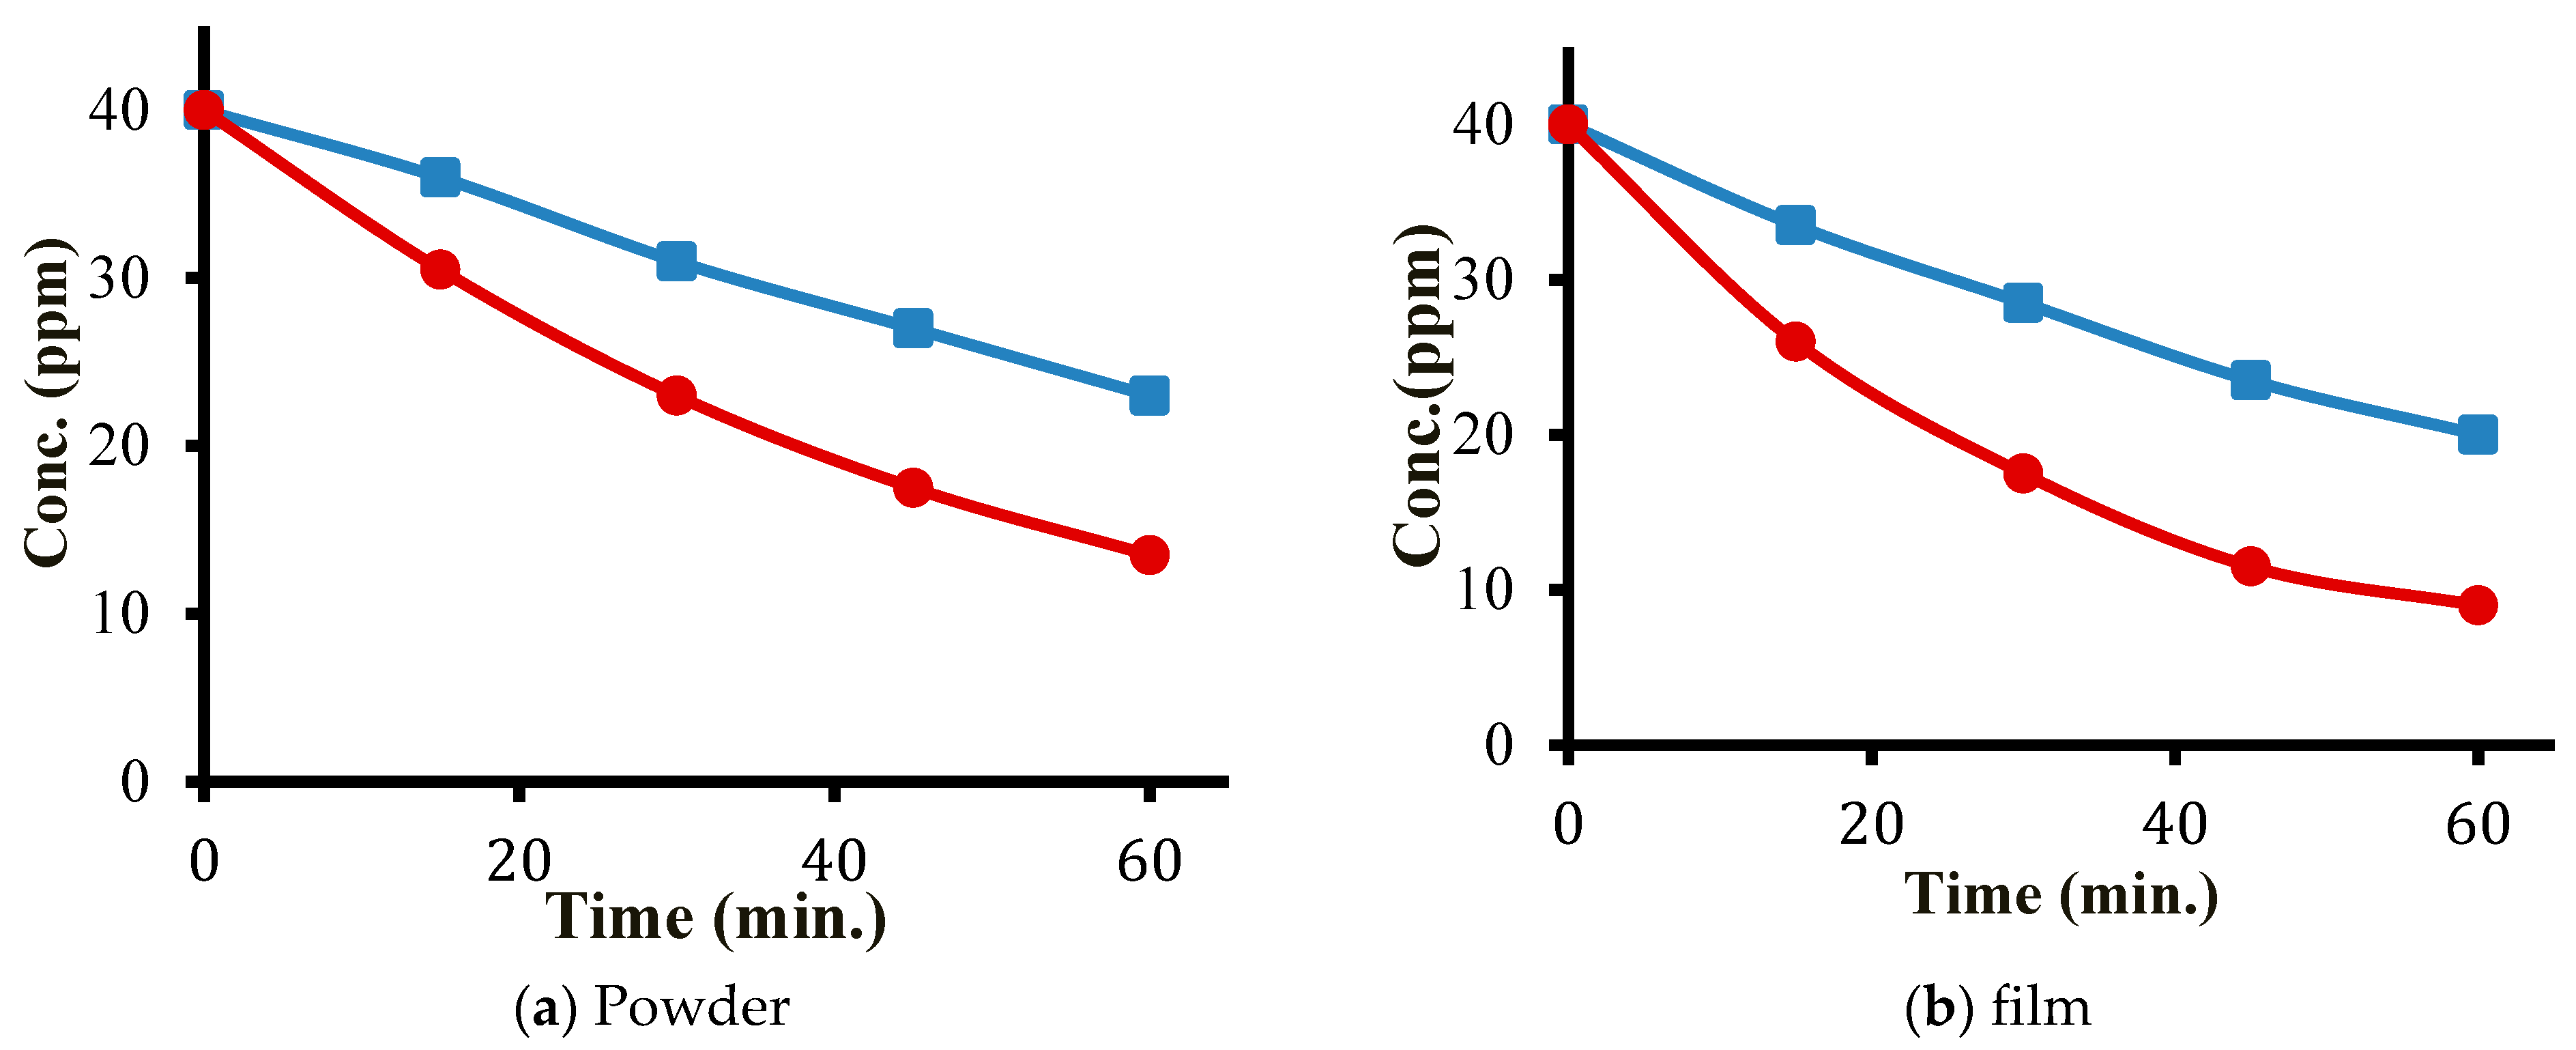
Therefore, when comparing powder vs. film catalyst systems, these findings should not be excluded. Figure 11 summarizes these results for both perovskite mixtures. The film catalysts, with much smaller amounts, show much higher relative efficiency than their powder catalyst counterparts. The justification is that in the powder forms, the particles at the reaction mixture surface may prevent incident photons from reaching the catalyst particles in the reaction mixture bulk. This issue may be avoided in case of film cataysts. The present findings are especially valuable for future applications in water purification processes, which favor film catalyst systems due to their easy recovery and reuse.
The high film catalytic efficiency observed here could not be compared to the literature for ZnTiO3 or MnTiO3 due to a lack of earlier studies but may be compared with other film catalysts of anatase TiO2 systems. In one report, Utami et al. prepared TiO2 films using the spraying method and used the films for methylene blue photodegradation under solar radiation. In 5 h, complete degradation of methylene blue was reported in the case of 25 mL solutions at 25 ppm [58]. As the report did not describe the rate constant for the reaction or catalyst activity with respect to the TiO2 mass, nor did it specify whether UV or visible light was involved, a comparison could not be made. Kumariah et al. reported the catalytic efficiency of brookite TiO2 films in methylene blue photodegradation under visible solar light [59]. However, with the measured band gap values within the range 3.30–3.48 eV, the ability of the reaction to proceed under visible solar light needs to be justified. In another study, anatase TiO2 films were prepared using the sol-gel method and were used to photodegrade aqueous methylene blue with UV radiation of 365 nm [60]. The report did not describe the kinetics or rate constant for the reaction. These literature reports indicate that the TiO2 phase that exists inside the present perovskite materials may have photocatalytic effects on the methylene blue degradation reported here. However, the high film catalyst efficiency per gram of catalyst observed here indicates that the perovskites were the major catalyst species in the present study. Moreover, the present perovskite films showed a high efficiency per gram under solar simulated radiation.
  • Continuous flow study:
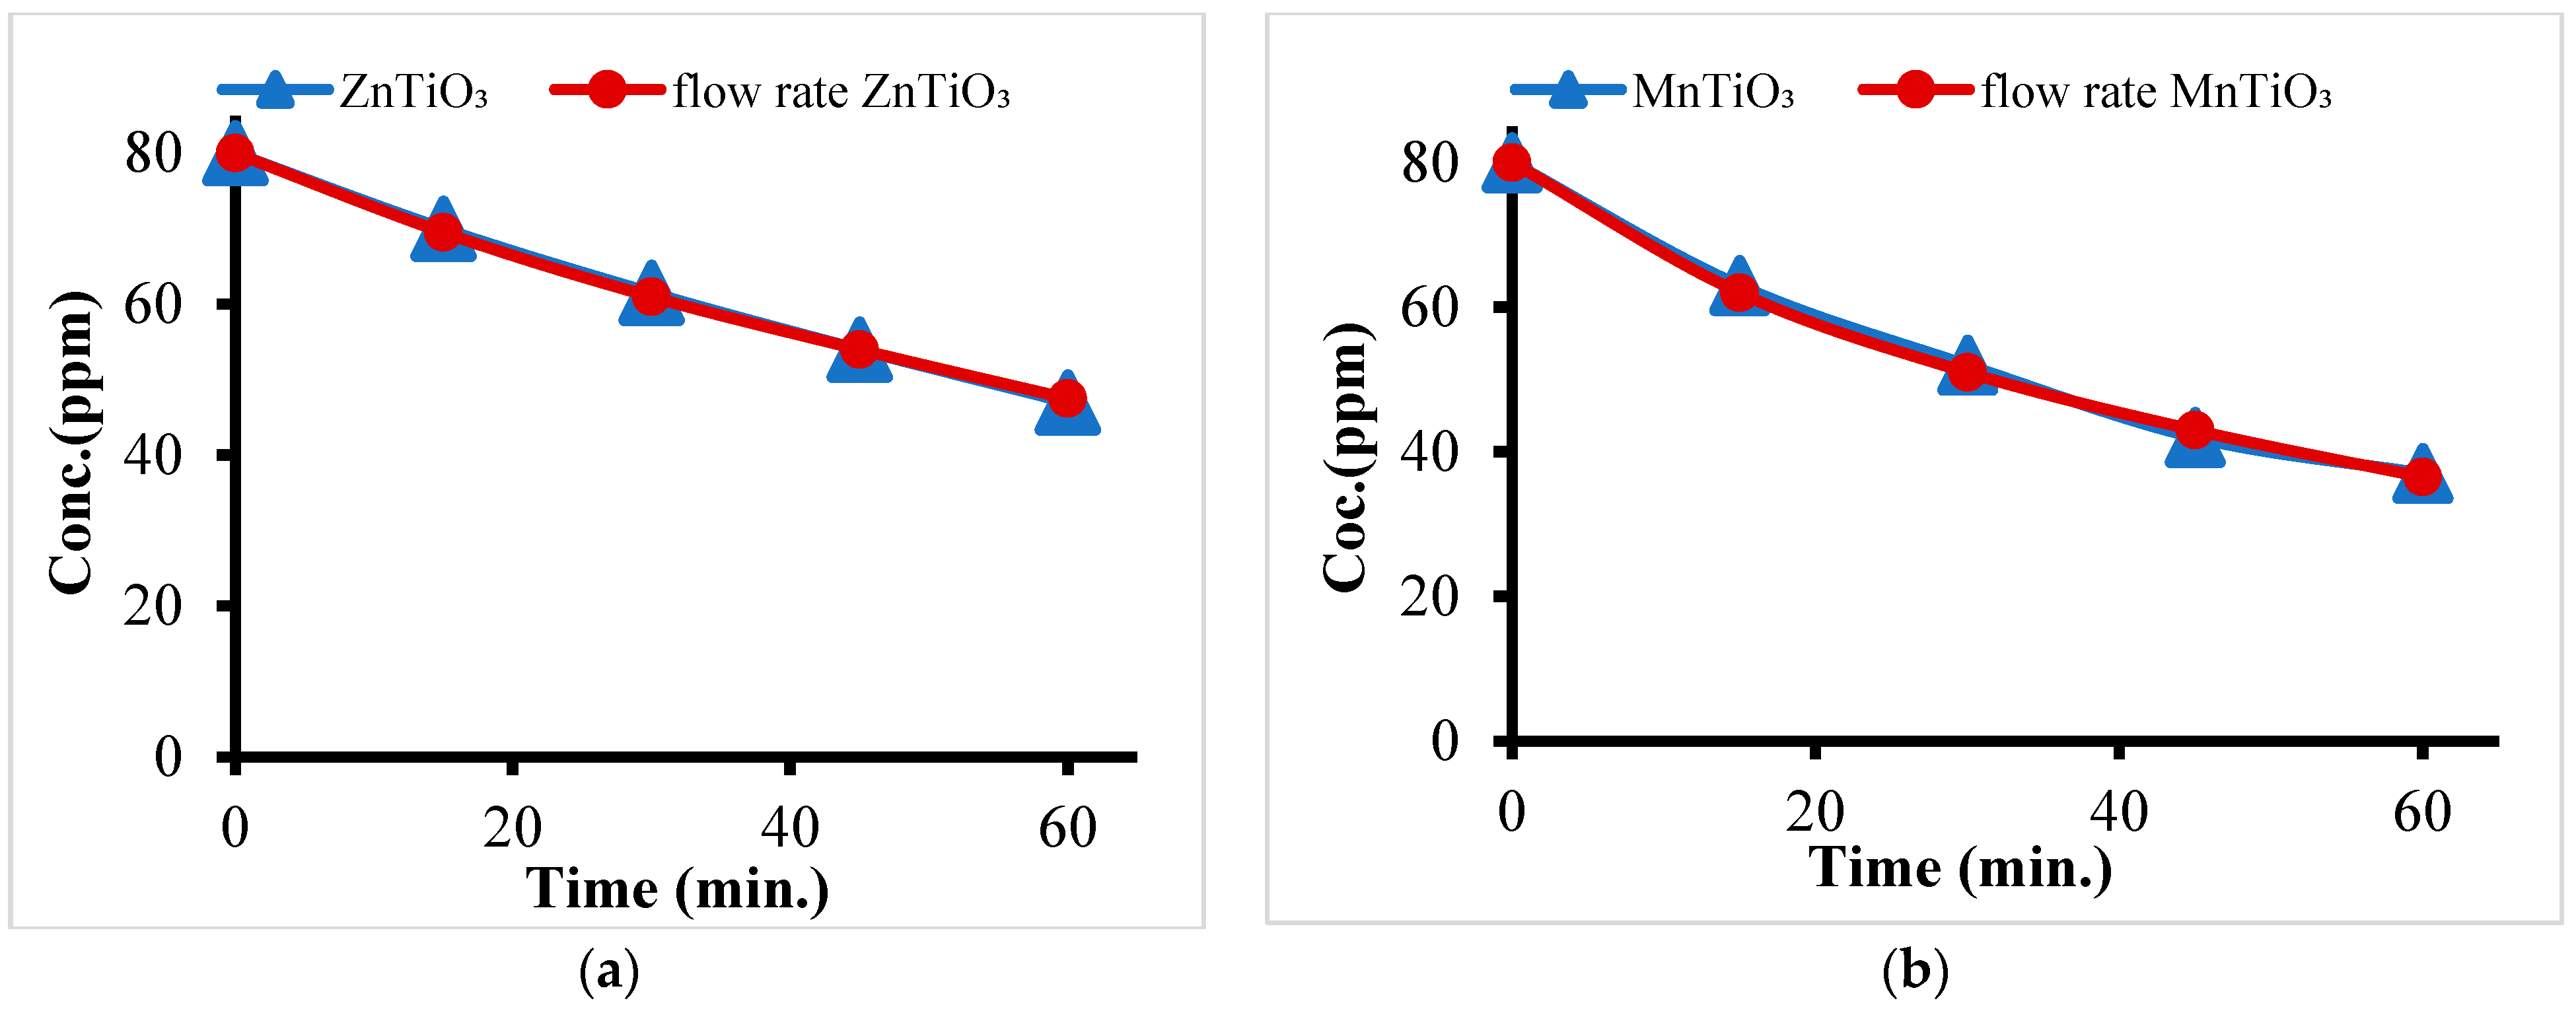
In large commercial scale processes, continuous flow reactions are preferred. In order to assess the perovskite materials for future larger scales, special continuous flow experiments were performed. A comparison between the continuous flow and batch reactions for both perovskite films was made. Experiments were performed on methylene blue solutions (100 mL, 80 ppm) at room temperature and pH 7. The contaminant solution was recycled and allowed to pass atop the catalyst film at a flow rate of 5 mL/min, for a total time of 60 min. The results are summarized in Figure 12. For both perovskite mixture film catalysts, the Figure shows that the continuous flow reaction rate is the same as that for the batch reaction flow rate. This is a feature of the film catalyst systems, as the continuous flow reaction exhibits very high catalyst efficiency in methylene blue photodegradation. The present process is potentially useful in future large-scale purification processes, subject to more pilot plant-scale study.
  • Catalyst recovery and reuse:
The powder and film perovskite catalysts were recovered by and reused. Figure S5 summarizes the efficiency of each reused catalyst system. The powder catalysts were carefully recovered through filtrations, washed with water and dried and weighed. In each recovered powder, the recovered mass was less than the fresh catalyst mass. For ZnTiO3, only ~80% of the catalyst powder was recovered, and the efficiency was lowered by ~14% when reused. Similarly, only approximately 80% of the MnTiO3 powder was recovered, with an efficiency lowering of ~15% upon reuse. In both powder forms, with mass loss of ~20% upon recovery, only approximately 15% of the efficiency was lost. The catalyst efficiency lowering after recovery was therefore due to a loss of the catalyst materials during recovery. As described above in the Introduction section (Section 1), powder catalyst systems suffer technical difficulties upon recovery for further reuse. This shows the importance of using film catalysts as a replacement for powder catalysts.
The film catalysts were recovered using tongs, with no noticeable mass loss. Similarly, the efficiency in both films was retained upon recovery, as shown in Figure S5. The results confirm the suitability of film catalyst systems in terms of easy recovery and efficiency retention upon reuse. This should be useful when performing large-scale photodegradation processes.
  • Mechanism:
Earlier literature has shown plausible mechanisms for the photodegradation of methylene blue [21,61] using various types of semiconductor nanoparticles. These and other mechanisms are acceptable and explain the present results. The present study does not propose any new mechanism, but instead uses the earlier accepted mechanism. The earlier mechanism explains the results observed in the present study. A summary of the earlier mechanisms is outlined below:
  • Excitation of the semiconductor catalyst, shown in Equation (1), is a necessary step, which yields the excited Cat*.
    Cat + hv → Cat*
  • The excited electrons travel to the conduction band (CBe), leaving holes in the valence band (VBh+). The CBe interacts with dissolved oxygen molecules to yield the highly reactive superoxide O2 species. The superoxide may either oxidize the methylene blue (MB) or react with H+ ions to produce the reactive OH radical, which in turn oxidizes the contaminant, as shown in Equations (2)–(5).
    CBe        +        O2     →       O2
    O2       +        MB      →    Mineral products
    O2       +         H+      →    OH
    OH      +         MB     →     Mineral products 
  • On the other hand, the VBh+ oxidizes water molecules to yield H+ and OH radicals. The H+ reacts, yielding the reactive OH radical which may oxidize the contaminants, as shown in Equation (6).
    VBh+    +         H2O    →    H+ + OH
The reactions may occur successively or in parallel.
The literature mechanism, summarized in Equations (1)–(6), explains the present results as follows:
In Equation (1), the catalyst excitation is necessary. It depends on the energy band gap value. As MnTiO3 has narrower band gap than ZnTiO3, it demands a longer wavelength radiation. The solar simulated lamp emits more radiation at wavelengths of 400 nm and longer. Therefore, MnTiO3 is more sensitive to solar simulated radiation. This explains why MnTiO3 is a more efficient catalyst than ZnTiO3.
Complete mineralization of methylene blue is justified by the oxidizing power of the proposed superoxide in the literature and the OH radical. The production of nitrate ions further confirms methylene blue mineralization, as discussed above. This is because methylene blue involves N atoms, as described in the control and confirmation results shown in Table 1. In the case of complete mineralization, the N atoms should be oxidized to nitrate ions, NO3, with the N atom having a 5+ charge.
The mechanism explains why MB photodegradation is faster at pH 8.5, as discussed above in the PZC discussion. The proposed reactive species are short lived. Therefore, the MB molecules must be close to, or even adsorbed, at the catalyst surface. At the optimal pH, adsorption of MB on catalyst is more likely. The molecules are in closer proximity with the reactive species.
The mechanism also explains why the reaction is faster with an increased MB concentration. With higher concentrations, the probability of interaction with the reactive species is higher, which speeds up the reaction. However, the rate orders with respect to MB are less than 1. Therefore, its relation with the concentration is not linear. This is due to ability of the MB molecules to screen the catalyst sites away from the incident photons.
The rate dependence on the catalyst powder loading is also explained. With higher loading, there is a higher probability of producing the reactive species and a higher probability of MB interacting with the reactive species. However, at a higher powder loading, the particles at the reaction mixture surface may screen the bulk catalyst sites. Therefore, not all catalyst particles are involved in catalysis. This means that the order of the reaction with respect to catalyst loading should be less than 1.
Alternatively, in film catalyst systems, the screening is avoided, especially in thin films like the ones used here. This explains the high film catalyst efficiency compared to their powder counterparts.
Collectively, the results indicate the potential value of both prepared perovskite mixture materials. The high film catalyst activity in the batch reaction and in the continuous flow reaction is noteworthy. Therefore, a pilot plant-scale study is needed to assess the feasibility of the described processes for commercial-scale water purification processes. Based on reviewer suggestions, efforts to produce perovskites of high phase purity are necessary. This will allow for the study of the catalytic efficiency for each phase separately.

4. Conclusions

Two types of perovskite powders, ZnTiO3 and MnTiO3, involving mixed phases, were prepared, characterized and examined as photocatalysts for methylene blue removal from water using solar simulated radiation. Complete mineralization of the contaminant was confirmed by the loss of the stable phenyl group and the production of nitrate ions in the treated water. Both catalysts showed high efficiency, with MnTiO3 having the upper edge due to its narrower band gap. The values of turnover frequency and quantum yield for both catalysts were studied. The catalysts functioned under various pH values, but more profoundly at 8.5 based on the point of zero charge. Films prepared from the perovskite powders exhibited much higher photocatalytic efficiency in batch reaction systems than their powder counterparts, as evidenced from values of turnover frequency and quantum yield values. Continuous flow experiments also showed the feasibility of both perovskite films for water purification through photodegradation of organic contaminants in future commercial processes. Both catalysts readily functioned under various contaminant concentrations, which showed their abilities to yield contaminant-free water. Compared to earlier studies, the results show the value of replacing powder from catalyst systems with film catalysts to facilitate catalyst recovery and reuse with no efficiency loss. The results also confirm the usefulness of film catalysts for using non-costly solar-driven processes in water purification from organic contaminants, with methylene blue being a model contaminant.

Supplementary Materials

The following supporting information can be downloaded at: https://www.mdpi.com/article/10.3390/pr11082378/s1, Figure S1: A widely known spectrum for tungsten-halogen lamp. A small UV fraction at 400 nm and shorter is observed; Figure S2: Langmuir plots constructed for acetic acid adsorption onto perovskite powders a) ZnTiO3 and b) MnTiO3 at room temperature; Figure S3: Plots of ln(initial rate) vs. ln(methylene blue initial concentration) using various catalyst systems. (a) ZnTiO3 powder (0.1 g), (b) MnTiO3 powder (0.1 g), (c) ZnTiO3 film (2.3 × 10⁻³ g) and (d) MnTiO3 film (1.8 × 10⁻³ g); Figure S4: Effect of catalyst powder loading. Plots of ln(initial rate) vs. ln(Catalyst loading) for powder perovskites are shown for: (a) ZnTiO3 and (b) MnTiO3. Values of rate or; Figure S5: Perovskite catalyst efficiency after recovery and reuse in methylene blue photodegradation reaction. (a) ZnTiO3 powder (initially 0.1 g), (b) ZnTiO3 film, (c) MnTiO3 powder (initially 0.1 g) and (d) MnTiO3 film. Solid lines for fresh catalyst, and dashed lines for recovered catalyst.

Author Contributions

Conceptualization: H.S.H., H.N. and T.Z.; film catalysis and continuous flow ideas: M.H.S.H.; methodology design: H.N. and M.H.S.H.; investigation and measurements: T.Z. and H.N.; characterization, T.W.K., J.S., T.Z. and H.N.; writing—review and editing, H.S.H. and H.N.; supervision, S.J. and H.S.H.; project administration, H.S.H.; verification, S.J. All authors have read and agreed to the published version of the manuscript.

Funding

No specific funding is available. TWK acknowledges financial support from “the Technology Development Program to Solve Climate Changes of the National Research Foundation of Korea” (NRF), funded by The Ministry of Science, ICT and Future Planning (NRF-2019M1A2A2065618).

Data Availability Statement

Data will be available upon request.

Acknowledgments

The majority of the results are based on T.Z.’s Ph.D. thesis (under preparation) supervised by S.J. and H.S.H. Help from technical staff at An-Najah National University is acknowledged.

Conflicts of Interest

The authors declare no conflict of interest.

References

  1. Warren-Vega, W.M.; Campos-Rodríguez, A.; Zárate-Guzmán, A.I.; Romero-Cano, L.A. A current review of water pollutants in american continent: Trends and perspectives in detection, health risks, and treatment technologies. Int. J. Environ. Res. Public Health 2023, 20, 4499. [Google Scholar] [CrossRef] [PubMed]
  2. Tahir, H.; Saad, M.; Attala, O.A.; El-Saoud, W.A.; Attia, K.A.; Jabeen, S.; Zeb, J. Sustainable Synthesis of Iron–Zinc Nanocomposites by Azadirachta indica Leaves Extract for RSM-Optimized Sono-Adsorptive Removal of Crystal Violet Dye. Materials 2023, 16, 1023. [Google Scholar] [CrossRef]
  3. Saad, M.; Tahir, H.; Mustafa, S.; Attala, O.A.; El-Saoud, W.A.; Attia, K.A.; Filfilan, W.M.; Zeb, J. Polyvinyl Alcohol Assisted Iron–Zinc Nanocomposite for Enhanced Optimized Rapid Removal of Malachite Green Dye. Nanomaterials 2023, 13, 1747. [Google Scholar] [CrossRef] [PubMed]
  4. Zwiener, C.; Richardson, S.D.; De Marini, D.M.; Grummt, T.; Glauner, T.; Frimmel, F.H. Drowning in disinfection byproducts? Assessing swimming pool water. Environ. Sci. Technol. 2007, 41, 363–372. [Google Scholar] [CrossRef]
  5. Sadegh, H.; Ali, G.A. Potential applications of nanomaterials in wastewater treatment: Nanoadsorbents performance. In Research Anthology on Synthesis, Characterization, and Applications of Nanomaterials; IGI Global: Pennsylvania, PA, USA, 2021; pp. 1230–1240. [Google Scholar]
  6. Kaur, K.; Badru, R.; Singh, P.P.; Kaushal, S. Photodegradation of organic pollutants using heterojunctions: A review. J. Environ. Chem. Eng. 2020, 8, 103666. [Google Scholar]
  7. El Sharkawy, H.M.; Shawky, A.M.; Elshypany, R.; Selim, H. Efficient photocatalytic degradation of organic pollutants over TiO2 nanoparticles modified with nitrogen and MoS2 under visible light irradiation. Sci. Rep. 2023, 13, 8845. [Google Scholar] [CrossRef]
  8. Zyoud, A.H.; Zaatar, N.; Saadeddin, I.; Ali, C.; Park, D.; Campet, G.; Hilal, H.S. CdS-sensitized TiO2 in phenazopyridine photo-degradation: Catalyst efficiency, stability and feasibility assessment. J. Hazard. Mater. 2010, 173, 318–325. [Google Scholar] [CrossRef] [PubMed]
  9. Portier, J.; Hilal, H.; Saadeddin, I.; Hwang, S.; Subramanian, M.; Campet, G. Thermodynamic correlations and band gap calculations in metal oxides. Prog. Solid State Chem. 2004, 32, 207–217. [Google Scholar] [CrossRef]
  10. Elhadidy, M.; Abdel-Nabi, D.; Kruss, P. Ultraviolet solar radiation at Dhahran, Saudi Arabia. Sol. Energy 1990, 44, 315–319. [Google Scholar] [CrossRef]
  11. Rodrigues, A.S.; Silveira, J.E.; Carbajo, J.; Zazo, J.A.; Casas, J.A.; Fernandes, A.; Pacheco, M.J.; Ciríaco, L.; Lopes, A. Diclofenac photodegradation with the Perovskites BaFeyTi1−yO3 as catalysts. Environ. Sci. Pollut. Res. 2021, 28, 23822–23832. [Google Scholar] [CrossRef]
  12. Andronic, L.; Duta, A. The influence of TiO2 powder and film on the photodegradation of methyl orange. Mater. Chem. Phys. 2008, 112, 1078–1082. [Google Scholar] [CrossRef]
  13. Dewia, H.A.; Fangben Mengb, B.S.; Guoa, C.; Norlingc, B.; Chenb, X.; Lima, S. Investigation on Electron Transfer from Isolated Spinach Thylakoids to Indium Tin Oxide. RSC Adv. 2014, 4, 48815–48820. [Google Scholar] [CrossRef]
  14. Nkwachukwu, O.V.; Arotiba, O.A. Perovskite oxide–based materials for photocatalytic and photoelectrocatalytic treatment of water. Front. Chem. 2021, 9, 634630. [Google Scholar] [CrossRef]
  15. Faraj, Y.; Xie, R. Perovskite-Based Nanomaterials and Nanocomposites for Photocatalytic Decontamination of Water; IntechOpen: London, UK, 2022. [Google Scholar] [CrossRef]
  16. Brahmi, C.; Benltifa, M.; Vaulot, C.; Michelin, L.; Dumur, F.; Airoudj, A.; Morlet-Savary, F.; Raveau, B.; Bousselmi, L.; Lalevée, J. New hybrid perovskites/polymer composites for the photodegradation of organic dyes. Eur. Polym. J. 2021, 157, 110641. [Google Scholar] [CrossRef]
  17. Singh, H.; Rajput, J.K. Novel perovskite nanocatalyst (BiFeO3) for the photodegradation of rhodamine B/tartrazine and swift reduction of nitro compounds. J. Iran. Chem. Soc. 2019, 16, 2409–2432. [Google Scholar] [CrossRef]
  18. Chen, W.-Y.; Wang, C.-P.; Chen, P.-C.; Lin, K.-Y.A.; Ghosh, S.; Huang, C.-W.; Nguyen, V.-H. Perovskite zinc titanate photocatalysts synthesized by the sol–gel method and their application in the photocatalytic degradation of emerging contaminants. Catalysts 2021, 11, 854. [Google Scholar] [CrossRef]
  19. Tavakoli-Azar, T.; Mahjoub, A.R.; Sadjadi, M.S.; Farhadyar, N.; Sadr, M.H. Improving the photocatalytic performance of a perovskite ZnTiO3 through ZnTiO3@S nanocomposites for degradation of Crystal violet and Rhodamine B pollutants under sunlight. Inorg. Chem. Commun. 2020, 119, 108091. [Google Scholar] [CrossRef]
  20. Alkaykh, S.; Mbarek, A.; Ali-Shattle, E.E. Photocatalytic degradation of methylene blue dye in aqueous solution by MnTiO3 nanoparticles under sunlight irradiation. Heliyon 2020, 6, e03663. [Google Scholar] [CrossRef]
  21. Khan, I.; Saeed, K.; Zekker, I.; Zhang, B.; Hendi, A.H.; Ahmad, A.; Ahmad, S.; Zada, N.; Ahmad, H.; Shah, L.A. Review on methylene blue: Its properties, uses, toxicity and photodegradation. Water 2022, 14, 242. [Google Scholar] [CrossRef]
  22. Bharti, V.; Vikrant, K.; Goswami, M.; Tiwari, H.; Sonwani, R.K.; Lee, J.; Tsang, D.C.; Kim, K.-H.; Saeed, M.; Kumar, S. Biodegradation of methylene blue dye in a batch and continuous mode using biochar as packing media. Environ. Res. 2019, 171, 356–364. [Google Scholar] [CrossRef]
  23. Xu, J.Z.; Dai, L.; Wu, B.; Ding, T.; Zhu, J.J.; Lin, H.; Chen, H.L.; Shen, C.Y.; Jiang, Y. Determination of methylene blue residues in aquatic products by liquid chromatography-tandem mass spectrometry. J. Sep. Sci. 2009, 32, 4193–4199. [Google Scholar] [CrossRef]
  24. Dunicz, B.L. Surface area of activated charcoal by Langmuir adsorption isotherm. J. Chem. Educ. 1961, 38, 357. [Google Scholar] [CrossRef]
  25. Rheima, A.M.; Aboud, N.; Jasim, B.E.; Ismail, A.H.; Abbas, Z.S. Synthesis and structural characterization of ZnTiO3 nanoparticles via modification sol-gel prosses for assessment of their antimicrobial activity. Int. J. Pharm. Res. 2021, 13, 342–347. [Google Scholar]
  26. Frederichi, D.; Scaliante, M.H.N.O.; Bergamasco, R. Structured photocatalytic systems: Photocatalytic coatings on low-cost structures for treatment of water contaminated with micropollutants—A short review. Environ. Sci. Pollut. Res. 2021, 28, 23610–23633. [Google Scholar] [CrossRef] [PubMed]
  27. Kurra, N.; Jenjeti, R.N. Micro-electrochemical capacitors: Progress and future status. J. Energy Storage 2022, 55, 105702. [Google Scholar] [CrossRef]
  28. Chang, H.; Cho, K.-C.; Chen, T.-L.; Chu, K.-H.; Jiang, L.-J. Preparation and characterization of anthocyanin dye and counter electrode thin film with carbon nanotubes for dye-sensitized solar cells. Mater. Trans. 2011, 52, 1977–1982. [Google Scholar] [CrossRef] [Green Version]
  29. Cenens, J.; Schoonheydt, R. Visible spectroscopy of methylene blue on hectorite, laponite B, and barasym in aqueous suspension. Clays Clay Miner. 1988, 36, 214–224. [Google Scholar] [CrossRef]
  30. Nassar, H.; Zyoud, A.; Helal, H.H.; Ghannam, H.; Kim, T.W.; Helal, M.H.; Hilal, H.S. Fluorine tin oxide-supported copper nanofilms as effective and selective de-nitration electrocatalysts. J. Electroanal. Chem. 2022, 911, 116249. [Google Scholar] [CrossRef]
  31. Arin, J.; Thongtem, S.; Phuruangrat, A.; Thongtem, T. Characterization of ZnO–TiO2 and zinc titanate nanoparticles synthesized by hydrothermal process. Res. Chem. Intermed. 2017, 43, 3183–3195. [Google Scholar] [CrossRef]
  32. Enhessari, M.; Parviz, A.; Karamali, E.; Ozaee, K. Synthesis, characterisation and optical properties of MnTiO3 nanopowders. J. Exp. Nanosci. 2012, 7, 327–335. [Google Scholar] [CrossRef]
  33. Acosta-Silva, Y.; Castanedo-Perez, R.; Torres-Delgado, G.; Méndez-López, A.; Zelaya-Angel, O. Analysis of the photocatalytic activity of CdS+ ZnTiO3 nanocomposite films prepared by sputtering process. Superlattices Microstruct. 2016, 100, 148–157. [Google Scholar] [CrossRef]
  34. Zhang, P.; Shao, C.; Zhang, M.; Guo, Z.; Mu, J.; Zhang, Z.; Zhang, X.; Liu, Y. Bi2MoO6 ultrathin nanosheets on ZnTiO3 nanofibers: A 3D open hierarchical heterostructures synergistic system with enhanced visible-light-driven photocatalytic activity. J. Hazard. Mater. 2012, 217, 422–428. [Google Scholar] [CrossRef]
  35. Reddy, K.H.; Martha, S.; Parida, K.M. Fabrication of BiOI/n-ZnTiO3 heterojunction for degradation of rhodamine under under 6G visible light irradiation. Inorg. Chem. 2013, 52, 6390r401. [Google Scholar] [CrossRef]
  36. Gao, Z.; Qu, X. Construction of ZnTiO3/Bi4NbO8Cl heterojunction with enhanced photocatalytic performance. Nanoscale Res. Lett. 2020, 15, 64. [Google Scholar] [CrossRef] [PubMed] [Green Version]
  37. Cai, Y.; Ye, Y.; Tian, Z.; Liu, J.; Liu, Y.; Liang, C. In situ growth of lamellar ZnTiO3 nanosheets on TiO2 tubular array with enhanced photocatalytic activity. Phys. Chem. Chem. Phys. 2013, 15, 20203–20209. [Google Scholar] [CrossRef]
  38. Raveendra, R.; Prashanth, P.; Hari Krishna, R.; Bhagya, N.; Sathyanarayani, S.; Na-gabhushana, B. Carbothermal synthesis and photoluminescence characteristics of pure undoped ZnTiO3 nanocrystals. J. Adv. Phys. Sci 2016, 6, 4–7. [Google Scholar]
  39. Kanhere, P.; Chen, Z. A review on visible light active perovskite-based photocatalysts. Molecules 2014, 19, 19995–20022. [Google Scholar] [CrossRef] [PubMed] [Green Version]
  40. Wang, C.-L.; Hwang, W.-S.; Chang, K.-M.; Ko, H.-H.; Hsi, C.-S.; Huang, H.-H.; Wang, M.-C. Formation and morphology of Zn2Ti3O8 powders using hydrothermal process without dispersant agent or mineralizer. Int. J. Mol. Sci. 2011, 12, 935–945. [Google Scholar] [CrossRef] [Green Version]
  41. John, A.K.; Palaty, S.; Sharma, S.S. Greener approach towards the synthesis of titanium dioxide nanostructures with exposed {001} facets for enhanced visible light photodegradation of organic pollutants. J. Mater. Sci. Mater. Electron. 2020, 31, 20868–20882. [Google Scholar] [CrossRef]
  42. Kitchamsetti, N.; Didwal, P.N.; Mulani, S.R.; Patil, M.S.; Devan, R.S. Photocatalytic activity of MnTiO3 perovskite nanodiscs for the removal of organic pollutants. Heliyon 2021, 7, e07297. [Google Scholar] [CrossRef]
  43. Alwany, A.B.; Youssef, G.; Samir, O.; Algradee, M.A.; Yahya, N.A.A.; Swillam, M.A.; Humaidi, S.; Abd-Shukor, R. Annealing temperature effects on the size and band gap of ZnS quantum dots fabricated by co-precipitation technique without capping agent. Sci. Rep. 2023, 13, 10314. [Google Scholar] [CrossRef] [PubMed]
  44. Zyoud, A.; Nassar, I.; Salman, M.; Iwissat, S.; Zyoud, S.; Helal, M.; Kim, T.; Rahil, M.; Abuamsha, R.; Shahin, N. Nano-ZnO film photocatalysts in bench-scale continuous-flow mineralization of olive mill waste contaminants in water. Int. J. Environ. Sci. Technol. 2021, 19, 4379–4392. [Google Scholar] [CrossRef]
  45. Sbeah, M.; Zyoud, A.; Ishteiwi, M.; Hajjyahya, M.; Al Armouzi, N.; Qamhieh, N.; Hajamohideen, A.R.; Zyoud, S.; Helal, H.H.; Bsharat, H. Assessment of flexible pristine CdS film electrodes in photoelectrochemical light-to-electricity conversions. Mater. Chem. Phys. 2023, 293, 126967. [Google Scholar] [CrossRef]
  46. Tang, M.; Lu, S.; He, L.; Zhu, X.; Feng, W.; Zhang, W. Preparation, Characterization of ZnTiO3/ZnO Composite Materials and Their Photocatalytic Performance. Nanomaterials 2022, 12, 1345. [Google Scholar] [CrossRef]
  47. Glasstone, S.; Lewis, D. Elements of Physical Chemistry, 2nd ed.; Macmilan Press Ltd.: Mumbai, India, 1983; p. 566. [Google Scholar]
  48. Richard, P.; Marilyn, K. Applied Colloid and Surface Chemistry; Wiley: New York, NY, USA, 2022; p. 51. [Google Scholar]
  49. The Agency for Toxic Substances and Disease Registry (ATDSR). Environmental Health and Medicine Education; The Agency for Toxic Substances and Disease Registry: Atlanta, GA, USA, 2018; pp. 1385–1565.
  50. Miranda, L.D.; Bellato, C.R.; Fontes, M.P.; de Almeida, M.F.; Milagres, J.L.; Minim, L.A. Preparation and evaluation of hydrotalcite-iron oxide magnetic organocomposite intercalated with surfactants for cationic methylene blue dye removal. Chem. Eng. J. 2014, 254, 88–97. [Google Scholar] [CrossRef]
  51. Jaramillo-Fierro, X.; Alvarado, H.; Montesdeoca, F.; Valarezo, E. Faujasite-Type Zeolite Obtained from Ecuadorian Clay as a Support of ZnTiO3/TiO2 NPs for Cyanide Removal in Aqueous Solutions. Int. J. Mol. Sci. 2023, 24, 9281. [Google Scholar] [CrossRef]
  52. Jaramillo-Fierro, X.; Cuenca, G.; Ramón, J. Comparative Study of the Effect of Doping ZnTiO3 with Rare Earths (La and Ce) on the Adsorption and Photodegradation of Cyanide in Aqueous Systems. Int. J. Mol. Sci. 2023, 24, 3780. [Google Scholar] [CrossRef]
  53. Bae, K.-N.; Noh, S.I.; Ahn, H.-J.; Seong, T.-Y. Effect of MnTiO3 surface treatment on the performance of dye-sensitized solar cells. Mater. Lett. 2013, 96, 67–70. [Google Scholar] [CrossRef]
  54. Zyoud, A.; Zyoud, A.H.; Zyoud, S.H.; Nassar, H.; Zyoud, S.H.; Qamhieh, N.; Hajamohideen, A.; Hilal, H.S. Photocatalytic degradation of aqueous methylene blue using ca-alginate supported ZnO nanoparticles: Point of zero charge role in adsorption and photodegradation. Environ. Sci. Pollut. Res. 2023, 30, 68435–68449. [Google Scholar] [CrossRef]
  55. Petrovičová, B.; Dahrouch, Z.; Triolo, C.; Pantò, F.; Malara, A.; Patanè, S.; Allegrini, M.; Santangelo, S. Photocatalytic degradation of methylene blue dye by electrospun binary and ternary zinc and titanium oxide nanofibers. Appl. Sci. 2021, 11, 9720. [Google Scholar] [CrossRef]
  56. Jaramillo Fierro, X.V. Synthesis, Characterization and Theoretical Calculations of ZnTiO3 for the Adsorption and Photocatalytic Removal of Methylene Blue Dye. Ph.D. Thesis, Universitat Rovira i Virgili, Tarragona, Spain, 2022. Available online: http://hdl.handle.net/10803/674398 (accessed on 4 August 2023).
  57. The pH of Water: What to Know. Available online: https://www.medicalnewstoday.com/articles/327185 (accessed on 7 July 2023).
  58. Utami, F.; Rahman, D.; Margareta, D.; Rahmayanti, H.; Munir, R.; Sustini, E.; Abdullah, M. TiO2 photocatalytic degradation of methylene blue using simple spray method. In Proceedings of the IOP Conference Series: Materials Science and Engineering, Kazimierz Dolny, Poland, 21–23 November 2019; IOP Publishing: Bristol, UK, 2019; Volume 599, p. 012026. [Google Scholar] [CrossRef]
  59. Komaraiah, D.; Madhukar, P.; Vijayakumar, Y.; Reddy, M.R.; Sayanna, R. Photocatalytic degradation study of methylene blue by brookite TiO2 thin film under visible light irradiation. Mater. Today Proc. 2016, 3, 3770–3778. [Google Scholar] [CrossRef]
  60. Yogi, C.; Kojima, K.; Wada, N.; Tokumoto, H.; Takai, T.; Mizoguchi, T.; Tamiaki, H. Photocatalytic degradation of methylene blue by TiO2 film and Au particles-TiO2 composite film. Thin Solid Film. 2008, 516, 5881–5884. [Google Scholar] [CrossRef]
  61. Wang, X.-Q.; Han, S.-F.; Zhang, Q.-W.; Zhang, N.; Zhao, D.-D. Photocatalytic oxidation degradation mechanism study of methylene blue dye waste water with GR/iTO2. MATEC Web Conf. 2018, 238, 03006. [Google Scholar] [CrossRef] [Green Version]
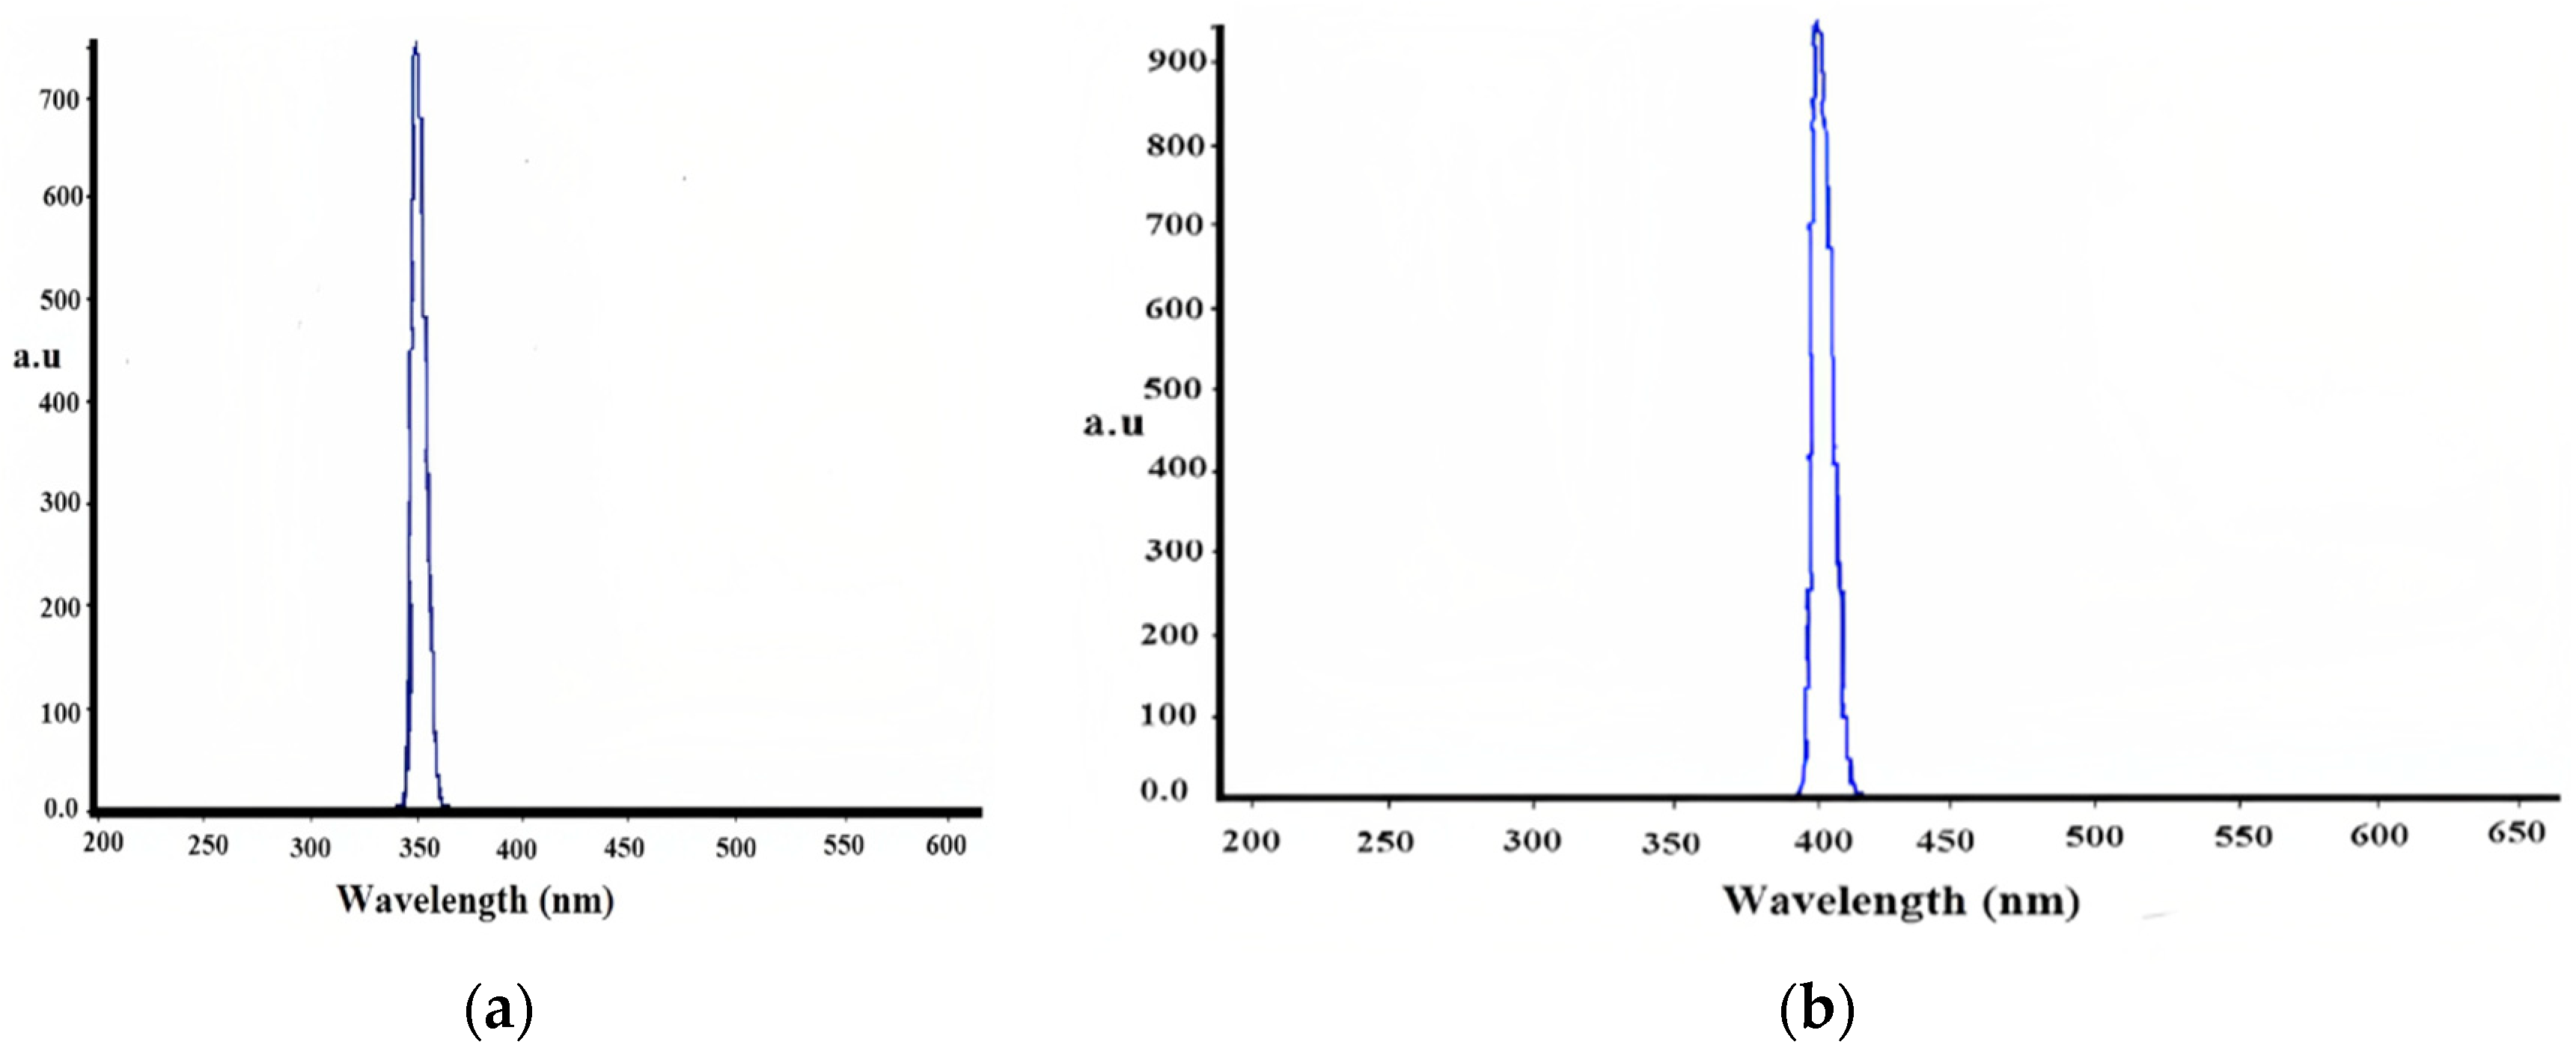
Figure 1. Photoluminescence emission spectra for (a) ZnTiO3 and (b) MnTiO3 suspensions.
Processes 11 02378 g001
Figure 2. Solid state electronic absorption spectra measured for perovskites. (a) ZnTiO3, (b) MnTiO3. The spectra were measured as suspensions in water against a water baseline.
Processes 11 02378 g002
Figure 3. SEM micrographs measured for perovskites in their various forms. Powder forms of (a) ZnTiO3 and (b) MnTiO3. Film forms of (c) ZnTiO3 and (d) MnTiO3. Cross-sectional films of (e) ZnTiO3 and (f) MnTiO3.
Processes 11 02378 g003aProcesses 11 02378 g003b
Figure 4. Measured XRD patterns for perovskite powders (a) ZnTiO3 and (b) MnTiO3. * for perovskite reflections.
Processes 11 02378 g004
Figure 5. XPS spectra measured for the ZnTiO3 and MnTiO3 films.
Processes 11 02378 g005
Figure 6. Reaction profiles showing continued disappearance of methylene blue over time. The reactions were conducted using various forms of perovskites at room temperature and pH 8.5.
Processes 11 02378 g006
Figure 7. Effect of pH ( 3.5, 7, 8.5, and 11) on the methylene blue photodegradation reaction using various perovskite forms. (a) ZnTiO3 powder (0.1 g), (b) MnTiO3 powder (0.1 g), (c) ZnTiO3 film (2.3 × 10⁻³ g) and (d) MnTiO3 film (1.8 × 10⁻³ g). All reactions were conducted at room temperature.
Processes 11 02378 g007aProcesses 11 02378 g007b
Figure 8. Schematic showing changes in methylene blue structures associated with solution pH. Reproduced with permission from Elsevier [50].
Processes 11 02378 g008
Figure 9. Reaction profiles with time for methylene blue degradation using various initial contaminant concentrations for various catalysts. (a) ZnTiO3 powder, (b) MnTiO3 powder, (c) ZnTiO3 film and (d) MnTiO3 film. All reactions were conducted at room temperature and pH 7.
Processes 11 02378 g009
Figure 10. Effect of powder catalyst loading on methylene blue photodegradation reactions. (a) ZnTiO3 and (b) MnTiO3. Reactions performed at room temperature and pH 7. ( 0.05 gm, 0.1 gm, and 0.15 gm and 0.2 gm).
Processes 11 02378 g010
Figure 11. Effect of perovskite catalyst form on methylene blue photodegradation (a) for powder forms (0.1 g each catalyst) and (b) for film forms ZnTiO3 (2.4 × 10⁻³ g and MnTiO3 (1.8 × 10⁻³ g). Reactions were performed at room temperature and pH 7. ZnTiO3 and MnTiO3.
Processes 11 02378 g011
Figure 12. Comparison between continuous flow and batch experiments for methylene blue photodegradation using the film perovskites (a) ZnTiO3 and (b) MnTiO3.
Processes 11 02378 g012
Table 1. Time needed for complete loss of methylene blue under photocatalytic experiments. Values of measured nitrate ion concentrations (ppm) are shown. Reactions performed using 100 mL of contaminated solutions of 40 ppm concentration at room temperature and pH 8.5.
PerovskiteTime (h)Measured NO3 Ion (ppm) *
ZnTiO3 powder (0.1 g)53.32
MnTiO3 powder (0.1 g)3.54.34
ZnTiO3 film (monolayer, 2.3 × 10⁻³ g)4.53.40
MnTiO3 film (monolayer, 1.8 × 10⁻³ g)34.50
* Resulting from oxidation of N atoms during mineralization of methylene blue.
Table 2. Effect of methylene blue concentration on photodegradation reactions and catalyst efficiency. (a) Catalyst powder and (b) catalyst film. Reactions were conducted at room temperature and pH 7.
(a)
CatalystMB (ppm)Degradation%Conc. Loss
(ppm)
T.N. (×10−6)T.F. (×108)Q.Y.(×1027)
ZnTiO3 powder (0.1 g)510050.781.300.84
10100101.562.601.67
2055111.722.871.84
40443172.654.422.84
6040243.746.234.00
8036294.457.424.76
MnTiO3 powder
(0.1 g)
510050.781.300.84
10100101.562.601.67
2075152.343.902.50
4066274.136.884.42
6057345.308.835.67
8049396.0810.136.50
(b)
CatalystMB
(ppm)
Degradation%Conc. Loss
(ppm)
T.N.(×103) *T.F.(×105) **Q.Y. (×1025) ***
ZnTiO3 (2.3 × 10⁻³ g)510050.340.573.64
10100100.681.137.28
2063130.851.429.10
4050201.362.2714.55
6047281.903.1720.33
8039322.143.5728.90
MnTiO3 (1.8 × 10⁻³ g)10050.430.724.604.60
510050.430.724.60
10100100.871.459.31
2083171.432.3815.30
4078312.694.4828.78
6065393.385.6436.17
8054433.736.2140.00
* T.N. = molecules contaminant lost/g catalyst; ** T.F. = T.N./time (min.); *** Q.Y. = T.N./incident UV photons.
Disclaimer/Publisher’s Note: The statements, opinions and data contained in all publications are solely those of the individual author(s) and contributor(s) and not of MDPI and/or the editor(s). MDPI and/or the editor(s) disclaim responsibility for any injury to people or property resulting from any ideas, methods, instructions or products referred to in the content.